Spanish American 2 or more Vehicles in Household
COMPARE
Spanish American
Select to Compare
2 or more Vehicles in Household
Spanish American 2 or more Vehicles in Household
58.9%
2+ VEHICLES AVAILABLE
99.8/ 100
METRIC RATING
59th/ 347
METRIC RANK
Spanish American 2 or more Vehicles in Household Correlation Chart
The statistical analysis conducted on geographies consisting of 103,168,567 people shows a moderate positive correlation between the proportion of Spanish Americans and percentage of households with 2 or more vehicles available in the United States with a correlation coefficient (R) of 0.400 and weighted average of 58.9%. On average, for every 1% (one percent) increase in Spanish Americans within a typical geography, there is an increase of 0.43% in percentage of households with 2 or more vehicles available.
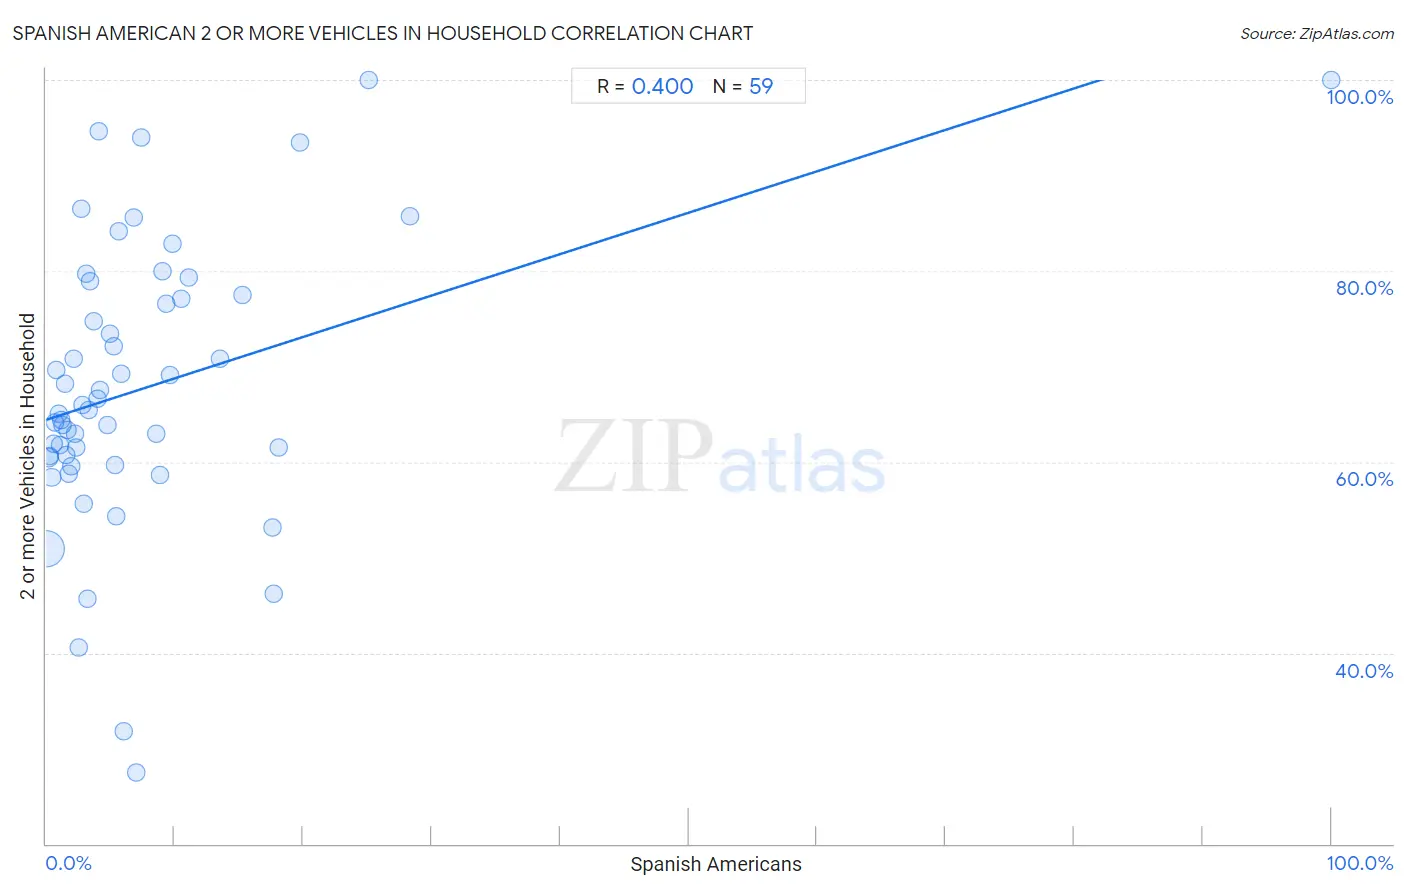
It is essential to understand that the correlation between the percentage of Spanish Americans and percentage of households with 2 or more vehicles available does not imply a direct cause-and-effect relationship. It remains uncertain whether the presence of Spanish Americans influences an upward or downward trend in the level of percentage of households with 2 or more vehicles available within an area, or if Spanish Americans simply ended up residing in those areas with higher or lower levels of percentage of households with 2 or more vehicles available due to other factors.
Demographics Similar to Spanish Americans by 2 or more Vehicles in Household
In terms of 2 or more vehicles in household, the demographic groups most similar to Spanish Americans are Immigrants from Scotland (58.9%, a difference of 0.020%), French Canadian (58.9%, a difference of 0.030%), Osage (58.8%, a difference of 0.16%), Nonimmigrants (58.8%, a difference of 0.19%), and Chickasaw (59.0%, a difference of 0.21%).
| Demographics | Rating | Rank | 2 or more Vehicles in Household |
| Immigrants from Laos | 99.9 /100 | #52 | Exceptional 59.2% |
| Celtics | 99.9 /100 | #53 | Exceptional 59.2% |
| Bhutanese | 99.9 /100 | #54 | Exceptional 59.1% |
| Luxembourgers | 99.9 /100 | #55 | Exceptional 59.1% |
| Chickasaw | 99.9 /100 | #56 | Exceptional 59.0% |
| Afghans | 99.9 /100 | #57 | Exceptional 59.0% |
| Immigrants from Scotland | 99.8 /100 | #58 | Exceptional 58.9% |
| Spanish Americans | 99.8 /100 | #59 | Exceptional 58.9% |
| French Canadians | 99.8 /100 | #60 | Exceptional 58.9% |
| Osage | 99.8 /100 | #61 | Exceptional 58.8% |
| Nonimmigrants | 99.8 /100 | #62 | Exceptional 58.8% |
| Mexican American Indians | 99.8 /100 | #63 | Exceptional 58.7% |
| Portuguese | 99.7 /100 | #64 | Exceptional 58.6% |
| Immigrants from Central America | 99.7 /100 | #65 | Exceptional 58.6% |
| Croatians | 99.7 /100 | #66 | Exceptional 58.6% |
Spanish American 2 or more Vehicles in Household Correlation Summary
| Measurement | Spanish American Data | 2 or more Vehicles in Household Data |
| Minimum | 0.023% | 27.4% |
| Maximum | 100.0% | 100.0% |
| Range | 100.0% | 72.6% |
| Mean | 7.8% | 67.8% |
| Median | 4.0% | 65.5% |
| Interquartile 25% (IQ1) | 1.8% | 60.5% |
| Interquartile 75% (IQ3) | 9.1% | 77.5% |
| Interquartile Range (IQR) | 7.3% | 17.0% |
| Standard Deviation (Sample) | 13.7% | 14.9% |
| Standard Deviation (Population) | 13.6% | 14.8% |
Correlation Details
| Spanish American Percentile | Sample Size | 2 or more Vehicles in Household |
[ 0.0% - 0.5% ] 0.023% | 92,626,671 | 50.8% |
[ 0.0% - 0.5% ] 0.17% | 5,518,927 | 60.5% |
[ 0.0% - 0.5% ] 0.31% | 1,685,599 | 60.6% |
[ 0.0% - 0.5% ] 0.44% | 1,672,122 | 58.4% |
[ 0.5% - 1.0% ] 0.55% | 466,216 | 62.0% |
[ 0.5% - 1.0% ] 0.68% | 294,802 | 64.2% |
[ 0.5% - 1.0% ] 0.80% | 228,370 | 69.7% |
[ 0.5% - 1.0% ] 0.95% | 73,627 | 65.1% |
[ 1.0% - 1.5% ] 1.05% | 169,772 | 61.8% |
[ 1.0% - 1.5% ] 1.21% | 110,379 | 64.4% |
[ 1.0% - 1.5% ] 1.31% | 45,172 | 63.8% |
[ 1.0% - 1.5% ] 1.43% | 63,242 | 68.2% |
[ 1.5% - 2.0% ] 1.59% | 38,705 | 60.7% |
[ 1.5% - 2.0% ] 1.69% | 11,418 | 63.3% |
[ 1.5% - 2.0% ] 1.78% | 25,218 | 58.7% |
[ 1.5% - 2.0% ] 1.94% | 2,266 | 59.5% |
[ 2.0% - 2.5% ] 2.09% | 13,673 | 70.8% |
[ 2.0% - 2.5% ] 2.21% | 16,174 | 62.9% |
[ 2.0% - 2.5% ] 2.32% | 11,056 | 61.6% |
[ 2.5% - 3.0% ] 2.58% | 9,165 | 40.6% |
[ 2.5% - 3.0% ] 2.75% | 1,019 | 86.5% |
[ 2.5% - 3.0% ] 2.82% | 8,083 | 66.0% |
[ 2.5% - 3.0% ] 2.96% | 5,571 | 55.6% |
[ 3.0% - 3.5% ] 3.11% | 7,203 | 79.7% |
[ 3.0% - 3.5% ] 3.16% | 411 | 45.7% |
[ 3.0% - 3.5% ] 3.29% | 4,136 | 65.5% |
[ 3.0% - 3.5% ] 3.44% | 6,781 | 78.9% |
[ 3.5% - 4.0% ] 3.69% | 461 | 74.8% |
[ 3.5% - 4.0% ] 3.98% | 3,818 | 66.6% |
[ 4.0% - 4.5% ] 4.05% | 4,347 | 94.6% |
[ 4.0% - 4.5% ] 4.20% | 1,953 | 67.5% |
[ 4.5% - 5.0% ] 4.73% | 2,496 | 63.9% |
[ 4.5% - 5.0% ] 4.99% | 2,344 | 73.4% |
[ 5.0% - 5.5% ] 5.21% | 2,398 | 72.1% |
[ 5.0% - 5.5% ] 5.33% | 1,501 | 59.7% |
[ 5.0% - 5.5% ] 5.42% | 4,224 | 54.3% |
[ 5.5% - 6.0% ] 5.65% | 2,955 | 84.2% |
[ 5.5% - 6.0% ] 5.86% | 5,156 | 69.2% |
[ 6.0% - 6.5% ] 6.08% | 971 | 31.8% |
[ 6.5% - 7.0% ] 6.84% | 3,217 | 85.7% |
[ 6.5% - 7.0% ] 6.98% | 516 | 27.4% |
[ 7.0% - 7.5% ] 7.39% | 1,381 | 94.0% |
[ 8.5% - 9.0% ] 8.53% | 1,055 | 62.9% |
[ 8.5% - 9.0% ] 8.83% | 634 | 58.6% |
[ 9.0% - 9.5% ] 9.09% | 2,806 | 80.0% |
[ 9.0% - 9.5% ] 9.33% | 2,445 | 76.5% |
[ 9.5% - 10.0% ] 9.65% | 228 | 69.1% |
[ 9.5% - 10.0% ] 9.83% | 356 | 82.9% |
[ 10.0% - 10.5% ] 10.46% | 2,179 | 77.1% |
[ 11.0% - 11.5% ] 11.06% | 235 | 79.3% |
[ 13.5% - 14.0% ] 13.52% | 281 | 70.8% |
[ 15.0% - 15.5% ] 15.23% | 1,504 | 77.5% |
[ 17.5% - 18.0% ] 17.56% | 427 | 53.1% |
[ 17.5% - 18.0% ] 17.72% | 79 | 46.2% |
[ 18.0% - 18.5% ] 18.12% | 320 | 61.5% |
[ 19.5% - 20.0% ] 19.79% | 1,950 | 93.5% |
[ 25.0% - 25.5% ] 25.12% | 211 | 100.0% |
[ 28.0% - 28.5% ] 28.35% | 127 | 85.7% |
[ 99.5% - 100.0% ] 100.00% | 214 | 100.0% |