Lumbee vs South African 2 or more Vehicles in Household
COMPARE
Lumbee
South African
2 or more Vehicles in Household
2 or more Vehicles in Household Comparison
Lumbee
South Africans
55.9%
2 OR MORE VEHICLES IN HOUSEHOLD
71.9/ 100
METRIC RATING
153rd/ 347
METRIC RANK
56.2%
2 OR MORE VEHICLES IN HOUSEHOLD
83.1/ 100
METRIC RATING
142nd/ 347
METRIC RANK
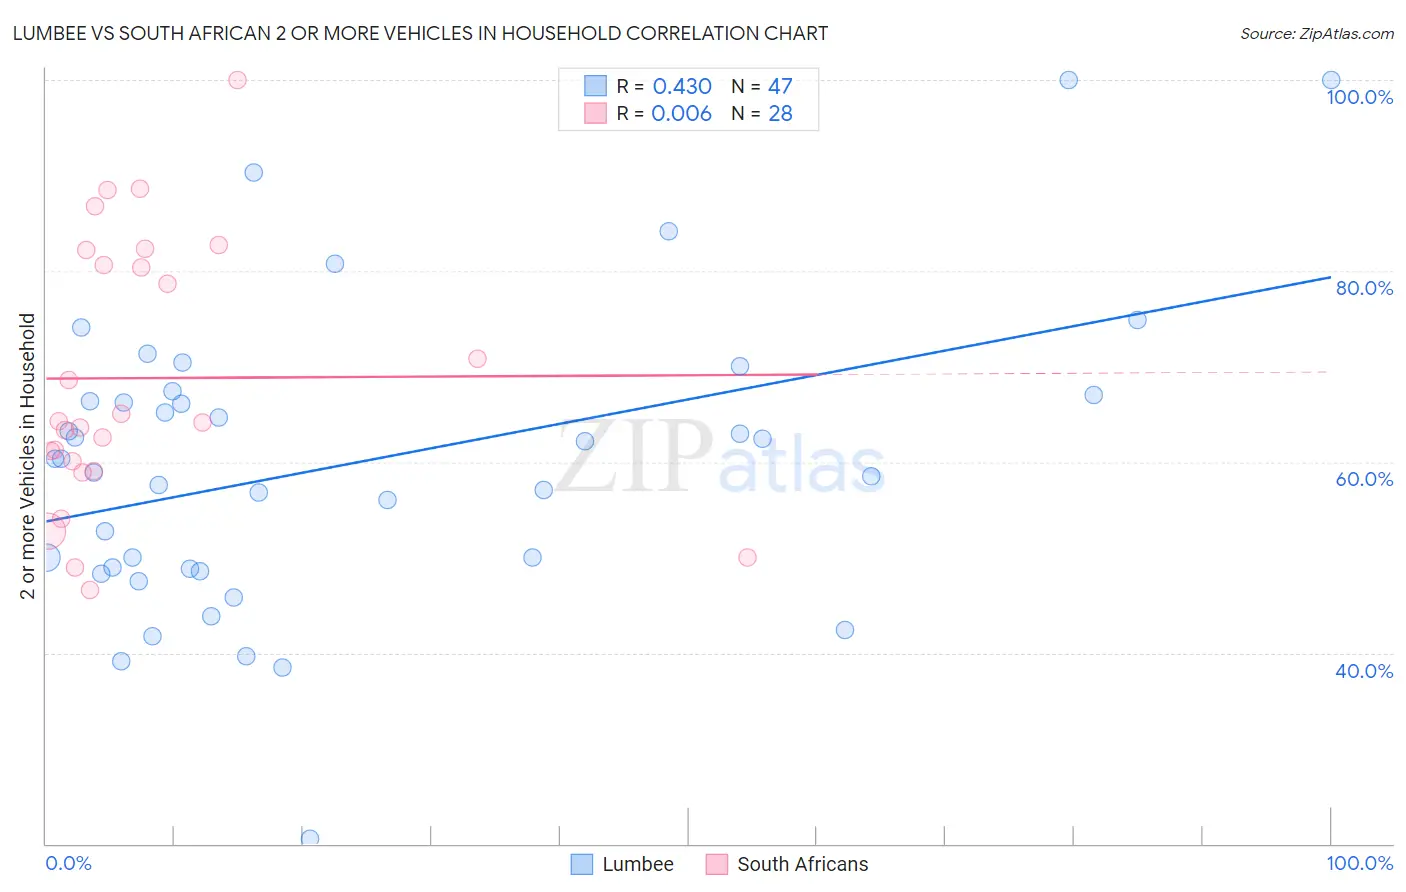
Lumbee vs South African 2 or more Vehicles in Household Correlation Chart
The statistical analysis conducted on geographies consisting of 92,265,071 people shows a moderate positive correlation between the proportion of Lumbee and percentage of households with 2 or more vehicles available in the United States with a correlation coefficient (R) of 0.430 and weighted average of 55.9%. Similarly, the statistical analysis conducted on geographies consisting of 182,559,953 people shows no correlation between the proportion of South Africans and percentage of households with 2 or more vehicles available in the United States with a correlation coefficient (R) of 0.006 and weighted average of 56.2%, a difference of 0.64%.
2 or more Vehicles in Household Correlation Summary
| Measurement | Lumbee | South African |
| Minimum | 20.5% | 46.6% |
| Maximum | 100.0% | 100.0% |
| Range | 79.5% | 53.4% |
| Mean | 59.9% | 68.8% |
| Median | 60.3% | 64.2% |
| Interquartile 25% (IQ1) | 48.9% | 59.5% |
| Interquartile 75% (IQ3) | 67.0% | 81.4% |
| Interquartile Range (IQR) | 18.1% | 21.9% |
| Standard Deviation (Sample) | 15.6% | 14.0% |
| Standard Deviation (Population) | 15.5% | 13.7% |
Demographics Similar to Lumbee and South Africans by 2 or more Vehicles in Household
In terms of 2 or more vehicles in household, the demographic groups most similar to Lumbee are Ukrainian (55.8%, a difference of 0.060%), Immigrants from Venezuela (55.8%, a difference of 0.060%), Immigrants from Lithuania (55.8%, a difference of 0.070%), Immigrants from Kuwait (55.8%, a difference of 0.080%), and Immigrants from Pakistan (56.1%, a difference of 0.33%). Similarly, the demographic groups most similar to South Africans are Latvian (56.2%, a difference of 0.040%), Immigrants from Cambodia (56.2%, a difference of 0.040%), Armenian (56.3%, a difference of 0.090%), Seminole (56.2%, a difference of 0.090%), and Immigrants from Syria (56.2%, a difference of 0.11%).
| Demographics | Rating | Rank | 2 or more Vehicles in Household |
| Cubans | 84.8 /100 | #137 | Excellent 56.3% |
| Salvadorans | 84.7 /100 | #138 | Excellent 56.3% |
| Armenians | 84.3 /100 | #139 | Excellent 56.3% |
| Latvians | 83.6 /100 | #140 | Excellent 56.2% |
| Immigrants | Cambodia | 83.6 /100 | #141 | Excellent 56.2% |
| South Africans | 83.1 /100 | #142 | Excellent 56.2% |
| Seminole | 81.7 /100 | #143 | Excellent 56.2% |
| Immigrants | Syria | 81.4 /100 | #144 | Excellent 56.2% |
| Syrians | 81.2 /100 | #145 | Excellent 56.2% |
| Venezuelans | 80.7 /100 | #146 | Excellent 56.1% |
| Serbians | 80.3 /100 | #147 | Excellent 56.1% |
| Immigrants | Moldova | 80.2 /100 | #148 | Excellent 56.1% |
| Chileans | 80.2 /100 | #149 | Excellent 56.1% |
| Nicaraguans | 79.9 /100 | #150 | Good 56.1% |
| Immigrants | Northern Europe | 78.7 /100 | #151 | Good 56.1% |
| Immigrants | Pakistan | 78.1 /100 | #152 | Good 56.1% |
| Lumbee | 71.9 /100 | #153 | Good 55.9% |
| Ukrainians | 70.8 /100 | #154 | Good 55.8% |
| Immigrants | Venezuela | 70.7 /100 | #155 | Good 55.8% |
| Immigrants | Lithuania | 70.4 /100 | #156 | Good 55.8% |
| Immigrants | Kuwait | 70.2 /100 | #157 | Good 55.8% |