Immigrants from West Indies 2 or more Vehicles in Household
COMPARE
Immigrants from West Indies
Select to Compare
2 or more Vehicles in Household
Immigrants from West Indies 2 or more Vehicles in Household
43.1%
2+ VEHICLES AVAILABLE
0.0/ 100
METRIC RATING
325th/ 347
METRIC RANK
Immigrants from West Indies 2 or more Vehicles in Household Correlation Chart
The statistical analysis conducted on geographies consisting of 72,454,628 people shows a weak positive correlation between the proportion of Immigrants from West Indies and percentage of households with 2 or more vehicles available in the United States with a correlation coefficient (R) of 0.258 and weighted average of 43.1%. On average, for every 1% (one percent) increase in Immigrants from West Indies within a typical geography, there is an increase of 0.72% in percentage of households with 2 or more vehicles available.
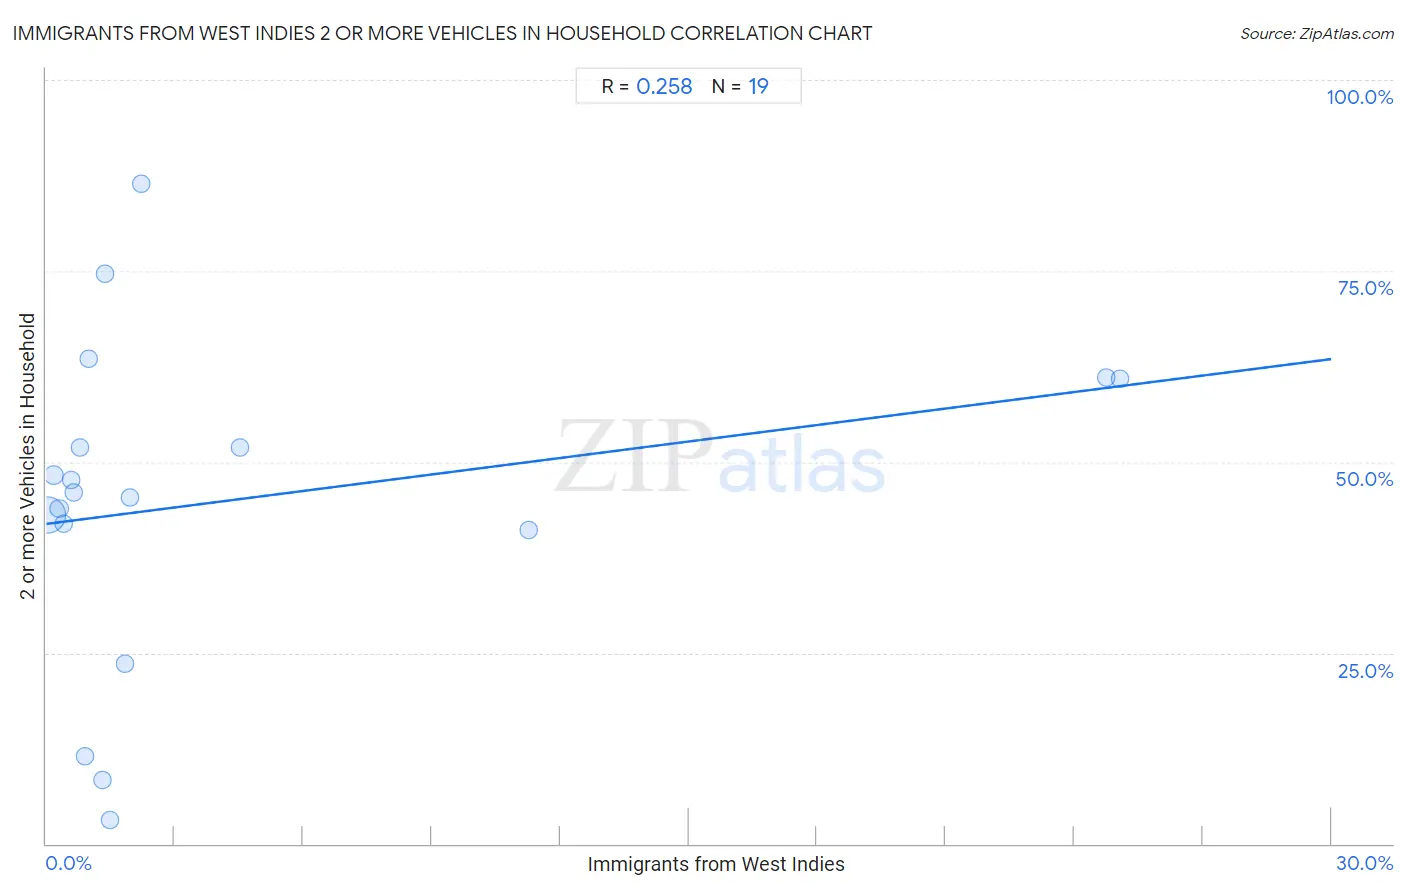
It is essential to understand that the correlation between the percentage of Immigrants from West Indies and percentage of households with 2 or more vehicles available does not imply a direct cause-and-effect relationship. It remains uncertain whether the presence of Immigrants from West Indies influences an upward or downward trend in the level of percentage of households with 2 or more vehicles available within an area, or if Immigrants from West Indies simply ended up residing in those areas with higher or lower levels of percentage of households with 2 or more vehicles available due to other factors.
Demographics Similar to Immigrants from West Indies by 2 or more Vehicles in Household
In terms of 2 or more vehicles in household, the demographic groups most similar to Immigrants from West Indies are Immigrants from Senegal (43.0%, a difference of 0.15%), Immigrants from Yemen (42.8%, a difference of 0.56%), Immigrants from Cabo Verde (43.3%, a difference of 0.57%), Inupiat (42.6%, a difference of 1.1%), and Immigrants from Caribbean (44.2%, a difference of 2.6%).
| Demographics | Rating | Rank | 2 or more Vehicles in Household |
| Immigrants from Albania | 0.0 /100 | #318 | Tragic 46.0% |
| Jamaicans | 0.0 /100 | #319 | Tragic 45.8% |
| Soviet Union | 0.0 /100 | #320 | Tragic 45.7% |
| Immigrants from Jamaica | 0.0 /100 | #321 | Tragic 44.5% |
| Senegalese | 0.0 /100 | #322 | Tragic 44.2% |
| Immigrants from Caribbean | 0.0 /100 | #323 | Tragic 44.2% |
| Immigrants from Cabo Verde | 0.0 /100 | #324 | Tragic 43.3% |
| Immigrants from West Indies | 0.0 /100 | #325 | Tragic 43.1% |
| Immigrants from Senegal | 0.0 /100 | #326 | Tragic 43.0% |
| Immigrants from Yemen | 0.0 /100 | #327 | Tragic 42.8% |
| Inupiat | 0.0 /100 | #328 | Tragic 42.6% |
| Ecuadorians | 0.0 /100 | #329 | Tragic 42.0% |
| Immigrants from Dominica | 0.0 /100 | #330 | Tragic 41.6% |
| West Indians | 0.0 /100 | #331 | Tragic 41.3% |
| Trinidadians and Tobagonians | 0.0 /100 | #332 | Tragic 40.9% |
Immigrants from West Indies 2 or more Vehicles in Household Correlation Summary
| Measurement | Immigrants from West Indies Data | 2 or more Vehicles in Household Data |
| Minimum | 0.030% | 3.0% |
| Maximum | 25.1% | 86.4% |
| Range | 25.0% | 83.3% |
| Mean | 4.2% | 44.9% |
| Median | 1.3% | 46.0% |
| Interquartile 25% (IQ1) | 0.58% | 41.1% |
| Interquartile 75% (IQ3) | 2.2% | 61.0% |
| Interquartile Range (IQR) | 1.6% | 19.8% |
| Standard Deviation (Sample) | 7.7% | 21.4% |
| Standard Deviation (Population) | 7.5% | 20.9% |
Correlation Details
| Immigrants from West Indies Percentile | Sample Size | 2 or more Vehicles in Household |
[ 0.0% - 0.5% ] 0.030% | 66,225,991 | 43.1% |
[ 0.0% - 0.5% ] 0.17% | 3,580,405 | 48.2% |
[ 0.0% - 0.5% ] 0.30% | 1,428,083 | 43.8% |
[ 0.0% - 0.5% ] 0.42% | 550,808 | 41.9% |
[ 0.5% - 1.0% ] 0.58% | 335,393 | 47.6% |
[ 0.5% - 1.0% ] 0.64% | 117,598 | 46.0% |
[ 0.5% - 1.0% ] 0.80% | 10,239 | 51.8% |
[ 0.5% - 1.0% ] 0.91% | 37,037 | 11.4% |
[ 0.5% - 1.0% ] 0.99% | 20,078 | 63.5% |
[ 1.0% - 1.5% ] 1.31% | 104,507 | 8.4% |
[ 1.0% - 1.5% ] 1.38% | 10,335 | 74.6% |
[ 1.0% - 1.5% ] 1.50% | 16,808 | 3.0% |
[ 1.5% - 2.0% ] 1.84% | 2,172 | 23.6% |
[ 1.5% - 2.0% ] 1.95% | 9,983 | 45.3% |
[ 2.0% - 2.5% ] 2.23% | 539 | 86.4% |
[ 4.5% - 5.0% ] 4.53% | 773 | 51.9% |
[ 11.0% - 11.5% ] 11.28% | 337 | 41.1% |
[ 24.5% - 25.0% ] 24.75% | 1,782 | 61.0% |
[ 25.0% - 25.5% ] 25.06% | 1,760 | 61.0% |