Lumbee vs Immigrants from Jamaica 2 or more Vehicles in Household
COMPARE
Lumbee
Immigrants from Jamaica
2 or more Vehicles in Household
2 or more Vehicles in Household Comparison
Lumbee
Immigrants from Jamaica
55.9%
2 OR MORE VEHICLES IN HOUSEHOLD
71.9/ 100
METRIC RATING
153rd/ 347
METRIC RANK
44.5%
2 OR MORE VEHICLES IN HOUSEHOLD
0.0/ 100
METRIC RATING
321st/ 347
METRIC RANK
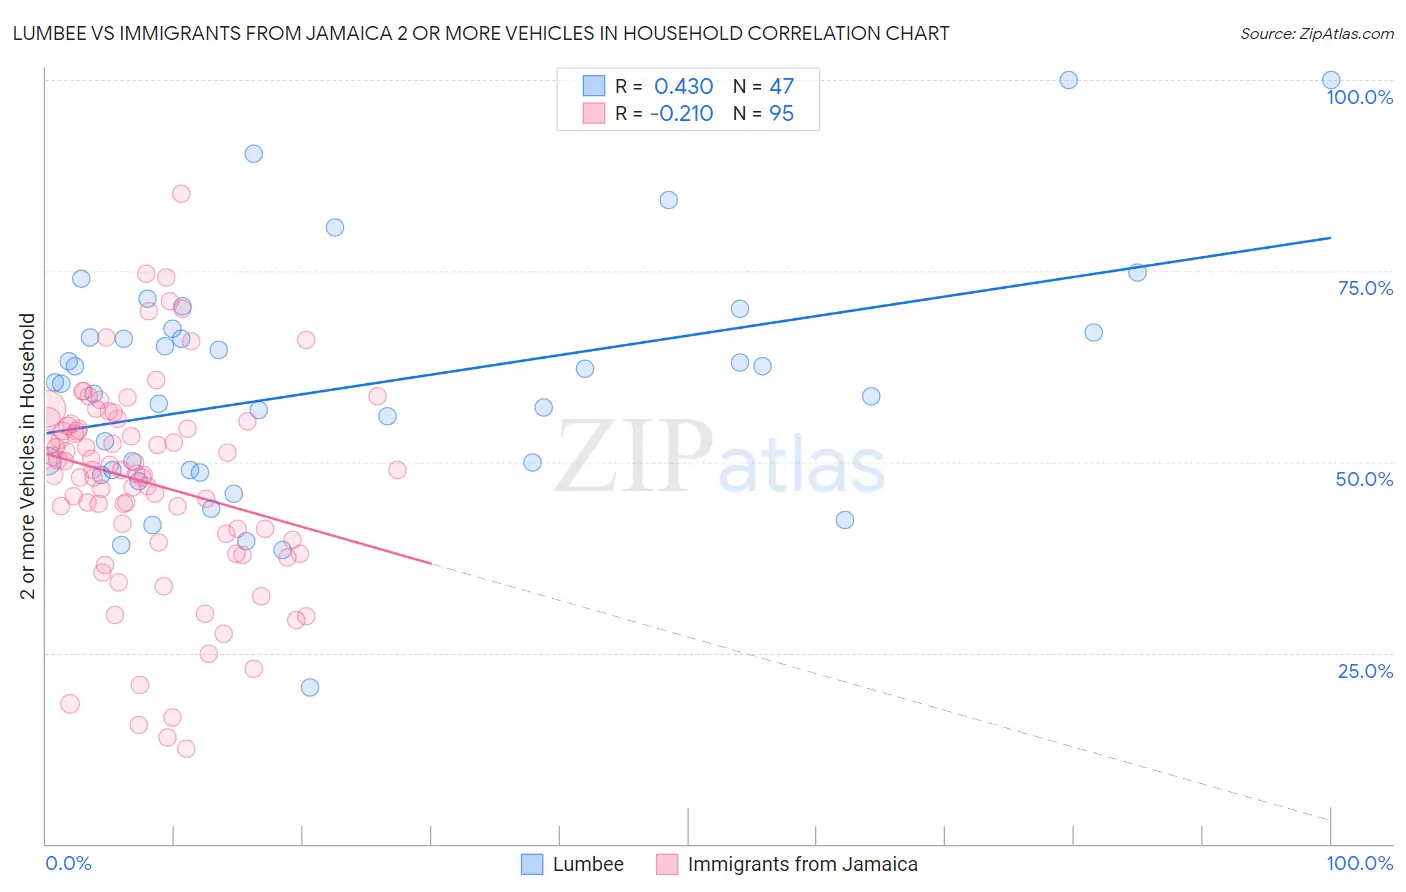
Lumbee vs Immigrants from Jamaica 2 or more Vehicles in Household Correlation Chart
The statistical analysis conducted on geographies consisting of 92,265,071 people shows a moderate positive correlation between the proportion of Lumbee and percentage of households with 2 or more vehicles available in the United States with a correlation coefficient (R) of 0.430 and weighted average of 55.9%. Similarly, the statistical analysis conducted on geographies consisting of 301,616,256 people shows a weak negative correlation between the proportion of Immigrants from Jamaica and percentage of households with 2 or more vehicles available in the United States with a correlation coefficient (R) of -0.210 and weighted average of 44.5%, a difference of 25.6%.
2 or more Vehicles in Household Correlation Summary
| Measurement | Lumbee | Immigrants from Jamaica |
| Minimum | 20.5% | 12.4% |
| Maximum | 100.0% | 85.1% |
| Range | 79.5% | 72.7% |
| Mean | 59.9% | 47.3% |
| Median | 60.3% | 49.0% |
| Interquartile 25% (IQ1) | 48.9% | 39.8% |
| Interquartile 75% (IQ3) | 67.0% | 55.0% |
| Interquartile Range (IQR) | 18.1% | 15.2% |
| Standard Deviation (Sample) | 15.6% | 13.8% |
| Standard Deviation (Population) | 15.5% | 13.7% |
Similar Demographics by 2 or more Vehicles in Household
Demographics Similar to Lumbee by 2 or more Vehicles in Household
In terms of 2 or more vehicles in household, the demographic groups most similar to Lumbee are Ukrainian (55.8%, a difference of 0.060%), Immigrants from Venezuela (55.8%, a difference of 0.060%), Immigrants from Lithuania (55.8%, a difference of 0.070%), Immigrants from Kuwait (55.8%, a difference of 0.080%), and Tlingit-Haida (55.8%, a difference of 0.16%).
| Demographics | Rating | Rank | 2 or more Vehicles in Household |
| Venezuelans | 80.7 /100 | #146 | Excellent 56.1% |
| Serbians | 80.3 /100 | #147 | Excellent 56.1% |
| Immigrants | Moldova | 80.2 /100 | #148 | Excellent 56.1% |
| Chileans | 80.2 /100 | #149 | Excellent 56.1% |
| Nicaraguans | 79.9 /100 | #150 | Good 56.1% |
| Immigrants | Northern Europe | 78.7 /100 | #151 | Good 56.1% |
| Immigrants | Pakistan | 78.1 /100 | #152 | Good 56.1% |
| Lumbee | 71.9 /100 | #153 | Good 55.9% |
| Ukrainians | 70.8 /100 | #154 | Good 55.8% |
| Immigrants | Venezuela | 70.7 /100 | #155 | Good 55.8% |
| Immigrants | Lithuania | 70.4 /100 | #156 | Good 55.8% |
| Immigrants | Kuwait | 70.2 /100 | #157 | Good 55.8% |
| Tlingit-Haida | 68.5 /100 | #158 | Good 55.8% |
| Paiute | 68.0 /100 | #159 | Good 55.8% |
| Crow | 67.0 /100 | #160 | Good 55.7% |
Demographics Similar to Immigrants from Jamaica by 2 or more Vehicles in Household
In terms of 2 or more vehicles in household, the demographic groups most similar to Immigrants from Jamaica are Senegalese (44.2%, a difference of 0.55%), Immigrants from Caribbean (44.2%, a difference of 0.57%), Immigrants from Cabo Verde (43.3%, a difference of 2.6%), Soviet Union (45.7%, a difference of 2.9%), and Jamaican (45.8%, a difference of 2.9%).
| Demographics | Rating | Rank | 2 or more Vehicles in Household |
| Immigrants | Ghana | 0.0 /100 | #314 | Tragic 47.4% |
| Puerto Ricans | 0.0 /100 | #315 | Tragic 47.1% |
| Cape Verdeans | 0.0 /100 | #316 | Tragic 46.8% |
| Immigrants | Haiti | 0.0 /100 | #317 | Tragic 46.5% |
| Immigrants | Albania | 0.0 /100 | #318 | Tragic 46.0% |
| Jamaicans | 0.0 /100 | #319 | Tragic 45.8% |
| Soviet Union | 0.0 /100 | #320 | Tragic 45.7% |
| Immigrants | Jamaica | 0.0 /100 | #321 | Tragic 44.5% |
| Senegalese | 0.0 /100 | #322 | Tragic 44.2% |
| Immigrants | Caribbean | 0.0 /100 | #323 | Tragic 44.2% |
| Immigrants | Cabo Verde | 0.0 /100 | #324 | Tragic 43.3% |
| Immigrants | West Indies | 0.0 /100 | #325 | Tragic 43.1% |
| Immigrants | Senegal | 0.0 /100 | #326 | Tragic 43.0% |
| Immigrants | Yemen | 0.0 /100 | #327 | Tragic 42.8% |
| Inupiat | 0.0 /100 | #328 | Tragic 42.6% |