Tsimshian 2 or more Vehicles in Household
COMPARE
Tsimshian
Select to Compare
2 or more Vehicles in Household
Tsimshian 2 or more Vehicles in Household
56.7%
2+ VEHICLES AVAILABLE
91.6/ 100
METRIC RATING
125th/ 347
METRIC RANK
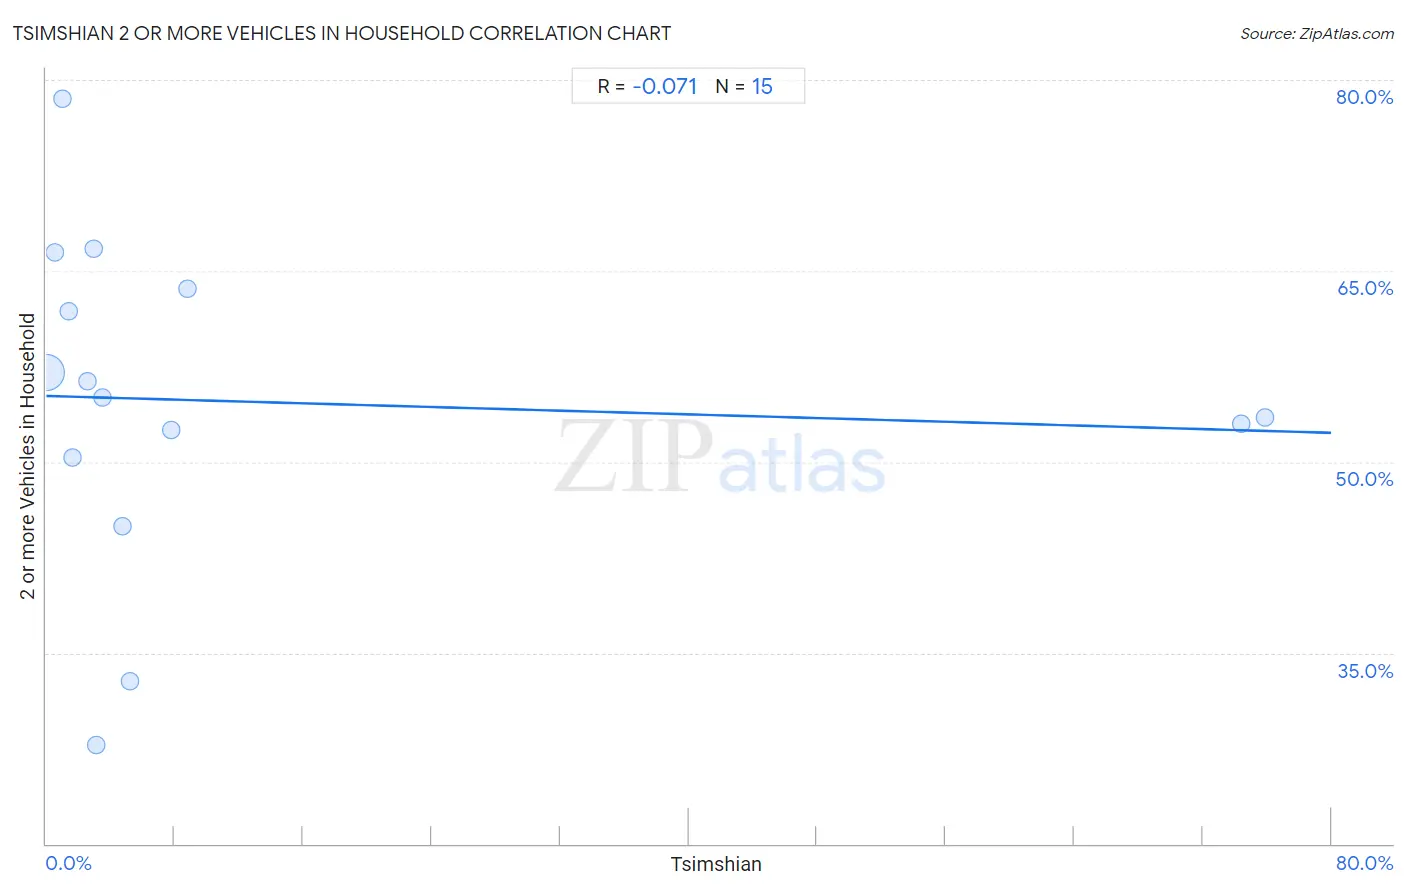
Tsimshian 2 or more Vehicles in Household Correlation Chart
The statistical analysis conducted on geographies consisting of 15,626,544 people shows a slight negative correlation between the proportion of Tsimshian and percentage of households with 2 or more vehicles available in the United States with a correlation coefficient (R) of -0.071 and weighted average of 56.7%. On average, for every 1% (one percent) increase in Tsimshian within a typical geography, there is a decrease of 0.036% in percentage of households with 2 or more vehicles available.
It is essential to understand that the correlation between the percentage of Tsimshian and percentage of households with 2 or more vehicles available does not imply a direct cause-and-effect relationship. It remains uncertain whether the presence of Tsimshian influences an upward or downward trend in the level of percentage of households with 2 or more vehicles available within an area, or if Tsimshian simply ended up residing in those areas with higher or lower levels of percentage of households with 2 or more vehicles available due to other factors.
Demographics Similar to Tsimshian by 2 or more Vehicles in Household
In terms of 2 or more vehicles in household, the demographic groups most similar to Tsimshian are New Zealander (56.7%, a difference of 0.020%), Australian (56.7%, a difference of 0.030%), Estonian (56.6%, a difference of 0.080%), Immigrants from Thailand (56.6%, a difference of 0.11%), and Immigrants from South Africa (56.7%, a difference of 0.12%).
| Demographics | Rating | Rank | 2 or more Vehicles in Household |
| Asians | 95.1 /100 | #118 | Exceptional 57.0% |
| Natives/Alaskans | 95.0 /100 | #119 | Exceptional 57.0% |
| Costa Ricans | 94.7 /100 | #120 | Exceptional 56.9% |
| Sioux | 93.8 /100 | #121 | Exceptional 56.8% |
| Immigrants from South Africa | 92.5 /100 | #122 | Exceptional 56.7% |
| Australians | 91.8 /100 | #123 | Exceptional 56.7% |
| New Zealanders | 91.8 /100 | #124 | Exceptional 56.7% |
| Tsimshian | 91.6 /100 | #125 | Exceptional 56.7% |
| Estonians | 90.9 /100 | #126 | Exceptional 56.6% |
| Immigrants from Thailand | 90.7 /100 | #127 | Exceptional 56.6% |
| Immigrants from South Central Asia | 90.5 /100 | #128 | Exceptional 56.6% |
| Ute | 90.4 /100 | #129 | Exceptional 56.6% |
| Yugoslavians | 90.0 /100 | #130 | Exceptional 56.6% |
| Bulgarians | 89.7 /100 | #131 | Excellent 56.5% |
| Hungarians | 89.1 /100 | #132 | Excellent 56.5% |
Tsimshian 2 or more Vehicles in Household Correlation Summary
| Measurement | Tsimshian Data | 2 or more Vehicles in Household Data |
| Minimum | 0.024% | 27.8% |
| Maximum | 75.9% | 78.5% |
| Range | 75.8% | 50.8% |
| Mean | 12.9% | 54.7% |
| Median | 3.1% | 55.1% |
| Interquartile 25% (IQ1) | 1.4% | 50.3% |
| Interquartile 75% (IQ3) | 7.8% | 63.6% |
| Interquartile Range (IQR) | 6.3% | 13.3% |
| Standard Deviation (Sample) | 25.4% | 12.9% |
| Standard Deviation (Population) | 24.5% | 12.4% |
Correlation Details
| Tsimshian Percentile | Sample Size | 2 or more Vehicles in Household |
[ 0.0% - 0.5% ] 0.024% | 15,404,738 | 57.1% |
[ 0.5% - 1.0% ] 0.53% | 171,789 | 66.4% |
[ 0.5% - 1.0% ] 0.99% | 15,580 | 78.5% |
[ 1.0% - 1.5% ] 1.41% | 3,691 | 61.9% |
[ 1.5% - 2.0% ] 1.62% | 804 | 50.3% |
[ 2.5% - 3.0% ] 2.53% | 1,736 | 56.3% |
[ 2.5% - 3.0% ] 2.92% | 822 | 66.8% |
[ 3.0% - 3.5% ] 3.10% | 838 | 27.8% |
[ 3.0% - 3.5% ] 3.46% | 13,913 | 55.1% |
[ 4.5% - 5.0% ] 4.77% | 8,168 | 44.9% |
[ 5.0% - 5.5% ] 5.18% | 656 | 32.8% |
[ 7.5% - 8.0% ] 7.76% | 361 | 52.5% |
[ 8.5% - 9.0% ] 8.79% | 546 | 63.6% |
[ 74.0% - 74.5% ] 74.40% | 1,465 | 53.0% |
[ 75.5% - 76.0% ] 75.85% | 1,437 | 53.5% |