Lumbee vs Immigrants from Kazakhstan 2 or more Vehicles in Household
COMPARE
Lumbee
Immigrants from Kazakhstan
2 or more Vehicles in Household
2 or more Vehicles in Household Comparison
Lumbee
Immigrants from Kazakhstan
55.9%
2 OR MORE VEHICLES IN HOUSEHOLD
71.9/ 100
METRIC RATING
153rd/ 347
METRIC RANK
51.6%
2 OR MORE VEHICLES IN HOUSEHOLD
0.1/ 100
METRIC RATING
281st/ 347
METRIC RANK
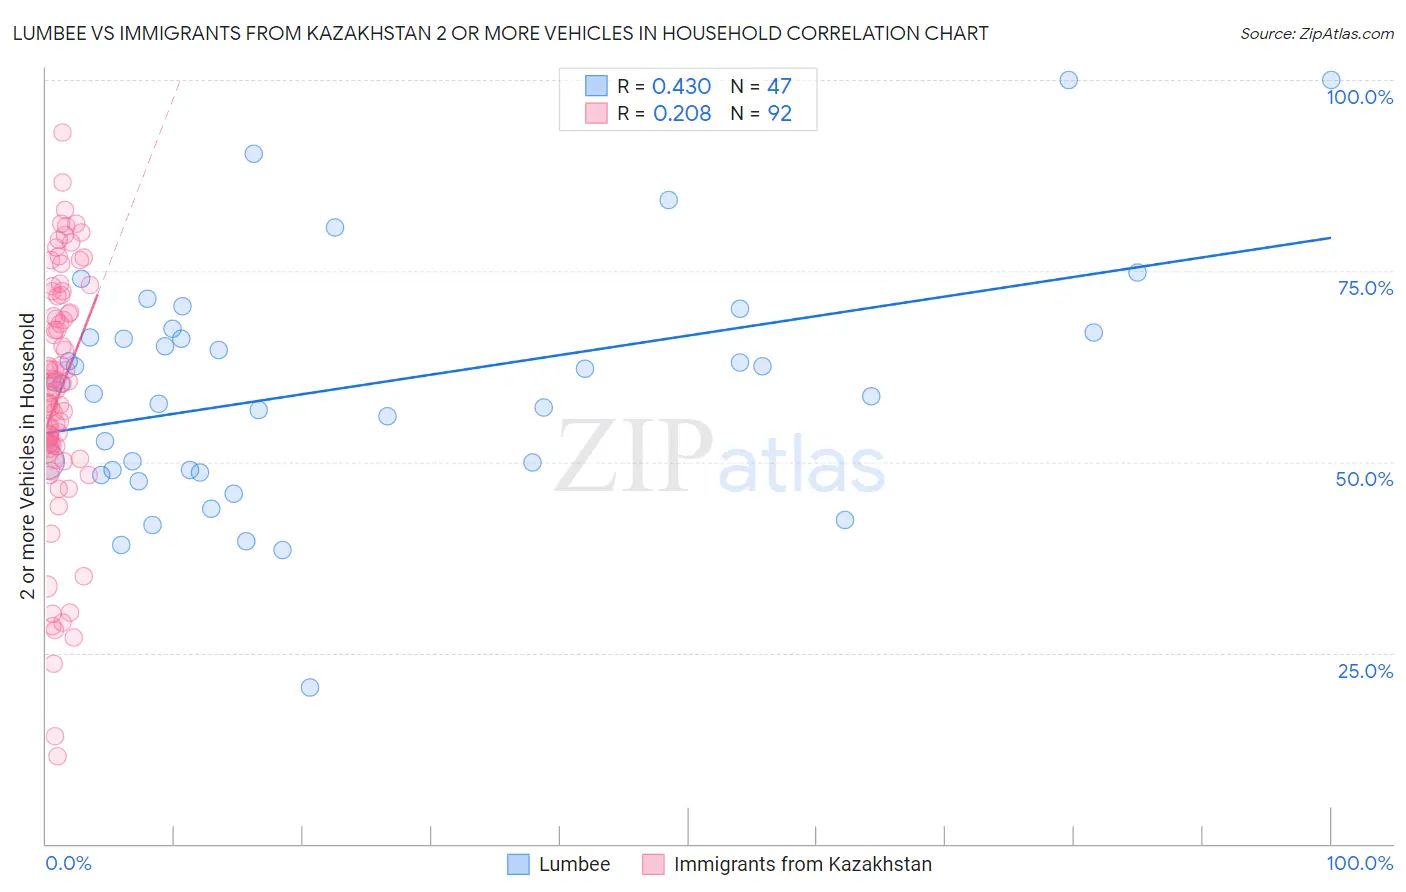
Lumbee vs Immigrants from Kazakhstan 2 or more Vehicles in Household Correlation Chart
The statistical analysis conducted on geographies consisting of 92,265,071 people shows a moderate positive correlation between the proportion of Lumbee and percentage of households with 2 or more vehicles available in the United States with a correlation coefficient (R) of 0.430 and weighted average of 55.9%. Similarly, the statistical analysis conducted on geographies consisting of 124,427,212 people shows a weak positive correlation between the proportion of Immigrants from Kazakhstan and percentage of households with 2 or more vehicles available in the United States with a correlation coefficient (R) of 0.208 and weighted average of 51.6%, a difference of 8.4%.
2 or more Vehicles in Household Correlation Summary
| Measurement | Lumbee | Immigrants from Kazakhstan |
| Minimum | 20.5% | 11.5% |
| Maximum | 100.0% | 93.1% |
| Range | 79.5% | 81.6% |
| Mean | 59.9% | 58.8% |
| Median | 60.3% | 59.6% |
| Interquartile 25% (IQ1) | 48.9% | 51.8% |
| Interquartile 75% (IQ3) | 67.0% | 70.7% |
| Interquartile Range (IQR) | 18.1% | 18.8% |
| Standard Deviation (Sample) | 15.6% | 16.2% |
| Standard Deviation (Population) | 15.5% | 16.1% |
Similar Demographics by 2 or more Vehicles in Household
Demographics Similar to Lumbee by 2 or more Vehicles in Household
In terms of 2 or more vehicles in household, the demographic groups most similar to Lumbee are Ukrainian (55.8%, a difference of 0.060%), Immigrants from Venezuela (55.8%, a difference of 0.060%), Immigrants from Lithuania (55.8%, a difference of 0.070%), Immigrants from Kuwait (55.8%, a difference of 0.080%), and Tlingit-Haida (55.8%, a difference of 0.16%).
| Demographics | Rating | Rank | 2 or more Vehicles in Household |
| Venezuelans | 80.7 /100 | #146 | Excellent 56.1% |
| Serbians | 80.3 /100 | #147 | Excellent 56.1% |
| Immigrants | Moldova | 80.2 /100 | #148 | Excellent 56.1% |
| Chileans | 80.2 /100 | #149 | Excellent 56.1% |
| Nicaraguans | 79.9 /100 | #150 | Good 56.1% |
| Immigrants | Northern Europe | 78.7 /100 | #151 | Good 56.1% |
| Immigrants | Pakistan | 78.1 /100 | #152 | Good 56.1% |
| Lumbee | 71.9 /100 | #153 | Good 55.9% |
| Ukrainians | 70.8 /100 | #154 | Good 55.8% |
| Immigrants | Venezuela | 70.7 /100 | #155 | Good 55.8% |
| Immigrants | Lithuania | 70.4 /100 | #156 | Good 55.8% |
| Immigrants | Kuwait | 70.2 /100 | #157 | Good 55.8% |
| Tlingit-Haida | 68.5 /100 | #158 | Good 55.8% |
| Paiute | 68.0 /100 | #159 | Good 55.8% |
| Crow | 67.0 /100 | #160 | Good 55.7% |
Demographics Similar to Immigrants from Kazakhstan by 2 or more Vehicles in Household
In terms of 2 or more vehicles in household, the demographic groups most similar to Immigrants from Kazakhstan are Bahamian (51.5%, a difference of 0.060%), Immigrants from China (51.5%, a difference of 0.14%), Immigrants from Zaire (51.5%, a difference of 0.18%), Immigrants from Eastern Europe (51.7%, a difference of 0.31%), and Immigrants from Uruguay (51.4%, a difference of 0.34%).
| Demographics | Rating | Rank | 2 or more Vehicles in Household |
| Africans | 0.2 /100 | #274 | Tragic 51.8% |
| Immigrants | Honduras | 0.2 /100 | #275 | Tragic 51.8% |
| Immigrants | Croatia | 0.2 /100 | #276 | Tragic 51.8% |
| Immigrants | Africa | 0.2 /100 | #277 | Tragic 51.8% |
| Yuman | 0.1 /100 | #278 | Tragic 51.7% |
| Liberians | 0.1 /100 | #279 | Tragic 51.7% |
| Immigrants | Eastern Europe | 0.1 /100 | #280 | Tragic 51.7% |
| Immigrants | Kazakhstan | 0.1 /100 | #281 | Tragic 51.6% |
| Bahamians | 0.1 /100 | #282 | Tragic 51.5% |
| Immigrants | China | 0.1 /100 | #283 | Tragic 51.5% |
| Immigrants | Zaire | 0.1 /100 | #284 | Tragic 51.5% |
| Immigrants | Uruguay | 0.1 /100 | #285 | Tragic 51.4% |
| Immigrants | Liberia | 0.1 /100 | #286 | Tragic 51.3% |
| Immigrants | Serbia | 0.1 /100 | #287 | Tragic 51.3% |
| Okinawans | 0.1 /100 | #288 | Tragic 51.2% |