Argentinean 2 or more Vehicles in Household
COMPARE
Argentinean
Select to Compare
2 or more Vehicles in Household
Argentinean 2 or more Vehicles in Household
54.5%
2+ VEHICLES AVAILABLE
17.5/ 100
METRIC RATING
197th/ 347
METRIC RANK
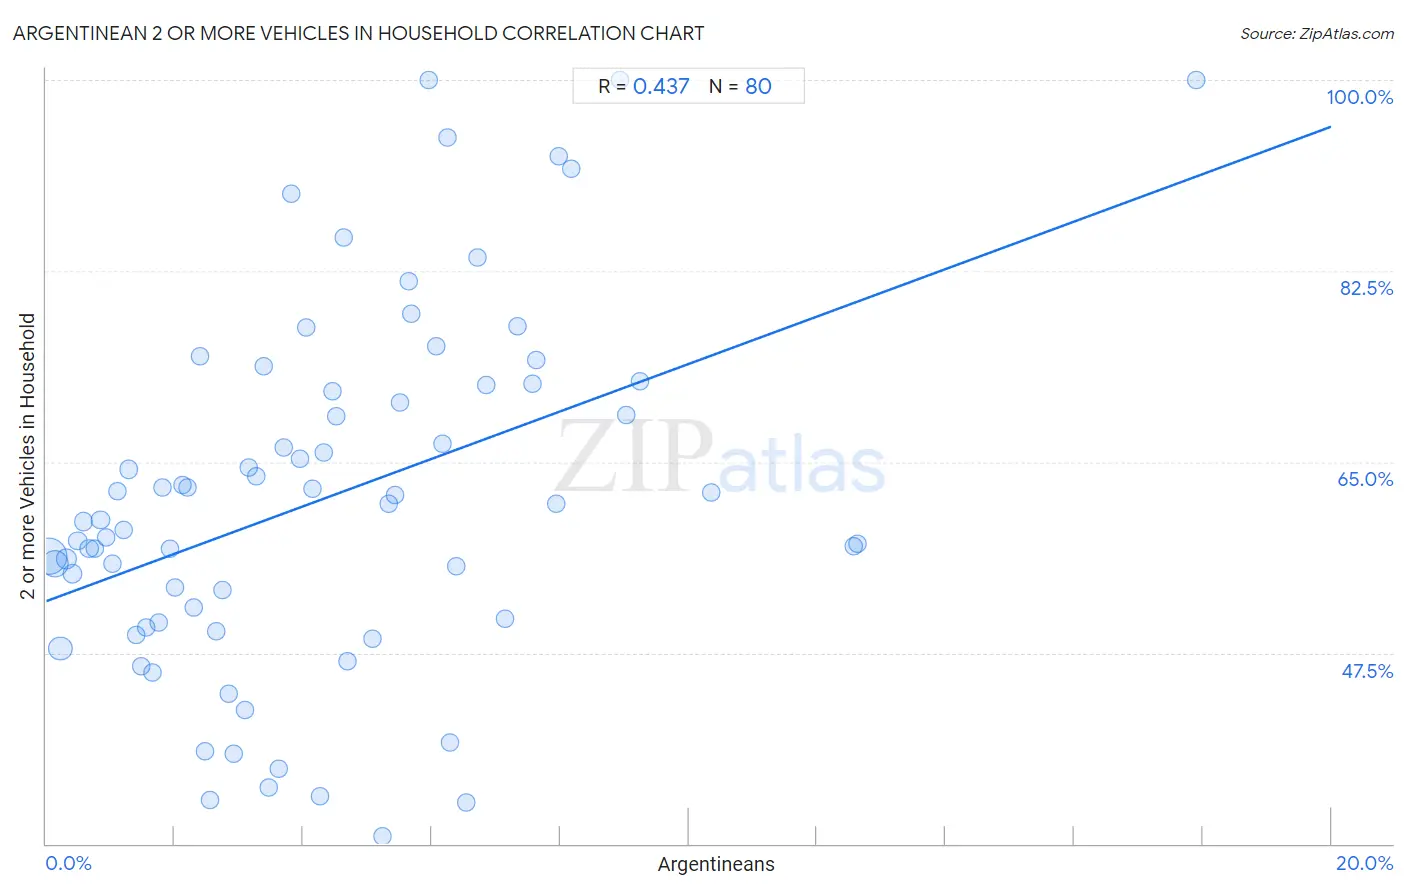
Argentinean 2 or more Vehicles in Household Correlation Chart
The statistical analysis conducted on geographies consisting of 297,010,599 people shows a moderate positive correlation between the proportion of Argentineans and percentage of households with 2 or more vehicles available in the United States with a correlation coefficient (R) of 0.437 and weighted average of 54.5%. On average, for every 1% (one percent) increase in Argentineans within a typical geography, there is an increase of 2.2% in percentage of households with 2 or more vehicles available.
It is essential to understand that the correlation between the percentage of Argentineans and percentage of households with 2 or more vehicles available does not imply a direct cause-and-effect relationship. It remains uncertain whether the presence of Argentineans influences an upward or downward trend in the level of percentage of households with 2 or more vehicles available within an area, or if Argentineans simply ended up residing in those areas with higher or lower levels of percentage of households with 2 or more vehicles available due to other factors.
Demographics Similar to Argentineans by 2 or more Vehicles in Household
In terms of 2 or more vehicles in household, the demographic groups most similar to Argentineans are Carpatho Rusyn (54.4%, a difference of 0.090%), Immigrants from Poland (54.6%, a difference of 0.12%), Immigrants from Norway (54.4%, a difference of 0.12%), Houma (54.4%, a difference of 0.12%), and Immigrants from Italy (54.4%, a difference of 0.15%).
| Demographics | Rating | Rank | 2 or more Vehicles in Household |
| Russians | 26.3 /100 | #190 | Fair 54.8% |
| Immigrants | 25.0 /100 | #191 | Fair 54.7% |
| Immigrants from Romania | 23.8 /100 | #192 | Fair 54.7% |
| Immigrants from Japan | 23.4 /100 | #193 | Fair 54.7% |
| Central Americans | 23.0 /100 | #194 | Fair 54.7% |
| Iroquois | 22.6 /100 | #195 | Fair 54.7% |
| Immigrants from Poland | 19.3 /100 | #196 | Poor 54.6% |
| Argentineans | 17.5 /100 | #197 | Poor 54.5% |
| Carpatho Rusyns | 16.2 /100 | #198 | Poor 54.4% |
| Immigrants from Norway | 15.9 /100 | #199 | Poor 54.4% |
| Houma | 15.8 /100 | #200 | Poor 54.4% |
| Immigrants from Italy | 15.5 /100 | #201 | Poor 54.4% |
| Immigrants from North Macedonia | 14.9 /100 | #202 | Poor 54.4% |
| Immigrants from Peru | 14.3 /100 | #203 | Poor 54.4% |
| Immigrants from Belgium | 13.7 /100 | #204 | Poor 54.3% |
Argentinean 2 or more Vehicles in Household Correlation Summary
| Measurement | Argentinean Data | 2 or more Vehicles in Household Data |
| Minimum | 0.045% | 30.7% |
| Maximum | 17.9% | 100.0% |
| Range | 17.9% | 69.3% |
| Mean | 4.3% | 61.6% |
| Median | 3.8% | 60.4% |
| Interquartile 25% (IQ1) | 1.8% | 50.4% |
| Interquartile 75% (IQ3) | 6.2% | 71.7% |
| Interquartile Range (IQR) | 4.4% | 21.3% |
| Standard Deviation (Sample) | 3.3% | 16.3% |
| Standard Deviation (Population) | 3.3% | 16.2% |
Correlation Details
| Argentinean Percentile | Sample Size | 2 or more Vehicles in Household |
[ 0.0% - 0.5% ] 0.045% | 139,472,916 | 56.3% |
[ 0.0% - 0.5% ] 0.13% | 65,079,604 | 55.6% |
[ 0.0% - 0.5% ] 0.22% | 40,703,431 | 47.9% |
[ 0.0% - 0.5% ] 0.31% | 16,509,492 | 56.1% |
[ 0.0% - 0.5% ] 0.40% | 9,999,909 | 54.7% |
[ 0.0% - 0.5% ] 0.50% | 6,289,006 | 57.8% |
[ 0.5% - 1.0% ] 0.58% | 4,136,871 | 59.5% |
[ 0.5% - 1.0% ] 0.67% | 3,032,340 | 57.1% |
[ 0.5% - 1.0% ] 0.75% | 2,574,417 | 57.1% |
[ 0.5% - 1.0% ] 0.85% | 1,341,177 | 59.7% |
[ 0.5% - 1.0% ] 0.93% | 1,061,466 | 58.0% |
[ 1.0% - 1.5% ] 1.03% | 972,410 | 55.7% |
[ 1.0% - 1.5% ] 1.11% | 677,441 | 62.3% |
[ 1.0% - 1.5% ] 1.20% | 993,577 | 58.7% |
[ 1.0% - 1.5% ] 1.29% | 555,584 | 64.3% |
[ 1.0% - 1.5% ] 1.40% | 877,928 | 49.1% |
[ 1.0% - 1.5% ] 1.48% | 267,037 | 46.2% |
[ 1.5% - 2.0% ] 1.56% | 212,348 | 49.8% |
[ 1.5% - 2.0% ] 1.64% | 180,007 | 45.7% |
[ 1.5% - 2.0% ] 1.76% | 241,358 | 50.2% |
[ 1.5% - 2.0% ] 1.81% | 154,011 | 62.7% |
[ 1.5% - 2.0% ] 1.93% | 135,496 | 57.0% |
[ 1.5% - 2.0% ] 2.00% | 201,906 | 53.5% |
[ 2.0% - 2.5% ] 2.12% | 92,977 | 62.8% |
[ 2.0% - 2.5% ] 2.19% | 101,823 | 62.7% |
[ 2.0% - 2.5% ] 2.29% | 61,444 | 51.7% |
[ 2.0% - 2.5% ] 2.39% | 33,303 | 74.7% |
[ 2.0% - 2.5% ] 2.46% | 96,652 | 38.4% |
[ 2.5% - 3.0% ] 2.55% | 30,528 | 34.0% |
[ 2.5% - 3.0% ] 2.65% | 76,703 | 49.5% |
[ 2.5% - 3.0% ] 2.75% | 59,884 | 53.3% |
[ 2.5% - 3.0% ] 2.84% | 47,793 | 43.8% |
[ 2.5% - 3.0% ] 2.92% | 16,342 | 38.3% |
[ 3.0% - 3.5% ] 3.09% | 93,687 | 42.2% |
[ 3.0% - 3.5% ] 3.16% | 23,405 | 64.5% |
[ 3.0% - 3.5% ] 3.26% | 2,207 | 63.7% |
[ 3.0% - 3.5% ] 3.38% | 74,653 | 73.8% |
[ 3.0% - 3.5% ] 3.46% | 73,622 | 35.1% |
[ 3.5% - 4.0% ] 3.62% | 57,196 | 36.9% |
[ 3.5% - 4.0% ] 3.70% | 10,989 | 66.3% |
[ 3.5% - 4.0% ] 3.80% | 6,651 | 89.6% |
[ 3.5% - 4.0% ] 3.95% | 12,579 | 65.3% |
[ 4.0% - 4.5% ] 4.04% | 1,360 | 77.3% |
[ 4.0% - 4.5% ] 4.15% | 289 | 62.5% |
[ 4.0% - 4.5% ] 4.26% | 24,163 | 34.3% |
[ 4.0% - 4.5% ] 4.33% | 19,907 | 65.8% |
[ 4.0% - 4.5% ] 4.46% | 13,255 | 71.4% |
[ 4.5% - 5.0% ] 4.51% | 6,225 | 69.2% |
[ 4.5% - 5.0% ] 4.63% | 23,734 | 85.6% |
[ 4.5% - 5.0% ] 4.68% | 33,282 | 46.7% |
[ 5.0% - 5.5% ] 5.07% | 2,683 | 48.8% |
[ 5.0% - 5.5% ] 5.24% | 98,850 | 30.7% |
[ 5.0% - 5.5% ] 5.33% | 7,792 | 61.2% |
[ 5.0% - 5.5% ] 5.43% | 11,638 | 62.0% |
[ 5.5% - 6.0% ] 5.51% | 7,388 | 70.5% |
[ 5.5% - 6.0% ] 5.63% | 1,917 | 81.5% |
[ 5.5% - 6.0% ] 5.68% | 88 | 78.6% |
[ 5.5% - 6.0% ] 5.95% | 605 | 100.0% |
[ 6.0% - 6.5% ] 6.06% | 1,237 | 75.6% |
[ 6.0% - 6.5% ] 6.18% | 6,590 | 66.7% |
[ 6.0% - 6.5% ] 6.24% | 593 | 94.8% |
[ 6.0% - 6.5% ] 6.29% | 19,785 | 39.3% |
[ 6.0% - 6.5% ] 6.37% | 1,381 | 55.4% |
[ 6.5% - 7.0% ] 6.54% | 35,967 | 33.8% |
[ 6.5% - 7.0% ] 6.71% | 1,013 | 83.8% |
[ 6.5% - 7.0% ] 6.85% | 3,589 | 72.1% |
[ 7.0% - 7.5% ] 7.15% | 5,290 | 50.7% |
[ 7.0% - 7.5% ] 7.33% | 887 | 77.4% |
[ 7.5% - 8.0% ] 7.56% | 238 | 72.2% |
[ 7.5% - 8.0% ] 7.62% | 210 | 74.4% |
[ 7.5% - 8.0% ] 7.94% | 3,098 | 61.2% |
[ 7.5% - 8.0% ] 7.98% | 689 | 93.0% |
[ 8.0% - 8.5% ] 8.17% | 1,041 | 91.9% |
[ 8.5% - 9.0% ] 8.93% | 459 | 100.0% |
[ 9.0% - 9.5% ] 9.02% | 2,461 | 69.3% |
[ 9.0% - 9.5% ] 9.24% | 563 | 72.4% |
[ 10.0% - 10.5% ] 10.36% | 560 | 62.2% |
[ 12.5% - 13.0% ] 12.57% | 14,639 | 57.3% |
[ 12.5% - 13.0% ] 12.63% | 14,572 | 57.5% |
[ 17.5% - 18.0% ] 17.90% | 391 | 100.0% |