Immigrants from Croatia 2 or more Vehicles in Household
COMPARE
Immigrants from Croatia
Select to Compare
2 or more Vehicles in Household
Immigrants from Croatia 2 or more Vehicles in Household
51.8%
2+ VEHICLES AVAILABLE
0.2/ 100
METRIC RATING
276th/ 347
METRIC RANK
Immigrants from Croatia 2 or more Vehicles in Household Correlation Chart
The statistical analysis conducted on geographies consisting of 132,533,947 people shows a weak positive correlation between the proportion of Immigrants from Croatia and percentage of households with 2 or more vehicles available in the United States with a correlation coefficient (R) of 0.297 and weighted average of 51.8%. On average, for every 1% (one percent) increase in Immigrants from Croatia within a typical geography, there is an increase of 2.6% in percentage of households with 2 or more vehicles available.
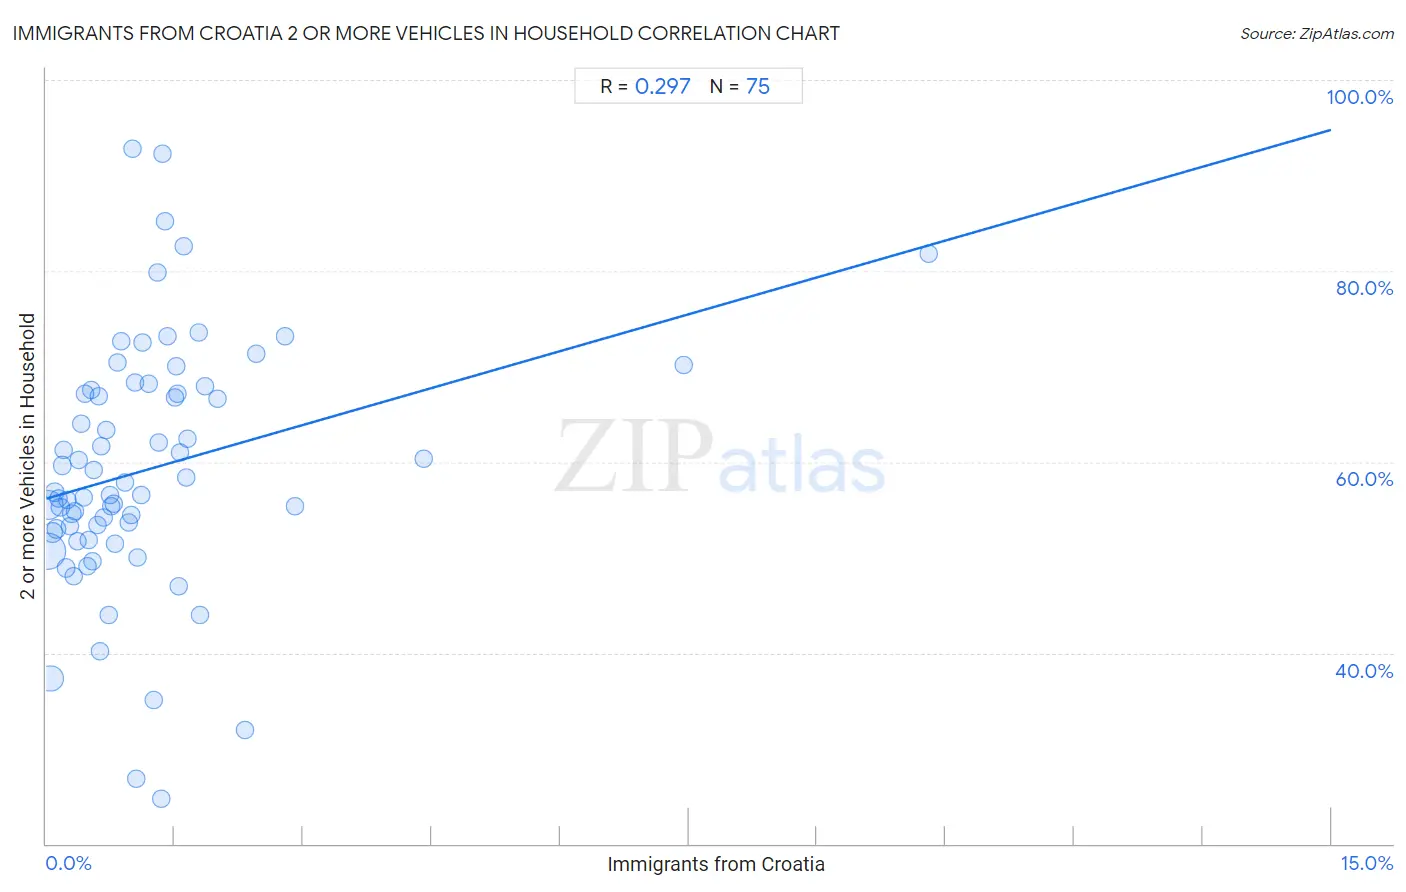
It is essential to understand that the correlation between the percentage of Immigrants from Croatia and percentage of households with 2 or more vehicles available does not imply a direct cause-and-effect relationship. It remains uncertain whether the presence of Immigrants from Croatia influences an upward or downward trend in the level of percentage of households with 2 or more vehicles available within an area, or if Immigrants from Croatia simply ended up residing in those areas with higher or lower levels of percentage of households with 2 or more vehicles available due to other factors.
Demographics Similar to Immigrants from Croatia by 2 or more Vehicles in Household
In terms of 2 or more vehicles in household, the demographic groups most similar to Immigrants from Croatia are Immigrants from Honduras (51.8%, a difference of 0.030%), African (51.8%, a difference of 0.040%), Immigrants from Africa (51.8%, a difference of 0.050%), Israeli (51.9%, a difference of 0.090%), and Yuman (51.7%, a difference of 0.12%).
| Demographics | Rating | Rank | 2 or more Vehicles in Household |
| Hondurans | 0.2 /100 | #269 | Tragic 52.0% |
| Immigrants from Ireland | 0.2 /100 | #270 | Tragic 52.0% |
| South Americans | 0.2 /100 | #271 | Tragic 51.9% |
| Sub-Saharan Africans | 0.2 /100 | #272 | Tragic 51.9% |
| Israelis | 0.2 /100 | #273 | Tragic 51.9% |
| Africans | 0.2 /100 | #274 | Tragic 51.8% |
| Immigrants from Honduras | 0.2 /100 | #275 | Tragic 51.8% |
| Immigrants from Croatia | 0.2 /100 | #276 | Tragic 51.8% |
| Immigrants from Africa | 0.2 /100 | #277 | Tragic 51.8% |
| Yuman | 0.1 /100 | #278 | Tragic 51.7% |
| Liberians | 0.1 /100 | #279 | Tragic 51.7% |
| Immigrants from Eastern Europe | 0.1 /100 | #280 | Tragic 51.7% |
| Immigrants from Kazakhstan | 0.1 /100 | #281 | Tragic 51.6% |
| Bahamians | 0.1 /100 | #282 | Tragic 51.5% |
| Immigrants from China | 0.1 /100 | #283 | Tragic 51.5% |
Immigrants from Croatia 2 or more Vehicles in Household Correlation Summary
| Measurement | Immigrants from Croatia Data | 2 or more Vehicles in Household Data |
| Minimum | 0.010% | 24.7% |
| Maximum | 10.3% | 92.9% |
| Range | 10.3% | 68.1% |
| Mean | 1.2% | 59.2% |
| Median | 0.83% | 56.8% |
| Interquartile 25% (IQ1) | 0.41% | 52.6% |
| Interquartile 75% (IQ3) | 1.5% | 67.5% |
| Interquartile Range (IQR) | 1.1% | 14.8% |
| Standard Deviation (Sample) | 1.5% | 13.1% |
| Standard Deviation (Population) | 1.5% | 13.0% |
Correlation Details
| Immigrants from Croatia Percentile | Sample Size | 2 or more Vehicles in Household |
[ 0.0% - 0.5% ] 0.010% | 53,227,368 | 50.7% |
[ 0.0% - 0.5% ] 0.031% | 32,238,248 | 55.5% |
[ 0.0% - 0.5% ] 0.049% | 22,841,552 | 37.3% |
[ 0.0% - 0.5% ] 0.077% | 6,961,575 | 52.6% |
[ 0.0% - 0.5% ] 0.098% | 5,243,750 | 56.8% |
[ 0.0% - 0.5% ] 0.12% | 2,516,308 | 53.0% |
[ 0.0% - 0.5% ] 0.14% | 1,631,746 | 56.1% |
[ 0.0% - 0.5% ] 0.16% | 1,325,015 | 55.2% |
[ 0.0% - 0.5% ] 0.19% | 1,125,105 | 59.6% |
[ 0.0% - 0.5% ] 0.21% | 545,986 | 61.3% |
[ 0.0% - 0.5% ] 0.23% | 769,935 | 48.9% |
[ 0.0% - 0.5% ] 0.25% | 589,204 | 56.0% |
[ 0.0% - 0.5% ] 0.27% | 483,070 | 53.3% |
[ 0.0% - 0.5% ] 0.30% | 341,651 | 54.6% |
[ 0.0% - 0.5% ] 0.32% | 227,065 | 48.0% |
[ 0.0% - 0.5% ] 0.34% | 318,546 | 54.9% |
[ 0.0% - 0.5% ] 0.36% | 203,231 | 51.7% |
[ 0.0% - 0.5% ] 0.39% | 208,826 | 60.2% |
[ 0.0% - 0.5% ] 0.41% | 65,108 | 64.1% |
[ 0.0% - 0.5% ] 0.43% | 159,676 | 56.3% |
[ 0.0% - 0.5% ] 0.45% | 135,542 | 67.1% |
[ 0.0% - 0.5% ] 0.48% | 119,493 | 49.1% |
[ 0.0% - 0.5% ] 0.49% | 164,910 | 51.8% |
[ 0.5% - 1.0% ] 0.52% | 77,634 | 67.5% |
[ 0.5% - 1.0% ] 0.54% | 40,579 | 49.6% |
[ 0.5% - 1.0% ] 0.56% | 83,552 | 59.2% |
[ 0.5% - 1.0% ] 0.59% | 80,692 | 53.4% |
[ 0.5% - 1.0% ] 0.61% | 14,359 | 66.9% |
[ 0.5% - 1.0% ] 0.63% | 87,443 | 40.2% |
[ 0.5% - 1.0% ] 0.65% | 30,057 | 61.6% |
[ 0.5% - 1.0% ] 0.67% | 56,899 | 54.2% |
[ 0.5% - 1.0% ] 0.70% | 38,116 | 63.4% |
[ 0.5% - 1.0% ] 0.73% | 4,536 | 44.0% |
[ 0.5% - 1.0% ] 0.74% | 6,785 | 56.5% |
[ 0.5% - 1.0% ] 0.76% | 47,950 | 55.4% |
[ 0.5% - 1.0% ] 0.78% | 62,467 | 55.6% |
[ 0.5% - 1.0% ] 0.80% | 9,073 | 51.4% |
[ 0.5% - 1.0% ] 0.83% | 31,458 | 70.4% |
[ 0.5% - 1.0% ] 0.87% | 52,121 | 72.6% |
[ 0.5% - 1.0% ] 0.92% | 35,889 | 57.9% |
[ 0.5% - 1.0% ] 0.96% | 20,996 | 53.6% |
[ 0.5% - 1.0% ] 0.99% | 8,820 | 54.4% |
[ 1.0% - 1.5% ] 1.00% | 499 | 92.9% |
[ 1.0% - 1.5% ] 1.03% | 486 | 68.3% |
[ 1.0% - 1.5% ] 1.05% | 5,598 | 26.7% |
[ 1.0% - 1.5% ] 1.06% | 470 | 50.0% |
[ 1.0% - 1.5% ] 1.11% | 18,166 | 56.6% |
[ 1.0% - 1.5% ] 1.13% | 3,999 | 72.5% |
[ 1.0% - 1.5% ] 1.20% | 1,254 | 68.1% |
[ 1.0% - 1.5% ] 1.25% | 38,209 | 35.0% |
[ 1.0% - 1.5% ] 1.29% | 5,496 | 79.8% |
[ 1.0% - 1.5% ] 1.31% | 70,431 | 62.1% |
[ 1.0% - 1.5% ] 1.34% | 34,539 | 24.7% |
[ 1.0% - 1.5% ] 1.35% | 2,444 | 92.2% |
[ 1.0% - 1.5% ] 1.38% | 362 | 85.2% |
[ 1.0% - 1.5% ] 1.41% | 8,801 | 73.1% |
[ 1.0% - 1.5% ] 1.50% | 2,739 | 66.8% |
[ 1.5% - 2.0% ] 1.52% | 330 | 70.0% |
[ 1.5% - 2.0% ] 1.53% | 1,374 | 67.1% |
[ 1.5% - 2.0% ] 1.55% | 1,875 | 47.0% |
[ 1.5% - 2.0% ] 1.57% | 24,440 | 61.0% |
[ 1.5% - 2.0% ] 1.60% | 811 | 82.6% |
[ 1.5% - 2.0% ] 1.63% | 307 | 58.3% |
[ 1.5% - 2.0% ] 1.65% | 910 | 62.4% |
[ 1.5% - 2.0% ] 1.78% | 8,804 | 73.5% |
[ 1.5% - 2.0% ] 1.79% | 20,401 | 44.0% |
[ 1.5% - 2.0% ] 1.85% | 6,914 | 68.0% |
[ 2.0% - 2.5% ] 2.00% | 6,590 | 66.7% |
[ 2.0% - 2.5% ] 2.32% | 29,870 | 32.0% |
[ 2.0% - 2.5% ] 2.45% | 286 | 71.3% |
[ 2.5% - 3.0% ] 2.78% | 2,442 | 73.1% |
[ 2.5% - 3.0% ] 2.91% | 172 | 55.4% |
[ 4.0% - 4.5% ] 4.41% | 1,428 | 60.3% |
[ 7.0% - 7.5% ] 7.44% | 766 | 70.1% |
[ 10.0% - 10.5% ] 10.30% | 398 | 81.8% |