Immigrants from Saudi Arabia 2 or more Vehicles in Household
COMPARE
Immigrants from Saudi Arabia
Select to Compare
2 or more Vehicles in Household
Immigrants from Saudi Arabia 2 or more Vehicles in Household
54.2%
2+ VEHICLES AVAILABLE
11.3/ 100
METRIC RATING
210th/ 347
METRIC RANK
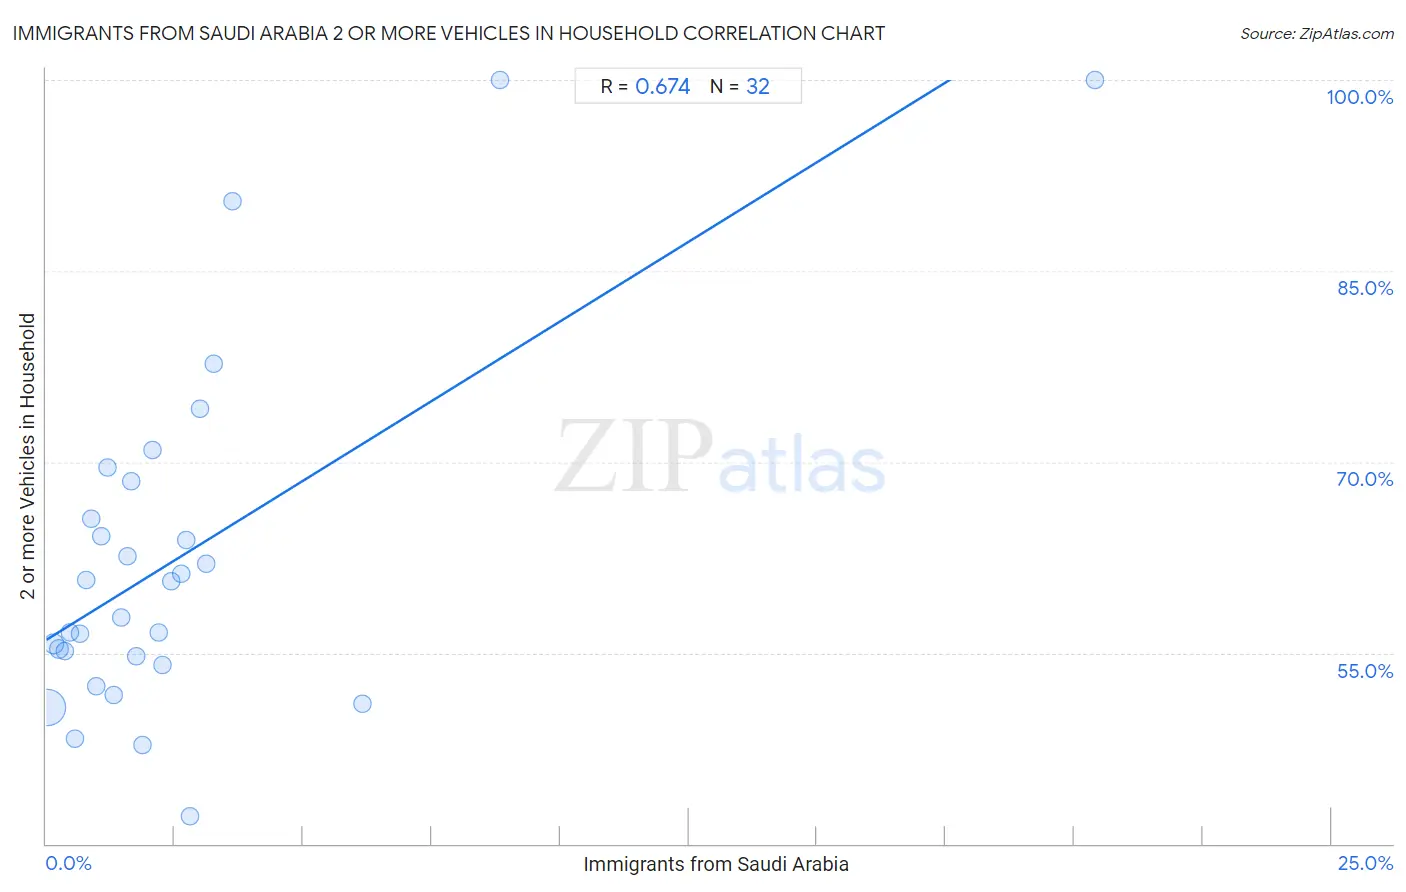
Immigrants from Saudi Arabia 2 or more Vehicles in Household Correlation Chart
The statistical analysis conducted on geographies consisting of 164,214,084 people shows a significant positive correlation between the proportion of Immigrants from Saudi Arabia and percentage of households with 2 or more vehicles available in the United States with a correlation coefficient (R) of 0.674 and weighted average of 54.2%. On average, for every 1% (one percent) increase in Immigrants from Saudi Arabia within a typical geography, there is an increase of 2.5% in percentage of households with 2 or more vehicles available.
It is essential to understand that the correlation between the percentage of Immigrants from Saudi Arabia and percentage of households with 2 or more vehicles available does not imply a direct cause-and-effect relationship. It remains uncertain whether the presence of Immigrants from Saudi Arabia influences an upward or downward trend in the level of percentage of households with 2 or more vehicles available within an area, or if Immigrants from Saudi Arabia simply ended up residing in those areas with higher or lower levels of percentage of households with 2 or more vehicles available due to other factors.
Demographics Similar to Immigrants from Saudi Arabia by 2 or more Vehicles in Household
In terms of 2 or more vehicles in household, the demographic groups most similar to Immigrants from Saudi Arabia are Immigrants from Hungary (54.2%, a difference of 0.010%), Immigrants from Chile (54.2%, a difference of 0.030%), Egyptian (54.3%, a difference of 0.060%), Immigrants from Bulgaria (54.3%, a difference of 0.060%), and Turkish (54.3%, a difference of 0.15%).
| Demographics | Rating | Rank | 2 or more Vehicles in Household |
| Immigrants from Peru | 14.3 /100 | #203 | Poor 54.4% |
| Immigrants from Belgium | 13.7 /100 | #204 | Poor 54.3% |
| Cheyenne | 13.6 /100 | #205 | Poor 54.3% |
| Immigrants from Latin America | 13.1 /100 | #206 | Poor 54.3% |
| Turks | 13.0 /100 | #207 | Poor 54.3% |
| Egyptians | 12.0 /100 | #208 | Poor 54.3% |
| Immigrants from Bulgaria | 12.0 /100 | #209 | Poor 54.3% |
| Immigrants from Saudi Arabia | 11.3 /100 | #210 | Poor 54.2% |
| Immigrants from Hungary | 11.3 /100 | #211 | Poor 54.2% |
| Immigrants from Chile | 11.1 /100 | #212 | Poor 54.2% |
| Guatemalans | 9.6 /100 | #213 | Tragic 54.1% |
| Immigrants from Czechoslovakia | 9.4 /100 | #214 | Tragic 54.1% |
| Aleuts | 9.3 /100 | #215 | Tragic 54.1% |
| Immigrants from Western Asia | 9.3 /100 | #216 | Tragic 54.1% |
| Immigrants from Burma/Myanmar | 7.1 /100 | #217 | Tragic 53.9% |
Immigrants from Saudi Arabia 2 or more Vehicles in Household Correlation Summary
| Measurement | Immigrants from Saudi Arabia Data | 2 or more Vehicles in Household Data |
| Minimum | 0.033% | 42.1% |
| Maximum | 20.4% | 100.0% |
| Range | 20.4% | 57.9% |
| Mean | 2.6% | 62.5% |
| Median | 1.7% | 59.2% |
| Interquartile 25% (IQ1) | 0.82% | 54.4% |
| Interquartile 75% (IQ3) | 2.8% | 67.0% |
| Interquartile Range (IQR) | 1.9% | 12.6% |
| Standard Deviation (Sample) | 3.7% | 13.8% |
| Standard Deviation (Population) | 3.6% | 13.6% |
Correlation Details
| Immigrants from Saudi Arabia Percentile | Sample Size | 2 or more Vehicles in Household |
[ 0.0% - 0.5% ] 0.033% | 134,794,511 | 50.7% |
[ 0.0% - 0.5% ] 0.14% | 17,145,593 | 55.7% |
[ 0.0% - 0.5% ] 0.25% | 5,657,969 | 55.3% |
[ 0.0% - 0.5% ] 0.35% | 2,779,839 | 55.1% |
[ 0.0% - 0.5% ] 0.45% | 1,355,364 | 56.6% |
[ 0.5% - 1.0% ] 0.55% | 623,842 | 48.2% |
[ 0.5% - 1.0% ] 0.66% | 428,760 | 56.5% |
[ 0.5% - 1.0% ] 0.77% | 509,278 | 60.8% |
[ 0.5% - 1.0% ] 0.87% | 171,386 | 65.6% |
[ 0.5% - 1.0% ] 0.98% | 225,155 | 52.4% |
[ 1.0% - 1.5% ] 1.06% | 216,523 | 64.2% |
[ 1.0% - 1.5% ] 1.18% | 72,351 | 69.5% |
[ 1.0% - 1.5% ] 1.31% | 45,520 | 51.7% |
[ 1.0% - 1.5% ] 1.45% | 23,317 | 57.8% |
[ 1.5% - 2.0% ] 1.59% | 6,287 | 62.6% |
[ 1.5% - 2.0% ] 1.66% | 11,877 | 68.4% |
[ 1.5% - 2.0% ] 1.74% | 36,208 | 54.8% |
[ 1.5% - 2.0% ] 1.87% | 18,311 | 47.8% |
[ 2.0% - 2.5% ] 2.06% | 7,654 | 71.0% |
[ 2.0% - 2.5% ] 2.19% | 10,588 | 56.6% |
[ 2.0% - 2.5% ] 2.27% | 13,814 | 54.1% |
[ 2.0% - 2.5% ] 2.42% | 9,691 | 60.6% |
[ 2.5% - 3.0% ] 2.62% | 21,000 | 61.2% |
[ 2.5% - 3.0% ] 2.71% | 8,658 | 63.9% |
[ 2.5% - 3.0% ] 2.79% | 3,983 | 42.1% |
[ 2.5% - 3.0% ] 2.98% | 8,650 | 74.2% |
[ 3.0% - 3.5% ] 3.11% | 5,088 | 62.0% |
[ 3.0% - 3.5% ] 3.25% | 1,786 | 77.7% |
[ 3.5% - 4.0% ] 3.62% | 525 | 90.4% |
[ 6.0% - 6.5% ] 6.15% | 439 | 51.0% |
[ 8.5% - 9.0% ] 8.82% | 68 | 100.0% |
[ 20.0% - 20.5% ] 20.41% | 49 | 100.0% |