Lumbee vs Colombian 2 or more Vehicles in Household
COMPARE
Lumbee
Colombian
2 or more Vehicles in Household
2 or more Vehicles in Household Comparison
Lumbee
Colombians
55.9%
2 OR MORE VEHICLES IN HOUSEHOLD
71.9/ 100
METRIC RATING
153rd/ 347
METRIC RANK
52.9%
2 OR MORE VEHICLES IN HOUSEHOLD
1.1/ 100
METRIC RATING
248th/ 347
METRIC RANK
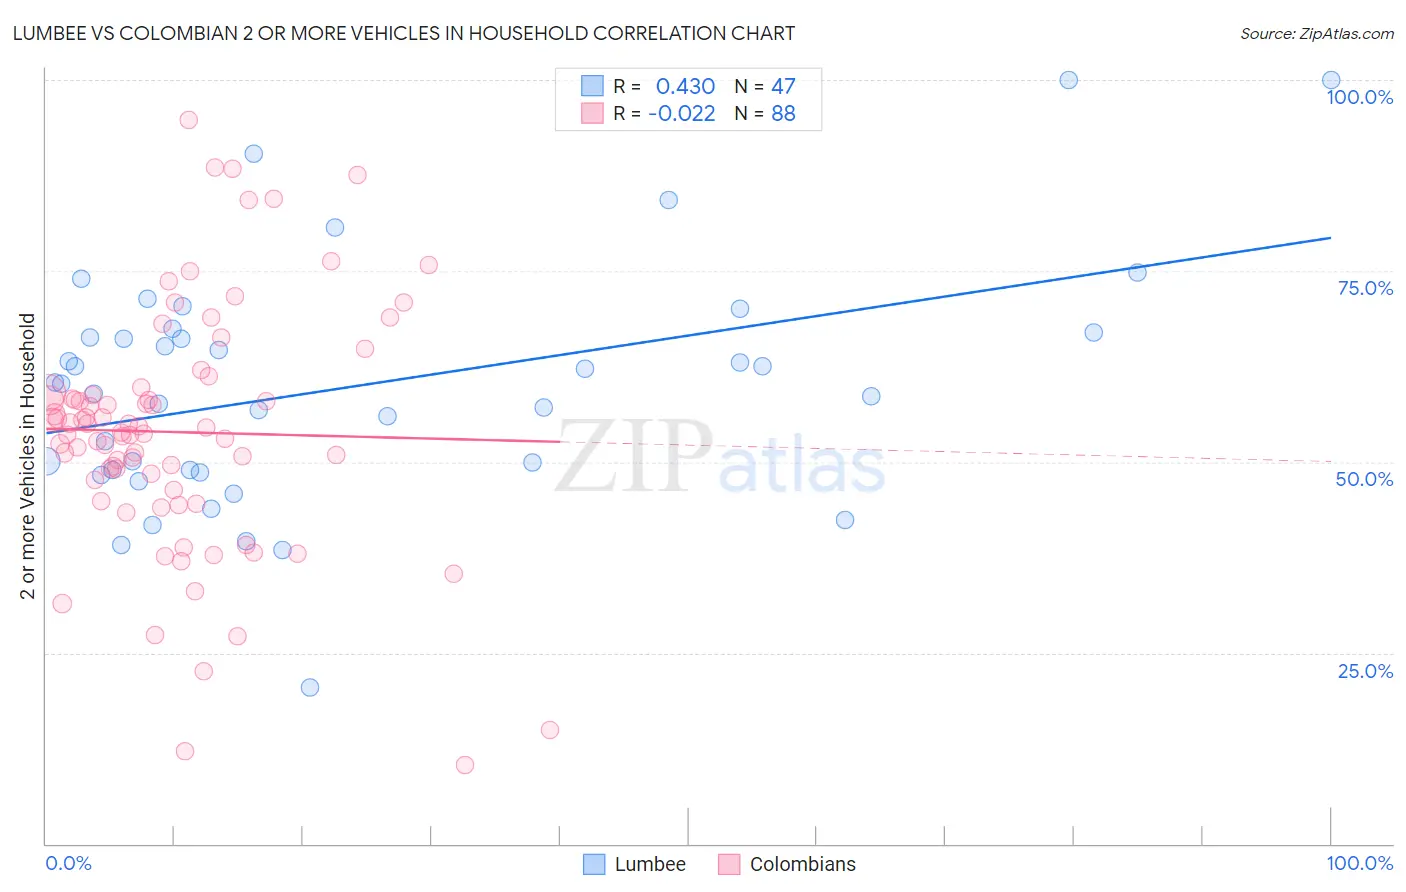
Lumbee vs Colombian 2 or more Vehicles in Household Correlation Chart
The statistical analysis conducted on geographies consisting of 92,265,071 people shows a moderate positive correlation between the proportion of Lumbee and percentage of households with 2 or more vehicles available in the United States with a correlation coefficient (R) of 0.430 and weighted average of 55.9%. Similarly, the statistical analysis conducted on geographies consisting of 419,364,720 people shows no correlation between the proportion of Colombians and percentage of households with 2 or more vehicles available in the United States with a correlation coefficient (R) of -0.022 and weighted average of 52.9%, a difference of 5.7%.
2 or more Vehicles in Household Correlation Summary
| Measurement | Lumbee | Colombian |
| Minimum | 20.5% | 10.3% |
| Maximum | 100.0% | 94.8% |
| Range | 79.5% | 84.5% |
| Mean | 59.9% | 53.9% |
| Median | 60.3% | 54.2% |
| Interquartile 25% (IQ1) | 48.9% | 46.9% |
| Interquartile 75% (IQ3) | 67.0% | 58.9% |
| Interquartile Range (IQR) | 18.1% | 12.0% |
| Standard Deviation (Sample) | 15.6% | 16.1% |
| Standard Deviation (Population) | 15.5% | 16.0% |
Similar Demographics by 2 or more Vehicles in Household
Demographics Similar to Lumbee by 2 or more Vehicles in Household
In terms of 2 or more vehicles in household, the demographic groups most similar to Lumbee are Ukrainian (55.8%, a difference of 0.060%), Immigrants from Venezuela (55.8%, a difference of 0.060%), Immigrants from Lithuania (55.8%, a difference of 0.070%), Immigrants from Kuwait (55.8%, a difference of 0.080%), and Tlingit-Haida (55.8%, a difference of 0.16%).
| Demographics | Rating | Rank | 2 or more Vehicles in Household |
| Venezuelans | 80.7 /100 | #146 | Excellent 56.1% |
| Serbians | 80.3 /100 | #147 | Excellent 56.1% |
| Immigrants | Moldova | 80.2 /100 | #148 | Excellent 56.1% |
| Chileans | 80.2 /100 | #149 | Excellent 56.1% |
| Nicaraguans | 79.9 /100 | #150 | Good 56.1% |
| Immigrants | Northern Europe | 78.7 /100 | #151 | Good 56.1% |
| Immigrants | Pakistan | 78.1 /100 | #152 | Good 56.1% |
| Lumbee | 71.9 /100 | #153 | Good 55.9% |
| Ukrainians | 70.8 /100 | #154 | Good 55.8% |
| Immigrants | Venezuela | 70.7 /100 | #155 | Good 55.8% |
| Immigrants | Lithuania | 70.4 /100 | #156 | Good 55.8% |
| Immigrants | Kuwait | 70.2 /100 | #157 | Good 55.8% |
| Tlingit-Haida | 68.5 /100 | #158 | Good 55.8% |
| Paiute | 68.0 /100 | #159 | Good 55.8% |
| Crow | 67.0 /100 | #160 | Good 55.7% |
Demographics Similar to Colombians by 2 or more Vehicles in Household
In terms of 2 or more vehicles in household, the demographic groups most similar to Colombians are Immigrants from Brazil (52.8%, a difference of 0.060%), Mongolian (52.8%, a difference of 0.060%), Immigrants from Sudan (52.8%, a difference of 0.090%), Immigrants from Portugal (52.8%, a difference of 0.10%), and Sierra Leonean (52.9%, a difference of 0.12%).
| Demographics | Rating | Rank | 2 or more Vehicles in Household |
| Immigrants | Sierra Leone | 2.1 /100 | #241 | Tragic 53.2% |
| Immigrants | Eastern Asia | 2.1 /100 | #242 | Tragic 53.2% |
| Ethiopians | 1.7 /100 | #243 | Tragic 53.1% |
| Indians (Asian) | 1.7 /100 | #244 | Tragic 53.1% |
| Immigrants | Ethiopia | 1.5 /100 | #245 | Tragic 53.0% |
| Immigrants | Nigeria | 1.2 /100 | #246 | Tragic 52.9% |
| Sierra Leoneans | 1.2 /100 | #247 | Tragic 52.9% |
| Colombians | 1.1 /100 | #248 | Tragic 52.9% |
| Immigrants | Brazil | 1.0 /100 | #249 | Tragic 52.8% |
| Mongolians | 1.0 /100 | #250 | Tragic 52.8% |
| Immigrants | Sudan | 1.0 /100 | #251 | Tragic 52.8% |
| Immigrants | Portugal | 1.0 /100 | #252 | Tragic 52.8% |
| Nigerians | 0.9 /100 | #253 | Tragic 52.8% |
| Immigrants | Malaysia | 0.8 /100 | #254 | Tragic 52.7% |
| Uruguayans | 0.7 /100 | #255 | Tragic 52.7% |