Immigrants from Netherlands 2 or more Vehicles in Household

COMPARE

Immigrants from Netherlands
Race
Ancestry
AfghanAfricanAlaska NativeAlaskan AthabascanAlbanianAleutAlsatianAmericanApacheArabArapahoArgentineanArmenianAssyrian/Chaldean/SyriacAustralianAustrianBahamianBangladeshiBarbadianBasqueBelgianBelizeanBermudanBhutaneseBlackfeetBolivianBrazilianBritishBritish West IndianBulgarianBurmeseCajunCambodianCanadianCape VerdeanCarpatho RusynCelticCentral AmericanCentral American IndianCherokeeCheyenneChickasawChileanChineseChippewaChoctawColombianColvilleComancheCosta RicanCreeCreekCroatianCrowCubanCypriotCzechCzechoslovakianDanishDelawareDominicanDutchDutch West IndianEastern EuropeanEcuadorianEgyptianEnglishEstonianEthiopianEuropeanFijianFilipinoFinnishFrenchFrench American IndianFrench CanadianGermanGerman RussianGhanaianGreekGuamanian/ChamorroGuatemalanGuyaneseHaitianHmongHonduranHopiHoumaHungarianIcelanderIndian (Asian)IndonesianInupiatIranianIraqiIrishIroquoisIsraeliItalianJamaicanJapaneseJordanianKenyanKiowaKoreanLaotianLatvianLebaneseLiberianLithuanianLumbeeLuxembourgerMacedonianMalaysianMalteseMarshalleseMenomineeMexicanMexican American IndianMongolianMoroccanNative HawaiianNavajoNepaleseNew ZealanderNicaraguanNigerianNorthern EuropeanNorwegianOkinawanOsageOttawaPaiutePakistaniPalestinianPanamanianParaguayanPennsylvania GermanPeruvianPimaPolishPortuguesePotawatomiPuebloPuerto RicanPuget Sound SalishRomanianRussianSalvadoranSamoanScandinavianScotch-IrishScottishSeminoleSenegaleseSerbianShoshoneSierra LeoneanSiouxSlavicSlovakSloveneSomaliSouth AfricanSouth AmericanSouth American IndianSoviet UnionSpaniardSpanishSpanish AmericanSpanish American IndianSri LankanSubsaharan AfricanSudaneseSwedishSwissSyrianTaiwaneseThaiTlingit-HaidaTohono O'OdhamTonganTrinidadian and TobagonianTsimshianTurkishU.S. Virgin IslanderUgandanUkrainianUruguayanUteVenezuelanVietnameseWelshWest IndianYakamaYaquiYugoslavianYumanYup'ikZimbabwean
Immigration
NonimmigrantsImmigrantsAfghanistanAfricaAlbaniaArgentinaArmeniaAsiaAustraliaAustriaBahamasBangladeshBarbadosBelarusBelgiumBelizeBoliviaBosnia and HerzegovinaBrazilBulgariaBurma/MyanmarCabo VerdeCambodiaCameroonCanadaCaribbeanCentral AmericaChileChinaColombiaCongoCosta RicaCroatiaCubaCzechoslovakiaDenmarkDominicaDominican RepublicEastern AfricaEastern AsiaEastern EuropeEcuadorEgyptEl SalvadorEnglandEritreaEthiopiaEuropeFijiFranceGermanyGhanaGreeceGrenadaGuatemalaGuyanaHaitiHondurasHong KongHungaryIndiaIndonesiaIranIraqIrelandIsraelItalyJamaicaJapanJordanKazakhstanKenyaKoreaKuwaitLaosLatin AmericaLatviaLebanonLiberiaLithuaniaMalaysiaMexicoMicronesiaMiddle AfricaMoldovaMoroccoNepalNetherlandsNicaraguaNigeriaNorth AmericaNorth MacedoniaNorthern AfricaNorthern EuropeNorwayOceaniaPakistanPanamaPeruPhilippinesPolandPortugalRomaniaRussiaSaudi ArabiaScotlandSenegalSerbiaSierra LeoneSingaporeSomaliaSouth AfricaSouth AmericaSouth Central AsiaSouth Eastern AsiaSouthern EuropeSpainSri LankaSt. Vincent and the GrenadinesSudanSwedenSwitzerlandSyriaTaiwanThailandTrinidad and TobagoTurkeyUgandaUkraineUruguayUzbekistanVenezuelaVietnamWest IndiesWestern AfricaWestern AsiaWestern EuropeYemenZaireZimbabweAzores
Select to Compare
Race
Ancestry
AfghanAfricanAlaska NativeAlaskan AthabascanAlbanianAleutAlsatianAmericanApacheArabArapahoArgentineanArmenianAssyrian/Chaldean/SyriacAustralianAustrianBahamianBangladeshiBarbadianBasqueBelgianBelizeanBermudanBhutaneseBlackfeetBolivianBrazilianBritishBritish West IndianBulgarianBurmeseCajunCambodianCanadianCape VerdeanCarpatho RusynCelticCentral AmericanCentral American IndianCherokeeCheyenneChickasawChileanChineseChippewaChoctawColombianColvilleComancheCosta RicanCreeCreekCroatianCrowCubanCypriotCzechCzechoslovakianDanishDelawareDominicanDutchDutch West IndianEastern EuropeanEcuadorianEgyptianEnglishEstonianEthiopianEuropeanFijianFilipinoFinnishFrenchFrench American IndianFrench CanadianGermanGerman RussianGhanaianGreekGuamanian/ChamorroGuatemalanGuyaneseHaitianHmongHonduranHopiHoumaHungarianIcelanderIndian (Asian)IndonesianInupiatIranianIraqiIrishIroquoisIsraeliItalianJamaicanJapaneseJordanianKenyanKiowaKoreanLaotianLatvianLebaneseLiberianLithuanianLumbeeLuxembourgerMacedonianMalaysianMalteseMarshalleseMenomineeMexicanMexican American IndianMongolianMoroccanNative HawaiianNavajoNepaleseNew ZealanderNicaraguanNigerianNorthern EuropeanNorwegianOkinawanOsageOttawaPaiutePakistaniPalestinianPanamanianParaguayanPennsylvania GermanPeruvianPimaPolishPortuguesePotawatomiPuebloPuerto RicanPuget Sound SalishRomanianRussianSalvadoranSamoanScandinavianScotch-IrishScottishSeminoleSenegaleseSerbianShoshoneSierra LeoneanSiouxSlavicSlovakSloveneSomaliSouth AfricanSouth AmericanSouth American IndianSoviet UnionSpaniardSpanishSpanish AmericanSpanish American IndianSri LankanSubsaharan AfricanSudaneseSwedishSwissSyrianTaiwaneseThaiTlingit-HaidaTohono O'OdhamTonganTrinidadian and TobagonianTsimshianTurkishU.S. Virgin IslanderUgandanUkrainianUruguayanUteVenezuelanVietnameseWelshWest IndianYakamaYaquiYugoslavianYumanYup'ikZimbabwean
Immigration
NonimmigrantsImmigrantsAfghanistanAfricaAlbaniaArgentinaArmeniaAsiaAustraliaAustriaBahamasBangladeshBarbadosBelarusBelgiumBelizeBoliviaBosnia and HerzegovinaBrazilBulgariaBurma/MyanmarCabo VerdeCambodiaCameroonCanadaCaribbeanCentral AmericaChileChinaColombiaCongoCosta RicaCroatiaCubaCzechoslovakiaDenmarkDominicaDominican RepublicEastern AfricaEastern AsiaEastern EuropeEcuadorEgyptEl SalvadorEnglandEritreaEthiopiaEuropeFijiFranceGermanyGhanaGreeceGrenadaGuatemalaGuyanaHaitiHondurasHong KongHungaryIndiaIndonesiaIranIraqIrelandIsraelItalyJamaicaJapanJordanKazakhstanKenyaKoreaKuwaitLaosLatin AmericaLatviaLebanonLiberiaLithuaniaMalaysiaMexicoMicronesiaMiddle AfricaMoldovaMoroccoNepalNicaraguaNigeriaNorth AmericaNorth MacedoniaNorthern AfricaNorthern EuropeNorwayOceaniaPakistanPanamaPeruPhilippinesPolandPortugalRomaniaRussiaSaudi ArabiaScotlandSenegalSerbiaSierra LeoneSingaporeSomaliaSouth AfricaSouth AmericaSouth Central AsiaSouth Eastern AsiaSouthern EuropeSpainSri LankaSt. Vincent and the GrenadinesSudanSwedenSwitzerlandSyriaTaiwanThailandTrinidad and TobagoTurkeyUgandaUkraineUruguayUzbekistanVenezuelaVietnamWest IndiesWestern AfricaWestern AsiaWestern EuropeYemenZaireZimbabweAzores
2 or more Vehicles in Household
Income
Poverty
Unemployment
Labor Participation
Family Structure
Vehicle Availability
Education Level
Disability

Immigrants from Netherlands 2 or more Vehicles in Household
Exceptional

57.5%
2+ VEHICLES AVAILABLE
98.2/ 100
METRIC RATING
107th/ 347
METRIC RANK

Immigrants from Netherlands 2 or more Vehicles in Household Correlation Chart

The statistical analysis conducted on geographies consisting of 237,817,219 people shows a weak negative correlation between the proportion of Immigrants from Netherlands and percentage of households with 2 or more vehicles available in the United States with a correlation coefficient (R) of -0.250 and weighted average of 57.5%. On average, for every 1% (one percent) increase in Immigrants from Netherlands within a typical geography, there is a decrease of 0.57% in percentage of households with 2 or more vehicles available.
Immigrants from Netherlands 2 or more Vehicles in Household
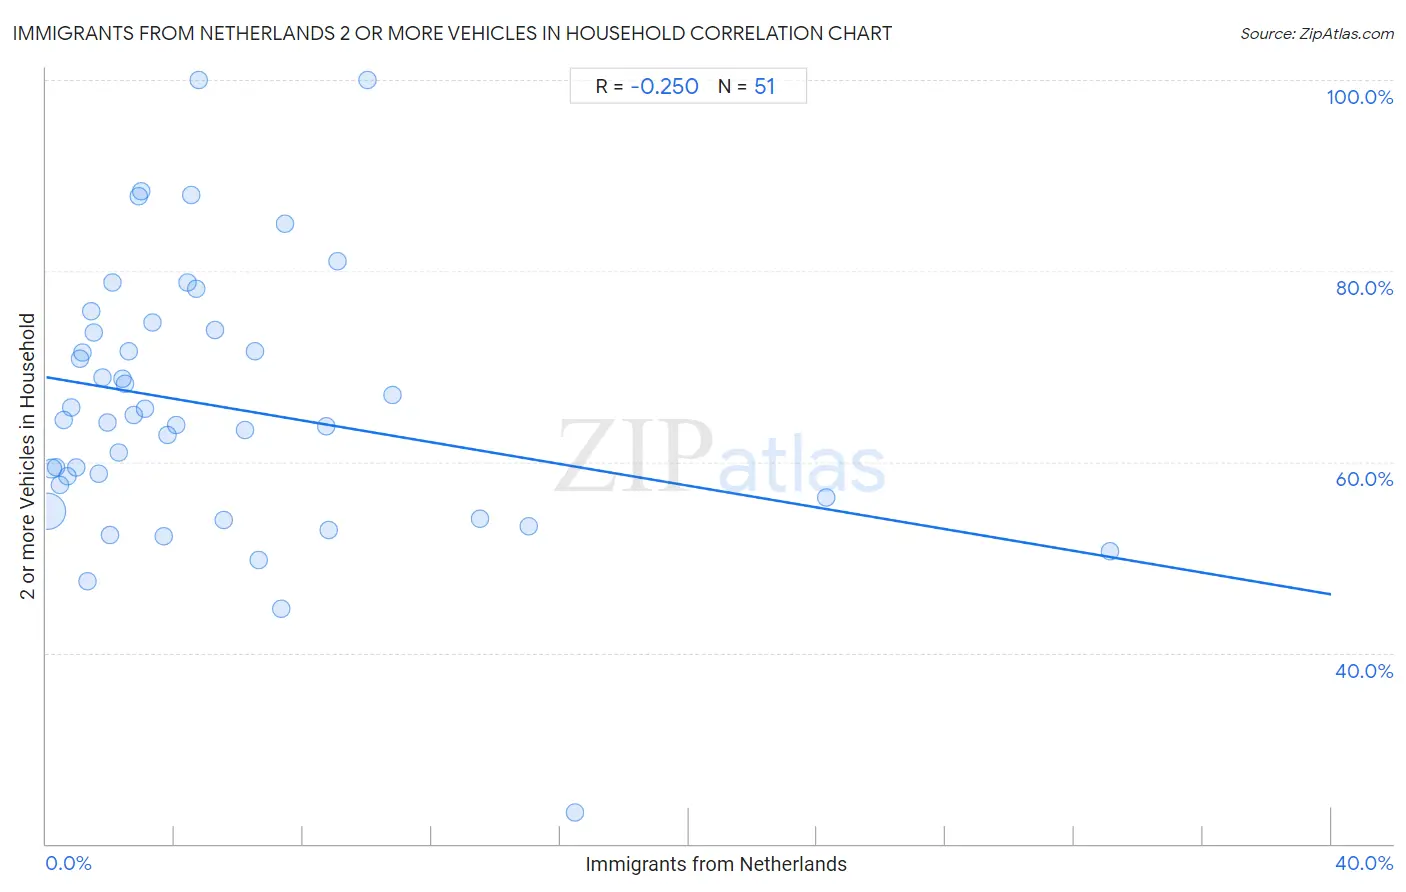
It is essential to understand that the correlation between the percentage of Immigrants from Netherlands and percentage of households with 2 or more vehicles available does not imply a direct cause-and-effect relationship. It remains uncertain whether the presence of Immigrants from Netherlands influences an upward or downward trend in the level of percentage of households with 2 or more vehicles available within an area, or if Immigrants from Netherlands simply ended up residing in those areas with higher or lower levels of percentage of households with 2 or more vehicles available due to other factors.

Demographics Similar to Immigrants from Netherlands by 2 or more Vehicles in Household

In terms of 2 or more vehicles in household, the demographic groups most similar to Immigrants from Netherlands are Immigrants from Canada (57.5%, a difference of 0.010%), Immigrants from Oceania (57.5%, a difference of 0.020%), Immigrants from Korea (57.6%, a difference of 0.030%), Immigrants from Bolivia (57.6%, a difference of 0.040%), and Jordanian (57.6%, a difference of 0.040%).
DemographicsRating | Rank2 or more Vehicles in Household
Fijians
98.4
/100
|
#100
Exceptional
57.6%
Lebanese
98.3
/100
|
#101
Exceptional
57.6%
Immigrants from Bolivia
98.2
/100
|
#102
Exceptional
57.6%
Jordanians
98.2
/100
|
#103
Exceptional
57.6%
Immigrants from Indonesia
98.2
/100
|
#104
Exceptional
57.6%
Immigrants from Korea
98.2
/100
|
#105
Exceptional
57.6%
Immigrants from Oceania
98.2
/100
|
#106
Exceptional
57.5%
Immigrants from Netherlands
98.2
/100
|
#107
Exceptional
57.5%
Immigrants from Canada
98.1
/100
|
#108
Exceptional
57.5%
Immigrants from North America
98.1
/100
|
#109
Exceptional
57.5%
Japanese
98.0
/100
|
#110
Exceptional
57.5%
Greeks
98.0
/100
|
#111
Exceptional
57.5%
Pueblo
98.0
/100
|
#112
Exceptional
57.5%
Zimbabweans
96.9
/100
|
#113
Exceptional
57.2%
Immigrants from Lebanon
96.8
/100
|
#114
Exceptional
57.2%

Immigrants from Netherlands 2 or more Vehicles in Household Correlation Summary

MeasurementImmigrants from Netherlands Data2 or more Vehicles in Household Data
Minimum0.037%23.3%
Maximum33.1%100.0%
Range33.1%76.7%
Mean5.3%65.9%
Median3.1%64.4%
Interquartile 25% (IQ1)1.5%56.2%
Interquartile 75% (IQ3)6.6%73.9%
Interquartile Range (IQR)5.1%17.6%
Standard Deviation (Sample)6.2%14.1%
Standard Deviation (Population)6.1%14.0%

Correlation Details

Immigrants from Netherlands PercentileSample Size2 or more Vehicles in Household
[
0.0%
-
0.5%
]
0.037%
210,937,56354.8%
[
0.0%
-
0.5%
]
0.17%
18,895,63459.3%
[
0.0%
-
0.5%
]
0.29%
4,451,19459.5%
[
0.0%
-
0.5%
]
0.42%
1,583,20357.5%
[
0.5%
-
1.0%
]
0.54%
651,94064.4%
[
0.5%
-
1.0%
]
0.67%
371,91558.5%
[
0.5%
-
1.0%
]
0.79%
349,37965.6%
[
0.5%
-
1.0%
]
0.93%
99,89459.4%
[
1.0%
-
1.5%
]
1.05%
125,94570.8%
[
1.0%
-
1.5%
]
1.15%
69,93971.4%
[
1.0%
-
1.5%
]
1.29%
49,47947.5%
[
1.0%
-
1.5%
]
1.40%
55,91175.8%
[
1.0%
-
1.5%
]
1.49%
35,09373.5%
[
1.5%
-
2.0%
]
1.64%
15,95658.7%
[
1.5%
-
2.0%
]
1.74%
11,10168.8%
[
1.5%
-
2.0%
]
1.89%
6,02064.1%
[
1.5%
-
2.0%
]
2.00%
12,06452.4%
[
2.0%
-
2.5%
]
2.07%
25,11578.8%
[
2.0%
-
2.5%
]
2.24%
3,97661.0%
[
2.0%
-
2.5%
]
2.38%
15,14168.8%
[
2.0%
-
2.5%
]
2.45%
5,09768.2%
[
2.5%
-
3.0%
]
2.57%
7,47171.6%
[
2.5%
-
3.0%
]
2.72%
6,13364.9%
[
2.5%
-
3.0%
]
2.89%
2,52787.8%
[
2.5%
-
3.0%
]
2.97%
67388.4%
[
3.0%
-
3.5%
]
3.07%
5,36765.6%
[
3.0%
-
3.5%
]
3.30%
36474.6%
[
3.5%
-
4.0%
]
3.67%
40952.2%
[
3.5%
-
4.0%
]
3.78%
1,82662.9%
[
4.0%
-
4.5%
]
4.04%
4,16163.8%
[
4.0%
-
4.5%
]
4.39%
1,14078.8%
[
4.5%
-
5.0%
]
4.53%
2,71788.0%
[
4.5%
-
5.0%
]
4.68%
2,77878.1%
[
4.5%
-
5.0%
]
4.76%
315100.0%
[
5.0%
-
5.5%
]
5.23%
1,77773.9%
[
5.5%
-
6.0%
]
5.53%
77853.9%
[
6.0%
-
6.5%
]
6.18%
1,35963.3%
[
6.5%
-
7.0%
]
6.50%
44671.6%
[
6.5%
-
7.0%
]
6.60%
80349.8%
[
7.0%
-
7.5%
]
7.30%
17844.7%
[
7.0%
-
7.5%
]
7.43%
99684.9%
[
8.5%
-
9.0%
]
8.72%
96363.7%
[
8.5%
-
9.0%
]
8.79%
42152.9%
[
9.0%
-
9.5%
]
9.05%
43181.1%
[
10.0%
-
10.5%
]
10.00%
50100.0%
[
10.5%
-
11.0%
]
10.77%
19567.0%
[
13.5%
-
14.0%
]
13.51%
7454.1%
[
15.0%
-
15.5%
]
15.04%
83853.3%
[
16.0%
-
16.5%
]
16.44%
22523.3%
[
24.0%
-
24.5%
]
24.27%
10356.2%
[
33.0%
-
33.5%
]
33.10%
14250.6%