Immigrants from Sierra Leone 2 or more Vehicles in Household
COMPARE
Immigrants from Sierra Leone
Select to Compare
2 or more Vehicles in Household
Immigrants from Sierra Leone 2 or more Vehicles in Household
53.2%
2+ VEHICLES AVAILABLE
2.1/ 100
METRIC RATING
241st/ 347
METRIC RANK
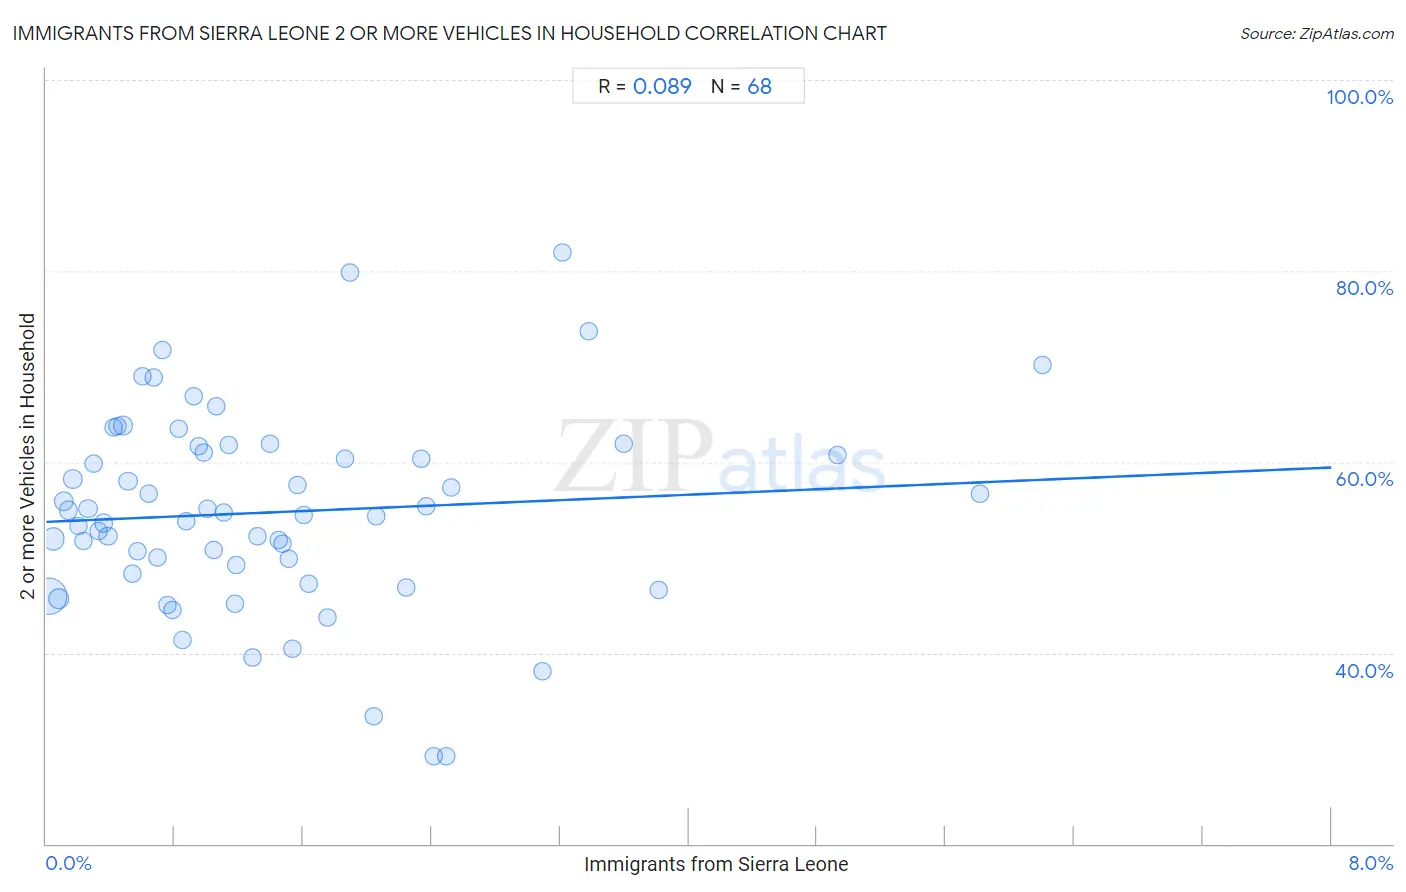
Immigrants from Sierra Leone 2 or more Vehicles in Household Correlation Chart
The statistical analysis conducted on geographies consisting of 101,647,201 people shows a slight positive correlation between the proportion of Immigrants from Sierra Leone and percentage of households with 2 or more vehicles available in the United States with a correlation coefficient (R) of 0.089 and weighted average of 53.2%. On average, for every 1% (one percent) increase in Immigrants from Sierra Leone within a typical geography, there is an increase of 0.71% in percentage of households with 2 or more vehicles available.
It is essential to understand that the correlation between the percentage of Immigrants from Sierra Leone and percentage of households with 2 or more vehicles available does not imply a direct cause-and-effect relationship. It remains uncertain whether the presence of Immigrants from Sierra Leone influences an upward or downward trend in the level of percentage of households with 2 or more vehicles available within an area, or if Immigrants from Sierra Leone simply ended up residing in those areas with higher or lower levels of percentage of households with 2 or more vehicles available due to other factors.
Demographics Similar to Immigrants from Sierra Leone by 2 or more Vehicles in Household
In terms of 2 or more vehicles in household, the demographic groups most similar to Immigrants from Sierra Leone are Immigrants from Eastern Asia (53.2%, a difference of 0.0%), Immigrants from Europe (53.2%, a difference of 0.030%), Immigrants from Armenia (53.3%, a difference of 0.10%), Cambodian (53.3%, a difference of 0.10%), and Macedonian (53.3%, a difference of 0.17%).
| Demographics | Rating | Rank | 2 or more Vehicles in Household |
| Immigrants from Switzerland | 3.0 /100 | #234 | Tragic 53.4% |
| Immigrants from Middle Africa | 3.0 /100 | #235 | Tragic 53.4% |
| Indonesians | 2.7 /100 | #236 | Tragic 53.4% |
| Macedonians | 2.4 /100 | #237 | Tragic 53.3% |
| Immigrants from Armenia | 2.3 /100 | #238 | Tragic 53.3% |
| Cambodians | 2.3 /100 | #239 | Tragic 53.3% |
| Immigrants from Europe | 2.1 /100 | #240 | Tragic 53.2% |
| Immigrants from Sierra Leone | 2.1 /100 | #241 | Tragic 53.2% |
| Immigrants from Eastern Asia | 2.1 /100 | #242 | Tragic 53.2% |
| Ethiopians | 1.7 /100 | #243 | Tragic 53.1% |
| Indians (Asian) | 1.7 /100 | #244 | Tragic 53.1% |
| Immigrants from Ethiopia | 1.5 /100 | #245 | Tragic 53.0% |
| Immigrants from Nigeria | 1.2 /100 | #246 | Tragic 52.9% |
| Sierra Leoneans | 1.2 /100 | #247 | Tragic 52.9% |
| Colombians | 1.1 /100 | #248 | Tragic 52.9% |
Immigrants from Sierra Leone 2 or more Vehicles in Household Correlation Summary
| Measurement | Immigrants from Sierra Leone Data | 2 or more Vehicles in Household Data |
| Minimum | 0.014% | 29.1% |
| Maximum | 6.2% | 81.9% |
| Range | 6.2% | 52.8% |
| Mean | 1.4% | 54.7% |
| Median | 1.1% | 54.6% |
| Interquartile 25% (IQ1) | 0.52% | 48.7% |
| Interquartile 75% (IQ3) | 1.9% | 61.3% |
| Interquartile Range (IQR) | 1.4% | 12.6% |
| Standard Deviation (Sample) | 1.3% | 10.4% |
| Standard Deviation (Population) | 1.3% | 10.3% |
Correlation Details
| Immigrants from Sierra Leone Percentile | Sample Size | 2 or more Vehicles in Household |
[ 0.0% - 0.5% ] 0.014% | 59,331,558 | 45.9% |
[ 0.0% - 0.5% ] 0.044% | 14,637,289 | 52.0% |
[ 0.0% - 0.5% ] 0.077% | 7,927,916 | 45.7% |
[ 0.0% - 0.5% ] 0.11% | 3,818,673 | 55.9% |
[ 0.0% - 0.5% ] 0.14% | 2,452,856 | 54.9% |
[ 0.0% - 0.5% ] 0.17% | 1,937,557 | 58.2% |
[ 0.0% - 0.5% ] 0.20% | 1,614,728 | 53.3% |
[ 0.0% - 0.5% ] 0.23% | 2,108,030 | 51.7% |
[ 0.0% - 0.5% ] 0.26% | 515,501 | 55.1% |
[ 0.0% - 0.5% ] 0.29% | 596,988 | 59.8% |
[ 0.0% - 0.5% ] 0.32% | 1,001,569 | 52.7% |
[ 0.0% - 0.5% ] 0.36% | 417,881 | 53.6% |
[ 0.0% - 0.5% ] 0.38% | 453,562 | 52.3% |
[ 0.0% - 0.5% ] 0.42% | 330,557 | 63.6% |
[ 0.0% - 0.5% ] 0.45% | 425,192 | 63.7% |
[ 0.0% - 0.5% ] 0.48% | 500,099 | 63.8% |
[ 0.5% - 1.0% ] 0.51% | 316,254 | 58.0% |
[ 0.5% - 1.0% ] 0.54% | 357,812 | 48.3% |
[ 0.5% - 1.0% ] 0.57% | 309,343 | 50.7% |
[ 0.5% - 1.0% ] 0.60% | 55,303 | 68.9% |
[ 0.5% - 1.0% ] 0.64% | 206,121 | 56.7% |
[ 0.5% - 1.0% ] 0.67% | 97,497 | 68.9% |
[ 0.5% - 1.0% ] 0.70% | 116,177 | 50.0% |
[ 0.5% - 1.0% ] 0.72% | 167,473 | 71.7% |
[ 0.5% - 1.0% ] 0.76% | 123,699 | 45.0% |
[ 0.5% - 1.0% ] 0.79% | 110,125 | 44.5% |
[ 0.5% - 1.0% ] 0.82% | 312,285 | 63.5% |
[ 0.5% - 1.0% ] 0.85% | 120,186 | 41.4% |
[ 0.5% - 1.0% ] 0.87% | 117,687 | 53.7% |
[ 0.5% - 1.0% ] 0.92% | 58,787 | 66.9% |
[ 0.5% - 1.0% ] 0.95% | 130,738 | 61.7% |
[ 0.5% - 1.0% ] 0.98% | 7,129 | 60.9% |
[ 1.0% - 1.5% ] 1.00% | 85,494 | 55.1% |
[ 1.0% - 1.5% ] 1.05% | 35,552 | 50.7% |
[ 1.0% - 1.5% ] 1.06% | 11,455 | 65.8% |
[ 1.0% - 1.5% ] 1.11% | 137,976 | 54.7% |
[ 1.0% - 1.5% ] 1.14% | 27,761 | 61.8% |
[ 1.0% - 1.5% ] 1.17% | 39,527 | 45.1% |
[ 1.0% - 1.5% ] 1.18% | 98,008 | 49.2% |
[ 1.0% - 1.5% ] 1.28% | 24,430 | 39.6% |
[ 1.0% - 1.5% ] 1.31% | 32,842 | 52.2% |
[ 1.0% - 1.5% ] 1.39% | 20,794 | 61.9% |
[ 1.0% - 1.5% ] 1.45% | 26,573 | 51.8% |
[ 1.0% - 1.5% ] 1.47% | 3,052 | 51.4% |
[ 1.5% - 2.0% ] 1.51% | 20,031 | 49.8% |
[ 1.5% - 2.0% ] 1.53% | 33,855 | 40.4% |
[ 1.5% - 2.0% ] 1.56% | 44,149 | 57.6% |
[ 1.5% - 2.0% ] 1.60% | 45,799 | 54.4% |
[ 1.5% - 2.0% ] 1.63% | 4,226 | 47.2% |
[ 1.5% - 2.0% ] 1.75% | 4,683 | 43.7% |
[ 1.5% - 2.0% ] 1.86% | 6,335 | 60.3% |
[ 1.5% - 2.0% ] 1.89% | 2,376 | 79.8% |
[ 2.0% - 2.5% ] 2.04% | 12,017 | 33.3% |
[ 2.0% - 2.5% ] 2.06% | 37,275 | 54.3% |
[ 2.0% - 2.5% ] 2.24% | 14,901 | 46.9% |
[ 2.0% - 2.5% ] 2.33% | 19,465 | 60.3% |
[ 2.0% - 2.5% ] 2.36% | 71,682 | 55.4% |
[ 2.0% - 2.5% ] 2.41% | 9,574 | 29.1% |
[ 2.0% - 2.5% ] 2.49% | 40,201 | 29.2% |
[ 2.5% - 3.0% ] 2.52% | 2,219 | 57.3% |
[ 3.0% - 3.5% ] 3.09% | 19,531 | 38.1% |
[ 3.0% - 3.5% ] 3.21% | 1,277 | 81.9% |
[ 3.0% - 3.5% ] 3.37% | 2,460 | 73.6% |
[ 3.5% - 4.0% ] 3.59% | 19,369 | 61.9% |
[ 3.5% - 4.0% ] 3.82% | 5,976 | 46.6% |
[ 4.5% - 5.0% ] 4.93% | 1,481 | 60.7% |
[ 5.5% - 6.0% ] 5.81% | 3,287 | 56.6% |
[ 6.0% - 6.5% ] 6.20% | 4,996 | 70.2% |