Colombian 2 or more Vehicles in Household
COMPARE
Colombian
Select to Compare
2 or more Vehicles in Household
Colombian 2 or more Vehicles in Household
52.9%
2+ VEHICLES AVAILABLE
1.1/ 100
METRIC RATING
248th/ 347
METRIC RANK
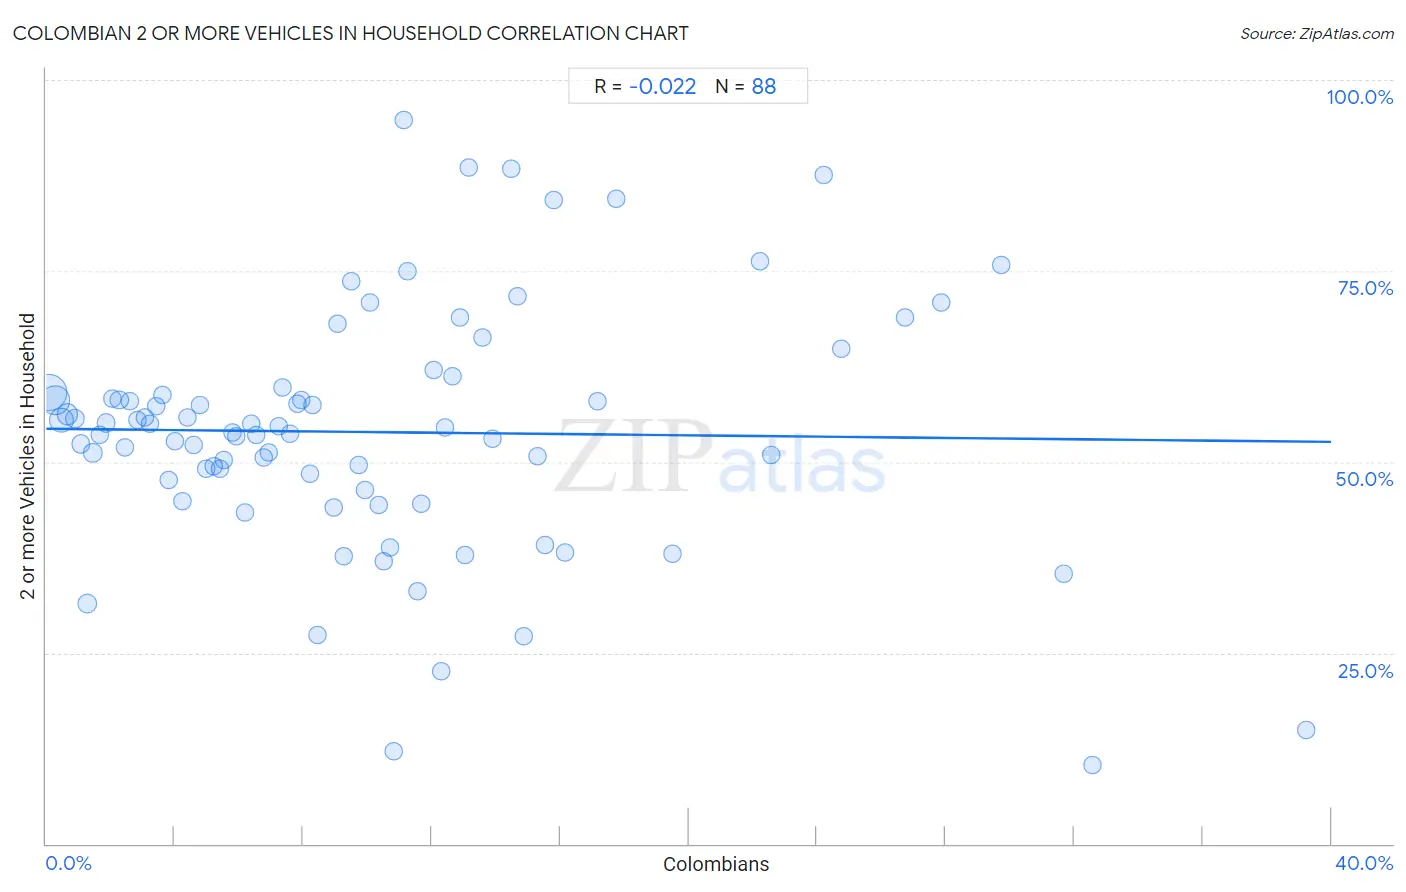
Colombian 2 or more Vehicles in Household Correlation Chart
The statistical analysis conducted on geographies consisting of 419,364,720 people shows no correlation between the proportion of Colombians and percentage of households with 2 or more vehicles available in the United States with a correlation coefficient (R) of -0.022 and weighted average of 52.9%. On average, for every 1% (one percent) increase in Colombians within a typical geography, there is a decrease of 0.043% in percentage of households with 2 or more vehicles available.
It is essential to understand that the correlation between the percentage of Colombians and percentage of households with 2 or more vehicles available does not imply a direct cause-and-effect relationship. It remains uncertain whether the presence of Colombians influences an upward or downward trend in the level of percentage of households with 2 or more vehicles available within an area, or if Colombians simply ended up residing in those areas with higher or lower levels of percentage of households with 2 or more vehicles available due to other factors.
Demographics Similar to Colombians by 2 or more Vehicles in Household
In terms of 2 or more vehicles in household, the demographic groups most similar to Colombians are Immigrants from Brazil (52.8%, a difference of 0.060%), Mongolian (52.8%, a difference of 0.060%), Immigrants from Sudan (52.8%, a difference of 0.090%), Immigrants from Portugal (52.8%, a difference of 0.10%), and Sierra Leonean (52.9%, a difference of 0.12%).
| Demographics | Rating | Rank | 2 or more Vehicles in Household |
| Immigrants from Sierra Leone | 2.1 /100 | #241 | Tragic 53.2% |
| Immigrants from Eastern Asia | 2.1 /100 | #242 | Tragic 53.2% |
| Ethiopians | 1.7 /100 | #243 | Tragic 53.1% |
| Indians (Asian) | 1.7 /100 | #244 | Tragic 53.1% |
| Immigrants from Ethiopia | 1.5 /100 | #245 | Tragic 53.0% |
| Immigrants from Nigeria | 1.2 /100 | #246 | Tragic 52.9% |
| Sierra Leoneans | 1.2 /100 | #247 | Tragic 52.9% |
| Colombians | 1.1 /100 | #248 | Tragic 52.9% |
| Immigrants from Brazil | 1.0 /100 | #249 | Tragic 52.8% |
| Mongolians | 1.0 /100 | #250 | Tragic 52.8% |
| Immigrants from Sudan | 1.0 /100 | #251 | Tragic 52.8% |
| Immigrants from Portugal | 1.0 /100 | #252 | Tragic 52.8% |
| Nigerians | 0.9 /100 | #253 | Tragic 52.8% |
| Immigrants from Malaysia | 0.8 /100 | #254 | Tragic 52.7% |
| Uruguayans | 0.7 /100 | #255 | Tragic 52.7% |
Colombian 2 or more Vehicles in Household Correlation Summary
| Measurement | Colombian Data | 2 or more Vehicles in Household Data |
| Minimum | 0.096% | 10.3% |
| Maximum | 39.2% | 94.8% |
| Range | 39.1% | 84.5% |
| Mean | 10.3% | 53.9% |
| Median | 8.7% | 54.2% |
| Interquartile 25% (IQ1) | 4.3% | 46.9% |
| Interquartile 75% (IQ3) | 13.4% | 58.9% |
| Interquartile Range (IQR) | 9.0% | 12.0% |
| Standard Deviation (Sample) | 8.1% | 16.1% |
| Standard Deviation (Population) | 8.1% | 16.0% |
Correlation Details
| Colombian Percentile | Sample Size | 2 or more Vehicles in Household |
[ 0.0% - 0.5% ] 0.096% | 170,432,354 | 59.1% |
[ 0.0% - 0.5% ] 0.28% | 97,559,671 | 58.1% |
[ 0.0% - 0.5% ] 0.47% | 53,382,724 | 55.5% |
[ 0.5% - 1.0% ] 0.67% | 24,457,860 | 56.2% |
[ 0.5% - 1.0% ] 0.88% | 13,385,540 | 55.7% |
[ 1.0% - 1.5% ] 1.07% | 8,562,610 | 52.3% |
[ 1.0% - 1.5% ] 1.27% | 15,190,414 | 31.5% |
[ 1.0% - 1.5% ] 1.46% | 5,916,545 | 51.2% |
[ 1.5% - 2.0% ] 1.66% | 3,979,000 | 53.6% |
[ 1.5% - 2.0% ] 1.85% | 2,526,716 | 55.1% |
[ 2.0% - 2.5% ] 2.05% | 2,472,612 | 58.3% |
[ 2.0% - 2.5% ] 2.27% | 1,703,070 | 58.1% |
[ 2.0% - 2.5% ] 2.46% | 1,712,900 | 51.9% |
[ 2.5% - 3.0% ] 2.62% | 1,771,368 | 57.9% |
[ 2.5% - 3.0% ] 2.83% | 1,145,556 | 55.5% |
[ 3.0% - 3.5% ] 3.07% | 1,397,308 | 55.9% |
[ 3.0% - 3.5% ] 3.25% | 658,752 | 55.0% |
[ 3.0% - 3.5% ] 3.42% | 924,610 | 57.2% |
[ 3.5% - 4.0% ] 3.63% | 1,012,035 | 58.8% |
[ 3.5% - 4.0% ] 3.81% | 762,416 | 47.6% |
[ 3.5% - 4.0% ] 4.00% | 714,036 | 52.7% |
[ 4.0% - 4.5% ] 4.24% | 1,249,112 | 44.9% |
[ 4.0% - 4.5% ] 4.40% | 639,472 | 55.8% |
[ 4.5% - 5.0% ] 4.58% | 586,289 | 52.2% |
[ 4.5% - 5.0% ] 4.78% | 425,272 | 57.4% |
[ 4.5% - 5.0% ] 4.99% | 420,845 | 49.1% |
[ 5.0% - 5.5% ] 5.20% | 545,688 | 49.5% |
[ 5.0% - 5.5% ] 5.40% | 431,367 | 49.2% |
[ 5.5% - 6.0% ] 5.54% | 329,163 | 50.3% |
[ 5.5% - 6.0% ] 5.79% | 319,482 | 53.9% |
[ 5.5% - 6.0% ] 5.91% | 86,762 | 53.3% |
[ 6.0% - 6.5% ] 6.18% | 396,251 | 43.4% |
[ 6.0% - 6.5% ] 6.38% | 496,058 | 55.0% |
[ 6.5% - 7.0% ] 6.54% | 378,044 | 53.5% |
[ 6.5% - 7.0% ] 6.76% | 337,728 | 50.5% |
[ 6.5% - 7.0% ] 6.94% | 182,201 | 51.2% |
[ 7.0% - 7.5% ] 7.23% | 88,611 | 54.7% |
[ 7.0% - 7.5% ] 7.35% | 446,829 | 59.8% |
[ 7.5% - 8.0% ] 7.58% | 77,985 | 53.6% |
[ 7.5% - 8.0% ] 7.80% | 78,531 | 57.5% |
[ 7.5% - 8.0% ] 7.94% | 140,425 | 58.2% |
[ 8.0% - 8.5% ] 8.21% | 137,791 | 48.5% |
[ 8.0% - 8.5% ] 8.27% | 72,409 | 57.5% |
[ 8.0% - 8.5% ] 8.46% | 61,991 | 27.4% |
[ 8.5% - 9.0% ] 8.95% | 135,455 | 44.0% |
[ 9.0% - 9.5% ] 9.05% | 56,025 | 68.0% |
[ 9.0% - 9.5% ] 9.26% | 75,971 | 37.6% |
[ 9.5% - 10.0% ] 9.50% | 11,577 | 73.6% |
[ 9.5% - 10.0% ] 9.73% | 130,920 | 49.6% |
[ 9.5% - 10.0% ] 9.94% | 32,881 | 46.2% |
[ 10.0% - 10.5% ] 10.06% | 75,956 | 70.9% |
[ 10.0% - 10.5% ] 10.36% | 167,404 | 44.3% |
[ 10.0% - 10.5% ] 10.49% | 67,818 | 36.9% |
[ 10.5% - 11.0% ] 10.70% | 121,225 | 38.8% |
[ 10.5% - 11.0% ] 10.81% | 74,601 | 12.1% |
[ 11.0% - 11.5% ] 11.13% | 593 | 94.8% |
[ 11.0% - 11.5% ] 11.23% | 69,599 | 75.0% |
[ 11.5% - 12.0% ] 11.55% | 42,940 | 33.1% |
[ 11.5% - 12.0% ] 11.68% | 8,024 | 44.6% |
[ 12.0% - 12.5% ] 12.07% | 149,116 | 61.9% |
[ 12.0% - 12.5% ] 12.29% | 46,195 | 22.5% |
[ 12.0% - 12.5% ] 12.43% | 118,135 | 54.5% |
[ 12.5% - 13.0% ] 12.65% | 50,975 | 61.2% |
[ 12.5% - 13.0% ] 12.87% | 119,388 | 68.9% |
[ 13.0% - 13.5% ] 13.05% | 21,715 | 37.9% |
[ 13.0% - 13.5% ] 13.16% | 342 | 88.6% |
[ 13.5% - 14.0% ] 13.58% | 31,514 | 66.3% |
[ 13.5% - 14.0% ] 13.88% | 26,548 | 53.1% |
[ 14.0% - 14.5% ] 14.48% | 359 | 88.5% |
[ 14.5% - 15.0% ] 14.68% | 42,427 | 71.6% |
[ 14.5% - 15.0% ] 14.86% | 498 | 27.1% |
[ 15.0% - 15.5% ] 15.31% | 18,601 | 50.7% |
[ 15.5% - 16.0% ] 15.53% | 45,191 | 39.1% |
[ 15.5% - 16.0% ] 15.80% | 1,829 | 84.3% |
[ 16.0% - 16.5% ] 16.14% | 11,069 | 38.2% |
[ 17.0% - 17.5% ] 17.15% | 1,026 | 57.9% |
[ 17.5% - 18.0% ] 17.74% | 530 | 84.5% |
[ 19.5% - 20.0% ] 19.51% | 41 | 37.9% |
[ 22.0% - 22.5% ] 22.22% | 180 | 76.2% |
[ 22.5% - 23.0% ] 22.56% | 133 | 50.9% |
[ 24.0% - 24.5% ] 24.19% | 186 | 87.5% |
[ 24.5% - 25.0% ] 24.77% | 6,186 | 64.7% |
[ 26.5% - 27.0% ] 26.72% | 116 | 68.9% |
[ 27.5% - 28.0% ] 27.85% | 158 | 70.8% |
[ 29.5% - 30.0% ] 29.74% | 2,811 | 75.8% |
[ 31.5% - 32.0% ] 31.69% | 1,761 | 35.4% |
[ 32.5% - 33.0% ] 32.56% | 43 | 10.3% |
[ 39.0% - 39.5% ] 39.22% | 255 | 14.8% |