Immigrants from Bulgaria 2 or more Vehicles in Household
COMPARE
Immigrants from Bulgaria
Select to Compare
2 or more Vehicles in Household
Immigrants from Bulgaria 2 or more Vehicles in Household
54.3%
2+ VEHICLES AVAILABLE
12.0/ 100
METRIC RATING
209th/ 347
METRIC RANK
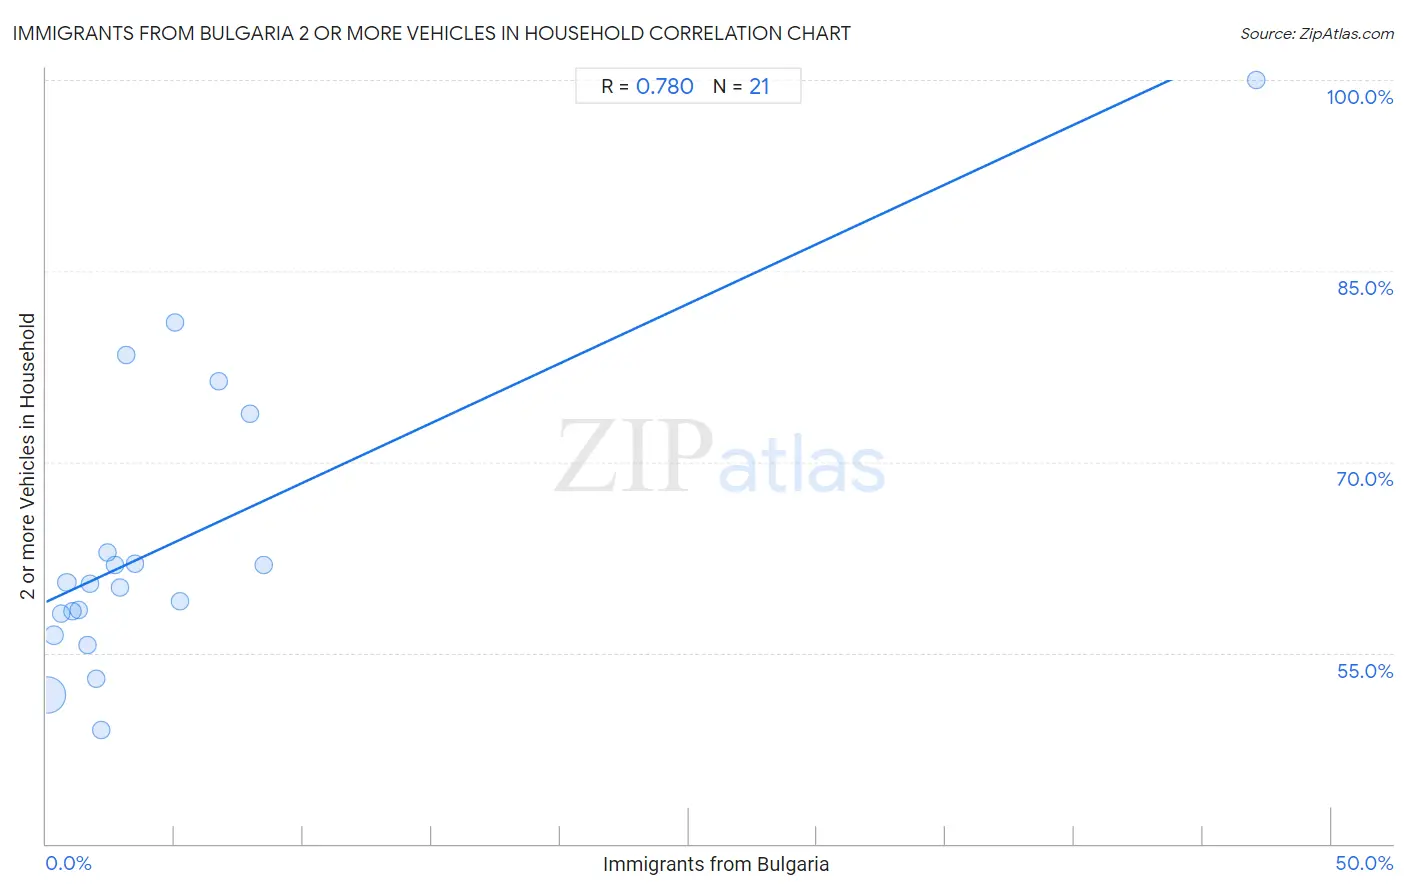
Immigrants from Bulgaria 2 or more Vehicles in Household Correlation Chart
The statistical analysis conducted on geographies consisting of 172,541,029 people shows a strong positive correlation between the proportion of Immigrants from Bulgaria and percentage of households with 2 or more vehicles available in the United States with a correlation coefficient (R) of 0.780 and weighted average of 54.3%. On average, for every 1% (one percent) increase in Immigrants from Bulgaria within a typical geography, there is an increase of 0.94% in percentage of households with 2 or more vehicles available.
It is essential to understand that the correlation between the percentage of Immigrants from Bulgaria and percentage of households with 2 or more vehicles available does not imply a direct cause-and-effect relationship. It remains uncertain whether the presence of Immigrants from Bulgaria influences an upward or downward trend in the level of percentage of households with 2 or more vehicles available within an area, or if Immigrants from Bulgaria simply ended up residing in those areas with higher or lower levels of percentage of households with 2 or more vehicles available due to other factors.
Demographics Similar to Immigrants from Bulgaria by 2 or more Vehicles in Household
In terms of 2 or more vehicles in household, the demographic groups most similar to Immigrants from Bulgaria are Egyptian (54.3%, a difference of 0.0%), Immigrants from Saudi Arabia (54.2%, a difference of 0.060%), Immigrants from Hungary (54.2%, a difference of 0.070%), Turkish (54.3%, a difference of 0.090%), and Immigrants from Chile (54.2%, a difference of 0.090%).
| Demographics | Rating | Rank | 2 or more Vehicles in Household |
| Immigrants from North Macedonia | 14.9 /100 | #202 | Poor 54.4% |
| Immigrants from Peru | 14.3 /100 | #203 | Poor 54.4% |
| Immigrants from Belgium | 13.7 /100 | #204 | Poor 54.3% |
| Cheyenne | 13.6 /100 | #205 | Poor 54.3% |
| Immigrants from Latin America | 13.1 /100 | #206 | Poor 54.3% |
| Turks | 13.0 /100 | #207 | Poor 54.3% |
| Egyptians | 12.0 /100 | #208 | Poor 54.3% |
| Immigrants from Bulgaria | 12.0 /100 | #209 | Poor 54.3% |
| Immigrants from Saudi Arabia | 11.3 /100 | #210 | Poor 54.2% |
| Immigrants from Hungary | 11.3 /100 | #211 | Poor 54.2% |
| Immigrants from Chile | 11.1 /100 | #212 | Poor 54.2% |
| Guatemalans | 9.6 /100 | #213 | Tragic 54.1% |
| Immigrants from Czechoslovakia | 9.4 /100 | #214 | Tragic 54.1% |
| Aleuts | 9.3 /100 | #215 | Tragic 54.1% |
| Immigrants from Western Asia | 9.3 /100 | #216 | Tragic 54.1% |
Immigrants from Bulgaria 2 or more Vehicles in Household Correlation Summary
| Measurement | Immigrants from Bulgaria Data | 2 or more Vehicles in Household Data |
| Minimum | 0.050% | 49.0% |
| Maximum | 47.1% | 100.0% |
| Range | 47.0% | 51.0% |
| Mean | 5.1% | 63.7% |
| Median | 2.4% | 60.5% |
| Interquartile 25% (IQ1) | 1.1% | 57.2% |
| Interquartile 75% (IQ3) | 5.1% | 68.3% |
| Interquartile Range (IQR) | 4.0% | 11.1% |
| Standard Deviation (Sample) | 9.9% | 11.9% |
| Standard Deviation (Population) | 9.7% | 11.6% |
Correlation Details
| Immigrants from Bulgaria Percentile | Sample Size | 2 or more Vehicles in Household |
[ 0.0% - 0.5% ] 0.050% | 161,429,455 | 51.7% |
[ 0.0% - 0.5% ] 0.32% | 7,168,099 | 56.4% |
[ 0.5% - 1.0% ] 0.56% | 1,949,447 | 58.1% |
[ 0.5% - 1.0% ] 0.80% | 843,860 | 60.6% |
[ 1.0% - 1.5% ] 1.03% | 443,079 | 58.2% |
[ 1.0% - 1.5% ] 1.26% | 295,250 | 58.4% |
[ 1.5% - 2.0% ] 1.59% | 163,623 | 55.6% |
[ 1.5% - 2.0% ] 1.70% | 96,601 | 60.5% |
[ 1.5% - 2.0% ] 1.97% | 6,608 | 53.0% |
[ 2.0% - 2.5% ] 2.16% | 41,662 | 49.0% |
[ 2.0% - 2.5% ] 2.38% | 71,461 | 62.9% |
[ 2.5% - 3.0% ] 2.70% | 7,854 | 61.9% |
[ 2.5% - 3.0% ] 2.85% | 4,354 | 60.1% |
[ 3.0% - 3.5% ] 3.13% | 3,294 | 78.4% |
[ 3.0% - 3.5% ] 3.46% | 9,960 | 62.0% |
[ 4.5% - 5.0% ] 5.00% | 2,160 | 80.9% |
[ 5.0% - 5.5% ] 5.23% | 3,042 | 59.1% |
[ 6.5% - 7.0% ] 6.70% | 224 | 76.3% |
[ 7.5% - 8.0% ] 7.93% | 656 | 73.8% |
[ 8.0% - 8.5% ] 8.46% | 272 | 61.9% |
[ 47.0% - 47.5% ] 47.06% | 68 | 100.0% |