Yuman 2 or more Vehicles in Household
COMPARE
Yuman
Select to Compare
2 or more Vehicles in Household
Yuman 2 or more Vehicles in Household
51.7%
2+ VEHICLES AVAILABLE
0.1/ 100
METRIC RATING
278th/ 347
METRIC RANK
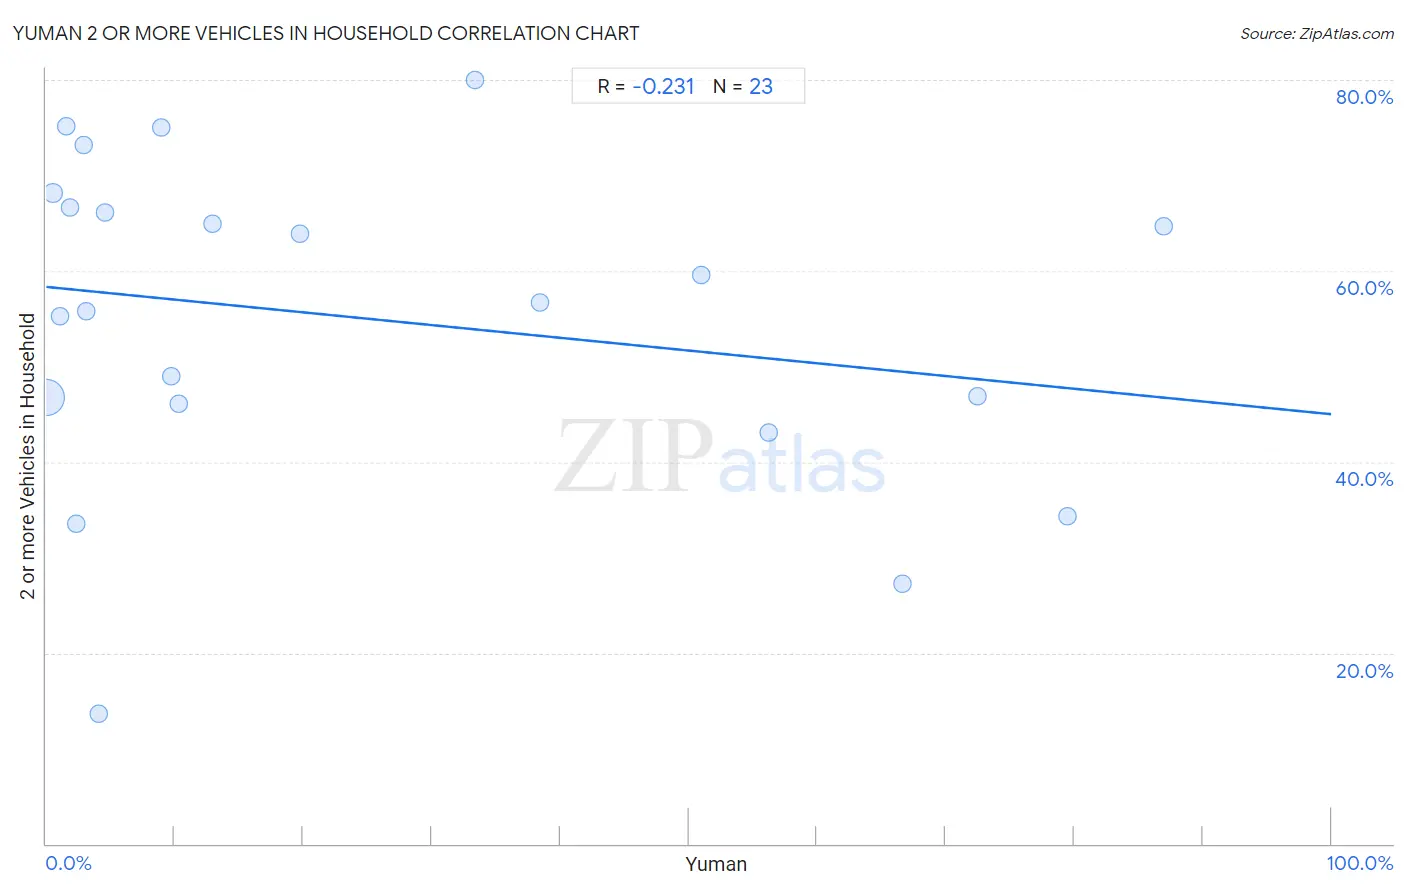
Yuman 2 or more Vehicles in Household Correlation Chart
The statistical analysis conducted on geographies consisting of 40,663,643 people shows a weak negative correlation between the proportion of Yuman and percentage of households with 2 or more vehicles available in the United States with a correlation coefficient (R) of -0.231 and weighted average of 51.7%. On average, for every 1% (one percent) increase in Yuman within a typical geography, there is a decrease of 0.13% in percentage of households with 2 or more vehicles available.
It is essential to understand that the correlation between the percentage of Yuman and percentage of households with 2 or more vehicles available does not imply a direct cause-and-effect relationship. It remains uncertain whether the presence of Yuman influences an upward or downward trend in the level of percentage of households with 2 or more vehicles available within an area, or if Yuman simply ended up residing in those areas with higher or lower levels of percentage of households with 2 or more vehicles available due to other factors.
Demographics Similar to Yuman by 2 or more Vehicles in Household
In terms of 2 or more vehicles in household, the demographic groups most similar to Yuman are Liberian (51.7%, a difference of 0.010%), Immigrants from Eastern Europe (51.7%, a difference of 0.040%), Immigrants from Africa (51.8%, a difference of 0.060%), Immigrants from Croatia (51.8%, a difference of 0.12%), and Immigrants from Honduras (51.8%, a difference of 0.14%).
| Demographics | Rating | Rank | 2 or more Vehicles in Household |
| South Americans | 0.2 /100 | #271 | Tragic 51.9% |
| Sub-Saharan Africans | 0.2 /100 | #272 | Tragic 51.9% |
| Israelis | 0.2 /100 | #273 | Tragic 51.9% |
| Africans | 0.2 /100 | #274 | Tragic 51.8% |
| Immigrants from Honduras | 0.2 /100 | #275 | Tragic 51.8% |
| Immigrants from Croatia | 0.2 /100 | #276 | Tragic 51.8% |
| Immigrants from Africa | 0.2 /100 | #277 | Tragic 51.8% |
| Yuman | 0.1 /100 | #278 | Tragic 51.7% |
| Liberians | 0.1 /100 | #279 | Tragic 51.7% |
| Immigrants from Eastern Europe | 0.1 /100 | #280 | Tragic 51.7% |
| Immigrants from Kazakhstan | 0.1 /100 | #281 | Tragic 51.6% |
| Bahamians | 0.1 /100 | #282 | Tragic 51.5% |
| Immigrants from China | 0.1 /100 | #283 | Tragic 51.5% |
| Immigrants from Zaire | 0.1 /100 | #284 | Tragic 51.5% |
| Immigrants from Uruguay | 0.1 /100 | #285 | Tragic 51.4% |
Yuman 2 or more Vehicles in Household Correlation Summary
| Measurement | Yuman Data | 2 or more Vehicles in Household Data |
| Minimum | 0.022% | 13.6% |
| Maximum | 87.0% | 80.0% |
| Range | 86.9% | 66.4% |
| Mean | 24.7% | 55.0% |
| Median | 9.7% | 56.8% |
| Interquartile 25% (IQ1) | 2.3% | 46.1% |
| Interquartile 75% (IQ3) | 51.0% | 66.6% |
| Interquartile Range (IQR) | 48.6% | 20.5% |
| Standard Deviation (Sample) | 29.2% | 16.9% |
| Standard Deviation (Population) | 28.6% | 16.5% |
Correlation Details
| Yuman Percentile | Sample Size | 2 or more Vehicles in Household |
[ 0.0% - 0.5% ] 0.022% | 40,016,771 | 46.7% |
[ 0.5% - 1.0% ] 0.52% | 507,493 | 68.2% |
[ 1.0% - 1.5% ] 1.04% | 48,669 | 55.2% |
[ 1.5% - 2.0% ] 1.60% | 29,609 | 75.2% |
[ 1.5% - 2.0% ] 1.84% | 3,529 | 66.6% |
[ 2.0% - 2.5% ] 2.32% | 689 | 33.5% |
[ 2.5% - 3.0% ] 2.97% | 19,488 | 73.2% |
[ 3.0% - 3.5% ] 3.14% | 9,106 | 55.8% |
[ 4.0% - 4.5% ] 4.08% | 147 | 13.6% |
[ 4.5% - 5.0% ] 4.53% | 9,119 | 66.1% |
[ 8.5% - 9.0% ] 8.92% | 527 | 75.0% |
[ 9.5% - 10.0% ] 9.75% | 5,447 | 49.0% |
[ 10.0% - 10.5% ] 10.35% | 5,062 | 46.1% |
[ 12.5% - 13.0% ] 12.98% | 362 | 65.0% |
[ 19.5% - 20.0% ] 19.71% | 1,370 | 63.9% |
[ 33.0% - 33.5% ] 33.33% | 120 | 80.0% |
[ 38.0% - 38.5% ] 38.46% | 104 | 56.8% |
[ 50.5% - 51.0% ] 50.95% | 630 | 59.6% |
[ 56.0% - 56.5% ] 56.23% | 1,967 | 43.1% |
[ 66.5% - 67.0% ] 66.67% | 39 | 27.3% |
[ 72.0% - 72.5% ] 72.47% | 1,867 | 46.9% |
[ 79.0% - 79.5% ] 79.49% | 1,482 | 34.3% |
[ 86.5% - 87.0% ] 86.96% | 46 | 64.7% |