Area Code 843 Map & Demographics
Area Code 843 Map
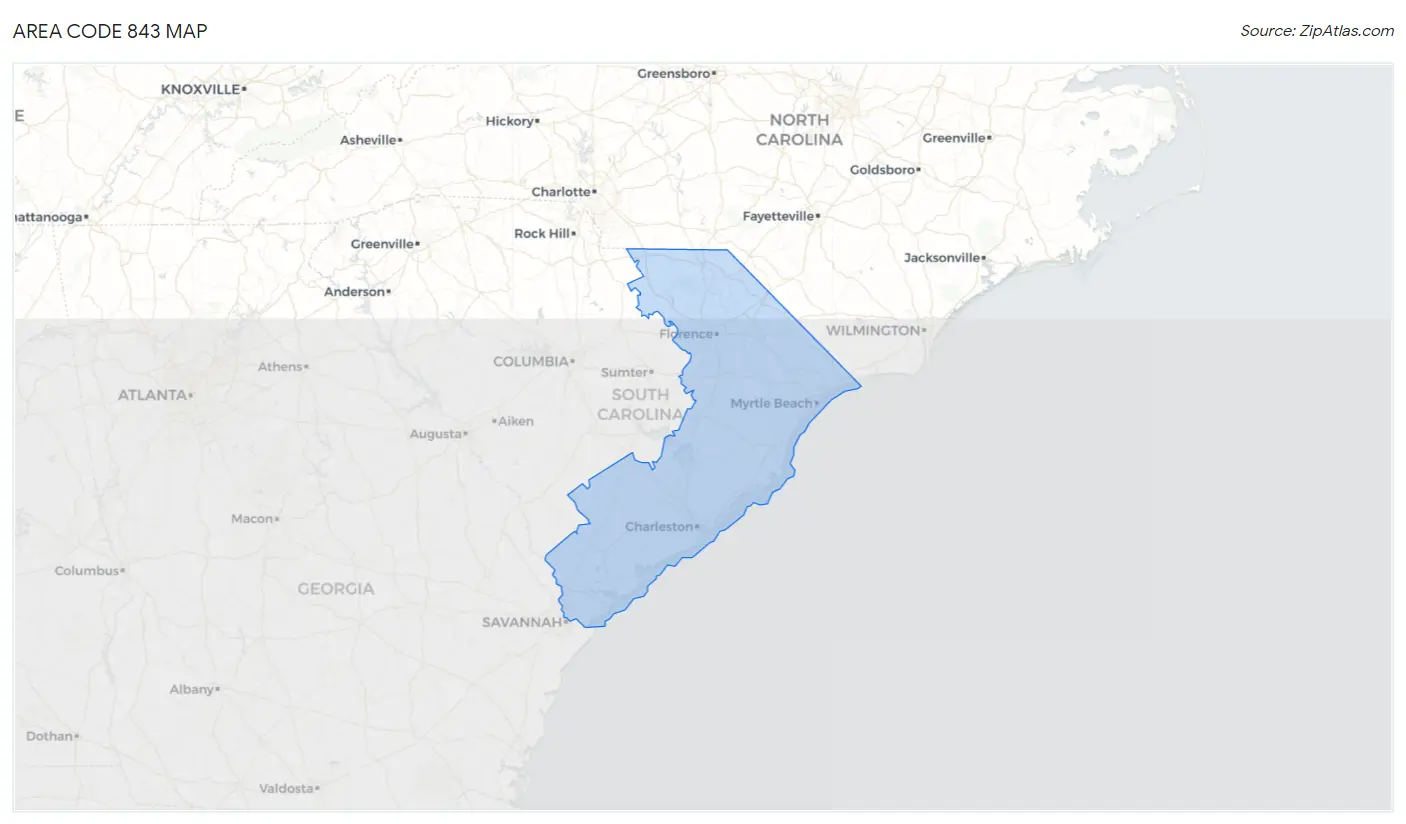
Area Code 843 Overview
$34,218
PER CAPITA INCOME
$74,977
AVG FAMILY INCOME
$59,579
AVG HOUSEHOLD INCOME
27.3%
WAGE / INCOME GAP [ % ]
72.7¢/ $1
WAGE / INCOME GAP [ $ ]
$10,542
FAMILY INCOME DEFICIT
62.61
INEQUALITY / GINI INDEX
1,796,300
TOTAL POPULATION
876,580
MALE POPULATION
919,720
FEMALE POPULATION
95.31
MALES / 100 FEMALES
104.92
FEMALES / 100 MALES
43.8
MEDIAN AGE
3.1
AVG FAMILY SIZE
2.5
AVG HOUSEHOLD SIZE
808,830
LABOR FORCE [ PEOPLE ]
54.9%
PERCENT IN LABOR FORCE
6.0%
UNEMPLOYMENT RATE
Income in Area Code 843
Income Overview in Area Code 843
Per Capita Income in Area Code 843 is $34,218, while median incomes of families and households are $74,977 and $59,579 respectively.
| Characteristic | Number | Measure |
| Per Capita Income | 1,796,300 | $34,218 |
| Median Family Income | 455,688 | $74,977 |
| Mean Family Income | 455,688 | $13,155,583 |
| Median Household Income | 712,567 | $59,579 |
| Mean Household Income | 712,567 | $11,264,157 |
| Income Deficit | 455,688 | $10,542 |
| Wage / Income Gap (%) | 1,796,300 | 27.26% |
| Wage / Income Gap ($) | 1,796,300 | 72.74¢ per $1 |
| Gini / Inequality Index | 1,796,300 | 62.61 |
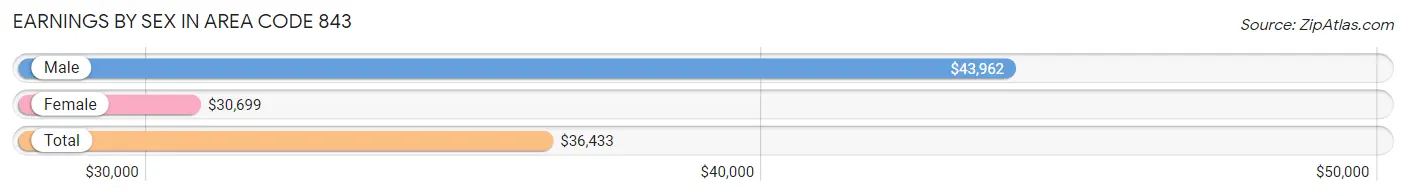
Earnings by Sex in Area Code 843
Average Earnings in Area Code 843 are $36,433, $43,962 for men and $30,699 for women, a difference of 30.2%.
| Sex | Number | Average Earnings |
| Male | 471,101 (51.9%) | $43,962 |
| Female | 437,017 (48.1%) | $30,699 |
| Total | 908,118 (100.0%) | $36,433 |
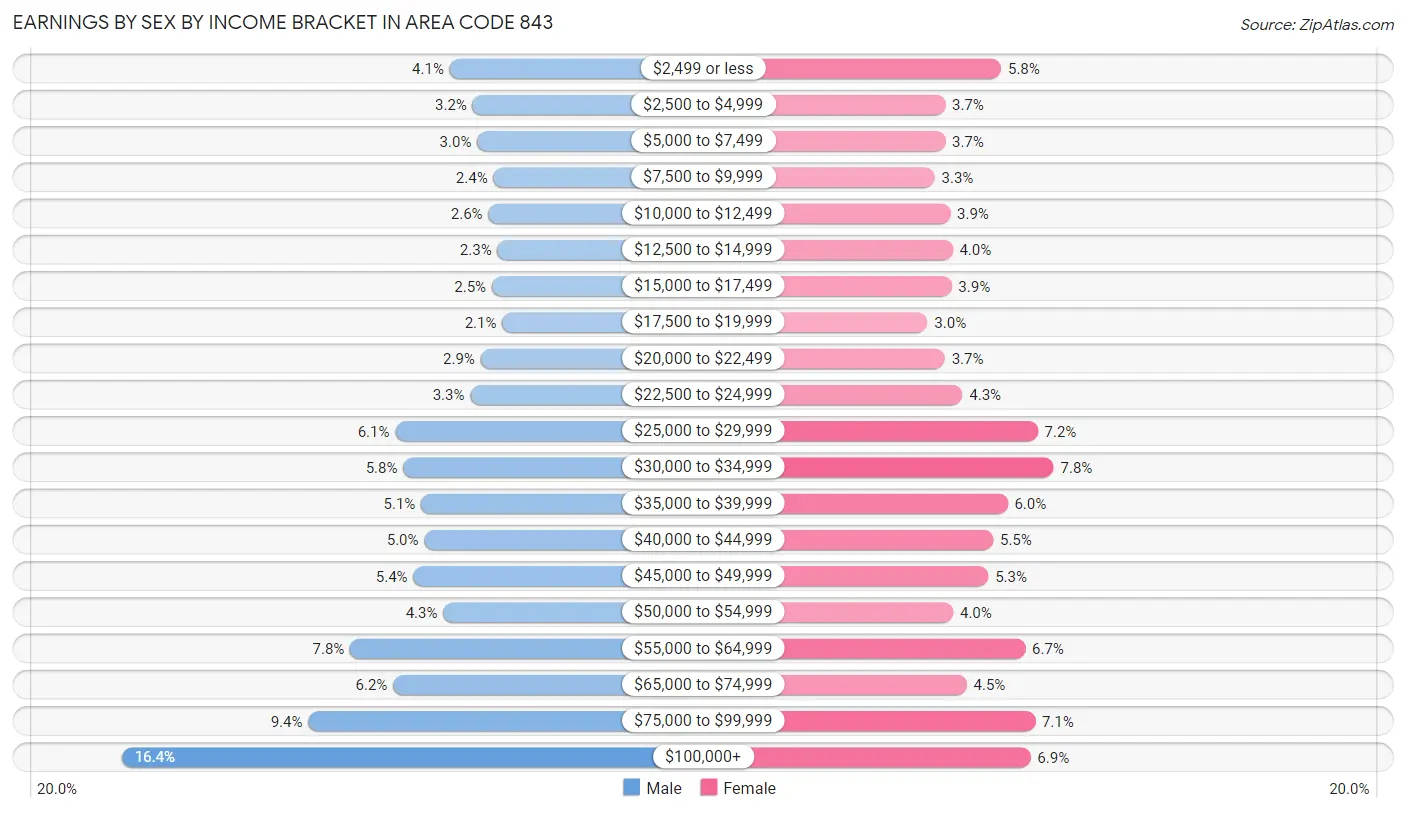
Earnings by Sex by Income Bracket in Area Code 843
The most common earnings brackets in Area Code 843 are $100,000+ for men (77,053 | 16.4%) and $30,000 to $34,999 for women (33,881 | 7.7%).
| Income | Male | Female |
| $2,499 or less | 19,190 (4.1%) | 25,251 (5.8%) |
| $2,500 to $4,999 | 15,144 (3.2%) | 16,097 (3.7%) |
| $5,000 to $7,499 | 14,312 (3.0%) | 16,077 (3.7%) |
| $7,500 to $9,999 | 11,457 (2.4%) | 14,399 (3.3%) |
| $10,000 to $12,499 | 12,338 (2.6%) | 16,919 (3.9%) |
| $12,500 to $14,999 | 10,720 (2.3%) | 17,325 (4.0%) |
| $15,000 to $17,499 | 11,718 (2.5%) | 17,147 (3.9%) |
| $17,500 to $19,999 | 9,889 (2.1%) | 13,190 (3.0%) |
| $20,000 to $22,499 | 13,720 (2.9%) | 16,047 (3.7%) |
| $22,500 to $24,999 | 15,558 (3.3%) | 18,903 (4.3%) |
| $25,000 to $29,999 | 28,805 (6.1%) | 31,259 (7.1%) |
| $30,000 to $34,999 | 27,365 (5.8%) | 33,881 (7.7%) |
| $35,000 to $39,999 | 24,226 (5.1%) | 26,304 (6.0%) |
| $40,000 to $44,999 | 23,656 (5.0%) | 23,965 (5.5%) |
| $45,000 to $49,999 | 25,596 (5.4%) | 23,177 (5.3%) |
| $50,000 to $54,999 | 20,310 (4.3%) | 17,400 (4.0%) |
| $55,000 to $64,999 | 36,769 (7.8%) | 29,198 (6.7%) |
| $65,000 to $74,999 | 29,147 (6.2%) | 19,602 (4.5%) |
| $75,000 to $99,999 | 44,128 (9.4%) | 30,813 (7.0%) |
| $100,000+ | 77,053 (16.4%) | 30,063 (6.9%) |
| Total | 471,101 (100.0%) | 437,017 (100.0%) |
Earnings by Sex by Educational Attainment in Area Code 843
Average earnings in Area Code 843 are $6,812,847 for men and $4,342,283 for women, a difference of 36.3%. Men with an educational attainment of graduate degree enjoy the highest average annual earnings of $7,376,309, while those with less than high school education earn the least with $2,709,001. Women with an educational attainment of graduate degree earn the most with the average annual earnings of $5,551,795, while those with less than high school education have the smallest earnings of $1,617,420.

| Educational Attainment | Male Income | Female Income |
| Less than High School | $2,709,001 | $1,617,420 |
| High School Diploma | $5,365,174 | $3,070,739 |
| College or Associate's Degree | $5,748,865 | $4,052,978 |
| Bachelor's Degree | $6,006,019 | $4,288,017 |
| Graduate Degree | $7,376,309 | $5,551,795 |
| Total | $6,812,847 | $4,342,283 |
Family Income in Area Code 843
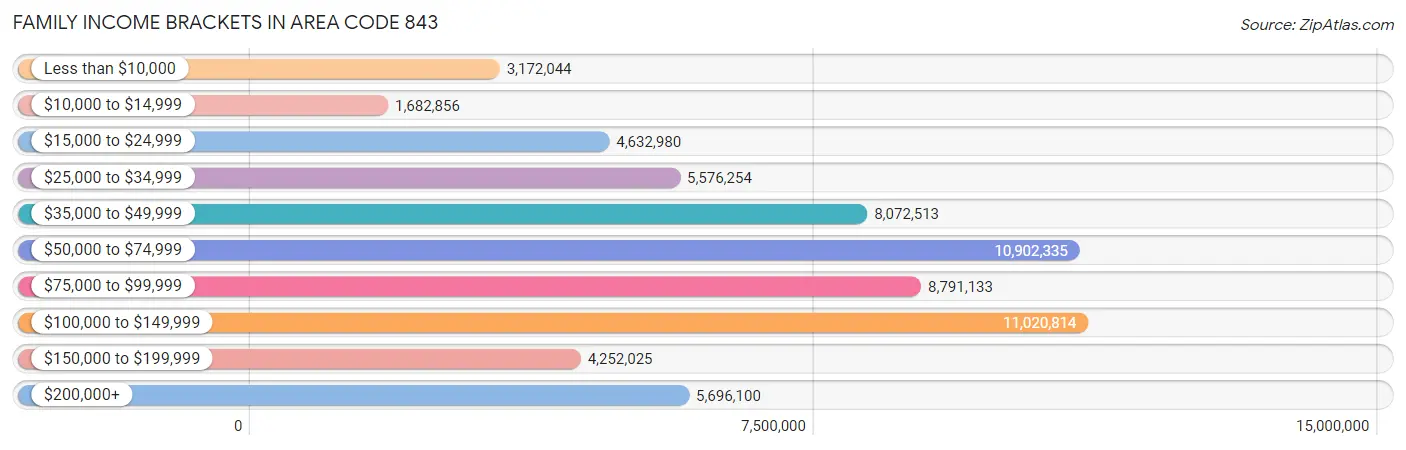
Family Income Brackets in Area Code 843
According to the Area Code 843 family income data, there are 11,020,814 families falling into the $100,000 to $149,999 income range, which is the most common income bracket and makes up 2,418.5% of all families. Conversely, the $10,000 to $14,999 income bracket is the least frequent group with only 1,682,856 families (369.3%) belonging to this category.
| Income Bracket | # Families | % Families |
| Less than $10,000 | 3,172,044 | 696.1% |
| $10,000 to $14,999 | 1,682,856 | 369.3% |
| $15,000 to $24,999 | 4,632,980 | 1,016.7% |
| $25,000 to $34,999 | 5,576,254 | 1,223.7% |
| $35,000 to $49,999 | 8,072,513 | 1,771.5% |
| $50,000 to $74,999 | 10,902,335 | 2,392.5% |
| $75,000 to $99,999 | 8,791,133 | 1,929.2% |
| $100,000 to $149,999 | 11,020,814 | 2,418.5% |
| $150,000 to $199,999 | 4,252,025 | 933.1% |
| $200,000+ | 5,696,100 | 1,250.0% |
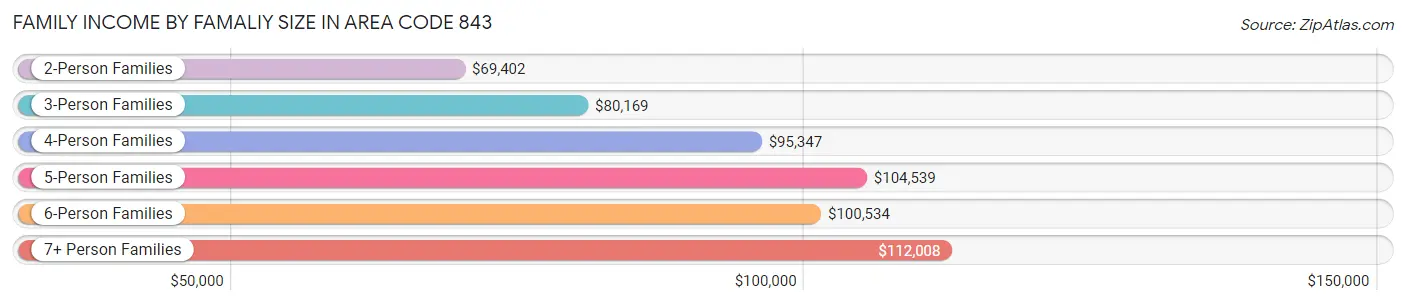
Family Income by Famaliy Size in Area Code 843
7+ person families (4,434 | 1.0%) account for the highest median family income in Area Code 843 with $112,008 per family, while 2-person families (246,628 | 54.1%) have the highest median income of $34,701 per family member.
| Income Bracket | # Families | Median Income |
| 2-Person Families | 246,628 (54.1%) | $69,402 |
| 3-Person Families | 98,099 (21.5%) | $80,169 |
| 4-Person Families | 69,978 (15.4%) | $95,347 |
| 5-Person Families | 27,906 (6.1%) | $104,539 |
| 6-Person Families | 8,643 (1.9%) | $100,534 |
| 7+ Person Families | 4,434 (1.0%) | $112,008 |
| Total | 455,688 (100.0%) | $74,977 |
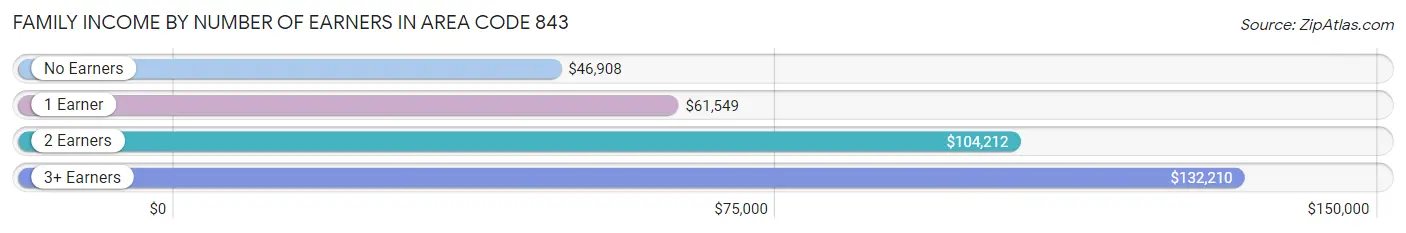
Family Income by Number of Earners in Area Code 843
The median family income in Area Code 843 is $74,977, with families comprising 3+ earners (38,455) having the highest median family income of $132,210, while families with no earners (94,466) have the lowest median family income of $46,908, accounting for 8.4% and 20.7% of families, respectively.
| Number of Earners | # Families | Median Income |
| No Earners | 94,466 (20.7%) | $46,908 |
| 1 Earner | 153,555 (33.7%) | $61,549 |
| 2 Earners | 169,212 (37.1%) | $104,212 |
| 3+ Earners | 38,455 (8.4%) | $132,210 |
| Total | 455,688 (100.0%) | $74,977 |
Household Income in Area Code 843
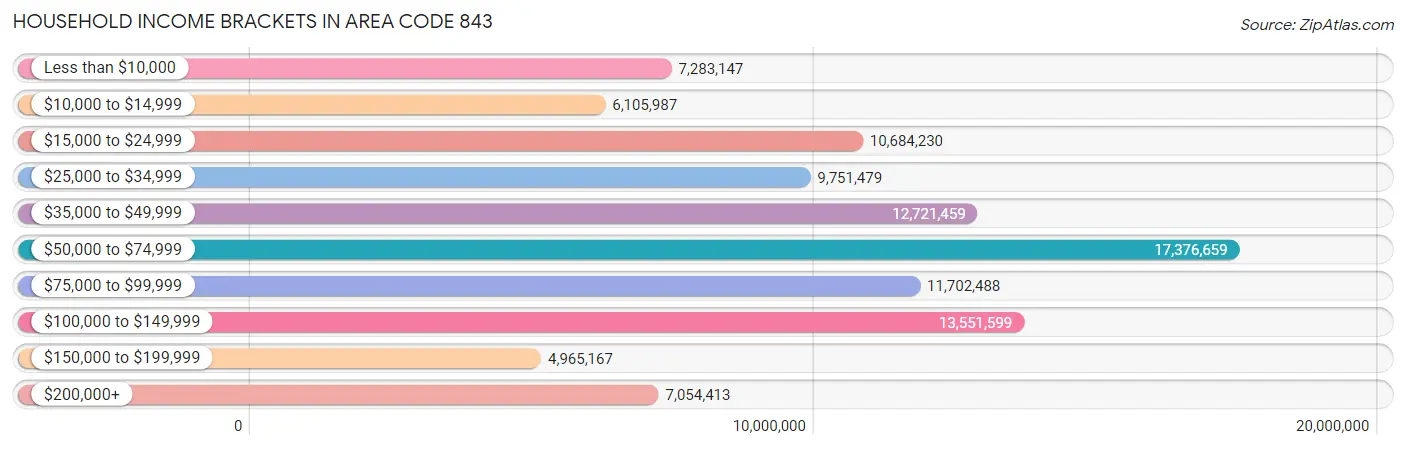
Household Income Brackets in Area Code 843
With 17,376,659 households falling in the category, the $50,000 to $74,999 income range is the most frequent in Area Code 843, accounting for 2,438.6% of all households. In contrast, only 4,965,167 households (696.8%) fall into the $150,000 to $199,999 income bracket, making it the least populous group.
| Income Bracket | # Households | % Households |
| Less than $10,000 | 7,283,147 | 1,022.1% |
| $10,000 to $14,999 | 6,105,987 | 856.9% |
| $15,000 to $24,999 | 10,684,230 | 1,499.4% |
| $25,000 to $34,999 | 9,751,479 | 1,368.5% |
| $35,000 to $49,999 | 12,721,459 | 1,785.3% |
| $50,000 to $74,999 | 17,376,659 | 2,438.6% |
| $75,000 to $99,999 | 11,702,488 | 1,642.3% |
| $100,000 to $149,999 | 13,551,599 | 1,901.8% |
| $150,000 to $199,999 | 4,965,167 | 696.8% |
| $200,000+ | 7,054,413 | 990.0% |
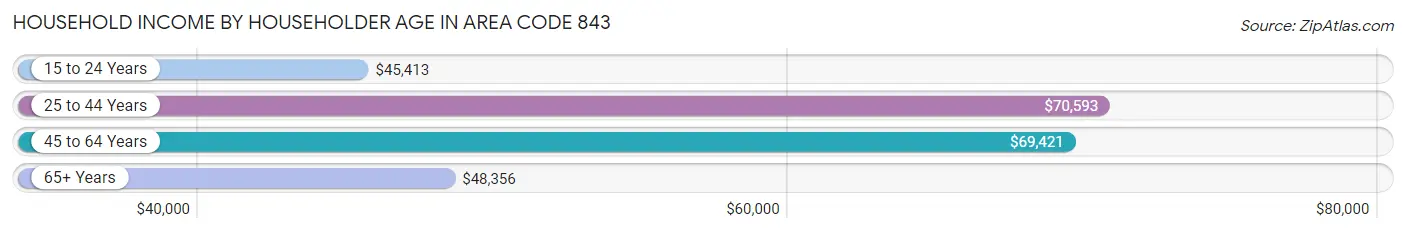
Household Income by Householder Age in Area Code 843
The median household income in Area Code 843 is $59,579, with the highest median household income of $70,593 found in the 25 to 44 years age bracket for the primary householder. A total of 209,998 households (29.5%) fall into this category. Meanwhile, the 15 to 24 years age bracket for the primary householder has the lowest median household income of $45,413, with 20,818 households (2.9%) in this group.
| Income Bracket | # Households | Median Income |
| 15 to 24 Years | 20,818 (2.9%) | $45,413 |
| 25 to 44 Years | 209,998 (29.5%) | $70,593 |
| 45 to 64 Years | 256,825 (36.0%) | $69,421 |
| 65+ Years | 224,926 (31.6%) | $48,356 |
| Total | 712,567 (100.0%) | $59,579 |
Poverty in Area Code 843
Income Below Poverty by Sex and Age in Area Code 843
With 12.9% poverty level for males and 15.5% for females among the residents of Area Code 843, under 5 year old males and 5 year old females are the most vulnerable to poverty, with 11,444 males (24.0%) and 2,063 females (22.9%) in their respective age groups living below the poverty level.
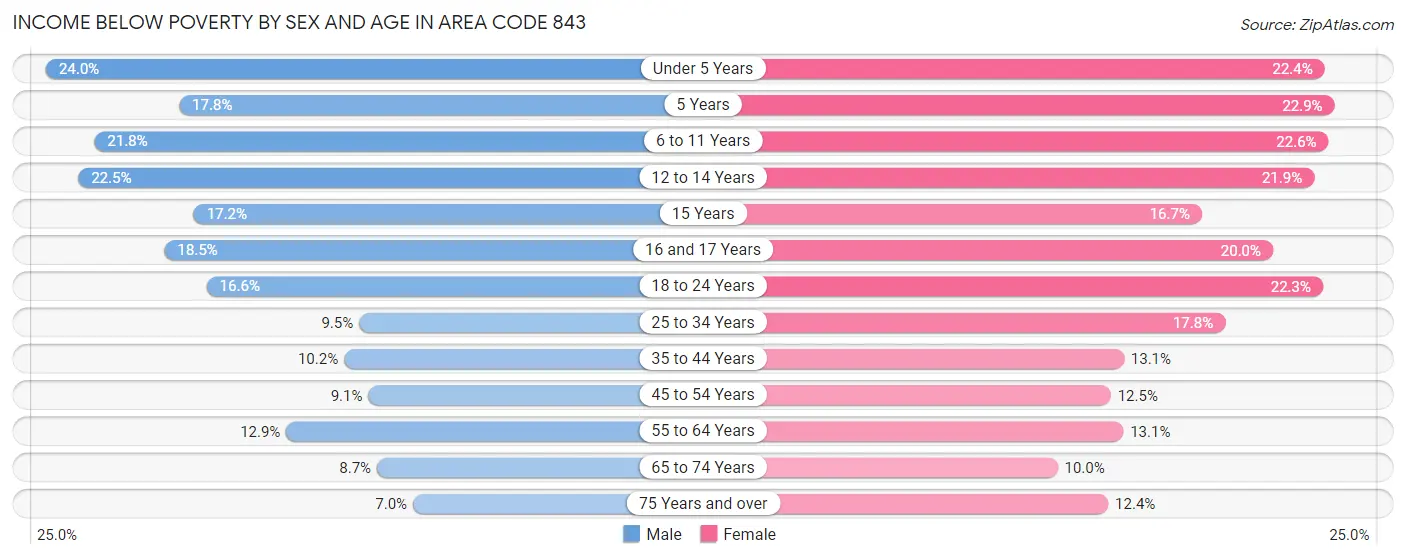
| Age Bracket | Male | Female |
| Under 5 Years | 11,444 (24.0%) | 10,152 (22.4%) |
| 5 Years | 1,724 (17.8%) | 2,063 (22.9%) |
| 6 to 11 Years | 13,425 (21.8%) | 13,292 (22.6%) |
| 12 to 14 Years | 7,085 (22.5%) | 6,981 (21.9%) |
| 15 Years | 1,850 (17.2%) | 1,667 (16.7%) |
| 16 and 17 Years | 3,924 (18.5%) | 4,062 (20.0%) |
| 18 to 24 Years | 11,460 (16.6%) | 14,689 (22.3%) |
| 25 to 34 Years | 10,554 (9.5%) | 20,728 (17.8%) |
| 35 to 44 Years | 10,696 (10.2%) | 14,406 (13.1%) |
| 45 to 54 Years | 9,264 (9.0%) | 13,791 (12.5%) |
| 55 to 64 Years | 14,900 (12.9%) | 17,209 (13.1%) |
| 65 to 74 Years | 9,036 (8.6%) | 12,109 (10.0%) |
| 75 Years and over | 4,045 (7.0%) | 9,268 (12.4%) |
| Total | 109,407 (12.9%) | 140,417 (15.5%) |
Income Above Poverty by Sex and Age in Area Code 843
According to the poverty statistics in Area Code 843, males aged 75 years and over and females aged 65 to 74 years are the age groups that are most secure financially, with 93.0% of males and 90.0% of females in these age groups living above the poverty line.
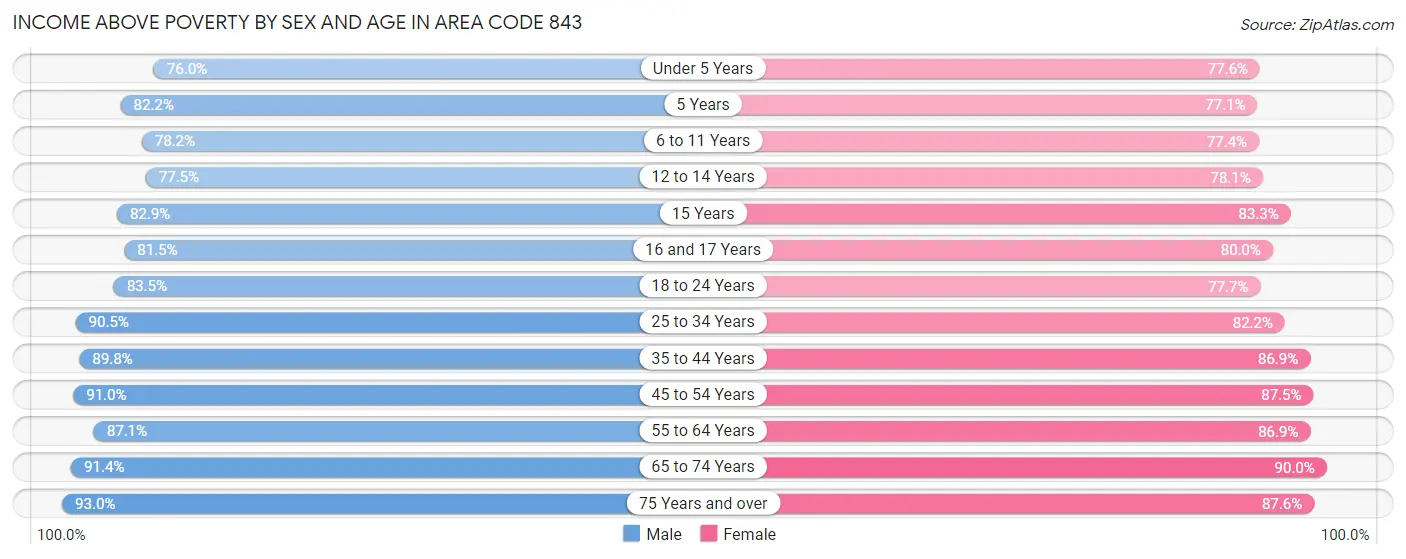
| Age Bracket | Male | Female |
| Under 5 Years | 36,227 (76.0%) | 35,167 (77.6%) |
| 5 Years | 7,945 (82.2%) | 6,961 (77.1%) |
| 6 to 11 Years | 48,284 (78.2%) | 45,568 (77.4%) |
| 12 to 14 Years | 24,384 (77.5%) | 24,876 (78.1%) |
| 15 Years | 8,936 (82.9%) | 8,314 (83.3%) |
| 16 and 17 Years | 17,271 (81.5%) | 16,247 (80.0%) |
| 18 to 24 Years | 57,805 (83.5%) | 51,127 (77.7%) |
| 25 to 34 Years | 100,817 (90.5%) | 95,870 (82.2%) |
| 35 to 44 Years | 94,337 (89.8%) | 95,632 (86.9%) |
| 45 to 54 Years | 93,087 (90.9%) | 96,692 (87.5%) |
| 55 to 64 Years | 100,957 (87.1%) | 114,566 (86.9%) |
| 65 to 74 Years | 95,421 (91.3%) | 108,843 (90.0%) |
| 75 Years and over | 53,870 (93.0%) | 65,702 (87.6%) |
| Total | 739,341 (87.1%) | 765,565 (84.5%) |
Income Below Poverty Among Married-Couple Families in Area Code 843
The poverty statistics for married-couple families in Area Code 843 show that 4.7% or 15,783 of the total 332,877 families live below the poverty line. Families with 5 or more children have the highest poverty rate of 18.3%, comprising of 243 families. On the other hand, families with no children have the lowest poverty rate of 4.2%, which includes 9,214 families.
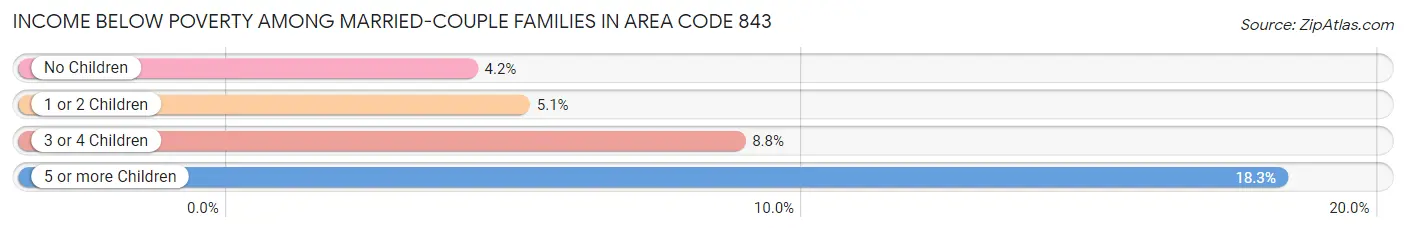
| Children | Above Poverty | Below Poverty |
| No Children | 211,739 (95.8%) | 9,214 (4.2%) |
| 1 or 2 Children | 87,070 (94.9%) | 4,661 (5.1%) |
| 3 or 4 Children | 17,198 (91.2%) | 1,665 (8.8%) |
| 5 or more Children | 1,087 (81.7%) | 243 (18.3%) |
| Total | 317,094 (95.3%) | 15,783 (4.7%) |
Income Below Poverty Among Single-Parent Households in Area Code 843
According to the poverty data in Area Code 843, 17.1% or 5,093 single-father households and 27.4% or 25,463 single-mother households are living below the poverty line. Among single-father households, those with 5 or more children have the highest poverty rate, with 131 households (63.3%) experiencing poverty. Likewise, among single-mother households, those with 5 or more children have the highest poverty rate, with 836 households (83.6%) falling below the poverty line.
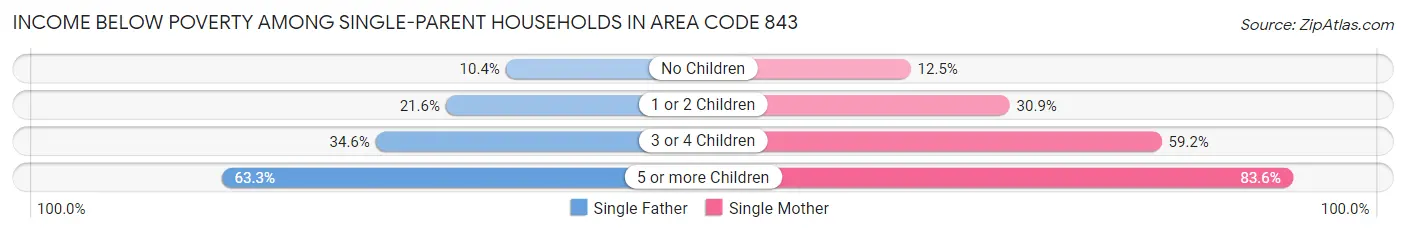
| Children | Single Father | Single Mother |
| No Children | 1,625 (10.4%) | 4,464 (12.5%) |
| 1 or 2 Children | 2,506 (21.6%) | 14,334 (30.9%) |
| 3 or 4 Children | 831 (34.6%) | 5,829 (59.2%) |
| 5 or more Children | 131 (63.3%) | 836 (83.6%) |
| Total | 5,093 (17.1%) | 25,463 (27.4%) |
Income Below Poverty Among Married-Couple vs Single-Parent Households in Area Code 843
The poverty data for Area Code 843 shows that 15,783 of the married-couple family households (4.7%) and 30,556 of the single-parent households (24.9%) are living below the poverty level. Within the married-couple family households, those with 5 or more children have the highest poverty rate, with 243 households (18.3%) falling below the poverty line. Among the single-parent households, those with 5 or more children have the highest poverty rate, with 967 household (80.1%) living below poverty.
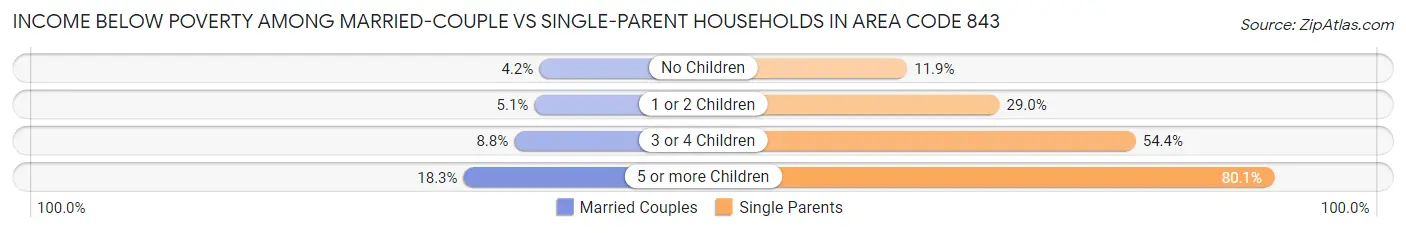
| Children | Married-Couple Families | Single-Parent Households |
| No Children | 9,214 (4.2%) | 6,089 (11.8%) |
| 1 or 2 Children | 4,661 (5.1%) | 16,840 (29.0%) |
| 3 or 4 Children | 1,665 (8.8%) | 6,660 (54.4%) |
| 5 or more Children | 243 (18.3%) | 967 (80.1%) |
| Total | 15,783 (4.7%) | 30,556 (24.9%) |
Race in Area Code 843
The most populous races in Area Code 843 are White / Caucasian (1,169,300 | 65.1%), Black / African American (469,003 | 26.1%), and Hispanic or Latino (107,641 | 6.0%).
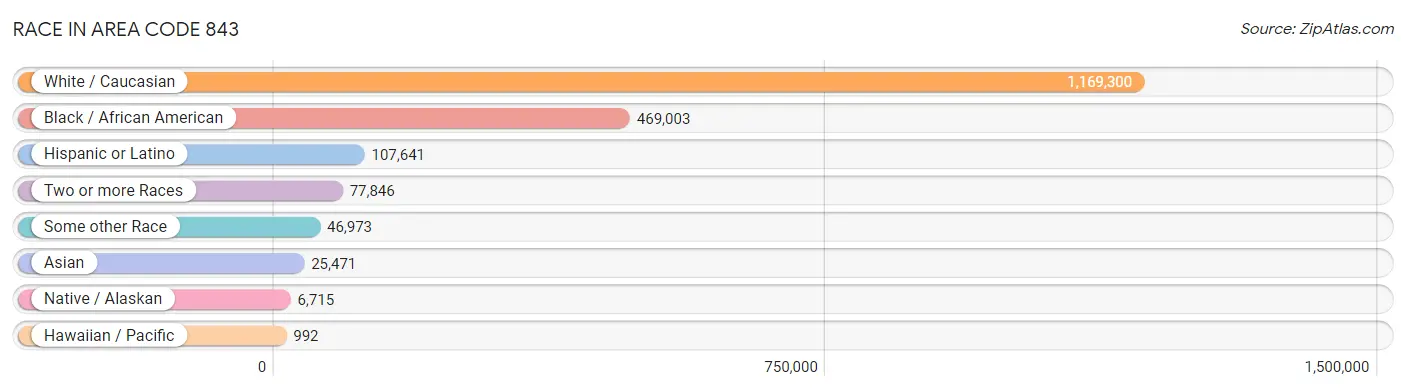
| Race | # Population | % Population |
| Asian | 25,471 | 1.4% |
| Black / African American | 469,003 | 26.1% |
| Hawaiian / Pacific | 992 | 0.1% |
| Hispanic or Latino | 107,641 | 6.0% |
| Native / Alaskan | 6,715 | 0.4% |
| White / Caucasian | 1,169,300 | 65.1% |
| Two or more Races | 77,846 | 4.3% |
| Some other Race | 46,973 | 2.6% |
| Total | 1,796,300 | 100.0% |
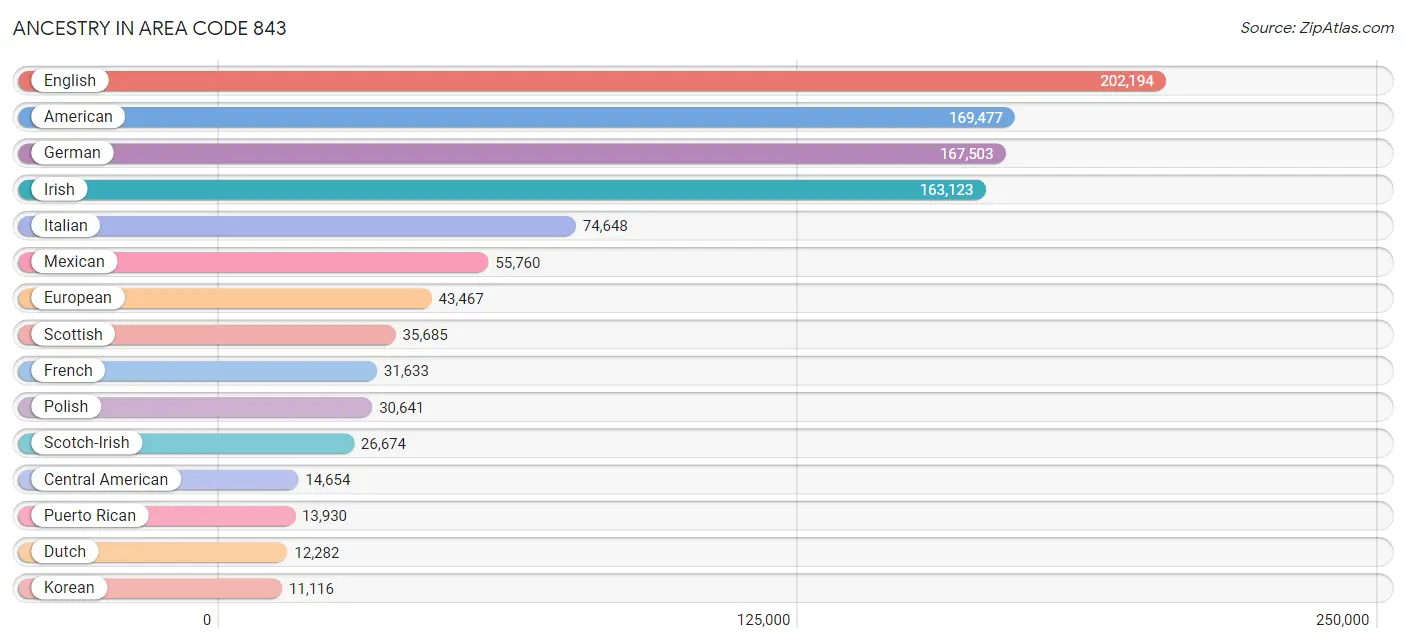
Ancestry in Area Code 843
The most populous ancestries reported in Area Code 843 are English (202,194 | 11.3%), American (169,477 | 9.4%), German (167,503 | 9.3%), Irish (163,123 | 9.1%), and Italian (74,648 | 4.2%), together accounting for 43.2% of all Area Code 843 residents.
| Ancestry | # Population | % Population |
| Afghan | 134 | 0.0% |
| African | 8,196 | 0.5% |
| Alaska Native | 11 | 0.0% |
| Alaskan Athabascan | 44 | 0.0% |
| Albanian | 830 | 0.1% |
| Alsatian | 99 | 0.0% |
| American | 169,477 | 9.4% |
| Apache | 101 | 0.0% |
| Arab | 5,899 | 0.3% |
| Argentinean | 883 | 0.1% |
| Armenian | 1,285 | 0.1% |
| Assyrian / Chaldean / Syriac | 56 | 0.0% |
| Australian | 405 | 0.0% |
| Austrian | 2,692 | 0.2% |
| Bahamian | 225 | 0.0% |
| Bangladeshi | 167 | 0.0% |
| Barbadian | 117 | 0.0% |
| Basque | 19 | 0.0% |
| Belgian | 1,051 | 0.1% |
| Belizean | 69 | 0.0% |
| Bermudan | 111 | 0.0% |
| Bhutanese | 2,572 | 0.1% |
| Blackfeet | 1,245 | 0.1% |
| Bolivian | 319 | 0.0% |
| Brazilian | 2,933 | 0.2% |
| British | 10,525 | 0.6% |
| British West Indian | 177 | 0.0% |
| Bulgarian | 277 | 0.0% |
| Burmese | 3,307 | 0.2% |
| Cajun | 186 | 0.0% |
| Canadian | 2,235 | 0.1% |
| Cape Verdean | 35 | 0.0% |
| Celtic | 388 | 0.0% |
| Central American | 14,654 | 0.8% |
| Central American Indian | 1,192 | 0.1% |
| Cherokee | 6,962 | 0.4% |
| Cheyenne | 9 | 0.0% |
| Chickasaw | 139 | 0.0% |
| Chilean | 436 | 0.0% |
| Chippewa | 107 | 0.0% |
| Choctaw | 343 | 0.0% |
| Colombian | 3,011 | 0.2% |
| Comanche | 49 | 0.0% |
| Costa Rican | 968 | 0.1% |
| Cree | 40 | 0.0% |
| Creek | 106 | 0.0% |
| Croatian | 1,429 | 0.1% |
| Crow | 25 | 0.0% |
| Cuban | 2,356 | 0.1% |
| Czech | 3,092 | 0.2% |
| Czechoslovakian | 801 | 0.0% |
| Danish | 2,712 | 0.2% |
| Delaware | 36 | 0.0% |
| Dominican | 2,170 | 0.1% |
| Dutch | 12,282 | 0.7% |
| Eastern European | 3,699 | 0.2% |
| Ecuadorian | 1,459 | 0.1% |
| Egyptian | 614 | 0.0% |
| English | 202,194 | 11.3% |
| Estonian | 89 | 0.0% |
| Ethiopian | 215 | 0.0% |
| European | 43,467 | 2.4% |
| Filipino | 355 | 0.0% |
| Finnish | 1,886 | 0.1% |
| French | 31,633 | 1.8% |
| French American Indian | 86 | 0.0% |
| French Canadian | 7,548 | 0.4% |
| German | 167,503 | 9.3% |
| German Russian | 16 | 0.0% |
| Ghanaian | 81 | 0.0% |
| Greek | 6,849 | 0.4% |
| Guamanian / Chamorro | 386 | 0.0% |
| Guatemalan | 4,536 | 0.3% |
| Guyanese | 237 | 0.0% |
| Haitian | 785 | 0.0% |
| Honduran | 6,102 | 0.3% |
| Hopi | 70 | 0.0% |
| Houma | 10 | 0.0% |
| Hungarian | 5,163 | 0.3% |
| Icelander | 206 | 0.0% |
| Indian (Asian) | 5,884 | 0.3% |
| Indonesian | 114 | 0.0% |
| Inupiat | 176 | 0.0% |
| Iranian | 418 | 0.0% |
| Iraqi | 62 | 0.0% |
| Irish | 163,123 | 9.1% |
| Iroquois | 356 | 0.0% |
| Israeli | 543 | 0.0% |
| Italian | 74,648 | 4.2% |
| Jamaican | 4,290 | 0.2% |
| Japanese | 209 | 0.0% |
| Jordanian | 95 | 0.0% |
| Kenyan | 283 | 0.0% |
| Kiowa | 11 | 0.0% |
| Korean | 11,116 | 0.6% |
| Laotian | 161 | 0.0% |
| Latvian | 124 | 0.0% |
| Lebanese | 2,608 | 0.2% |
| Lithuanian | 2,007 | 0.1% |
| Lumbee | 1,713 | 0.1% |
| Luxembourger | 60 | 0.0% |
| Macedonian | 96 | 0.0% |
| Malaysian | 488 | 0.0% |
| Maltese | 69 | 0.0% |
| Marshallese | 11 | 0.0% |
| Mexican | 55,760 | 3.1% |
| Mexican American Indian | 384 | 0.0% |
| Mongolian | 16 | 0.0% |
| Moroccan | 188 | 0.0% |
| Native Hawaiian | 809 | 0.1% |
| Navajo | 36 | 0.0% |
| New Zealander | 32 | 0.0% |
| Nicaraguan | 533 | 0.0% |
| Nigerian | 477 | 0.0% |
| Northern European | 1,747 | 0.1% |
| Norwegian | 8,610 | 0.5% |
| Osage | 65 | 0.0% |
| Ottawa | 23 | 0.0% |
| Paiute | 11 | 0.0% |
| Pakistani | 1,344 | 0.1% |
| Palestinian | 433 | 0.0% |
| Panamanian | 850 | 0.1% |
| Paraguayan | 13 | 0.0% |
| Pennsylvania German | 598 | 0.0% |
| Peruvian | 634 | 0.0% |
| Pima | 7 | 0.0% |
| Polish | 30,641 | 1.7% |
| Portuguese | 4,214 | 0.2% |
| Potawatomi | 17 | 0.0% |
| Pueblo | 139 | 0.0% |
| Puerto Rican | 13,930 | 0.8% |
| Puget Sound Salish | 5 | 0.0% |
| Romanian | 1,389 | 0.1% |
| Russian | 7,060 | 0.4% |
| Salvadoran | 1,656 | 0.1% |
| Samoan | 188 | 0.0% |
| Scandinavian | 3,968 | 0.2% |
| Scotch-Irish | 26,674 | 1.5% |
| Scottish | 35,685 | 2.0% |
| Seminole | 98 | 0.0% |
| Serbian | 488 | 0.0% |
| Sierra Leonean | 24 | 0.0% |
| Sioux | 183 | 0.0% |
| Slavic | 699 | 0.0% |
| Slovak | 2,471 | 0.1% |
| Slovene | 437 | 0.0% |
| South African | 526 | 0.0% |
| South American | 8,613 | 0.5% |
| South American Indian | 5 | 0.0% |
| Spaniard | 2,039 | 0.1% |
| Spanish | 2,029 | 0.1% |
| Spanish American | 25 | 0.0% |
| Spanish American Indian | 1 | 0.0% |
| Sri Lankan | 4,670 | 0.3% |
| Subsaharan African | 10,611 | 0.6% |
| Sudanese | 68 | 0.0% |
| Swedish | 9,049 | 0.5% |
| Swiss | 2,127 | 0.1% |
| Syrian | 547 | 0.0% |
| Thai | 5,194 | 0.3% |
| Tlingit-Haida | 19 | 0.0% |
| Trinidadian and Tobagonian | 570 | 0.0% |
| Turkish | 716 | 0.0% |
| U.S. Virgin Islander | 45 | 0.0% |
| Ugandan | 25 | 0.0% |
| Ukrainian | 3,903 | 0.2% |
| Uruguayan | 161 | 0.0% |
| Ute | 14 | 0.0% |
| Venezuelan | 1,404 | 0.1% |
| Vietnamese | 269 | 0.0% |
| Welsh | 8,555 | 0.5% |
| West Indian | 522 | 0.0% |
| Yaqui | 14 | 0.0% |
| Yugoslavian | 505 | 0.0% |
| Yup'ik | 34 | 0.0% |
| Zimbabwean | 40 | 0.0% | View All 176 Rows |
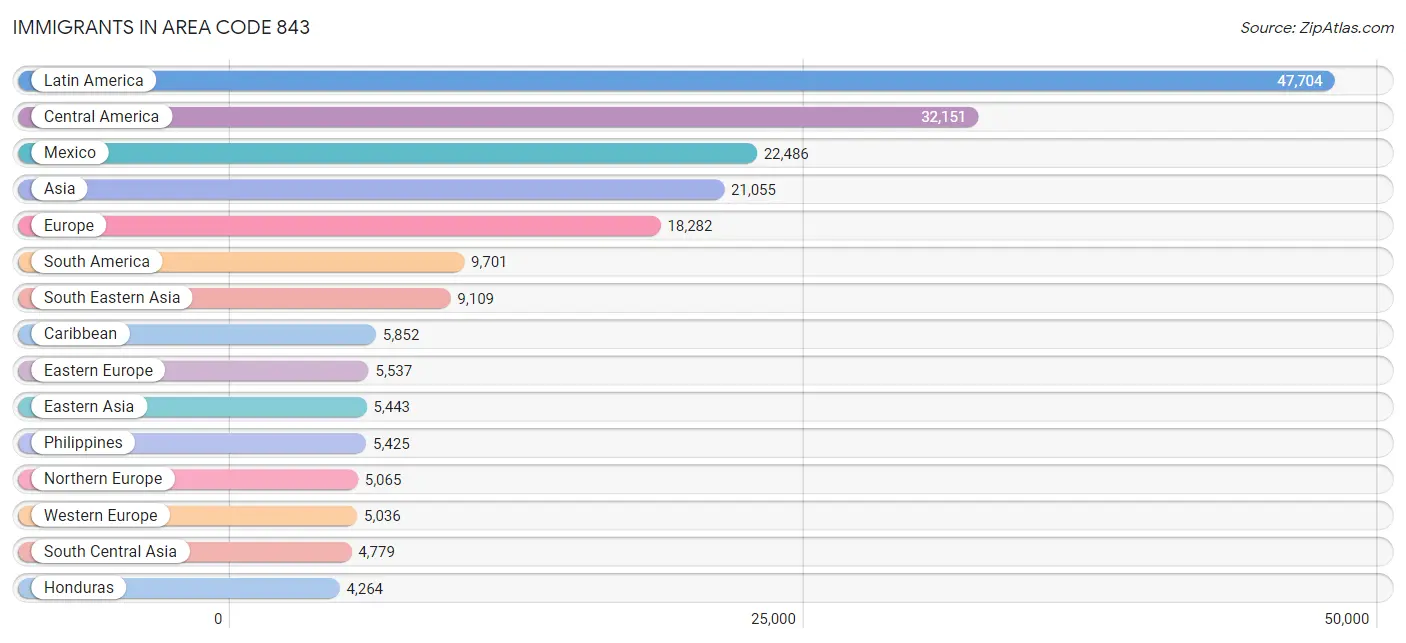
Immigrants in Area Code 843
The most numerous immigrant groups reported in Area Code 843 came from Latin America (47,704 | 2.7%), Central America (32,151 | 1.8%), Mexico (22,486 | 1.3%), Asia (21,055 | 1.2%), and Europe (18,282 | 1.0%), together accounting for 7.9% of all Area Code 843 residents.
| Immigration Origin | # Population | % Population |
| Afghanistan | 70 | 0.0% |
| Africa | 3,415 | 0.2% |
| Albania | 450 | 0.0% |
| Argentina | 589 | 0.0% |
| Armenia | 31 | 0.0% |
| Asia | 21,055 | 1.2% |
| Australia | 289 | 0.0% |
| Austria | 225 | 0.0% |
| Bahamas | 188 | 0.0% |
| Bangladesh | 186 | 0.0% |
| Barbados | 60 | 0.0% |
| Belarus | 31 | 0.0% |
| Belgium | 122 | 0.0% |
| Belize | 117 | 0.0% |
| Bolivia | 498 | 0.0% |
| Bosnia and Herzegovina | 235 | 0.0% |
| Brazil | 2,876 | 0.2% |
| Bulgaria | 235 | 0.0% |
| Cambodia | 48 | 0.0% |
| Cameroon | 150 | 0.0% |
| Canada | 3,195 | 0.2% |
| Caribbean | 5,852 | 0.3% |
| Central America | 32,151 | 1.8% |
| Chile | 257 | 0.0% |
| China | 3,371 | 0.2% |
| Colombia | 2,346 | 0.1% |
| Costa Rica | 496 | 0.0% |
| Croatia | 8 | 0.0% |
| Cuba | 933 | 0.1% |
| Czechoslovakia | 281 | 0.0% |
| Denmark | 186 | 0.0% |
| Dominica | 17 | 0.0% |
| Dominican Republic | 934 | 0.1% |
| Eastern Africa | 804 | 0.0% |
| Eastern Asia | 5,443 | 0.3% |
| Eastern Europe | 5,537 | 0.3% |
| Ecuador | 1,023 | 0.1% |
| Egypt | 555 | 0.0% |
| El Salvador | 868 | 0.1% |
| England | 1,800 | 0.1% |
| Ethiopia | 236 | 0.0% |
| Europe | 18,282 | 1.0% |
| Fiji | 8 | 0.0% |
| France | 782 | 0.0% |
| Germany | 3,467 | 0.2% |
| Ghana | 107 | 0.0% |
| Greece | 632 | 0.0% |
| Grenada | 32 | 0.0% |
| Guatemala | 3,102 | 0.2% |
| Guyana | 389 | 0.0% |
| Haiti | 264 | 0.0% |
| Honduras | 4,264 | 0.2% |
| Hong Kong | 419 | 0.0% |
| Hungary | 384 | 0.0% |
| India | 3,307 | 0.2% |
| Indonesia | 86 | 0.0% |
| Iran | 248 | 0.0% |
| Iraq | 40 | 0.0% |
| Ireland | 590 | 0.0% |
| Israel | 386 | 0.0% |
| Italy | 941 | 0.1% |
| Jamaica | 2,861 | 0.2% |
| Japan | 739 | 0.0% |
| Jordan | 148 | 0.0% |
| Kazakhstan | 109 | 0.0% |
| Kenya | 402 | 0.0% |
| Korea | 1,333 | 0.1% |
| Laos | 90 | 0.0% |
| Latin America | 47,704 | 2.7% |
| Latvia | 61 | 0.0% |
| Lebanon | 82 | 0.0% |
| Liberia | 1 | 0.0% |
| Lithuania | 69 | 0.0% |
| Malaysia | 2 | 0.0% |
| Mexico | 22,486 | 1.3% |
| Micronesia | 279 | 0.0% |
| Middle Africa | 192 | 0.0% |
| Moldova | 255 | 0.0% |
| Morocco | 165 | 0.0% |
| Nepal | 106 | 0.0% |
| Netherlands | 370 | 0.0% |
| Nicaragua | 212 | 0.0% |
| Nigeria | 253 | 0.0% |
| North Macedonia | 54 | 0.0% |
| Northern Africa | 958 | 0.1% |
| Northern Europe | 5,065 | 0.3% |
| Norway | 90 | 0.0% |
| Oceania | 669 | 0.0% |
| Pakistan | 419 | 0.0% |
| Panama | 504 | 0.0% |
| Peru | 259 | 0.0% |
| Philippines | 5,425 | 0.3% |
| Poland | 737 | 0.0% |
| Portugal | 620 | 0.0% |
| Romania | 646 | 0.0% |
| Russia | 840 | 0.1% |
| Saudi Arabia | 75 | 0.0% |
| Scotland | 567 | 0.0% |
| Serbia | 70 | 0.0% |
| Singapore | 41 | 0.0% |
| Somalia | 6 | 0.0% |
| South Africa | 645 | 0.0% |
| South America | 9,701 | 0.5% |
| South Central Asia | 4,779 | 0.3% |
| South Eastern Asia | 9,109 | 0.5% |
| Southern Europe | 2,512 | 0.1% |
| Spain | 319 | 0.0% |
| Sri Lanka | 1 | 0.0% |
| St. Vincent and the Grenadines | 3 | 0.0% |
| Sudan | 34 | 0.0% |
| Sweden | 368 | 0.0% |
| Switzerland | 52 | 0.0% |
| Syria | 8 | 0.0% |
| Taiwan | 484 | 0.0% |
| Thailand | 644 | 0.0% |
| Trinidad and Tobago | 427 | 0.0% |
| Turkey | 503 | 0.0% |
| Uganda | 45 | 0.0% |
| Ukraine | 1,027 | 0.1% |
| Uruguay | 216 | 0.0% |
| Uzbekistan | 311 | 0.0% |
| Venezuela | 1,219 | 0.1% |
| Vietnam | 2,682 | 0.2% |
| West Indies | 18 | 0.0% |
| Western Africa | 494 | 0.0% |
| Western Asia | 1,355 | 0.1% |
| Western Europe | 5,036 | 0.3% |
| Zaire | 15 | 0.0% |
| Zimbabwe | 46 | 0.0% | View All 129 Rows |
Sex and Age in Area Code 843
Sex and Age in Area Code 843
The most populous age groups in Area Code 843 are 60 to 64 Years (60,211 | 6.9%) for men and 60 to 64 Years (68,933 | 7.5%) for women.
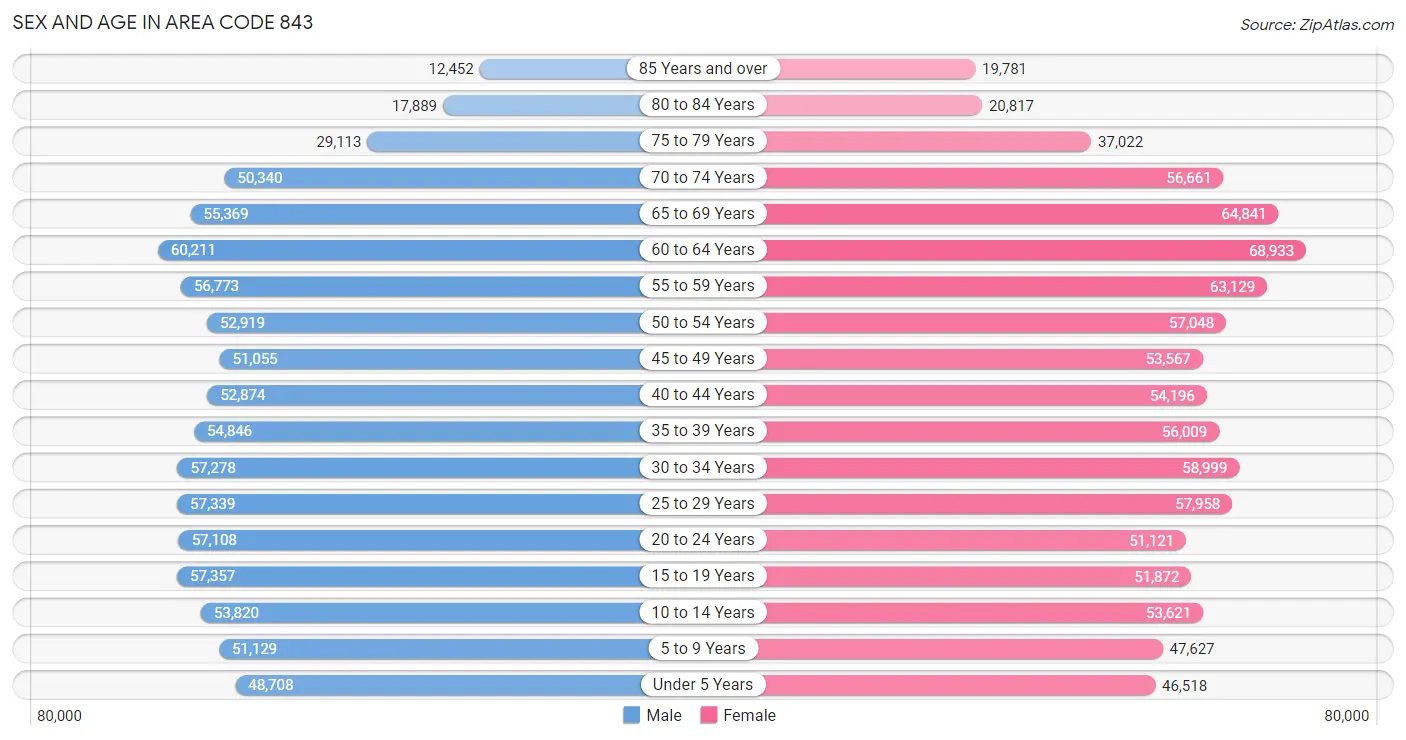
| Age Bracket | Male | Female |
| Under 5 Years | 48,708 (5.6%) | 46,518 (5.1%) |
| 5 to 9 Years | 51,129 (5.8%) | 47,627 (5.2%) |
| 10 to 14 Years | 53,820 (6.1%) | 53,621 (5.8%) |
| 15 to 19 Years | 57,357 (6.5%) | 51,872 (5.6%) |
| 20 to 24 Years | 57,108 (6.5%) | 51,121 (5.6%) |
| 25 to 29 Years | 57,339 (6.5%) | 57,958 (6.3%) |
| 30 to 34 Years | 57,278 (6.5%) | 58,999 (6.4%) |
| 35 to 39 Years | 54,846 (6.3%) | 56,009 (6.1%) |
| 40 to 44 Years | 52,874 (6.0%) | 54,196 (5.9%) |
| 45 to 49 Years | 51,055 (5.8%) | 53,567 (5.8%) |
| 50 to 54 Years | 52,919 (6.0%) | 57,048 (6.2%) |
| 55 to 59 Years | 56,773 (6.5%) | 63,129 (6.9%) |
| 60 to 64 Years | 60,211 (6.9%) | 68,933 (7.5%) |
| 65 to 69 Years | 55,369 (6.3%) | 64,841 (7.0%) |
| 70 to 74 Years | 50,340 (5.7%) | 56,661 (6.2%) |
| 75 to 79 Years | 29,113 (3.3%) | 37,022 (4.0%) |
| 80 to 84 Years | 17,889 (2.0%) | 20,817 (2.3%) |
| 85 Years and over | 12,452 (1.4%) | 19,781 (2.1%) |
| Total | 876,580 (100.0%) | 919,720 (100.0%) |
Families and Households in Area Code 843
Median Family Size in Area Code 843
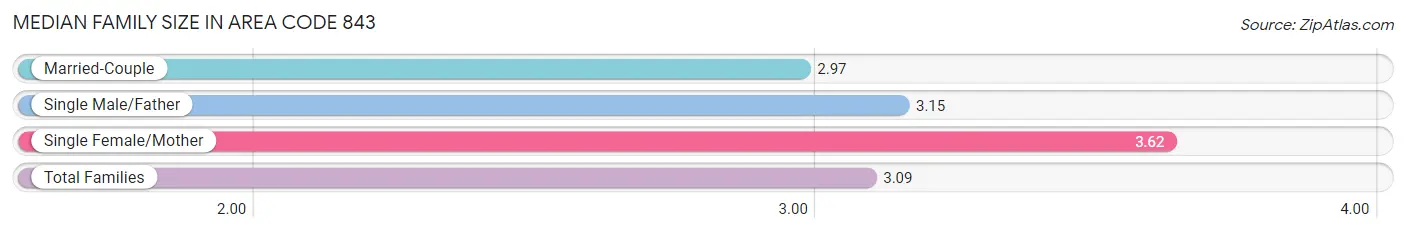
The median family size in Area Code 843 is 3.09 persons per family, with single female/mother families (92,959 | 20.4%) accounting for the largest median family size of 3.62433 persons per family. On the other hand, married-couple families (332,877 | 73.1%) represent the smallest median family size with 2.97 persons per family.
| Family Type | # Families | Family Size |
| Married-Couple | 332,877 (73.1%) | 2.97 |
| Single Male/Father | 29,852 (6.6%) | 3.15 |
| Single Female/Mother | 92,959 (20.4%) | 3.62 |
| Total Families | 455,688 (100.0%) | 3.09 |
Median Household Size in Area Code 843
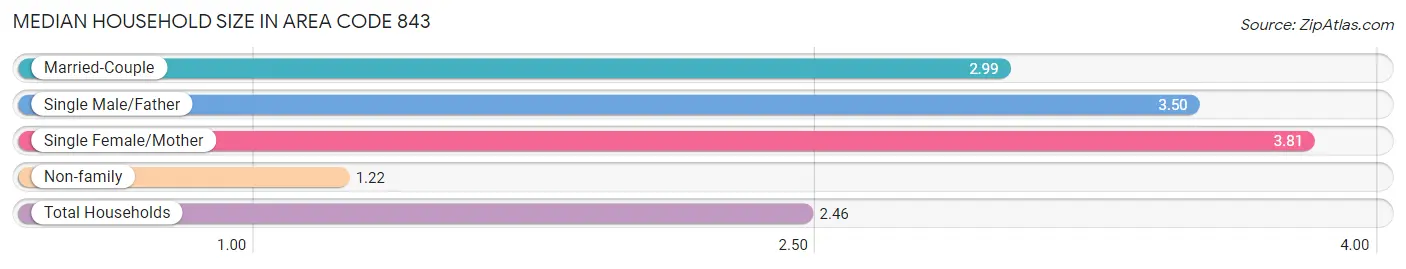
The median household size in Area Code 843 is 2.46 persons per household, with single female/mother households (92,959 | 13.1%) accounting for the largest median household size of 3.80757 persons per household. non-family households (256,879 | 36.0%) represent the smallest median household size with 1.22 persons per household.
| Household Type | # Households | Household Size |
| Married-Couple | 332,877 (46.7%) | 2.99 |
| Single Male/Father | 29,852 (4.2%) | 3.50 |
| Single Female/Mother | 92,959 (13.1%) | 3.81 |
| Non-family | 256,879 (36.0%) | 1.22 |
| Total Households | 712,567 (100.0%) | 2.46 |
Household Size by Marriage Status in Area Code 843
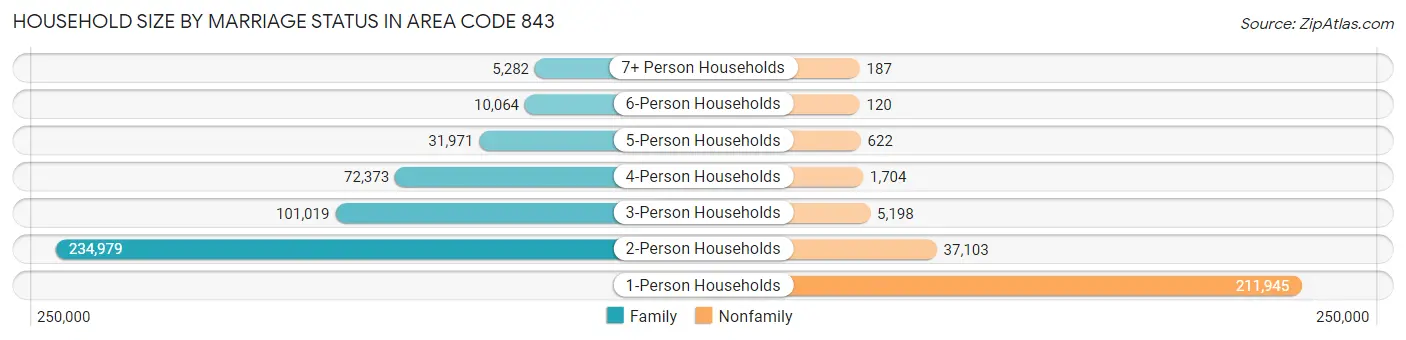
Out of a total of 712,567 households in Area Code 843, 455,688 (63.9%) are family households, while 256,879 (36.0%) are nonfamily households. The most numerous type of family households are 2-person households, comprising 234,979, and the most common type of nonfamily households are 1-person households, comprising 211,945.
| Household Size | Family Households | Nonfamily Households |
| 1-Person Households | - | 211,945 (29.7%) |
| 2-Person Households | 234,979 (33.0%) | 37,103 (5.2%) |
| 3-Person Households | 101,019 (14.2%) | 5,198 (0.7%) |
| 4-Person Households | 72,373 (10.2%) | 1,704 (0.2%) |
| 5-Person Households | 31,971 (4.5%) | 622 (0.1%) |
| 6-Person Households | 10,064 (1.4%) | 120 (0.0%) |
| 7+ Person Households | 5,282 (0.7%) | 187 (0.0%) |
| Total | 455,688 (63.9%) | 256,879 (36.0%) |
Female Fertility in Area Code 843
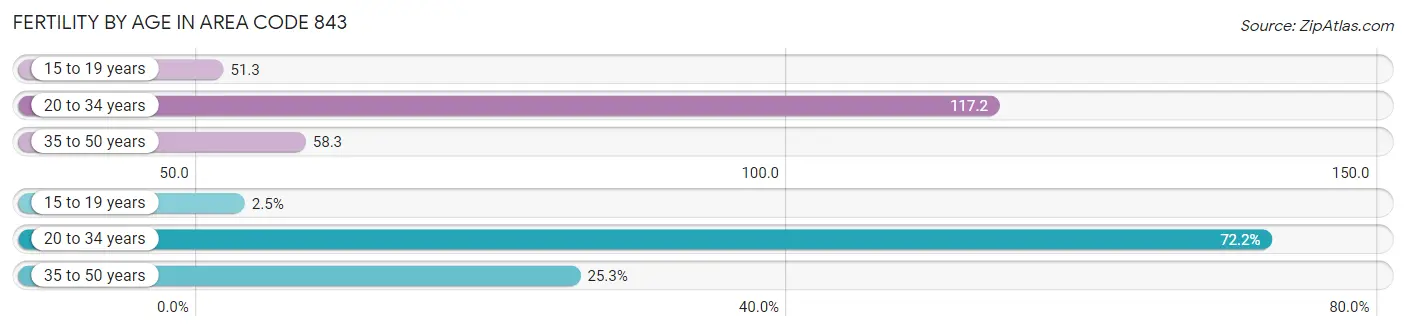
Fertility by Age in Area Code 843
Average fertility rate in Area Code 843 is 61.6 births per 1,000 women. Women in the age bracket of 20 to 34 years have the highest fertility rate with 117.2 births per 1,000 women. Women in the age bracket of 20 to 34 years acount for 72.2% of all women with births.
| Age Bracket | Women with Births | Births / 1,000 Women |
| 15 to 19 years | 497 (2.5%) | 51.3 |
| 20 to 34 years | 14,338 (72.2%) | 117.2 |
| 35 to 50 years | 5,018 (25.3%) | 58.3 |
| Total | 19,853 (100.0%) | 61.6 |
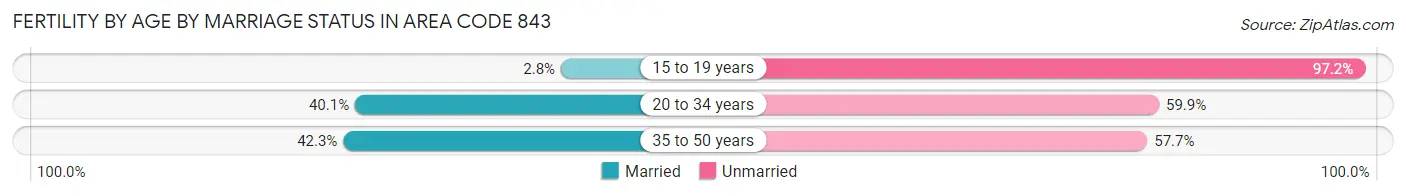
Fertility by Age by Marriage Status in Area Code 843
46.8% of women with births (19,853) in Area Code 843 are married. The highest percentage of unmarried women with births falls into 15 to 19 years age bracket with 97.2% of them unmarried at the time of birth, while the lowest percentage of unmarried women with births belong to 35 to 50 years age bracket with 57.7% of them unmarried.
| Age Bracket | Married | Unmarried |
| 15 to 19 years | 14 (2.8%) | 483 (97.2%) |
| 20 to 34 years | 5,754 (40.1%) | 8,584 (59.9%) |
| 35 to 50 years | 2,121 (42.3%) | 2,897 (57.7%) |
| Total | 9,291 (46.8%) | 10,562 (53.2%) |
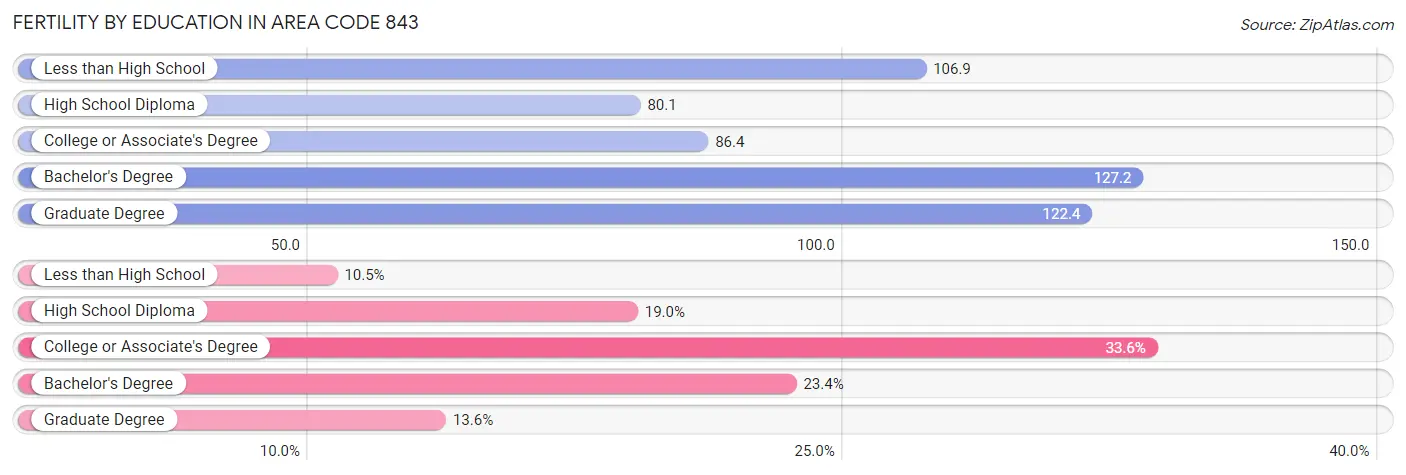
Fertility by Education in Area Code 843
Average fertility rate in Area Code 843 is 61.6 births per 1,000 women. Women with the education attainment of bachelor's degree have the highest fertility rate of 127.2 births per 1,000 women, while women with the education attainment of high school diploma have the lowest fertility at 80.1 births per 1,000 women. Women with the education attainment of college or associate's degree represent 33.6% of all women with births.
| Educational Attainment | Women with Births | Births / 1,000 Women |
| Less than High School | 2,087 (10.5%) | 106.9 |
| High School Diploma | 3,763 (19.0%) | 80.1 |
| College or Associate's Degree | 6,663 (33.6%) | 86.4 |
| Bachelor's Degree | 4,648 (23.4%) | 127.2 |
| Graduate Degree | 2,692 (13.6%) | 122.4 |
| Total | 19,853 (100.0%) | 61.6 |
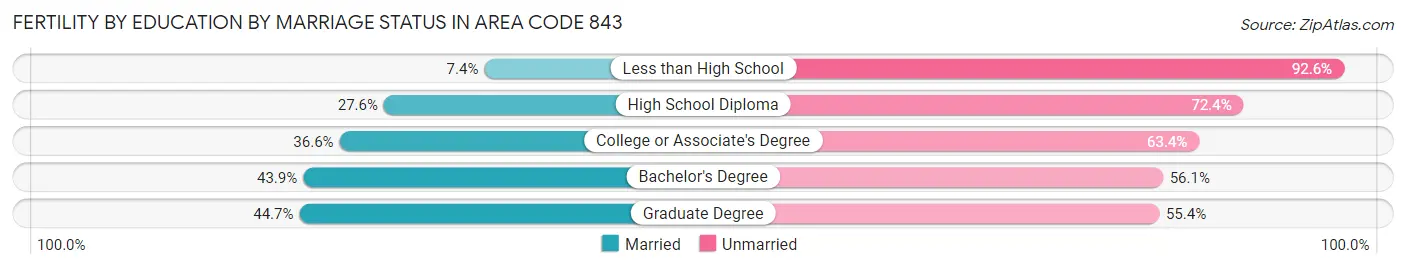
Fertility by Education by Marriage Status in Area Code 843
53.2% of women with births in Area Code 843 are unmarried. Women with the educational attainment of graduate degree are most likely to be married with 44.7% of them married at childbirth, while women with the educational attainment of less than high school are least likely to be married with 92.6% of them unmarried at childbirth.
| Educational Attainment | Married | Unmarried |
| Less than High School | 154 (7.4%) | 1,933 (92.6%) |
| High School Diploma | 1,039 (27.6%) | 2,724 (72.4%) |
| College or Associate's Degree | 2,436 (36.6%) | 4,227 (63.4%) |
| Bachelor's Degree | 2,040 (43.9%) | 2,608 (56.1%) |
| Graduate Degree | 1,202 (44.7%) | 1,490 (55.3%) |
| Total | 9,291 (46.8%) | 10,562 (53.2%) |
Employment Characteristics in Area Code 843
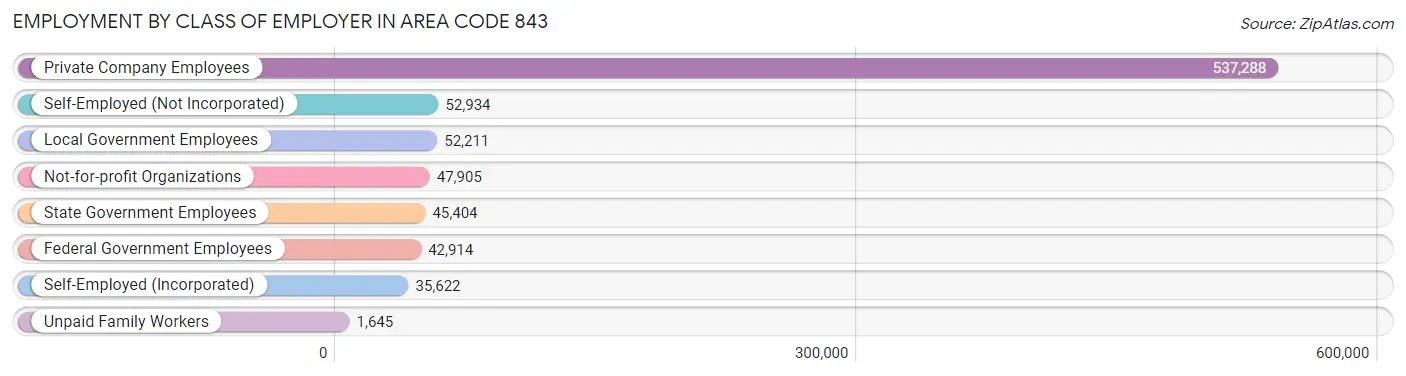
Employment by Class of Employer in Area Code 843
Among the 815,923 employed individuals in Area Code 843, private company employees (537,288 | 65.8%), self-employed (not incorporated) (52,934 | 6.5%), and local government employees (52,211 | 6.4%) make up the most common classes of employment.
| Employer Class | # Employees | % Employees |
| Private Company Employees | 537,288 | 65.8% |
| Self-Employed (Incorporated) | 35,622 | 4.4% |
| Self-Employed (Not Incorporated) | 52,934 | 6.5% |
| Not-for-profit Organizations | 47,905 | 5.9% |
| Local Government Employees | 52,211 | 6.4% |
| State Government Employees | 45,404 | 5.6% |
| Federal Government Employees | 42,914 | 5.3% |
| Unpaid Family Workers | 1,645 | 0.2% |
| Total | 815,923 | 100.0% |
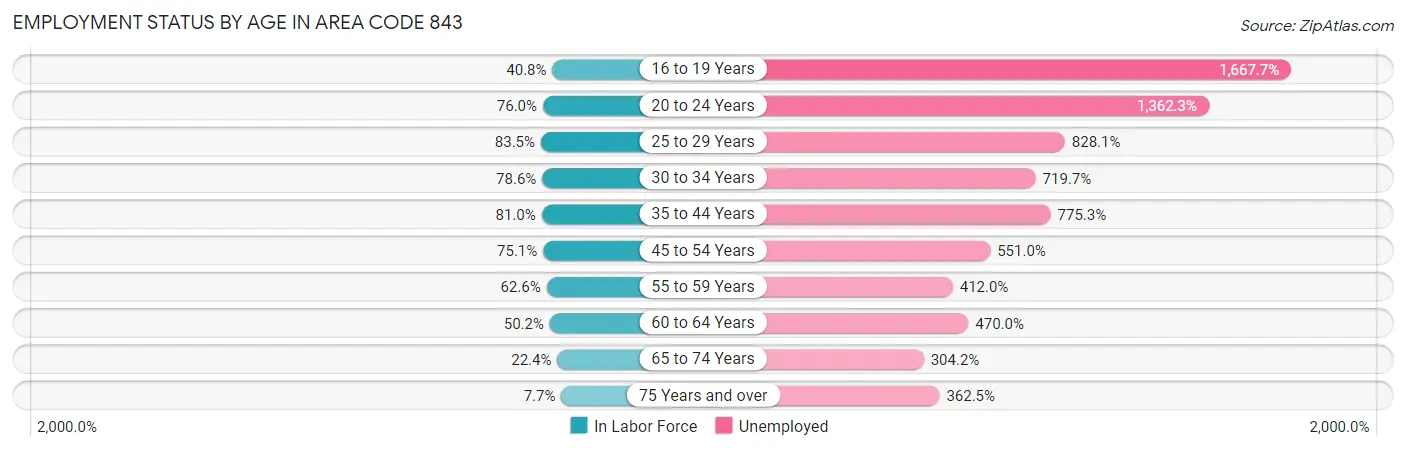
Employment Status by Age in Area Code 843
According to the labor force statistics for Area Code 843, out of the total population over 16 years of age (1,474,067), 54.9% or 808,821 individuals are in the labor force, with 6.0% or 48,367 of them unemployed. The age group with the highest labor force participation rate is 25 to 29 years, with 83.5% or 96,285 individuals in the labor force. Within the labor force, the 16 to 19 years age range has the highest percentage of unemployed individuals, with 1,667.7% or 601,323 of them being unemployed.
| Age Bracket | In Labor Force | Unemployed |
| 16 to 19 Years | 36,057 (40.8%) | 601,323 (1,667.7%) |
| 20 to 24 Years | 82,283 (76.0%) | 1,120,996 (1,362.3%) |
| 25 to 29 Years | 96,289 (83.5%) | 797,336 (828.1%) |
| 30 to 34 Years | 91,432 (78.6%) | 658,015 (719.7%) |
| 35 to 44 Years | 176,513 (81.0%) | 1,368,552 (775.3%) |
| 45 to 54 Years | 161,067 (75.1%) | 887,501 (551.0%) |
| 55 to 59 Years | 75,085 (62.6%) | 309,342 (412.0%) |
| 60 to 64 Years | 64,887 (50.2%) | 304,945 (470.0%) |
| 65 to 74 Years | 50,804 (22.4%) | 154,546 (304.2%) |
| 75 Years and over | 10,519 (7.7%) | 38,113 (362.5%) |
| Total | 808,830 (54.9%) | 48,356 (6.0%) |
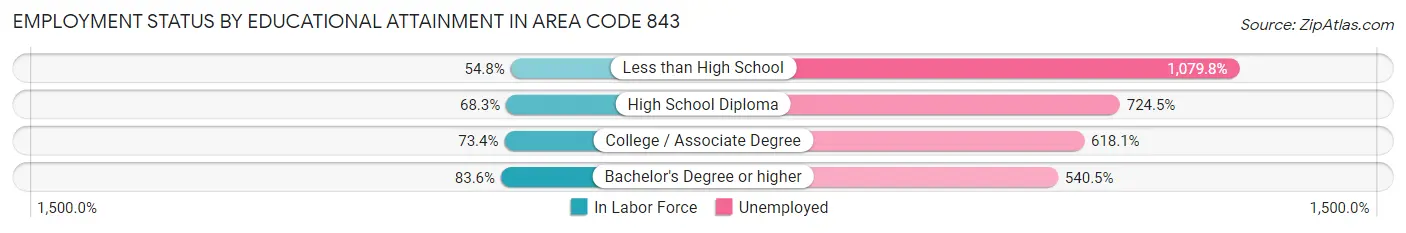
Employment Status by Educational Attainment in Area Code 843
According to labor force statistics for Area Code 843, 71.8% of individuals (655,356) out of the total population between 25 and 64 years of age (913,134) are in the labor force, with 681.4% or 4,465,596 of them being unemployed. The group with the highest labor force participation rate are those with the educational attainment of bachelor's degree or higher, with 83.6% or 242,121 individuals in the labor force. Within the labor force, individuals with less than high school education have the highest percentage of unemployment, with 1,079.8% or 486,590 of them being unemployed.
| Educational Attainment | In Labor Force | Unemployed |
| Less than High School | 45,064 (54.8%) | 887,293 (1,079.8%) |
| High School Diploma | 177,516 (68.2%) | 1,884,388 (724.5%) |
| College / Associate Degree | 206,475 (73.4%) | 1,737,967 (618.1%) |
| Bachelor's Degree or higher | 242,127 (83.6%) | 1,565,764 (540.5%) |
| Total | 655,394 (71.8%) | 6,222,095 (681.4%) |
Employment Occupations by Sex in Area Code 843
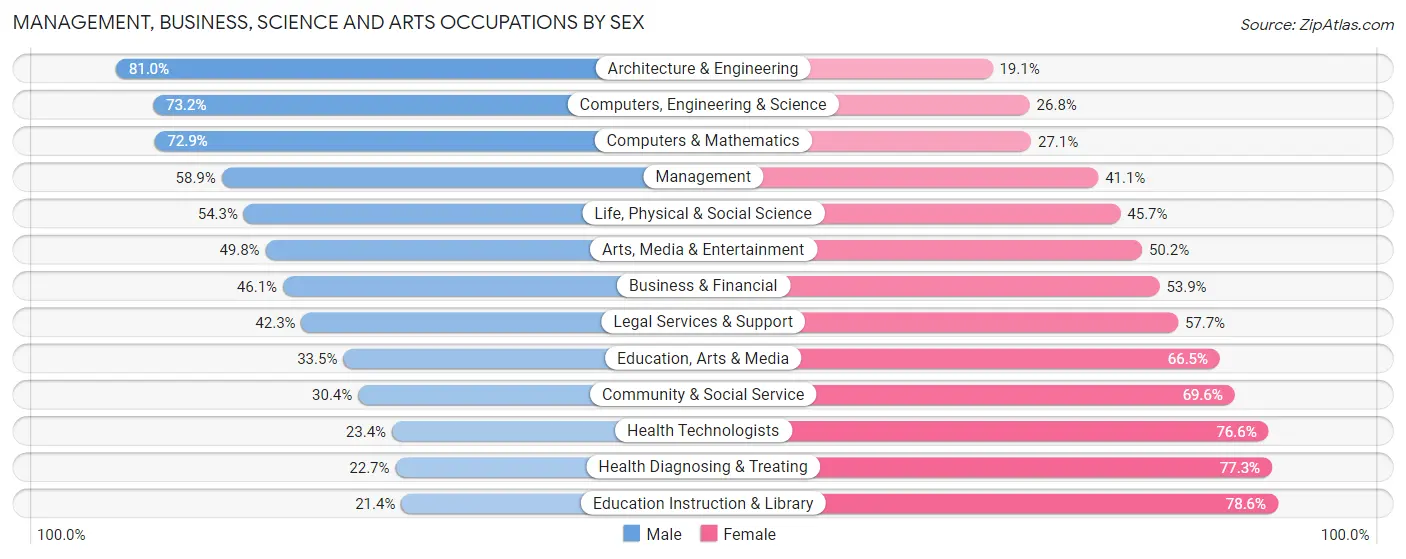
Management, Business, Science and Arts Occupations
The most common Management, Business, Science and Arts occupations in Area Code 843 are Management (87,144 | 10.7%), Community & Social Service (82,573 | 10.2%), Health Diagnosing & Treating (55,682 | 6.9%), Education Instruction & Library (46,520 | 5.7%), and Computers, Engineering & Science (41,596 | 5.1%).
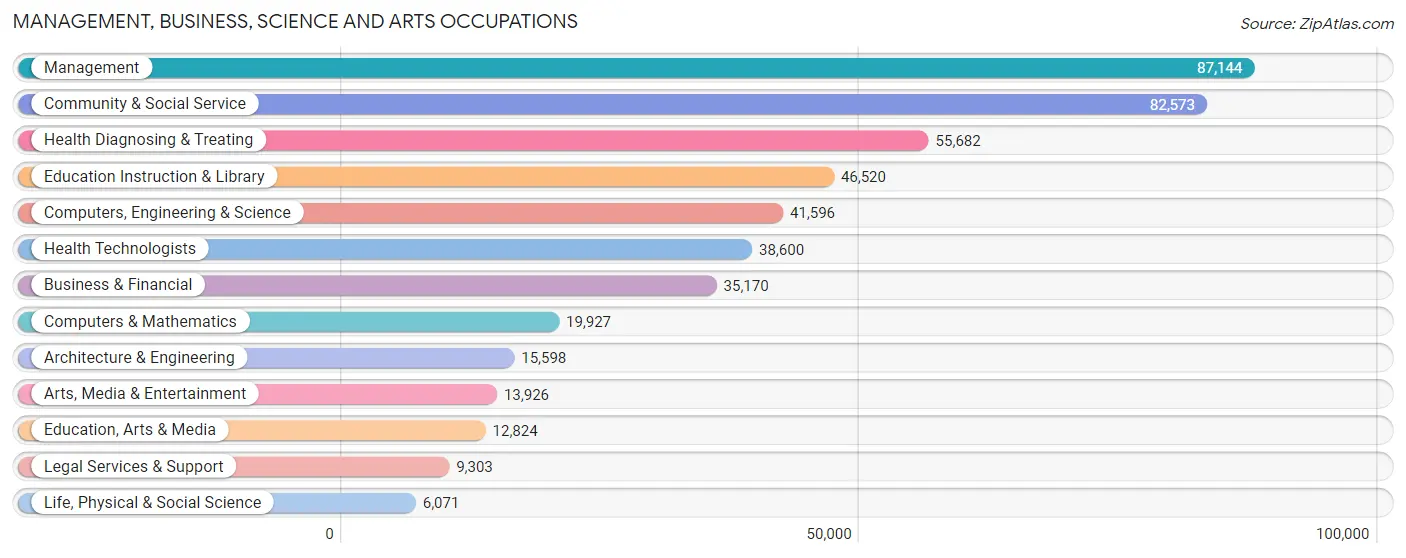
Management, Business, Science and Arts Occupations by Sex
Within the Management, Business, Science and Arts occupations in Area Code 843, the most male-oriented occupations are Architecture & Engineering (80.9%), Computers, Engineering & Science (73.2%), and Computers & Mathematics (72.9%), while the most female-oriented occupations are Education Instruction & Library (78.6%), Health Diagnosing & Treating (77.3%), and Health Technologists (76.6%).
| Occupation | Male | Female |
| Management | 51,324 (58.9%) | 35,820 (41.1%) |
| Business & Financial | 16,222 (46.1%) | 18,948 (53.9%) |
| Computers, Engineering & Science | 30,450 (73.2%) | 11,146 (26.8%) |
| Computers & Mathematics | 14,529 (72.9%) | 5,398 (27.1%) |
| Architecture & Engineering | 12,626 (80.9%) | 2,972 (19.1%) |
| Life, Physical & Social Science | 3,295 (54.3%) | 2,776 (45.7%) |
| Community & Social Service | 25,131 (30.4%) | 57,442 (69.6%) |
| Education, Arts & Media | 4,300 (33.5%) | 8,524 (66.5%) |
| Legal Services & Support | 3,931 (42.3%) | 5,372 (57.7%) |
| Education Instruction & Library | 9,970 (21.4%) | 36,550 (78.6%) |
| Arts, Media & Entertainment | 6,930 (49.8%) | 6,996 (50.2%) |
| Health Diagnosing & Treating | 12,616 (22.7%) | 43,066 (77.3%) |
| Health Technologists | 9,026 (23.4%) | 29,574 (76.6%) |
| Total (Category) | 135,743 (44.9%) | 166,422 (55.1%) |
| Total (Overall) | 417,939 (51.4%) | 394,443 (48.5%) |
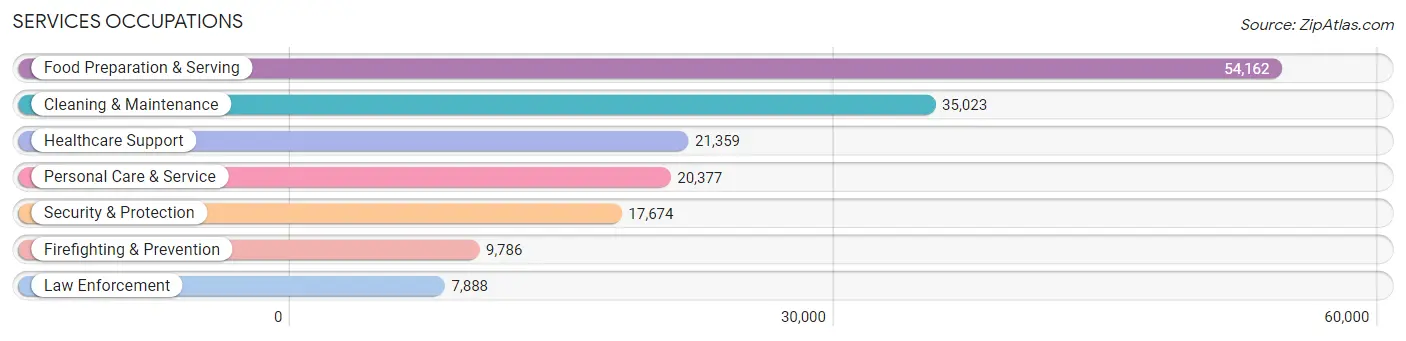
Services Occupations
The most common Services occupations in Area Code 843 are Food Preparation & Serving (54,162 | 6.7%), Cleaning & Maintenance (35,023 | 4.3%), Healthcare Support (21,359 | 2.6%), Personal Care & Service (20,377 | 2.5%), and Security & Protection (17,674 | 2.2%).
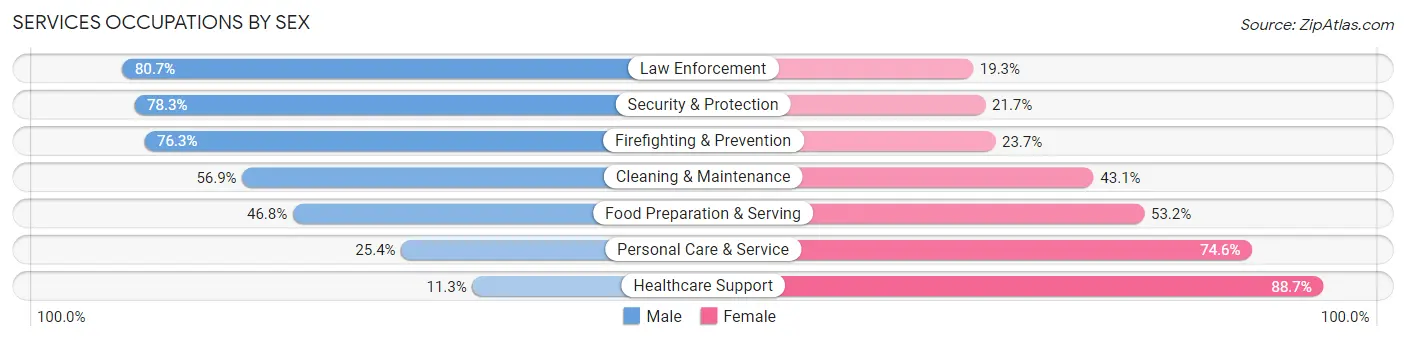
Services Occupations by Sex
Within the Services occupations in Area Code 843, the most male-oriented occupations are Law Enforcement (80.7%), Security & Protection (78.3%), and Firefighting & Prevention (76.3%), while the most female-oriented occupations are Healthcare Support (88.7%), Personal Care & Service (74.6%), and Food Preparation & Serving (53.2%).
| Occupation | Male | Female |
| Healthcare Support | 2,411 (11.3%) | 18,948 (88.7%) |
| Security & Protection | 13,839 (78.3%) | 3,835 (21.7%) |
| Firefighting & Prevention | 7,471 (76.3%) | 2,315 (23.7%) |
| Law Enforcement | 6,368 (80.7%) | 1,520 (19.3%) |
| Food Preparation & Serving | 25,370 (46.8%) | 28,792 (53.2%) |
| Cleaning & Maintenance | 19,913 (56.9%) | 15,110 (43.1%) |
| Personal Care & Service | 5,174 (25.4%) | 15,203 (74.6%) |
| Total (Category) | 66,707 (44.9%) | 81,888 (55.1%) |
| Total (Overall) | 417,939 (51.4%) | 394,443 (48.5%) |
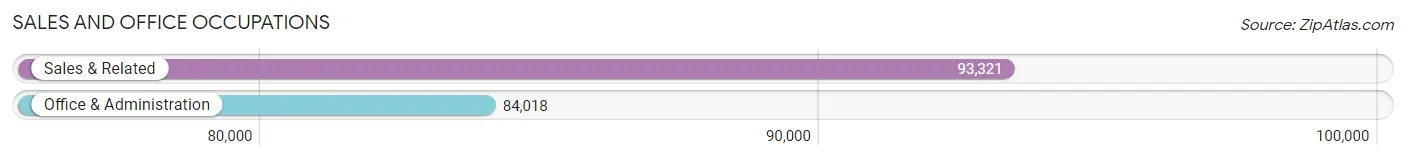
Sales and Office Occupations
The most common Sales and Office occupations in Area Code 843 are Sales & Related (93,321 | 11.5%), and Office & Administration (84,018 | 10.3%).
Sales and Office Occupations by Sex
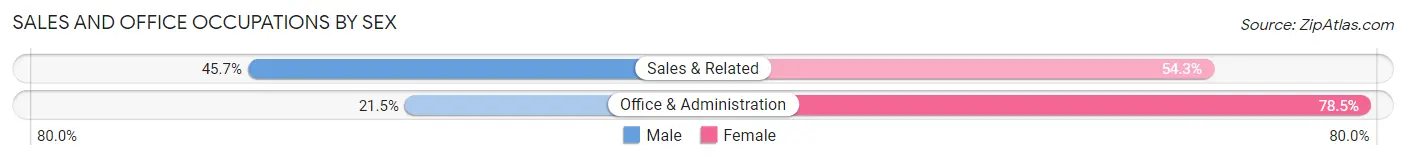
| Occupation | Male | Female |
| Sales & Related | 42,624 (45.7%) | 50,697 (54.3%) |
| Office & Administration | 18,079 (21.5%) | 65,939 (78.5%) |
| Total (Category) | 60,703 (34.2%) | 116,636 (65.8%) |
| Total (Overall) | 417,939 (51.4%) | 394,443 (48.5%) |
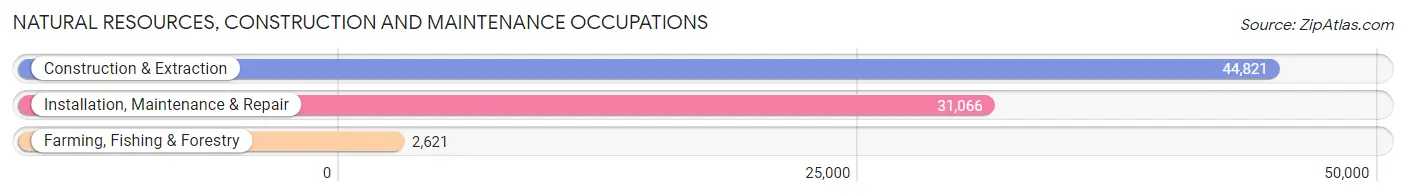
Natural Resources, Construction and Maintenance Occupations
The most common Natural Resources, Construction and Maintenance occupations in Area Code 843 are Construction & Extraction (44,821 | 5.5%), Installation, Maintenance & Repair (31,066 | 3.8%), and Farming, Fishing & Forestry (2,621 | 0.3%).
Natural Resources, Construction and Maintenance Occupations by Sex
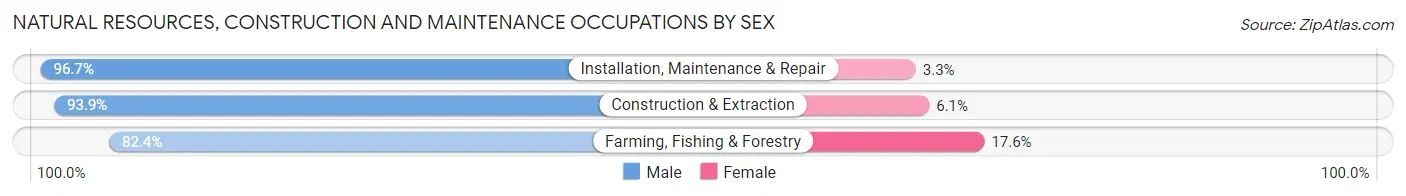
| Occupation | Male | Female |
| Farming, Fishing & Forestry | 2,160 (82.4%) | 461 (17.6%) |
| Construction & Extraction | 42,082 (93.9%) | 2,739 (6.1%) |
| Installation, Maintenance & Repair | 30,036 (96.7%) | 1,030 (3.3%) |
| Total (Category) | 74,278 (94.6%) | 4,230 (5.4%) |
| Total (Overall) | 417,939 (51.4%) | 394,443 (48.5%) |
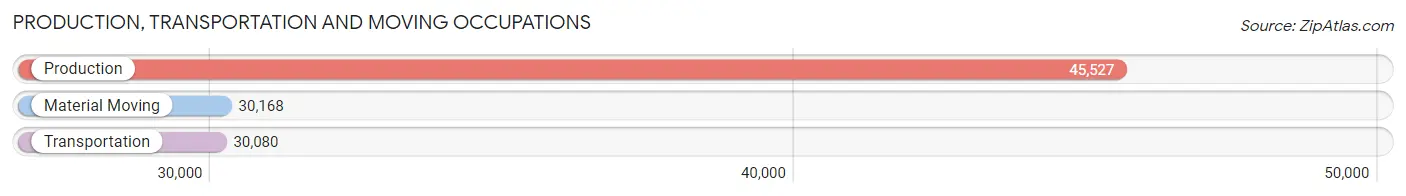
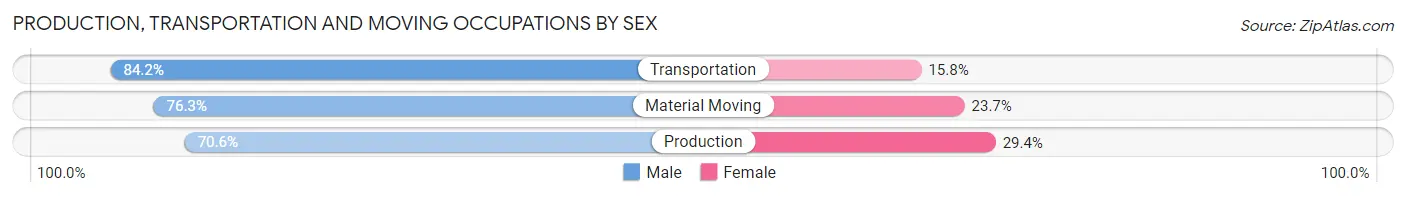
Production, Transportation and Moving Occupations
The most common Production, Transportation and Moving occupations in Area Code 843 are Production (45,527 | 5.6%), Material Moving (30,168 | 3.7%), and Transportation (30,080 | 3.7%).
Production, Transportation and Moving Occupations by Sex
| Occupation | Male | Female |
| Production | 32,148 (70.6%) | 13,379 (29.4%) |
| Transportation | 25,337 (84.2%) | 4,743 (15.8%) |
| Material Moving | 23,023 (76.3%) | 7,145 (23.7%) |
| Total (Category) | 80,508 (76.1%) | 25,267 (23.9%) |
| Total (Overall) | 417,939 (51.4%) | 394,443 (48.5%) |
Employment Industries by Sex in Area Code 843
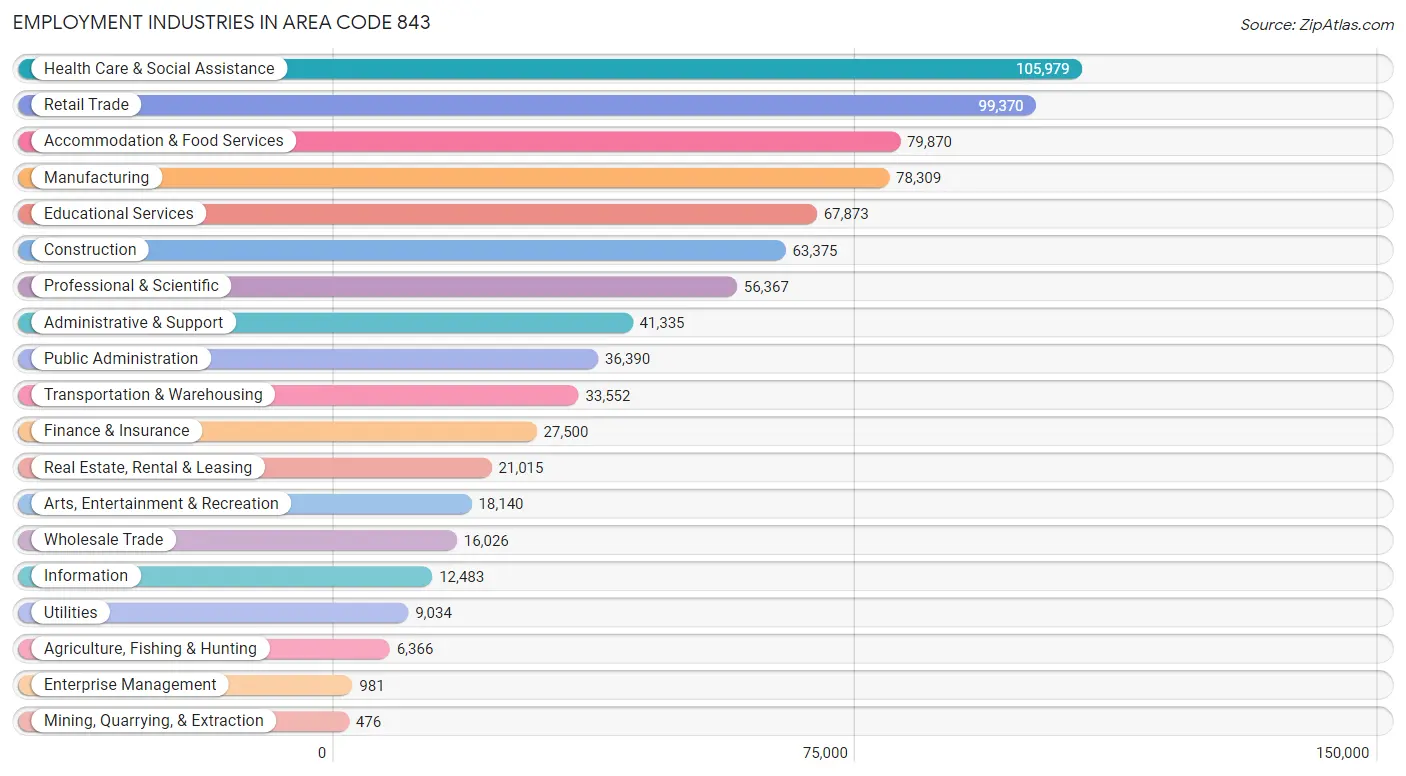
Employment Industries in Area Code 843
The major employment industries in Area Code 843 include Health Care & Social Assistance (105,979 | 13.1%), Retail Trade (99,370 | 12.2%), Accommodation & Food Services (79,870 | 9.8%), Manufacturing (78,309 | 9.6%), and Educational Services (67,873 | 8.4%).
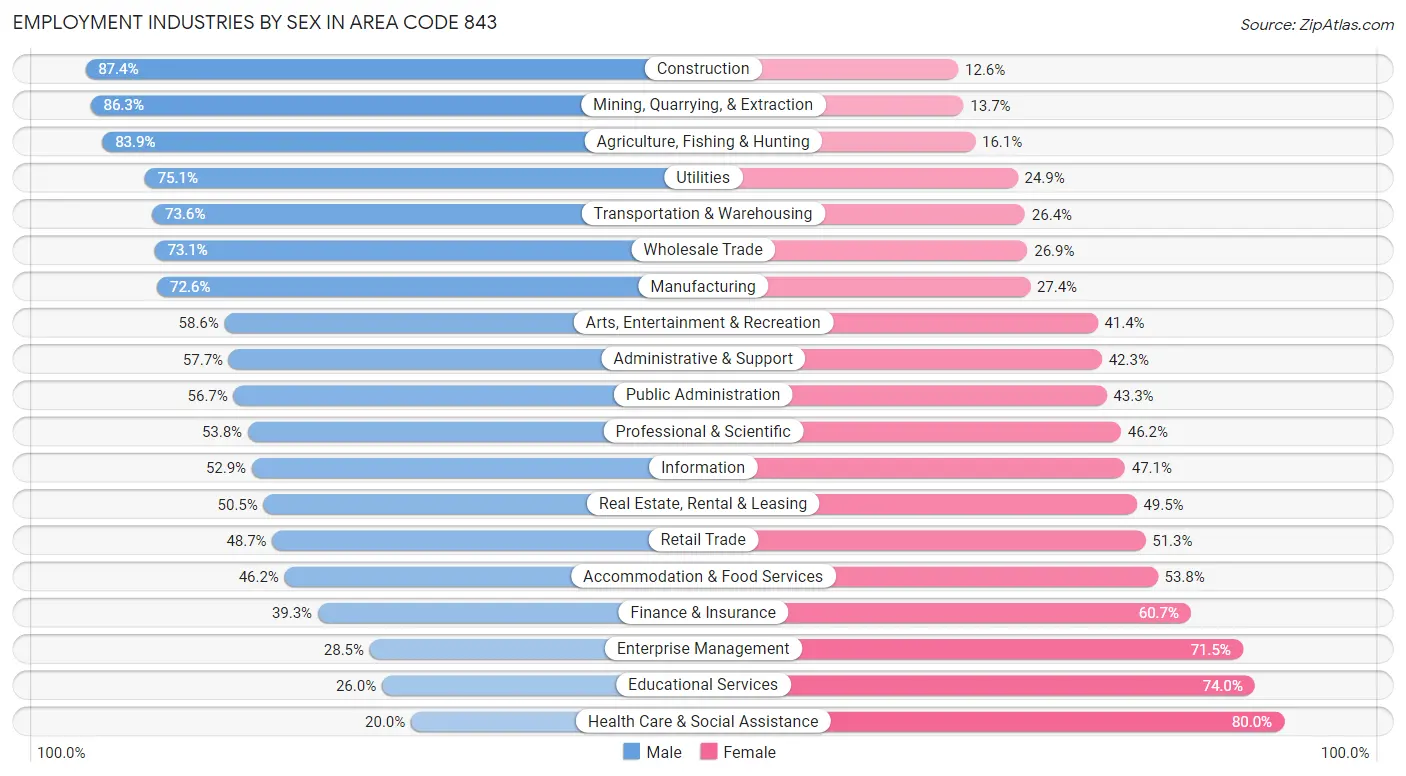
Employment Industries by Sex in Area Code 843
The Area Code 843 industries that see more men than women are Construction (87.4%), Mining, Quarrying, & Extraction (86.3%), and Agriculture, Fishing & Hunting (83.9%), whereas the industries that tend to have a higher number of women are Health Care & Social Assistance (80.0%), Educational Services (74.0%), and Enterprise Management (71.5%).
| Industry | Male | Female |
| Agriculture, Fishing & Hunting | 5,343 (83.9%) | 1,023 (16.1%) |
| Mining, Quarrying, & Extraction | 411 (86.3%) | 65 (13.7%) |
| Construction | 55,413 (87.4%) | 7,962 (12.6%) |
| Manufacturing | 56,828 (72.6%) | 21,481 (27.4%) |
| Wholesale Trade | 11,718 (73.1%) | 4,308 (26.9%) |
| Retail Trade | 48,394 (48.7%) | 50,976 (51.3%) |
| Transportation & Warehousing | 24,698 (73.6%) | 8,854 (26.4%) |
| Utilities | 6,788 (75.1%) | 2,246 (24.9%) |
| Information | 6,608 (52.9%) | 5,875 (47.1%) |
| Finance & Insurance | 10,803 (39.3%) | 16,697 (60.7%) |
| Real Estate, Rental & Leasing | 10,618 (50.5%) | 10,397 (49.5%) |
| Professional & Scientific | 30,307 (53.8%) | 26,060 (46.2%) |
| Enterprise Management | 280 (28.5%) | 701 (71.5%) |
| Administrative & Support | 23,853 (57.7%) | 17,482 (42.3%) |
| Educational Services | 17,666 (26.0%) | 50,207 (74.0%) |
| Health Care & Social Assistance | 21,196 (20.0%) | 84,783 (80.0%) |
| Arts, Entertainment & Recreation | 10,630 (58.6%) | 7,510 (41.4%) |
| Accommodation & Food Services | 36,871 (46.2%) | 42,999 (53.8%) |
| Public Administration | 20,648 (56.7%) | 15,742 (43.3%) |
| Total | 417,939 (51.4%) | 394,443 (48.5%) |
Education in Area Code 843
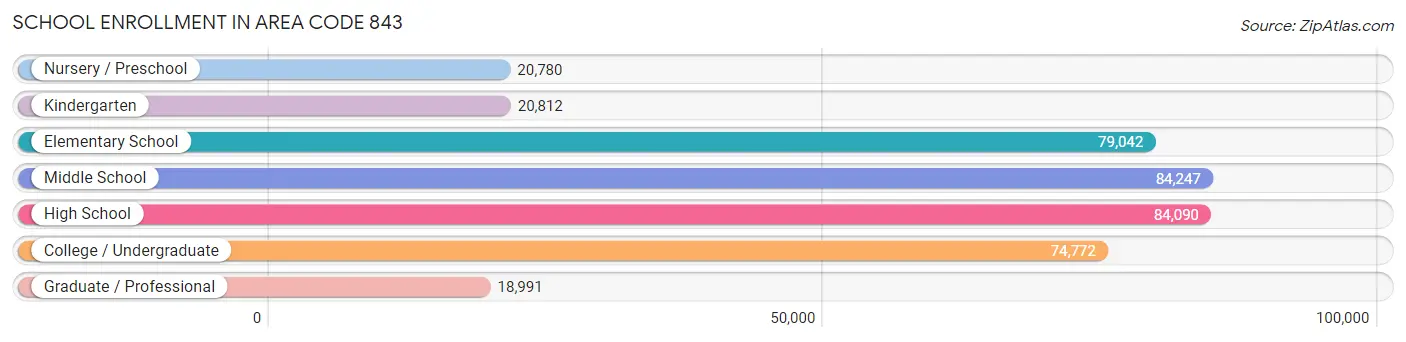
School Enrollment in Area Code 843
The most common levels of schooling among the 382,734 students in Area Code 843 are middle school (84,247 | 22.0%), high school (84,090 | 22.0%), and elementary school (79,042 | 20.6%).
| School Level | # Students | % Students |
| Nursery / Preschool | 20,780 | 5.4% |
| Kindergarten | 20,812 | 5.4% |
| Elementary School | 79,042 | 20.6% |
| Middle School | 84,247 | 22.0% |
| High School | 84,090 | 22.0% |
| College / Undergraduate | 74,772 | 19.5% |
| Graduate / Professional | 18,991 | 5.0% |
| Total | 382,734 | 100.0% |
School Enrollment by Age by Funding Source in Area Code 843
Out of a total of 382,734 students who are enrolled in schools in Area Code 843, 58,389 (15.3%) attend a private institution, while the remaining 324,345 (84.7%) are enrolled in public schools. The age group of 3 to 4 year olds has the highest likelihood of being enrolled in private schools, with 7,161 (40.2% in the age bracket) enrolled. Conversely, the age group of 15 to 17 year olds has the lowest likelihood of being enrolled in a private school, with 53,042 (88.6% in the age bracket) attending a public institution.
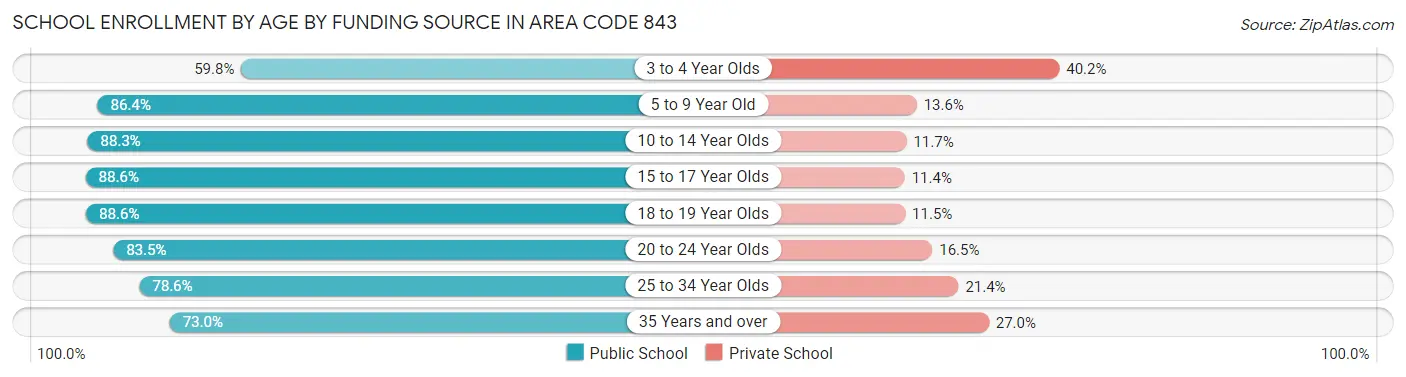
| Age Bracket | Public School | Private School |
| 3 to 4 Year Olds | 10,666 (59.8%) | 7,161 (40.2%) |
| 5 to 9 Year Old | 79,805 (86.4%) | 12,558 (13.6%) |
| 10 to 14 Year Olds | 91,846 (88.3%) | 12,174 (11.7%) |
| 15 to 17 Year Olds | 53,042 (88.6%) | 6,802 (11.4%) |
| 18 to 19 Year Olds | 27,308 (88.5%) | 3,531 (11.5%) |
| 20 to 24 Year Olds | 28,870 (83.5%) | 5,709 (16.5%) |
| 25 to 34 Year Olds | 17,187 (78.6%) | 4,674 (21.4%) |
| 35 Years and over | 15,616 (73.0%) | 5,785 (27.0%) |
| Total | 324,345 (84.7%) | 58,389 (15.3%) |
Educational Attainment by Field of Study in Area Code 843
Business (94,242 | 21.8%), education (58,665 | 13.6%), science & technology (44,107 | 10.2%), social sciences (33,168 | 7.7%), and bio, nature & agricultural (29,190 | 6.7%) are the most common fields of study among 433,100 individuals in Area Code 843 who have obtained a bachelor's degree or higher.
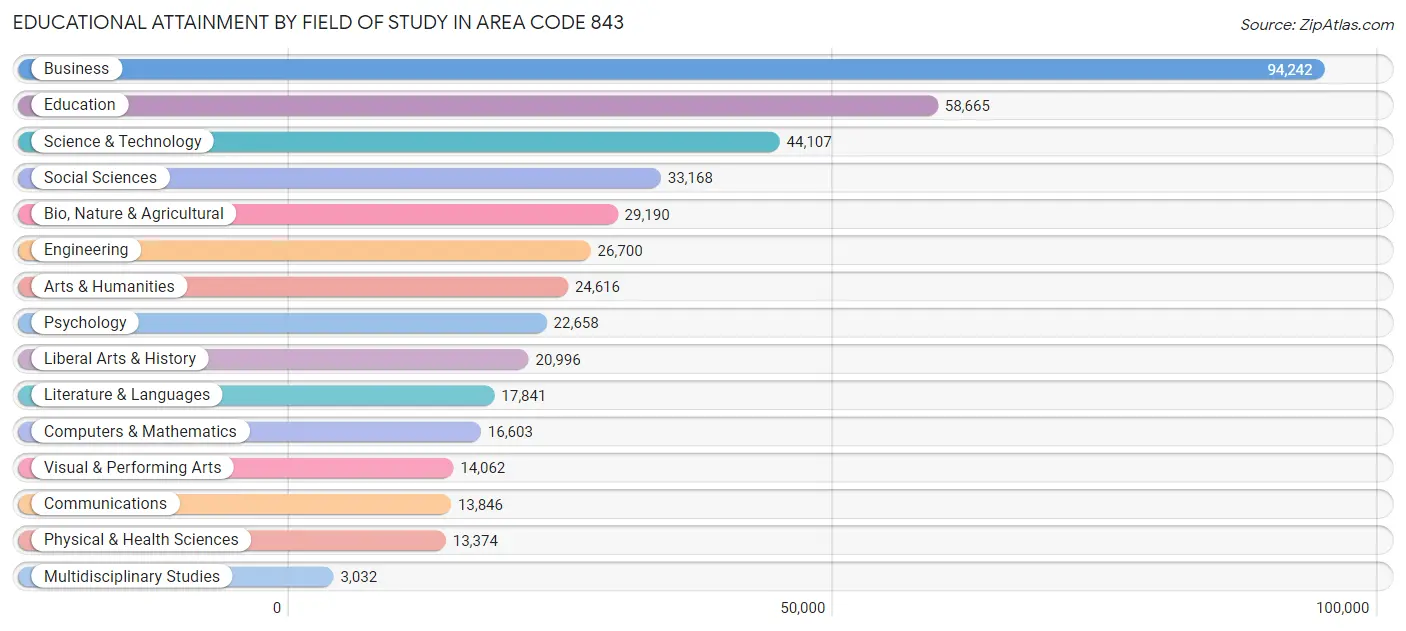
| Field of Study | # Graduates | % Graduates |
| Computers & Mathematics | 16,603 | 3.8% |
| Bio, Nature & Agricultural | 29,190 | 6.7% |
| Physical & Health Sciences | 13,374 | 3.1% |
| Psychology | 22,658 | 5.2% |
| Social Sciences | 33,168 | 7.7% |
| Engineering | 26,700 | 6.2% |
| Multidisciplinary Studies | 3,032 | 0.7% |
| Science & Technology | 44,107 | 10.2% |
| Business | 94,242 | 21.8% |
| Education | 58,665 | 13.6% |
| Literature & Languages | 17,841 | 4.1% |
| Liberal Arts & History | 20,996 | 4.9% |
| Visual & Performing Arts | 14,062 | 3.3% |
| Communications | 13,846 | 3.2% |
| Arts & Humanities | 24,616 | 5.7% |
| Total | 433,100 | 100.0% |
Transportation & Commute in Area Code 843
Vehicle Availability by Sex in Area Code 843
The most prevalent vehicle ownership categories in Area Code 843 are males with 2 vehicles (186,837, accounting for 44.5%) and females with 2 vehicles (162,327, making up 48.4%).
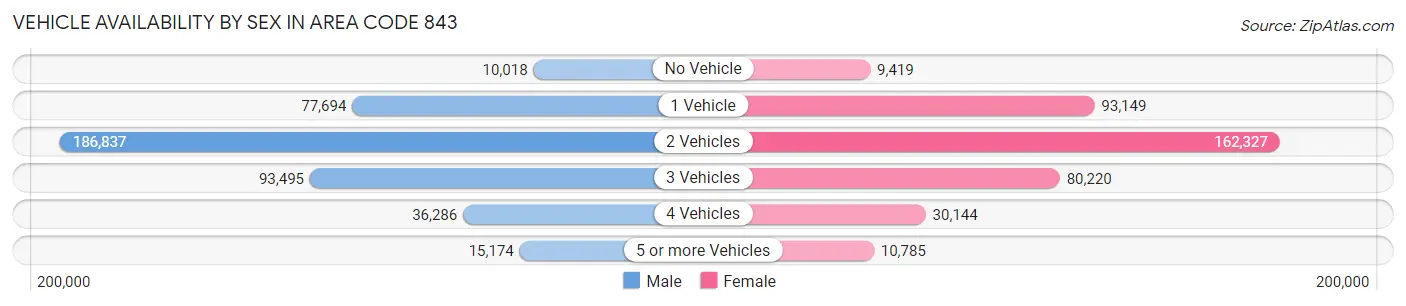
| Vehicles Available | Male | Female |
| No Vehicle | 10,018 (2.4%) | 9,419 (2.4%) |
| 1 Vehicle | 77,694 (18.5%) | 93,149 (24.1%) |
| 2 Vehicles | 186,837 (44.5%) | 162,327 (42.0%) |
| 3 Vehicles | 93,495 (22.3%) | 80,220 (20.8%) |
| 4 Vehicles | 36,286 (8.6%) | 30,144 (7.8%) |
| 5 or more Vehicles | 15,174 (3.6%) | 10,785 (2.8%) |
| Total | 419,504 (100.0%) | 386,044 (100.0%) |
Commute Time in Area Code 843
The most frequently occuring commute durations in Area Code 843 are 15 to 19 minutes (124,163 commuters, 16.8%), 20 to 24 minutes (115,158 commuters, 15.5%), and 30 to 34 minutes (114,463 commuters, 15.4%).
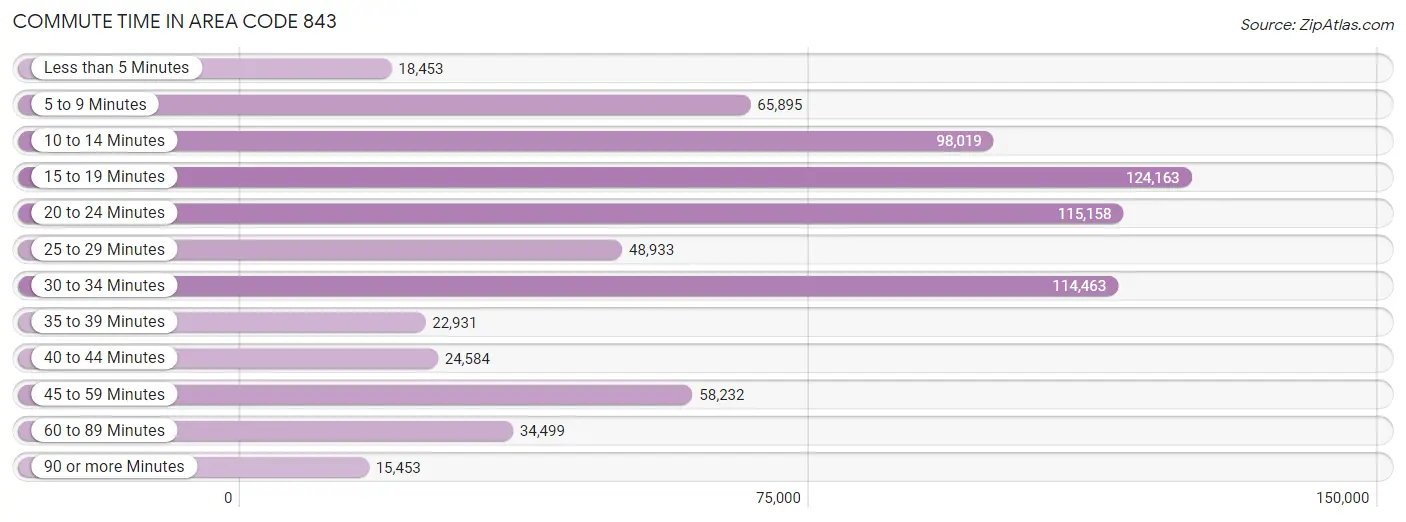
| Commute Time | # Commuters | % Commuters |
| Less than 5 Minutes | 18,453 | 2.5% |
| 5 to 9 Minutes | 65,895 | 8.9% |
| 10 to 14 Minutes | 98,019 | 13.2% |
| 15 to 19 Minutes | 124,163 | 16.8% |
| 20 to 24 Minutes | 115,158 | 15.5% |
| 25 to 29 Minutes | 48,933 | 6.6% |
| 30 to 34 Minutes | 114,463 | 15.4% |
| 35 to 39 Minutes | 22,931 | 3.1% |
| 40 to 44 Minutes | 24,584 | 3.3% |
| 45 to 59 Minutes | 58,232 | 7.9% |
| 60 to 89 Minutes | 34,499 | 4.7% |
| 90 or more Minutes | 15,453 | 2.1% |
Commute Time by Sex in Area Code 843
The most common commute times in Area Code 843 are 30 to 34 minutes (63,557 commuters, 16.3%) for males and 15 to 19 minutes (61,107 commuters, 17.4%) for females.
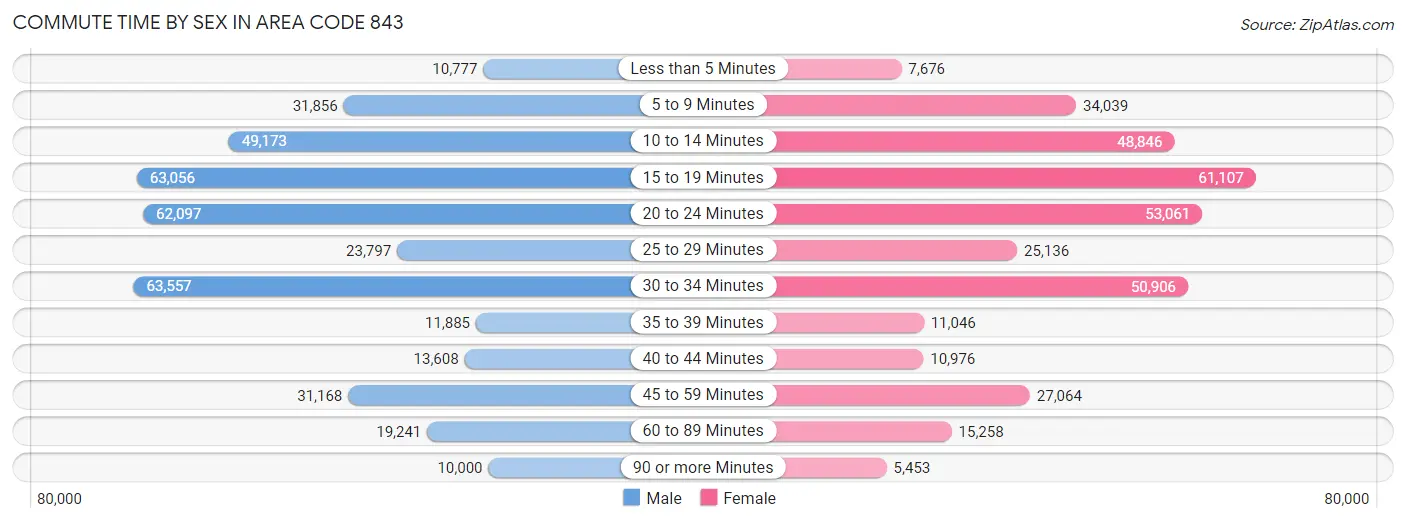
| Commute Time | Male | Female |
| Less than 5 Minutes | 10,777 (2.8%) | 7,676 (2.2%) |
| 5 to 9 Minutes | 31,856 (8.2%) | 34,039 (9.7%) |
| 10 to 14 Minutes | 49,173 (12.6%) | 48,846 (13.9%) |
| 15 to 19 Minutes | 63,056 (16.2%) | 61,107 (17.4%) |
| 20 to 24 Minutes | 62,097 (15.9%) | 53,061 (15.1%) |
| 25 to 29 Minutes | 23,797 (6.1%) | 25,136 (7.2%) |
| 30 to 34 Minutes | 63,557 (16.3%) | 50,906 (14.5%) |
| 35 to 39 Minutes | 11,885 (3.0%) | 11,046 (3.2%) |
| 40 to 44 Minutes | 13,608 (3.5%) | 10,976 (3.1%) |
| 45 to 59 Minutes | 31,168 (8.0%) | 27,064 (7.7%) |
| 60 to 89 Minutes | 19,241 (4.9%) | 15,258 (4.3%) |
| 90 or more Minutes | 10,000 (2.6%) | 5,453 (1.6%) |
Time of Departure to Work by Sex in Area Code 843
The most frequent times of departure to work in Area Code 843 are 7:00 AM to 7:29 AM (59,965, 15.4%) for males and 7:00 AM to 7:29 AM (54,362, 15.5%) for females.
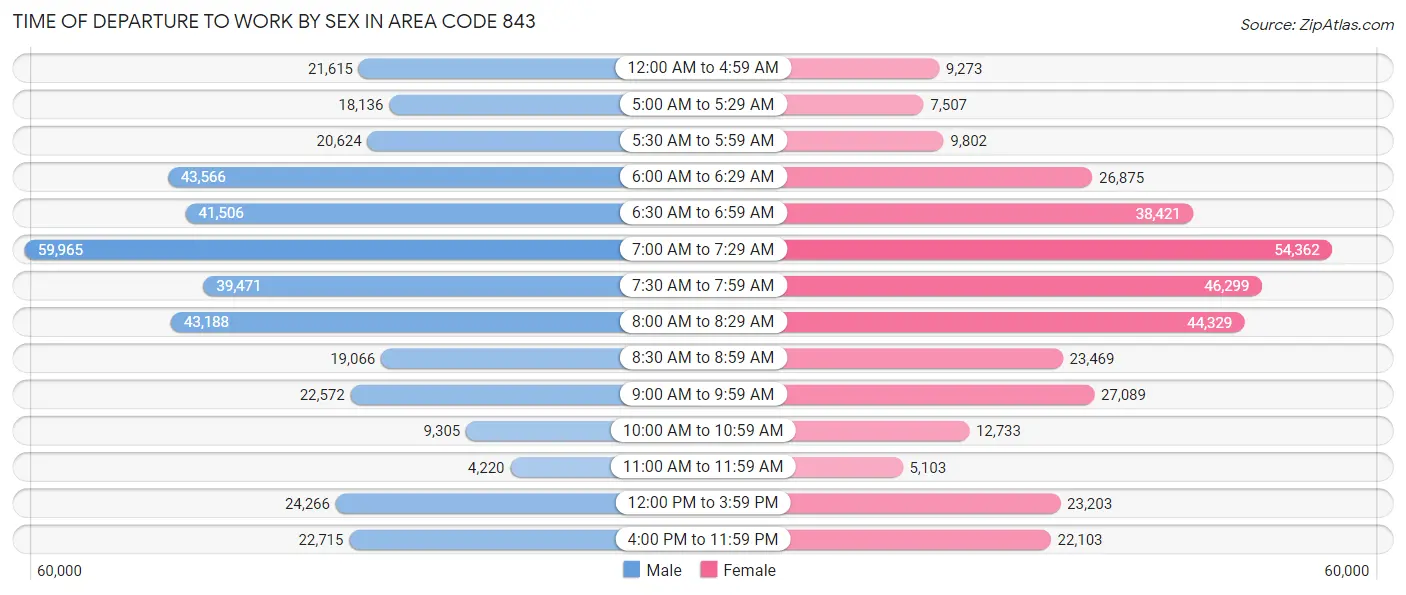
| Time of Departure | Male | Female |
| 12:00 AM to 4:59 AM | 21,615 (5.5%) | 9,273 (2.6%) |
| 5:00 AM to 5:29 AM | 18,136 (4.6%) | 7,507 (2.1%) |
| 5:30 AM to 5:59 AM | 20,624 (5.3%) | 9,802 (2.8%) |
| 6:00 AM to 6:29 AM | 43,566 (11.2%) | 26,875 (7.7%) |
| 6:30 AM to 6:59 AM | 41,506 (10.6%) | 38,421 (11.0%) |
| 7:00 AM to 7:29 AM | 59,965 (15.4%) | 54,362 (15.5%) |
| 7:30 AM to 7:59 AM | 39,471 (10.1%) | 46,299 (13.2%) |
| 8:00 AM to 8:29 AM | 43,188 (11.1%) | 44,329 (12.6%) |
| 8:30 AM to 8:59 AM | 19,066 (4.9%) | 23,469 (6.7%) |
| 9:00 AM to 9:59 AM | 22,572 (5.8%) | 27,089 (7.7%) |
| 10:00 AM to 10:59 AM | 9,305 (2.4%) | 12,733 (3.6%) |
| 11:00 AM to 11:59 AM | 4,220 (1.1%) | 5,103 (1.5%) |
| 12:00 PM to 3:59 PM | 24,266 (6.2%) | 23,203 (6.6%) |
| 4:00 PM to 11:59 PM | 22,715 (5.8%) | 22,103 (6.3%) |
| Total | 390,215 (100.0%) | 350,568 (100.0%) |
Housing Occupancy in Area Code 843
Occupancy by Ownership in Area Code 843
Of the total 712,567 dwellings in Area Code 843, owner-occupied units account for 502,270 (70.5%), while renter-occupied units make up 210,297 (29.5%).
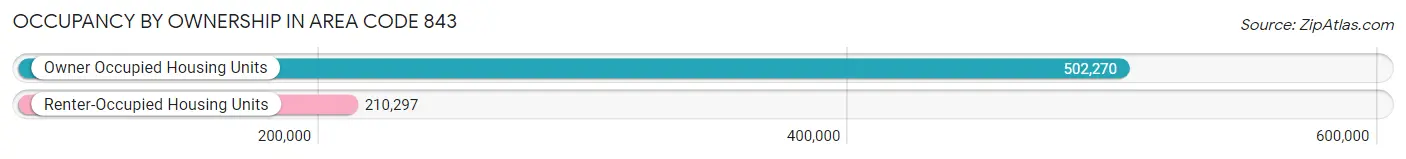
| Occupancy | # Housing Units | % Housing Units |
| Owner Occupied Housing Units | 502,270 | 70.5% |
| Renter-Occupied Housing Units | 210,297 | 29.5% |
| Total Occupied Housing Units | 712,567 | 100.0% |
Occupancy by Household Size in Area Code 843
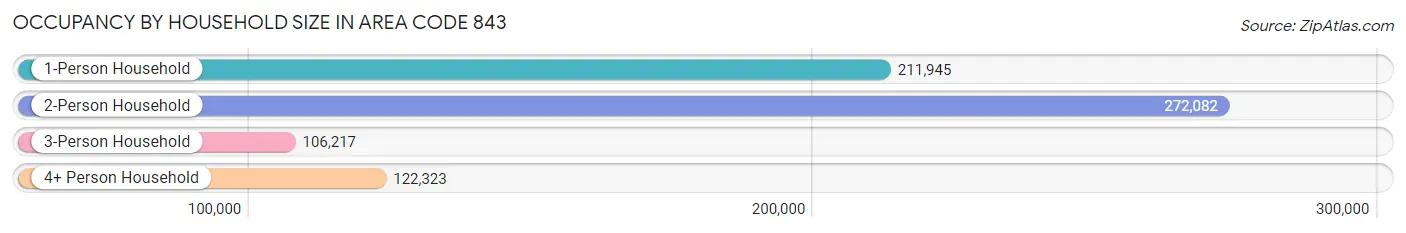
| Household Size | # Housing Units | % Housing Units |
| 1-Person Household | 211,945 | 29.7% |
| 2-Person Household | 272,082 | 38.2% |
| 3-Person Household | 106,217 | 14.9% |
| 4+ Person Household | 122,323 | 17.2% |
| Total Housing Units | 712,567 | 100.0% |
Occupancy by Ownership by Household Size in Area Code 843
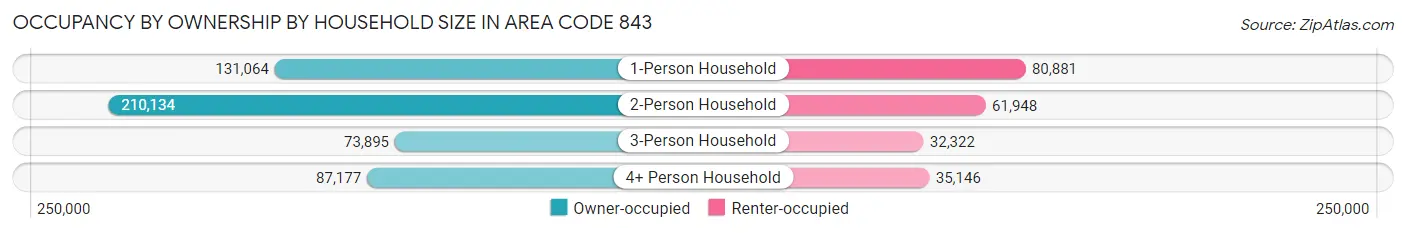
| Household Size | Owner-occupied | Renter-occupied |
| 1-Person Household | 131,064 (61.8%) | 80,881 (38.2%) |
| 2-Person Household | 210,134 (77.2%) | 61,948 (22.8%) |
| 3-Person Household | 73,895 (69.6%) | 32,322 (30.4%) |
| 4+ Person Household | 87,177 (71.3%) | 35,146 (28.7%) |
| Total Housing Units | 502,270 (70.5%) | 210,297 (29.5%) |
Occupancy by Educational Attainment in Area Code 843
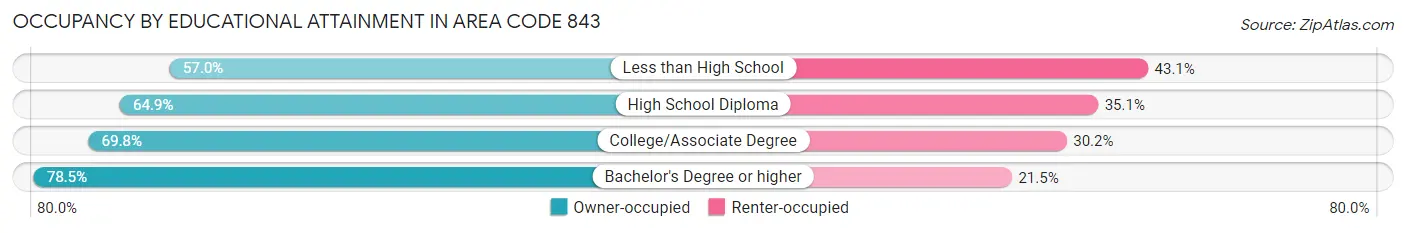
| Household Size | Owner-occupied | Renter-occupied |
| Less than High School | 33,725 (57.0%) | 25,497 (43.0%) |
| High School Diploma | 118,779 (64.9%) | 64,356 (35.1%) |
| College/Associate Degree | 156,943 (69.8%) | 67,763 (30.2%) |
| Bachelor's Degree or higher | 192,823 (78.5%) | 52,681 (21.5%) |
Occupancy by Age of Householder in Area Code 843
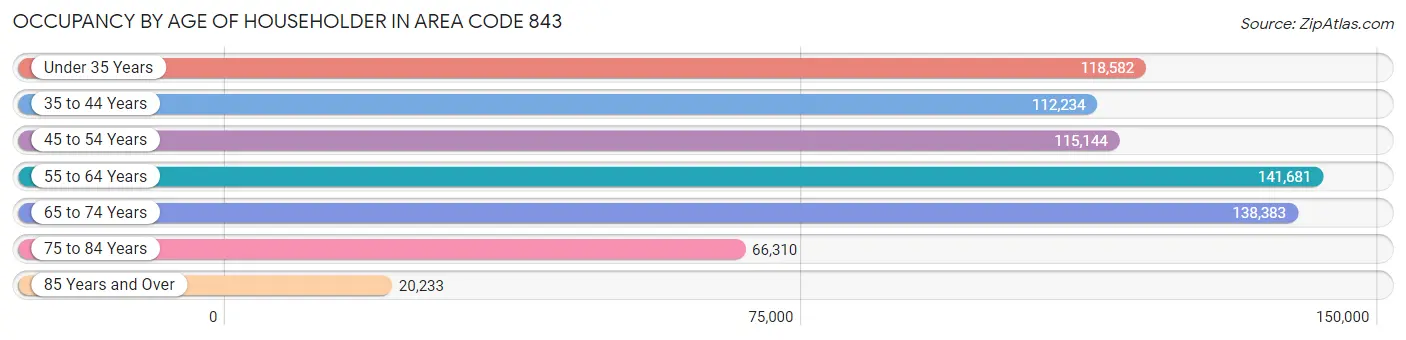
| Age Bracket | # Households | % Households |
| Under 35 Years | 118,582 | 16.6% |
| 35 to 44 Years | 112,234 | 15.8% |
| 45 to 54 Years | 115,144 | 16.2% |
| 55 to 64 Years | 141,681 | 19.9% |
| 65 to 74 Years | 138,383 | 19.4% |
| 75 to 84 Years | 66,310 | 9.3% |
| 85 Years and Over | 20,233 | 2.8% |
| Total | 712,567 | 100.0% |
Housing Finances in Area Code 843
Median Income by Occupancy in Area Code 843
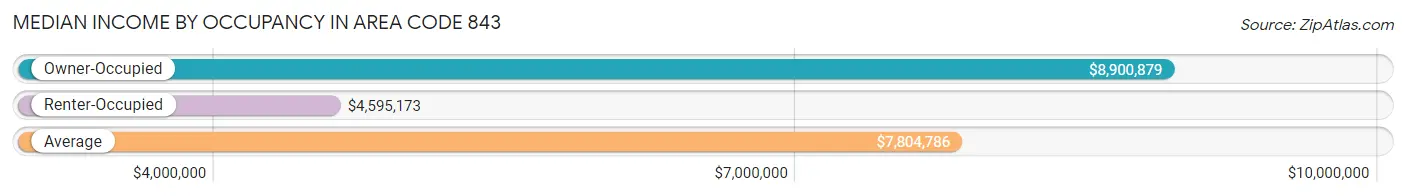
| Occupancy Type | # Households | Median Income |
| Owner-Occupied | 502,270 (70.5%) | $8,900,879 |
| Renter-Occupied | 210,297 (29.5%) | $4,595,173 |
| Average | 712,567 (100.0%) | $7,804,786 |
Occupancy by Householder Income Bracket in Area Code 843
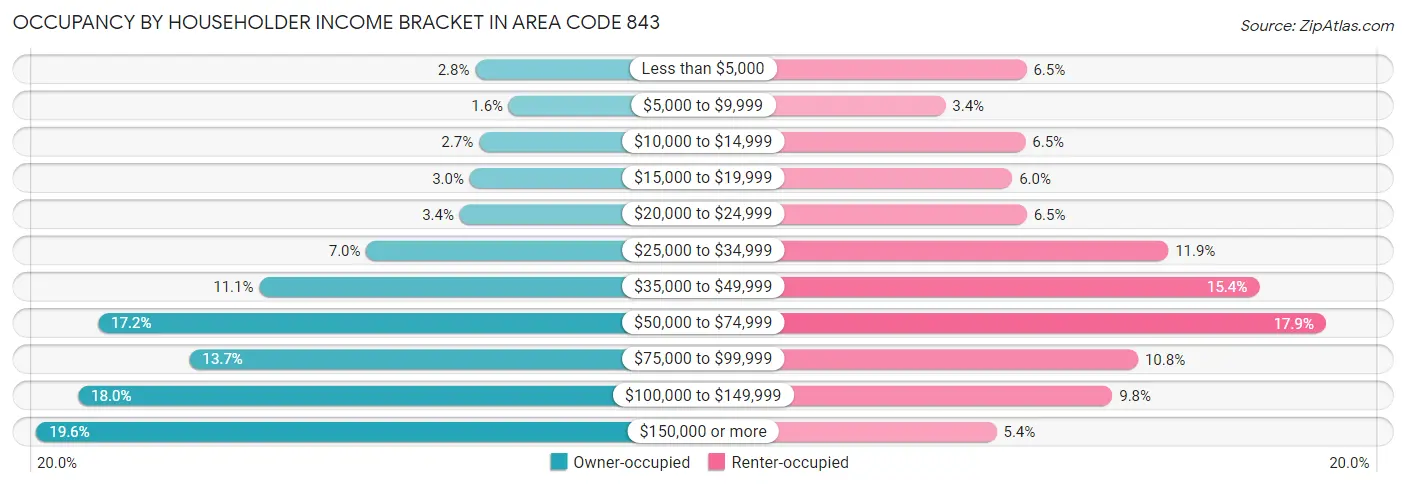
| Income Bracket | Owner-occupied | Renter-occupied |
| Less than $5,000 | 14,226 (2.8%) | 13,687 (6.5%) |
| $5,000 to $9,999 | 7,781 (1.5%) | 7,196 (3.4%) |
| $10,000 to $14,999 | 13,498 (2.7%) | 13,610 (6.5%) |
| $15,000 to $19,999 | 15,275 (3.0%) | 12,559 (6.0%) |
| $20,000 to $24,999 | 17,202 (3.4%) | 13,711 (6.5%) |
| $25,000 to $34,999 | 35,065 (7.0%) | 25,047 (11.9%) |
| $35,000 to $49,999 | 55,552 (11.1%) | 32,324 (15.4%) |
| $50,000 to $74,999 | 86,387 (17.2%) | 37,659 (17.9%) |
| $75,000 to $99,999 | 68,896 (13.7%) | 22,637 (10.8%) |
| $100,000 to $149,999 | 90,214 (18.0%) | 20,567 (9.8%) |
| $150,000 or more | 98,174 (19.6%) | 11,300 (5.4%) |
| Total | 502,270 (100.0%) | 210,297 (100.0%) |
Monthly Housing Cost Tiers in Area Code 843
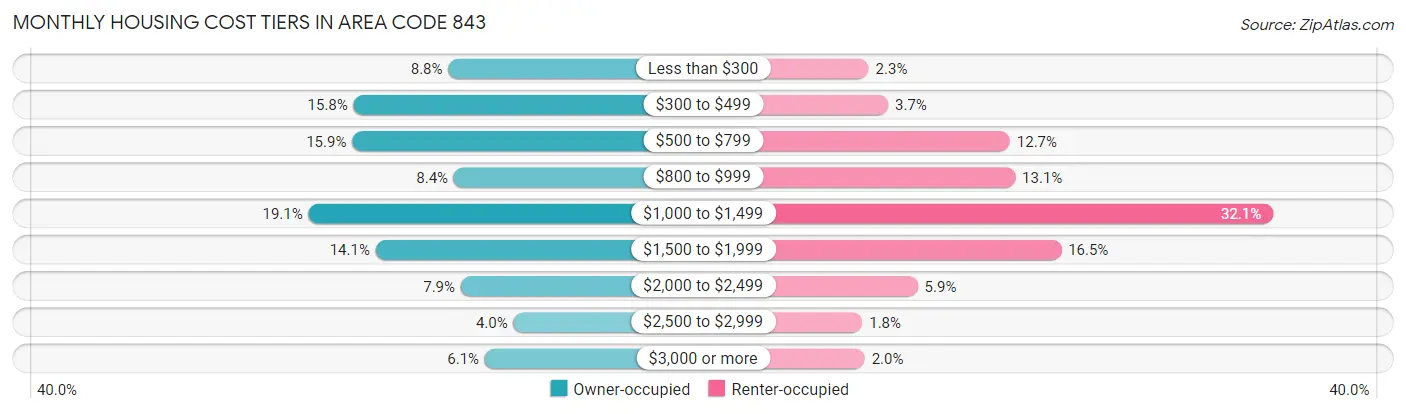
| Monthly Cost | Owner-occupied | Renter-occupied |
| Less than $300 | 44,127 (8.8%) | 4,841 (2.3%) |
| $300 to $499 | 79,194 (15.8%) | 7,845 (3.7%) |
| $500 to $799 | 79,729 (15.9%) | 26,699 (12.7%) |
| $800 to $999 | 42,103 (8.4%) | 27,534 (13.1%) |
| $1,000 to $1,499 | 95,888 (19.1%) | 67,463 (32.1%) |
| $1,500 to $1,999 | 71,011 (14.1%) | 34,659 (16.5%) |
| $2,000 to $2,499 | 39,522 (7.9%) | 12,434 (5.9%) |
| $2,500 to $2,999 | 20,044 (4.0%) | 3,854 (1.8%) |
| $3,000 or more | 30,652 (6.1%) | 4,219 (2.0%) |
| Total | 502,270 (100.0%) | 210,297 (100.0%) |
Physical Housing Characteristics in Area Code 843
Housing Structures in Area Code 843
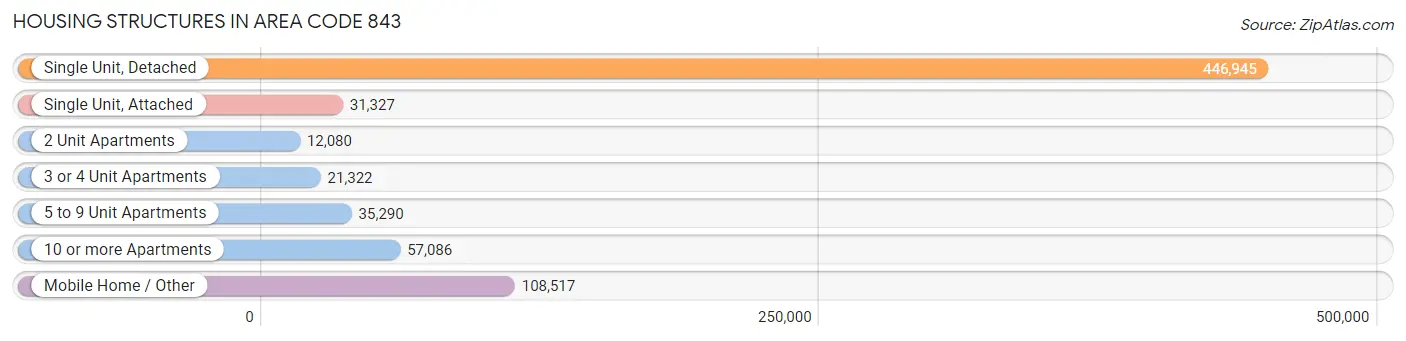
| Structure Type | # Housing Units | % Housing Units |
| Single Unit, Detached | 446,945 | 62.7% |
| Single Unit, Attached | 31,327 | 4.4% |
| 2 Unit Apartments | 12,080 | 1.7% |
| 3 or 4 Unit Apartments | 21,322 | 3.0% |
| 5 to 9 Unit Apartments | 35,290 | 5.0% |
| 10 or more Apartments | 57,086 | 8.0% |
| Mobile Home / Other | 108,517 | 15.2% |
| Total | 712,567 | 100.0% |
Housing Structures by Occupancy in Area Code 843
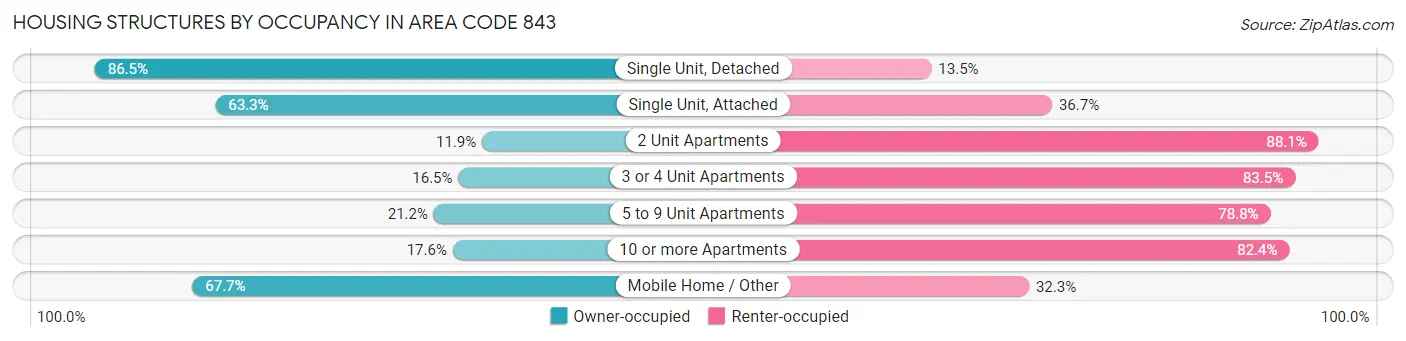
| Structure Type | Owner-occupied | Renter-occupied |
| Single Unit, Detached | 386,524 (86.5%) | 60,421 (13.5%) |
| Single Unit, Attached | 19,819 (63.3%) | 11,508 (36.7%) |
| 2 Unit Apartments | 1,440 (11.9%) | 10,640 (88.1%) |
| 3 or 4 Unit Apartments | 3,513 (16.5%) | 17,809 (83.5%) |
| 5 to 9 Unit Apartments | 7,485 (21.2%) | 27,805 (78.8%) |
| 10 or more Apartments | 10,032 (17.6%) | 47,054 (82.4%) |
| Mobile Home / Other | 73,457 (67.7%) | 35,060 (32.3%) |
| Total | 502,270 (70.5%) | 210,297 (29.5%) |
Housing Structures by Number of Rooms in Area Code 843
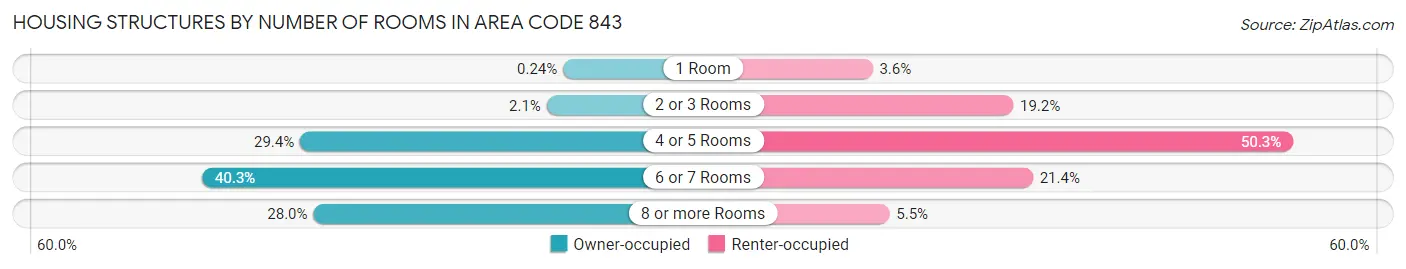
| Number of Rooms | Owner-occupied | Renter-occupied |
| 1 Room | 1,219 (0.2%) | 7,596 (3.6%) |
| 2 or 3 Rooms | 10,352 (2.1%) | 40,400 (19.2%) |
| 4 or 5 Rooms | 147,805 (29.4%) | 105,758 (50.3%) |
| 6 or 7 Rooms | 202,522 (40.3%) | 45,003 (21.4%) |
| 8 or more Rooms | 140,372 (28.0%) | 11,540 (5.5%) |
| Total | 502,270 (100.0%) | 210,297 (100.0%) |
Housing Structure by Heating Type in Area Code 843
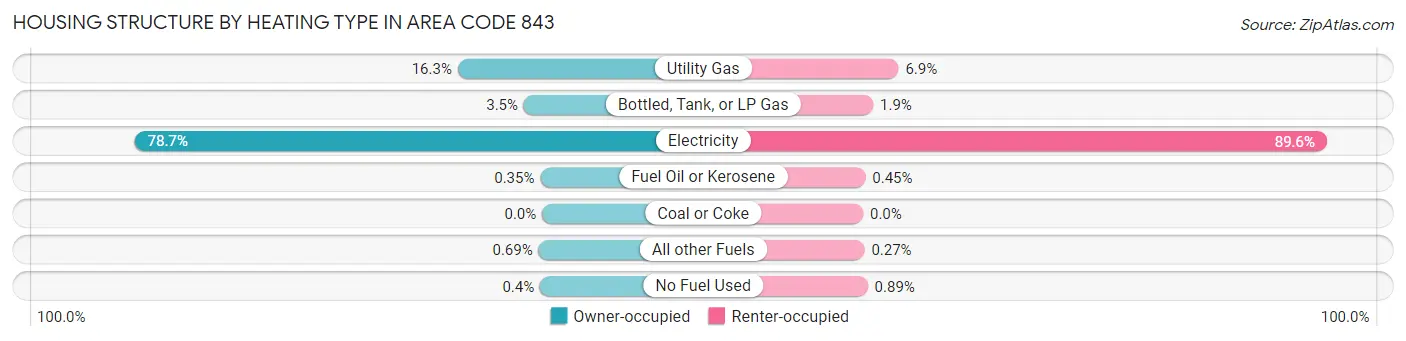
| Heating Type | Owner-occupied | Renter-occupied |
| Utility Gas | 81,870 (16.3%) | 14,410 (6.9%) |
| Bottled, Tank, or LP Gas | 17,655 (3.5%) | 4,073 (1.9%) |
| Electricity | 395,485 (78.7%) | 188,416 (89.6%) |
| Fuel Oil or Kerosene | 1,767 (0.4%) | 951 (0.4%) |
| Coal or Coke | 0 (0.0%) | 0 (0.0%) |
| All other Fuels | 3,487 (0.7%) | 573 (0.3%) |
| No Fuel Used | 2,006 (0.4%) | 1,874 (0.9%) |
| Total | 502,270 (100.0%) | 210,297 (100.0%) |
Household Vehicle Usage in Area Code 843
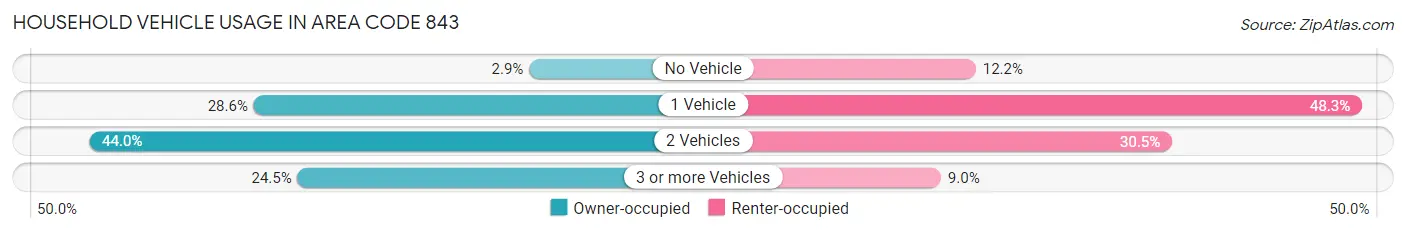
| Vehicles per Household | Owner-occupied | Renter-occupied |
| No Vehicle | 14,546 (2.9%) | 25,708 (12.2%) |
| 1 Vehicle | 143,694 (28.6%) | 101,505 (48.3%) |
| 2 Vehicles | 220,883 (44.0%) | 64,232 (30.5%) |
| 3 or more Vehicles | 123,147 (24.5%) | 18,852 (9.0%) |
| Total | 502,270 (100.0%) | 210,297 (100.0%) |
Real Estate & Mortgages in Area Code 843
Real Estate and Mortgage Overview in Area Code 843
| Characteristic | Without Mortgage | With Mortgage |
| Housing Units | 214,689 | 287,581 |
| Median Property Value | $29,179,401 | $32,963,501 |
| Median Household Income | $6,920,886 | $71,817 |
| Monthly Housing Costs | $64,460 | $29,650 |
| Real Estate Taxes | $134,237 | $7,393 |
Property Value by Mortgage Status in Area Code 843
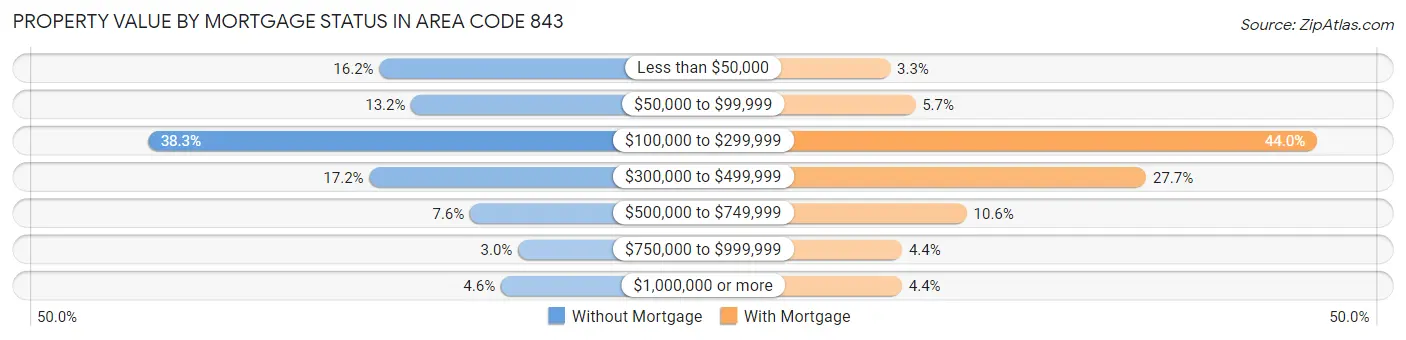
| Property Value | Without Mortgage | With Mortgage |
| Less than $50,000 | 34,801 (16.2%) | 9,464 (3.3%) |
| $50,000 to $99,999 | 28,277 (13.2%) | 16,338 (5.7%) |
| $100,000 to $299,999 | 82,158 (38.3%) | 126,423 (44.0%) |
| $300,000 to $499,999 | 36,839 (17.2%) | 79,571 (27.7%) |
| $500,000 to $749,999 | 16,249 (7.6%) | 30,419 (10.6%) |
| $750,000 to $999,999 | 6,417 (3.0%) | 12,698 (4.4%) |
| $1,000,000 or more | 9,948 (4.6%) | 12,668 (4.4%) |
| Total | 214,689 (100.0%) | 287,581 (100.0%) |
Household Income by Mortgage Status in Area Code 843
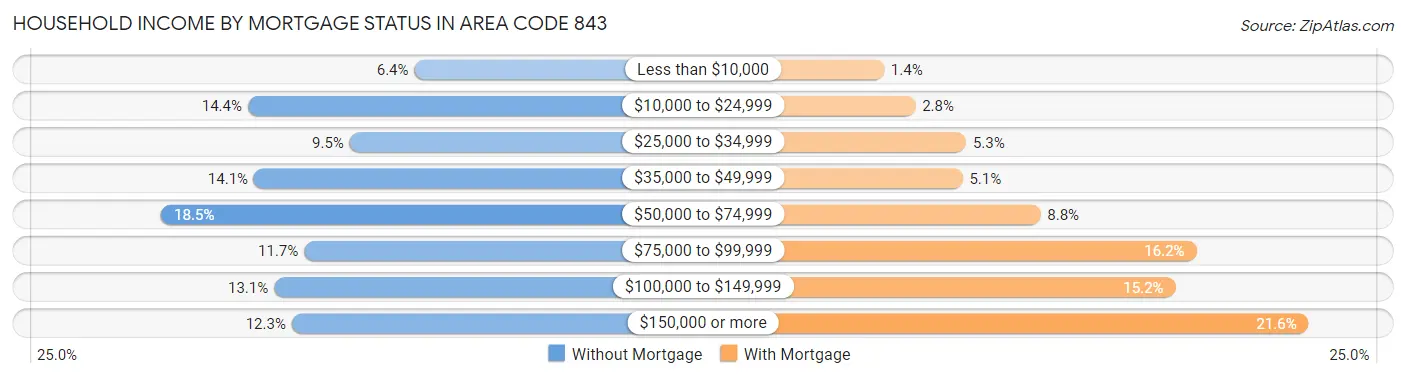
| Household Income | Without Mortgage | With Mortgage |
| Less than $10,000 | 13,836 (6.4%) | 3,885 (1.3%) |
| $10,000 to $24,999 | 30,843 (14.4%) | 8,171 (2.8%) |
| $25,000 to $34,999 | 20,434 (9.5%) | 15,132 (5.3%) |
| $35,000 to $49,999 | 30,238 (14.1%) | 14,631 (5.1%) |
| $50,000 to $74,999 | 39,709 (18.5%) | 25,314 (8.8%) |
| $75,000 to $99,999 | 25,100 (11.7%) | 46,678 (16.2%) |
| $100,000 to $149,999 | 28,172 (13.1%) | 43,796 (15.2%) |
| $150,000 or more | 26,357 (12.3%) | 62,042 (21.6%) |
| Total | 214,689 (100.0%) | 287,581 (100.0%) |
Property Value to Household Income Ratio in Area Code 843
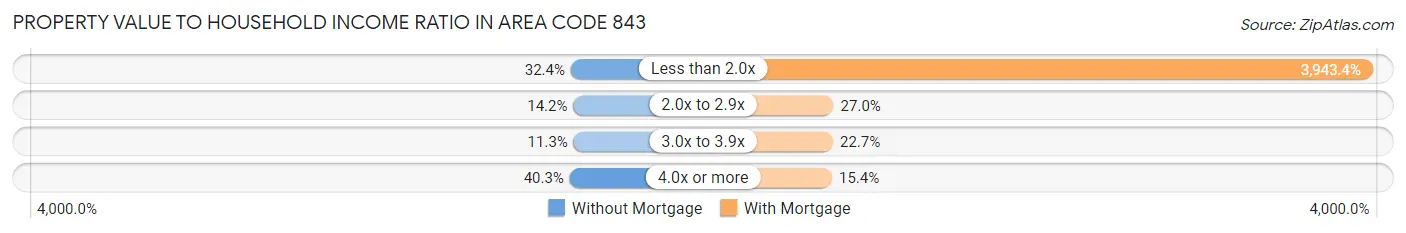
| Value-to-Income Ratio | Without Mortgage | With Mortgage |
| Less than 2.0x | 69,451 (32.4%) | 11,340,441 (3,943.4%) |
| 2.0x to 2.9x | 30,497 (14.2%) | 77,605 (27.0%) |
| 3.0x to 3.9x | 24,213 (11.3%) | 65,257 (22.7%) |
| 4.0x or more | 86,465 (40.3%) | 44,228 (15.4%) |
| Total | 214,689 (100.0%) | 287,581 (100.0%) |
Real Estate Taxes by Mortgage Status in Area Code 843
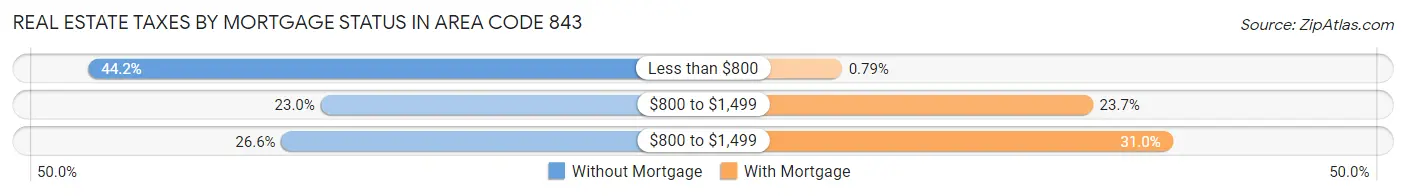
| Property Taxes | Without Mortgage | With Mortgage |
| Less than $800 | 94,825 (44.2%) | 2,278 (0.8%) |
| $800 to $1,499 | 49,322 (23.0%) | 68,194 (23.7%) |
| $800 to $1,499 | 57,009 (26.6%) | 89,185 (31.0%) |
| Total | 214,689 (100.0%) | 287,581 (100.0%) |
Health & Disability in Area Code 843
Health Insurance Coverage by Age in Area Code 843
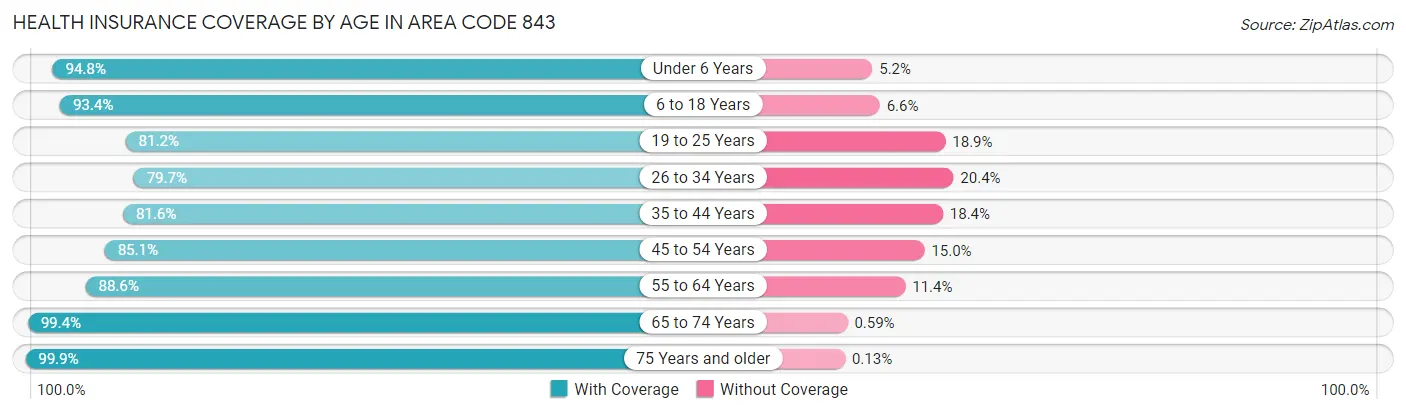
| Age Bracket | With Coverage | Without Coverage |
| Under 6 Years | 108,300 (94.8%) | 5,963 (5.2%) |
| 6 to 18 Years | 254,648 (93.4%) | 18,008 (6.6%) |
| 19 to 25 Years | 115,321 (81.1%) | 26,779 (18.9%) |
| 26 to 34 Years | 159,860 (79.6%) | 40,847 (20.3%) |
| 35 to 44 Years | 174,114 (81.6%) | 39,206 (18.4%) |
| 45 to 54 Years | 180,168 (85.1%) | 31,674 (14.9%) |
| 55 to 64 Years | 219,376 (88.6%) | 28,137 (11.4%) |
| 65 to 74 Years | 224,073 (99.4%) | 1,336 (0.6%) |
| 75 Years and older | 132,714 (99.9%) | 171 (0.1%) |
| Total | 1,568,574 (89.1%) | 192,121 (10.9%) |
Health Insurance Coverage by Citizenship Status in Area Code 843
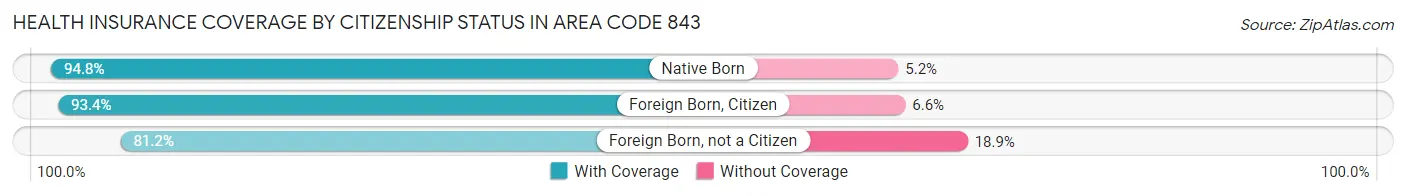
| Citizenship Status | With Coverage | Without Coverage |
| Native Born | 108,300 (94.8%) | 5,963 (5.2%) |
| Foreign Born, Citizen | 254,648 (93.4%) | 18,008 (6.6%) |
| Foreign Born, not a Citizen | 115,321 (81.1%) | 26,779 (18.9%) |
Health Insurance Coverage by Household Income in Area Code 843
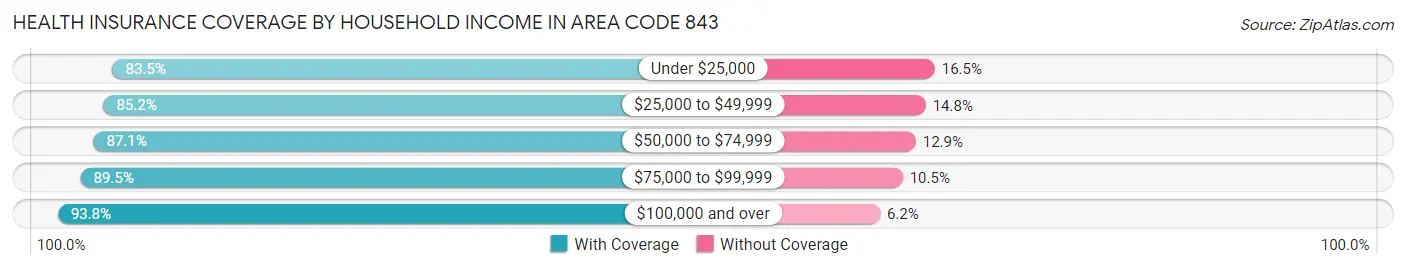
| Household Income | With Coverage | Without Coverage |
| Under $25,000 | 196,880 (83.5%) | 38,884 (16.5%) |
| $25,000 to $49,999 | 272,737 (85.2%) | 47,348 (14.8%) |
| $50,000 to $74,999 | 259,803 (87.1%) | 38,597 (12.9%) |
| $75,000 to $99,999 | 219,003 (89.5%) | 25,643 (10.5%) |
| $100,000 and over | 605,345 (93.8%) | 40,106 (6.2%) |
Public vs Private Health Insurance Coverage by Age in Area Code 843
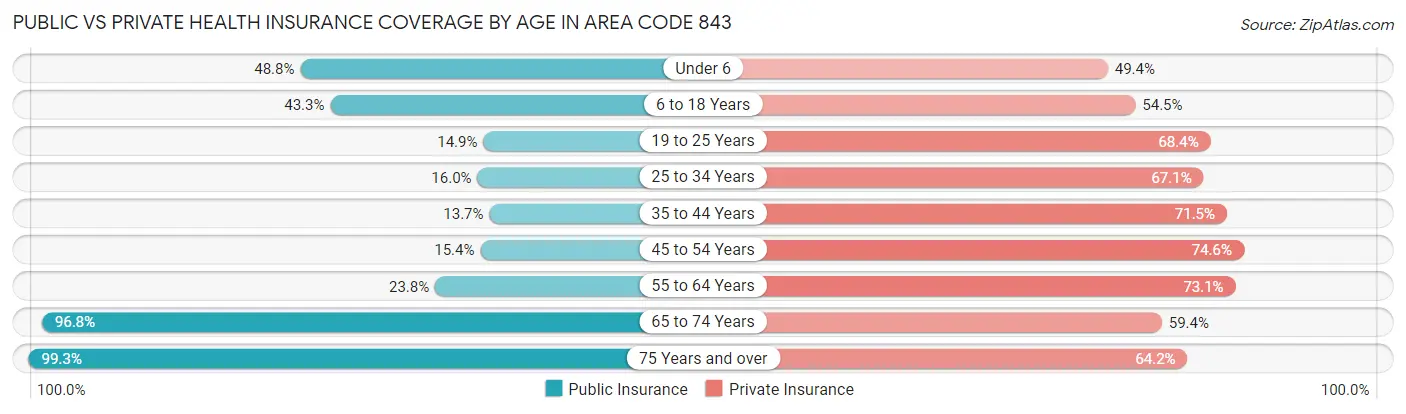
| Age Bracket | Public Insurance | Private Insurance |
| Under 6 | 55,789 (48.8%) | 56,417 (49.4%) |
| 6 to 18 Years | 117,922 (43.2%) | 148,559 (54.5%) |
| 19 to 25 Years | 21,118 (14.9%) | 97,233 (68.4%) |
| 25 to 34 Years | 32,003 (16.0%) | 134,729 (67.1%) |
| 35 to 44 Years | 29,291 (13.7%) | 152,455 (71.5%) |
| 45 to 54 Years | 32,653 (15.4%) | 158,059 (74.6%) |
| 55 to 64 Years | 58,930 (23.8%) | 180,833 (73.1%) |
| 65 to 74 Years | 218,166 (96.8%) | 133,879 (59.4%) |
| 75 Years and over | 131,904 (99.3%) | 85,252 (64.1%) |
| Total | 697,776 (39.6%) | 1,147,416 (65.2%) |
Disability Status by Sex by Age in Area Code 843
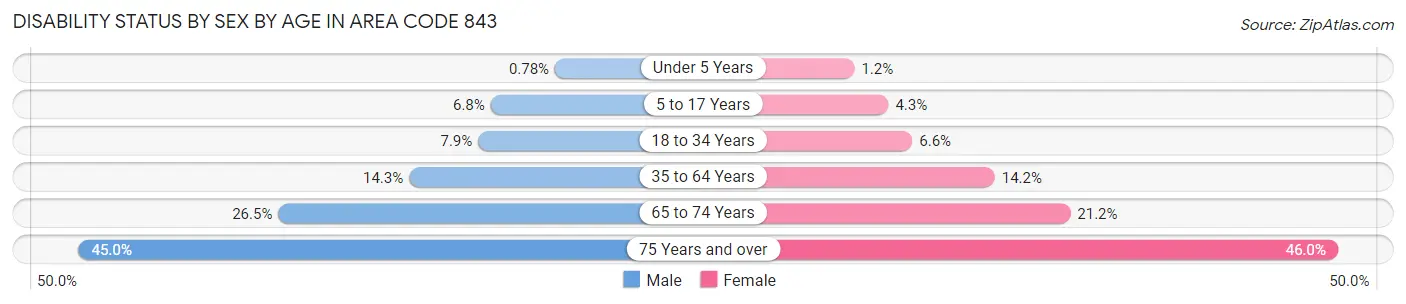
| Age Bracket | Male | Female |
| Under 5 Years | 378 (0.8%) | 549 (1.2%) |
| 5 to 17 Years | 9,246 (6.8%) | 5,691 (4.3%) |
| 18 to 34 Years | 14,192 (7.9%) | 12,227 (6.6%) |
| 35 to 64 Years | 45,915 (14.3%) | 49,988 (14.2%) |
| 65 to 74 Years | 27,639 (26.5%) | 25,652 (21.2%) |
| 75 Years and over | 26,057 (45.0%) | 34,510 (46.0%) |
Disability Class by Sex by Age in Area Code 843
Disability Class: Hearing Difficulty
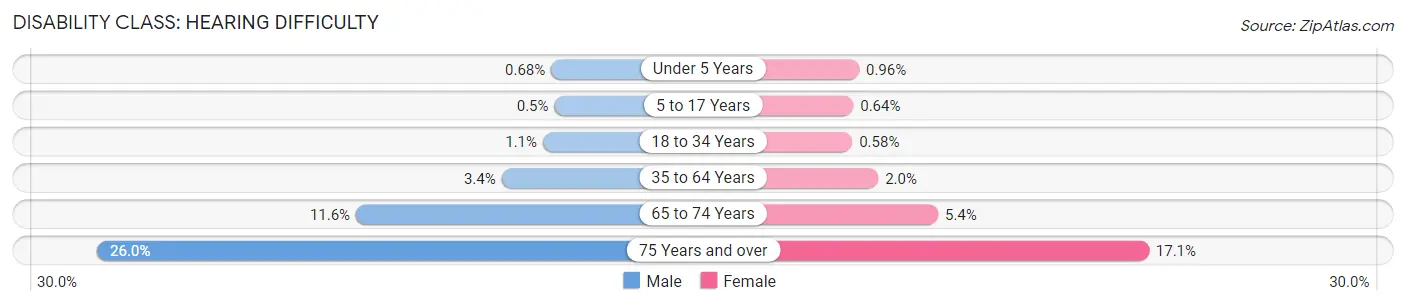
| Age Bracket | Male | Female |
| Under 5 Years | 331 (0.7%) | 448 (1.0%) |
| 5 to 17 Years | 678 (0.5%) | 846 (0.6%) |
| 18 to 34 Years | 2,037 (1.1%) | 1,080 (0.6%) |
| 35 to 64 Years | 11,043 (3.4%) | 7,159 (2.0%) |
| 65 to 74 Years | 12,069 (11.6%) | 6,482 (5.4%) |
| 75 Years and over | 15,035 (26.0%) | 12,821 (17.1%) |
Disability Class: Vision Difficulty
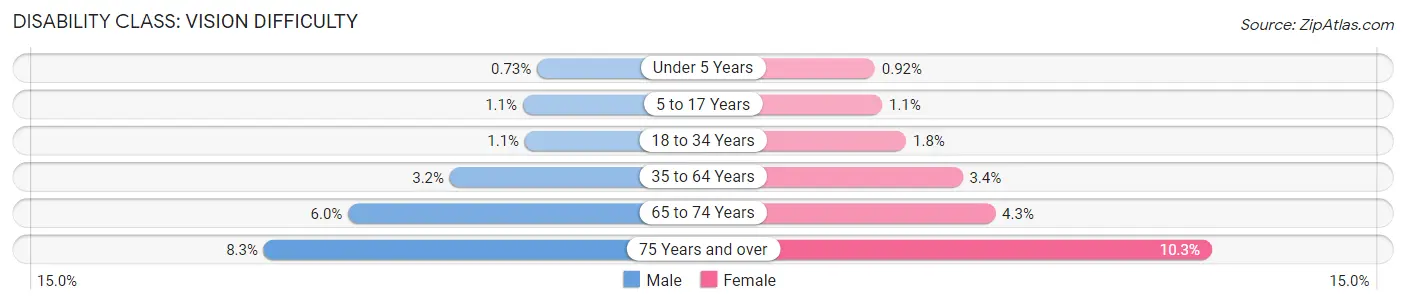
| Age Bracket | Male | Female |
| Under 5 Years | 358 (0.7%) | 427 (0.9%) |
| 5 to 17 Years | 1,549 (1.1%) | 1,473 (1.1%) |
| 18 to 34 Years | 1,922 (1.1%) | 3,343 (1.8%) |
| 35 to 64 Years | 10,134 (3.2%) | 11,841 (3.4%) |
| 65 to 74 Years | 6,261 (6.0%) | 5,159 (4.3%) |
| 75 Years and over | 4,833 (8.3%) | 7,722 (10.3%) |
Disability Class: Cognitive Difficulty
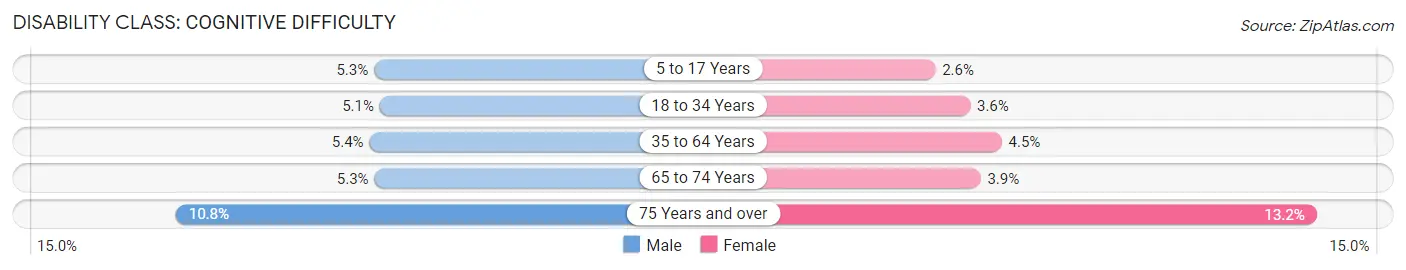
| Age Bracket | Male | Female |
| 5 to 17 Years | 7,218 (5.3%) | 3,420 (2.6%) |
| 18 to 34 Years | 9,163 (5.1%) | 6,673 (3.6%) |
| 35 to 64 Years | 17,319 (5.4%) | 15,659 (4.4%) |
| 65 to 74 Years | 5,497 (5.3%) | 4,671 (3.9%) |
| 75 Years and over | 6,249 (10.8%) | 9,911 (13.2%) |
Disability Class: Ambulatory Difficulty
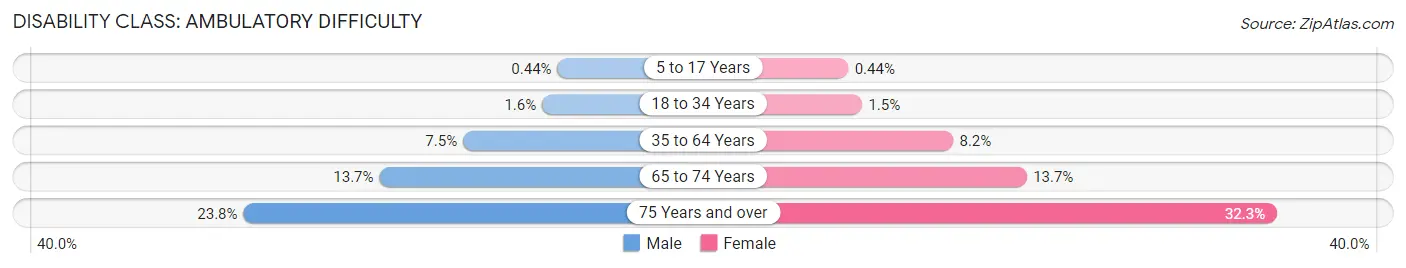
| Age Bracket | Male | Female |
| 5 to 17 Years | 604 (0.4%) | 578 (0.4%) |
| 18 to 34 Years | 2,841 (1.6%) | 2,722 (1.5%) |
| 35 to 64 Years | 23,896 (7.4%) | 28,954 (8.2%) |
| 65 to 74 Years | 14,265 (13.7%) | 16,560 (13.7%) |
| 75 Years and over | 13,762 (23.8%) | 24,221 (32.3%) |
Disability Class: Self-Care Difficulty
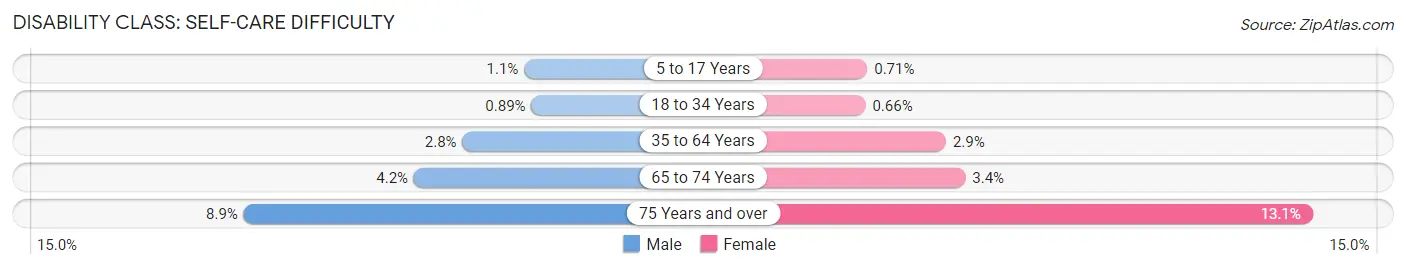
| Age Bracket | Male | Female |
| 5 to 17 Years | 1,496 (1.1%) | 936 (0.7%) |
| 18 to 34 Years | 1,591 (0.9%) | 1,236 (0.7%) |
| 35 to 64 Years | 9,021 (2.8%) | 10,219 (2.9%) |
| 65 to 74 Years | 4,343 (4.2%) | 4,164 (3.4%) |
| 75 Years and over | 5,156 (8.9%) | 9,825 (13.1%) |
Technology Access in Area Code 843
Computing Device Access in Area Code 843
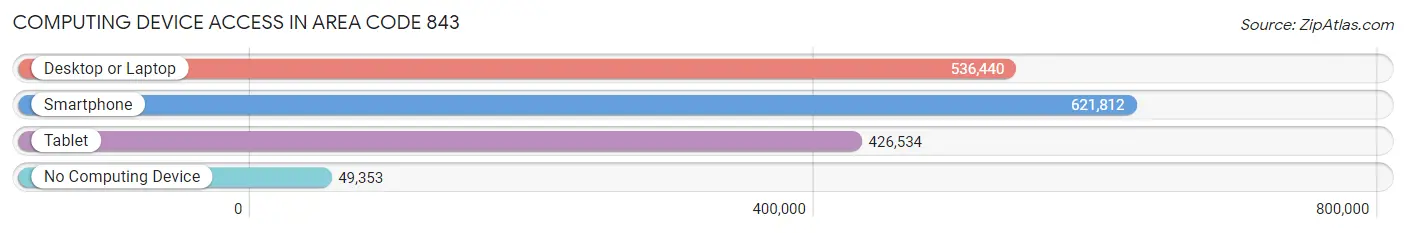
| Device Type | # Households | % Households |
| Desktop or Laptop | 536,440 | 75.3% |
| Smartphone | 621,812 | 87.3% |
| Tablet | 426,534 | 59.9% |
| No Computing Device | 49,353 | 6.9% |
| Total | 712,567 | 100.0% |
Internet Access in Area Code 843
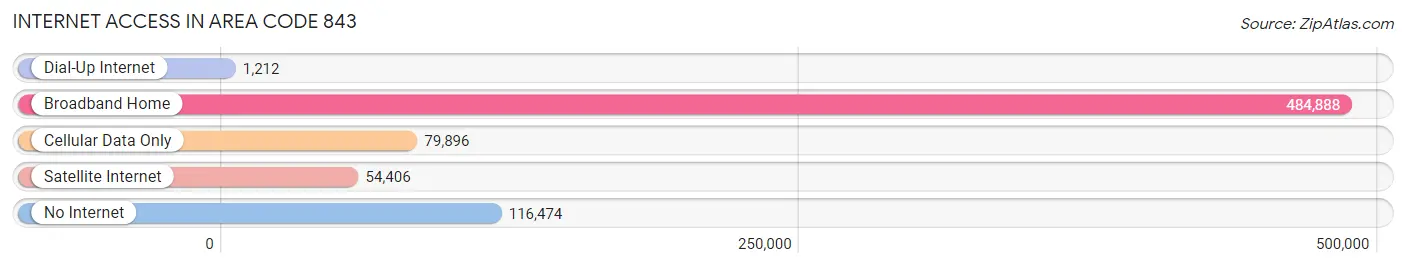
| Internet Type | # Households | % Households |
| Dial-Up Internet | 1,212 | 0.2% |
| Broadband Home | 484,888 | 68.0% |
| Cellular Data Only | 79,896 | 11.2% |
| Satellite Internet | 54,406 | 7.6% |
| No Internet | 116,474 | 16.4% |
| Total | 712,567 | 100.0% |
Area Code 843 Summary
Geography
Area code 843 is located in the southeastern United States, covering the coastal areas of South Carolina and parts of Georgia. It is bordered by area codes 803, 864, and 706.
Social
Area code 843 is home to a diverse population of people from all walks of life. The area is known for its vibrant culture, with a variety of restaurants, bars, and entertainment venues.
Economics
Area code 843 is a major economic hub in the region, with a strong presence in the tourism, manufacturing, and technology industries. The area is home to several Fortune 500 companies, as well as numerous small businesses.
Demographics
Area code 843 is home to a population of over 1.5 million people. The area is predominantly white, with a significant African American population. The median household income is slightly above the national average.
Common Questions
What is Per Capita Income in Area Code 843?
Per Capita income in Area Code 843 is $34,218.
What is the Median Family Income in Area Code 843?
Median Family Income in Area Code 843 is $74,977.
What is the Median Household income in Area Code 843?
Median Household Income in Area Code 843 is $59,579.
What is Income or Wage Gap in Area Code 843?
Income or Wage Gap in Area Code 843 is 27.3%.
Women in Area Code 843 earn 72.7 cents for every dollar earned by a man.
What is Family Income Deficit in Area Code 843?
Family Income Deficit in Area Code 843 is $10,542.
Families that are below poverty line in Area Code 843 earn $10,542 less on average than the poverty threshold level.
What is Inequality or Gini Index in Area Code 843?
Inequality or Gini Index in Area Code 843 is 62.61.
What is the Total Population of Area Code 843?
Total Population of Area Code 843 is 1,796,300.
What is the Total Male Population of Area Code 843?
Total Male Population of Area Code 843 is 876,580.
What is the Total Female Population of Area Code 843?
Total Female Population of Area Code 843 is 919,720.
What is the Ratio of Males per 100 Females in Area Code 843?
There are 95.31 Males per 100 Females in Area Code 843.
What is the Ratio of Females per 100 Males in Area Code 843?
There are 104.92 Females per 100 Males in Area Code 843.
What is the Median Population Age in Area Code 843?
Median Population Age in Area Code 843 is 43.8 Years.
What is the Average Family Size in Area Code 843
Average Family Size in Area Code 843 is 3.1 People.
What is the Average Household Size in Area Code 843
Average Household Size in Area Code 843 is 2.5 People.
How Large is the Labor Force in Area Code 843?
There are 808,830 People in the Labor Forcein in Area Code 843.
What is the Percentage of People in the Labor Force in Area Code 843?
54.9% of People are in the Labor Force in Area Code 843.
What is the Unemployment Rate in Area Code 843?
Unemployment Rate in Area Code 843 is 6.0%.