Area Code 803 Map & Demographics
Area Code 803 Map
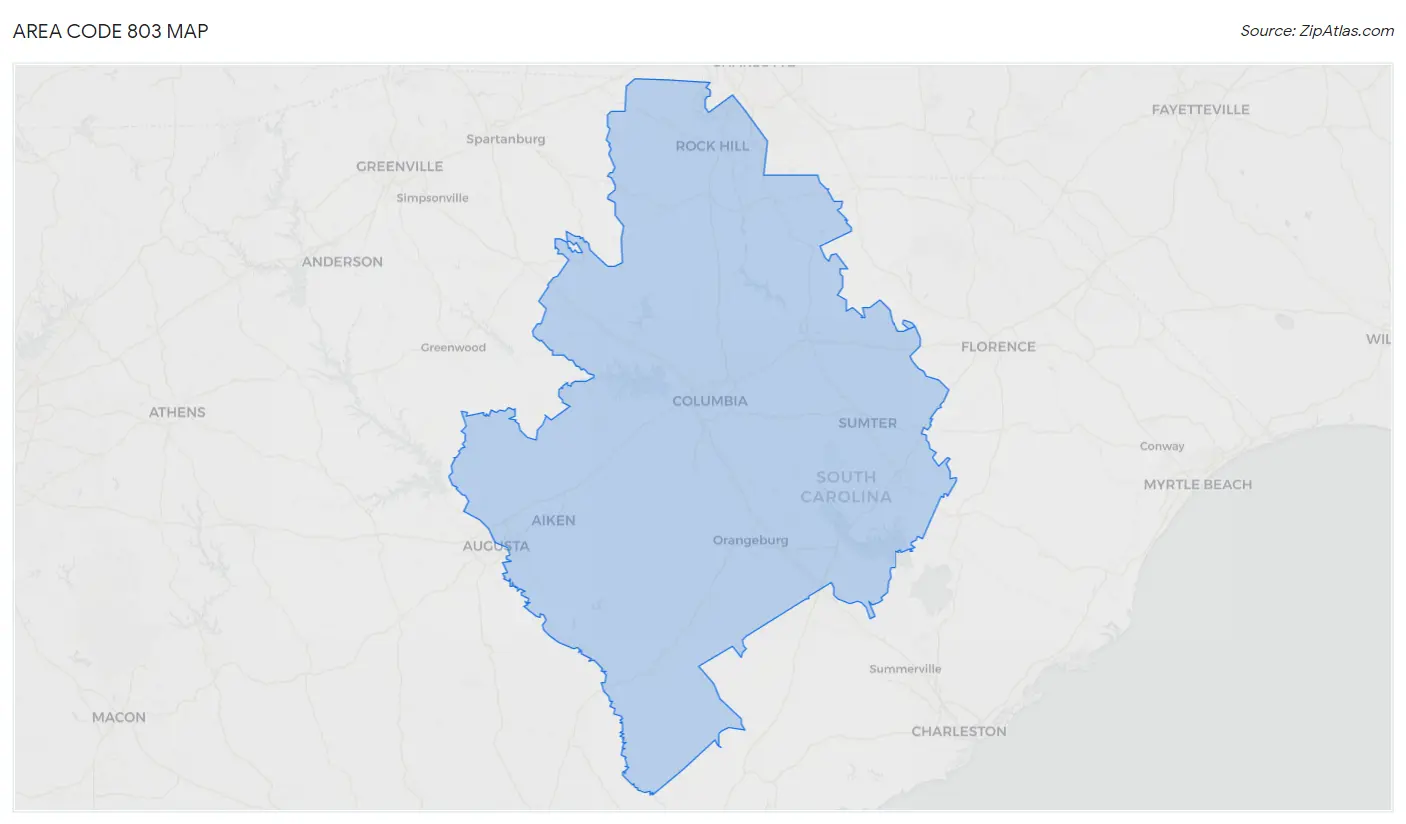
Area Code 803 Overview
$28,585
PER CAPITA INCOME
$69,357
AVG FAMILY INCOME
$54,805
AVG HOUSEHOLD INCOME
27.9%
WAGE / INCOME GAP [ % ]
72.1¢/ $1
WAGE / INCOME GAP [ $ ]
$10,872
FAMILY INCOME DEFICIT
57.69
INEQUALITY / GINI INDEX
1,694,525
TOTAL POPULATION
824,750
MALE POPULATION
869,775
FEMALE POPULATION
94.82
MALES / 100 FEMALES
105.46
FEMALES / 100 MALES
40.6
MEDIAN AGE
3.2
AVG FAMILY SIZE
2.5
AVG HOUSEHOLD SIZE
778,282
LABOR FORCE [ PEOPLE ]
57.1%
PERCENT IN LABOR FORCE
8.7%
UNEMPLOYMENT RATE
Income in Area Code 803
Income Overview in Area Code 803
Per Capita Income in Area Code 803 is $28,585, while median incomes of families and households are $69,357 and $54,805 respectively.
| Characteristic | Number | Measure |
| Per Capita Income | 1,694,525 | $28,585 |
| Median Family Income | 431,927 | $69,357 |
| Mean Family Income | 431,927 | $11,065,758 |
| Median Household Income | 665,561 | $54,805 |
| Mean Household Income | 665,561 | $9,313,944 |
| Income Deficit | 431,927 | $10,872 |
| Wage / Income Gap (%) | 1,694,525 | 27.91% |
| Wage / Income Gap ($) | 1,694,525 | 72.09¢ per $1 |
| Gini / Inequality Index | 1,694,525 | 57.69 |
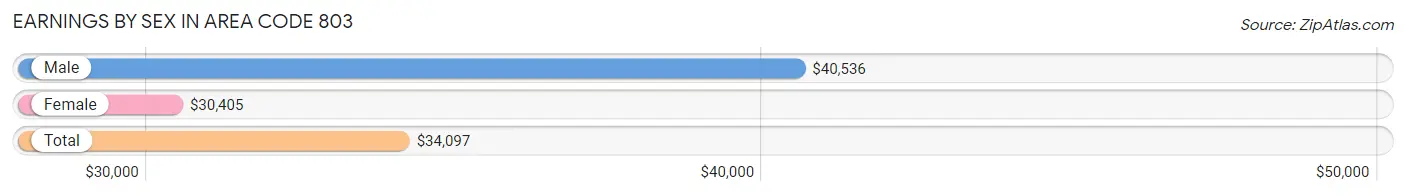
Earnings by Sex in Area Code 803
Average Earnings in Area Code 803 are $34,097, $40,536 for men and $30,405 for women, a difference of 25.0%.
| Sex | Number | Average Earnings |
| Male | 445,530 (51.2%) | $40,536 |
| Female | 424,624 (48.8%) | $30,405 |
| Total | 870,154 (100.0%) | $34,097 |
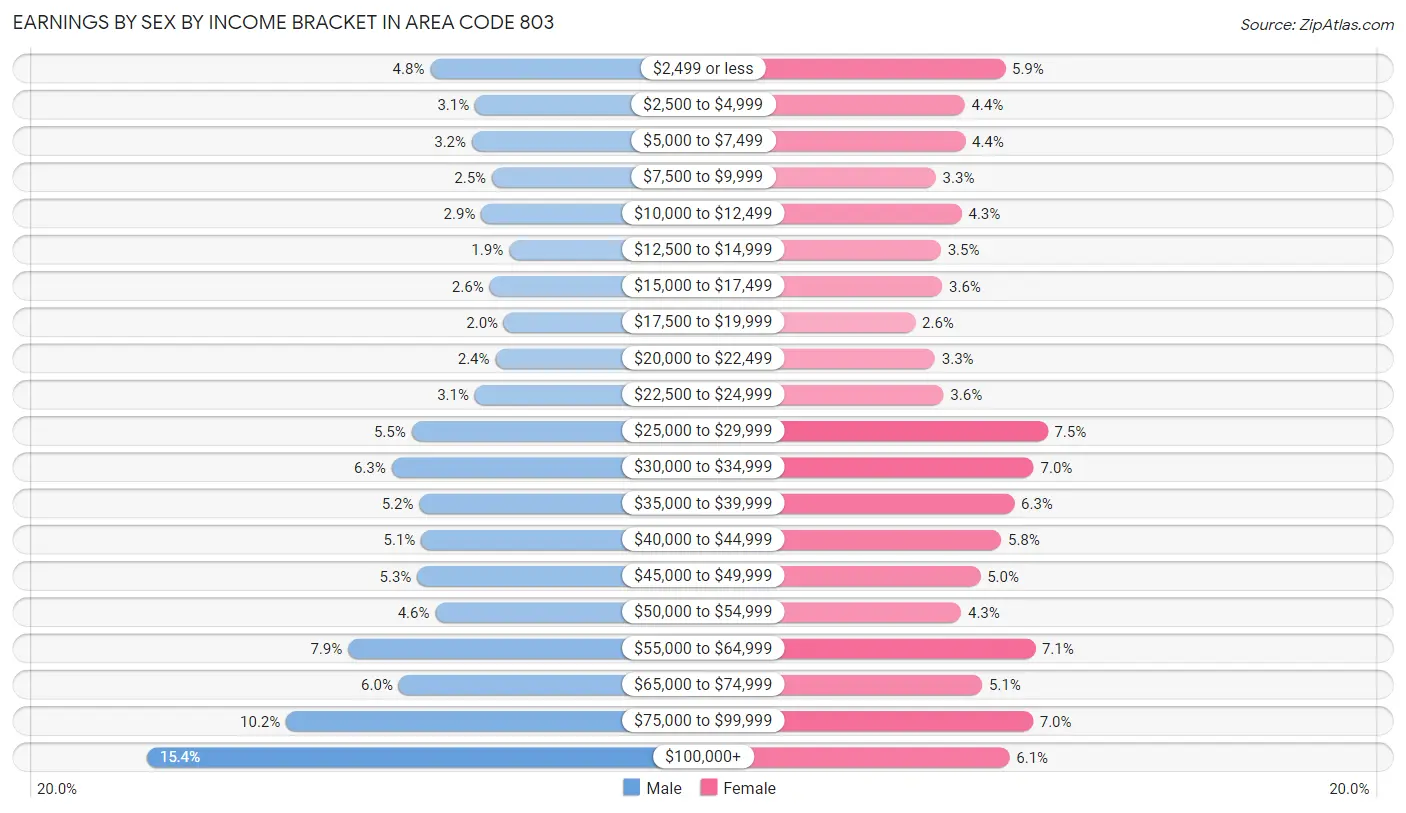
Earnings by Sex by Income Bracket in Area Code 803
The most common earnings brackets in Area Code 803 are $100,000+ for men (68,689 | 15.4%) and $25,000 to $29,999 for women (31,918 | 7.5%).
| Income | Male | Female |
| $2,499 or less | 21,384 (4.8%) | 25,161 (5.9%) |
| $2,500 to $4,999 | 13,900 (3.1%) | 18,733 (4.4%) |
| $5,000 to $7,499 | 14,449 (3.2%) | 18,824 (4.4%) |
| $7,500 to $9,999 | 11,106 (2.5%) | 14,154 (3.3%) |
| $10,000 to $12,499 | 12,882 (2.9%) | 18,267 (4.3%) |
| $12,500 to $14,999 | 8,259 (1.8%) | 14,928 (3.5%) |
| $15,000 to $17,499 | 11,483 (2.6%) | 15,172 (3.6%) |
| $17,500 to $19,999 | 9,106 (2.0%) | 10,850 (2.6%) |
| $20,000 to $22,499 | 10,528 (2.4%) | 14,014 (3.3%) |
| $22,500 to $24,999 | 13,957 (3.1%) | 15,354 (3.6%) |
| $25,000 to $29,999 | 24,510 (5.5%) | 31,918 (7.5%) |
| $30,000 to $34,999 | 27,858 (6.2%) | 29,733 (7.0%) |
| $35,000 to $39,999 | 23,226 (5.2%) | 26,612 (6.3%) |
| $40,000 to $44,999 | 22,892 (5.1%) | 24,535 (5.8%) |
| $45,000 to $49,999 | 23,574 (5.3%) | 21,211 (5.0%) |
| $50,000 to $54,999 | 20,544 (4.6%) | 18,174 (4.3%) |
| $55,000 to $64,999 | 35,088 (7.9%) | 29,955 (7.0%) |
| $65,000 to $74,999 | 26,643 (6.0%) | 21,544 (5.1%) |
| $75,000 to $99,999 | 45,452 (10.2%) | 29,606 (7.0%) |
| $100,000+ | 68,689 (15.4%) | 25,879 (6.1%) |
| Total | 445,530 (100.0%) | 424,624 (100.0%) |
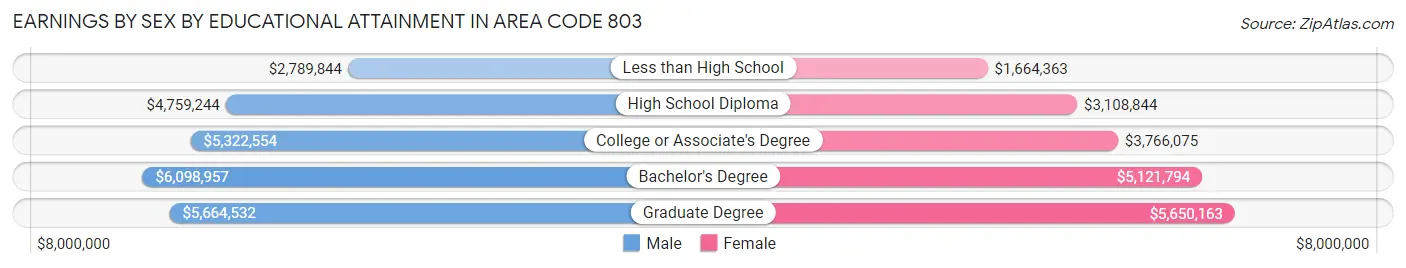
Earnings by Sex by Educational Attainment in Area Code 803
Average earnings in Area Code 803 are $6,010,392 for men and $4,540,292 for women, a difference of 24.5%. Men with an educational attainment of bachelor's degree enjoy the highest average annual earnings of $6,098,957, while those with less than high school education earn the least with $2,789,844. Women with an educational attainment of graduate degree earn the most with the average annual earnings of $5,650,163, while those with less than high school education have the smallest earnings of $1,664,363.
| Educational Attainment | Male Income | Female Income |
| Less than High School | $2,789,844 | $1,664,363 |
| High School Diploma | $4,759,244 | $3,108,844 |
| College or Associate's Degree | $5,322,554 | $3,766,075 |
| Bachelor's Degree | $6,098,957 | $5,121,794 |
| Graduate Degree | $5,664,532 | $5,650,163 |
| Total | $6,010,392 | $4,540,292 |
Family Income in Area Code 803
Family Income Brackets in Area Code 803
According to the Area Code 803 family income data, there are 10,542,042 families falling into the $50,000 to $74,999 income range, which is the most common income bracket and makes up 2,440.7% of all families. Conversely, the $10,000 to $14,999 income bracket is the least frequent group with only 1,882,338 families (435.8%) belonging to this category.
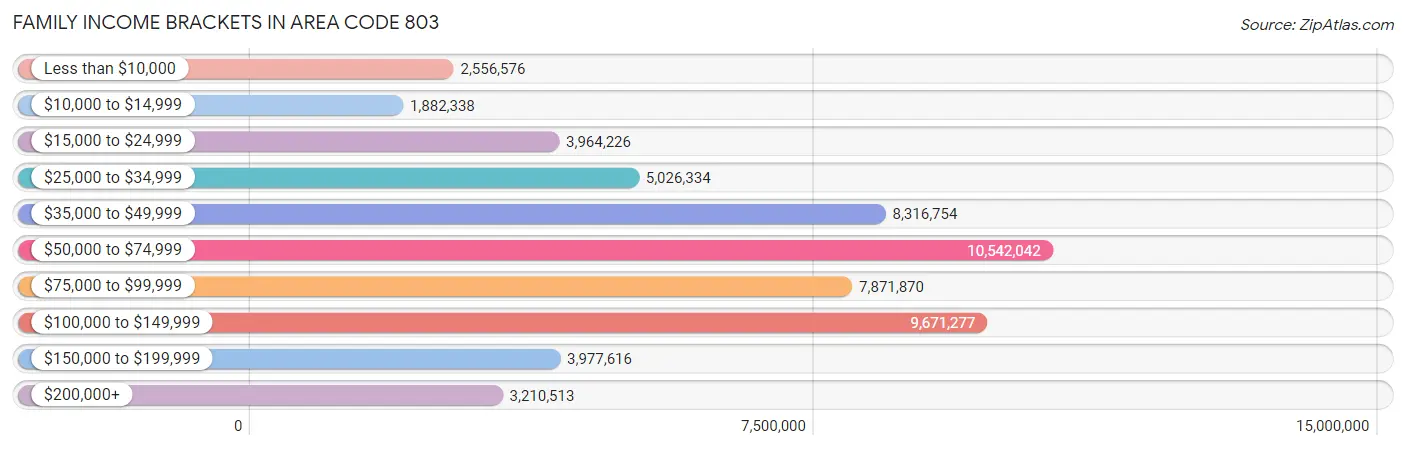
| Income Bracket | # Families | % Families |
| Less than $10,000 | 2,556,576 | 591.9% |
| $10,000 to $14,999 | 1,882,338 | 435.8% |
| $15,000 to $24,999 | 3,964,226 | 917.8% |
| $25,000 to $34,999 | 5,026,334 | 1,163.7% |
| $35,000 to $49,999 | 8,316,754 | 1,925.5% |
| $50,000 to $74,999 | 10,542,042 | 2,440.7% |
| $75,000 to $99,999 | 7,871,870 | 1,822.5% |
| $100,000 to $149,999 | 9,671,277 | 2,239.1% |
| $150,000 to $199,999 | 3,977,616 | 920.9% |
| $200,000+ | 3,210,513 | 743.3% |
Family Income by Famaliy Size in Area Code 803
6-person families (10,443 | 2.4%) account for the highest median family income in Area Code 803 with $108,159 per family, while 2-person families (214,121 | 49.6%) have the highest median income of $31,747 per family member.
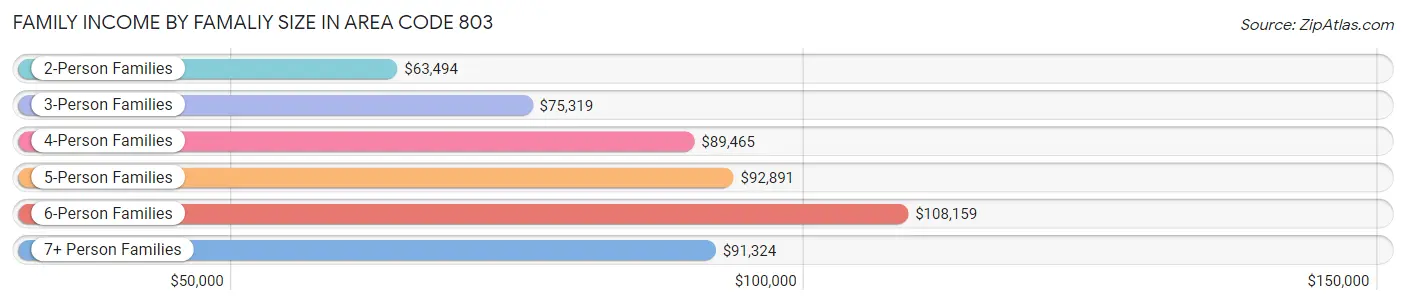
| Income Bracket | # Families | Median Income |
| 2-Person Families | 214,121 (49.6%) | $63,494 |
| 3-Person Families | 95,638 (22.1%) | $75,319 |
| 4-Person Families | 75,846 (17.6%) | $89,465 |
| 5-Person Families | 30,827 (7.1%) | $92,891 |
| 6-Person Families | 10,443 (2.4%) | $108,159 |
| 7+ Person Families | 5,052 (1.2%) | $91,324 |
| Total | 431,927 (100.0%) | $69,357 |
Family Income by Number of Earners in Area Code 803
The median family income in Area Code 803 is $69,357, with families comprising 3+ earners (39,294) having the highest median family income of $129,147, while families with no earners (72,628) have the lowest median family income of $41,835, accounting for 9.1% and 16.8% of families, respectively.
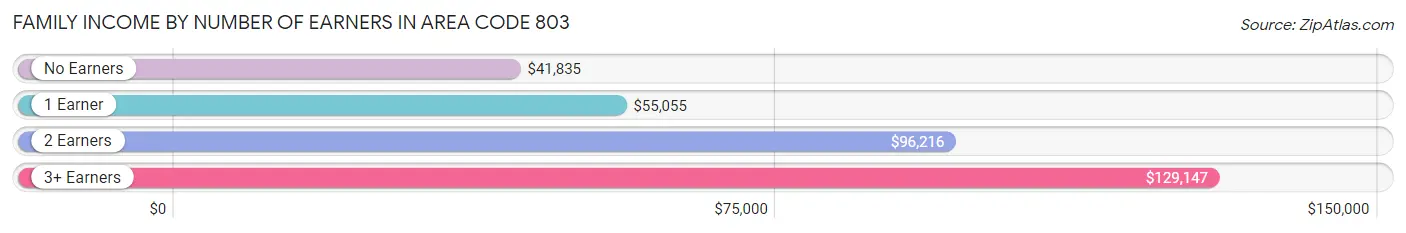
| Number of Earners | # Families | Median Income |
| No Earners | 72,628 (16.8%) | $41,835 |
| 1 Earner | 147,929 (34.3%) | $55,055 |
| 2 Earners | 172,076 (39.8%) | $96,216 |
| 3+ Earners | 39,294 (9.1%) | $129,147 |
| Total | 431,927 (100.0%) | $69,357 |
Household Income in Area Code 803
Household Income Brackets in Area Code 803
With 15,618,720 households falling in the category, the $50,000 to $74,999 income range is the most frequent in Area Code 803, accounting for 2,346.7% of all households. In contrast, only 3,734,463 households (561.1%) fall into the $200,000+ income bracket, making it the least populous group.
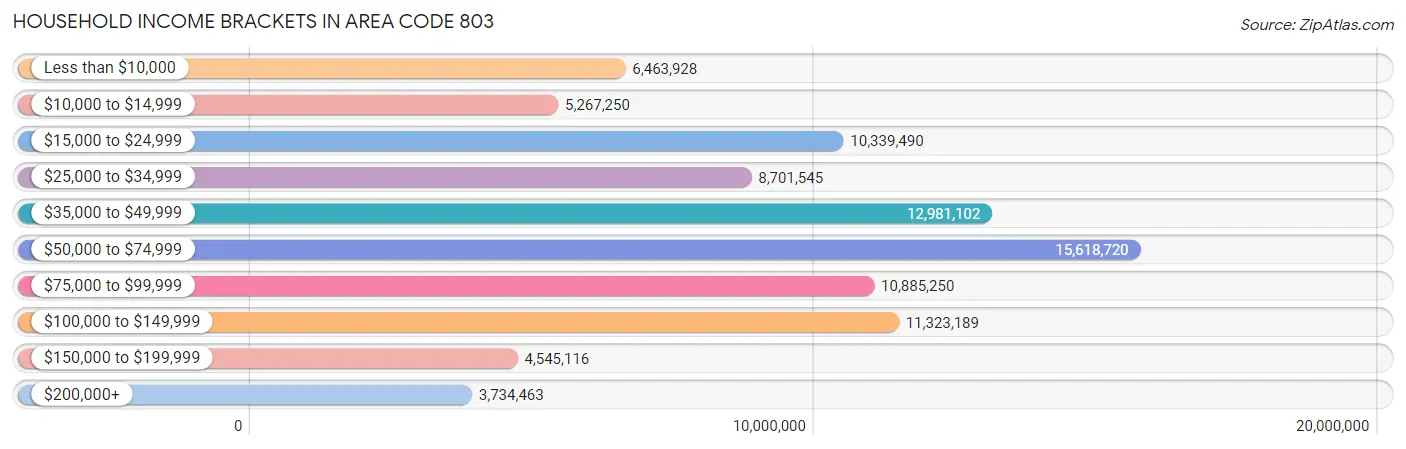
| Income Bracket | # Households | % Households |
| Less than $10,000 | 6,463,928 | 971.2% |
| $10,000 to $14,999 | 5,267,250 | 791.4% |
| $15,000 to $24,999 | 10,339,490 | 1,553.5% |
| $25,000 to $34,999 | 8,701,545 | 1,307.4% |
| $35,000 to $49,999 | 12,981,102 | 1,950.4% |
| $50,000 to $74,999 | 15,618,720 | 2,346.7% |
| $75,000 to $99,999 | 10,885,250 | 1,635.5% |
| $100,000 to $149,999 | 11,323,189 | 1,701.3% |
| $150,000 to $199,999 | 4,545,116 | 682.9% |
| $200,000+ | 3,734,463 | 561.1% |
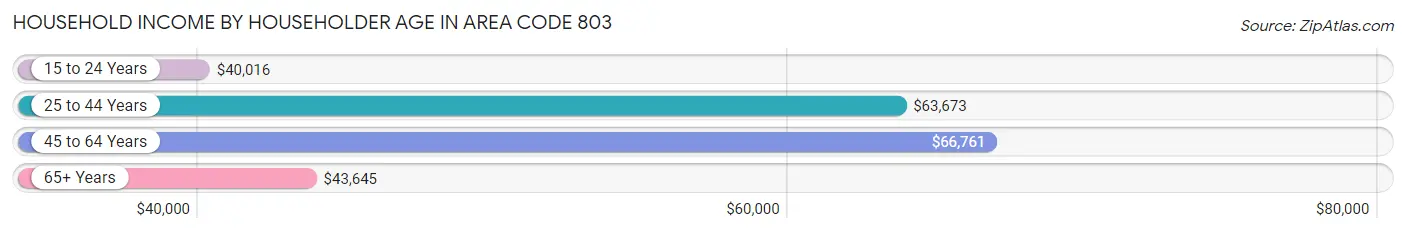
Household Income by Householder Age in Area Code 803
The median household income in Area Code 803 is $54,805, with the highest median household income of $66,761 found in the 45 to 64 years age bracket for the primary householder. A total of 246,223 households (37.0%) fall into this category. Meanwhile, the 15 to 24 years age bracket for the primary householder has the lowest median household income of $40,016, with 27,278 households (4.1%) in this group.
| Income Bracket | # Households | Median Income |
| 15 to 24 Years | 27,278 (4.1%) | $40,016 |
| 25 to 44 Years | 208,572 (31.3%) | $63,673 |
| 45 to 64 Years | 246,223 (37.0%) | $66,761 |
| 65+ Years | 183,488 (27.6%) | $43,645 |
| Total | 665,561 (100.0%) | $54,805 |
Poverty in Area Code 803
Income Below Poverty by Sex and Age in Area Code 803
With 13.6% poverty level for males and 16.1% for females among the residents of Area Code 803, 5 year old males and 18 to 24 year old females are the most vulnerable to poverty, with 2,308 males (26.5%) and 19,080 females (26.8%) in their respective age groups living below the poverty level.
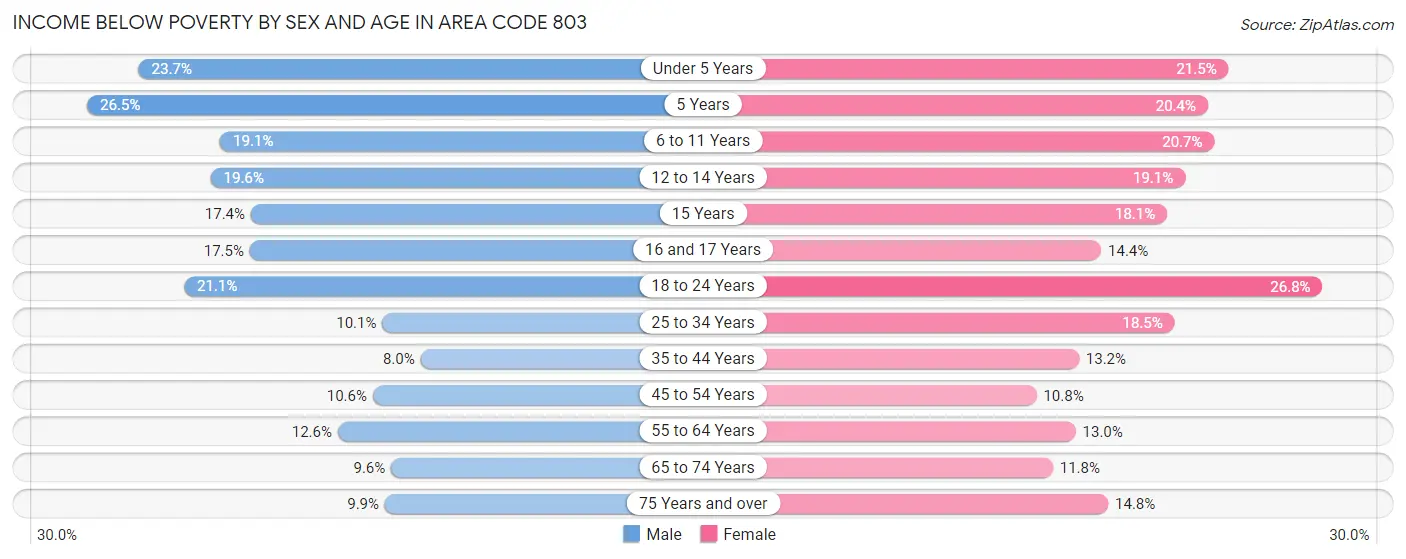
| Age Bracket | Male | Female |
| Under 5 Years | 11,354 (23.6%) | 9,805 (21.5%) |
| 5 Years | 2,308 (26.5%) | 1,969 (20.4%) |
| 6 to 11 Years | 11,933 (19.1%) | 12,687 (20.7%) |
| 12 to 14 Years | 6,973 (19.6%) | 6,031 (19.1%) |
| 15 Years | 2,020 (17.4%) | 2,058 (18.1%) |
| 16 and 17 Years | 3,834 (17.5%) | 2,923 (14.4%) |
| 18 to 24 Years | 15,581 (21.1%) | 19,080 (26.8%) |
| 25 to 34 Years | 10,346 (10.1%) | 20,216 (18.5%) |
| 35 to 44 Years | 7,874 (8.0%) | 14,396 (13.2%) |
| 45 to 54 Years | 10,699 (10.6%) | 11,583 (10.8%) |
| 55 to 64 Years | 13,066 (12.6%) | 14,857 (13.0%) |
| 65 to 74 Years | 7,598 (9.6%) | 11,061 (11.7%) |
| 75 Years and over | 4,453 (9.9%) | 9,322 (14.8%) |
| Total | 108,039 (13.6%) | 135,988 (16.1%) |
Income Above Poverty by Sex and Age in Area Code 803
According to the poverty statistics in Area Code 803, males aged 35 to 44 years and females aged 45 to 54 years are the age groups that are most secure financially, with 92.0% of males and 89.2% of females in these age groups living above the poverty line.
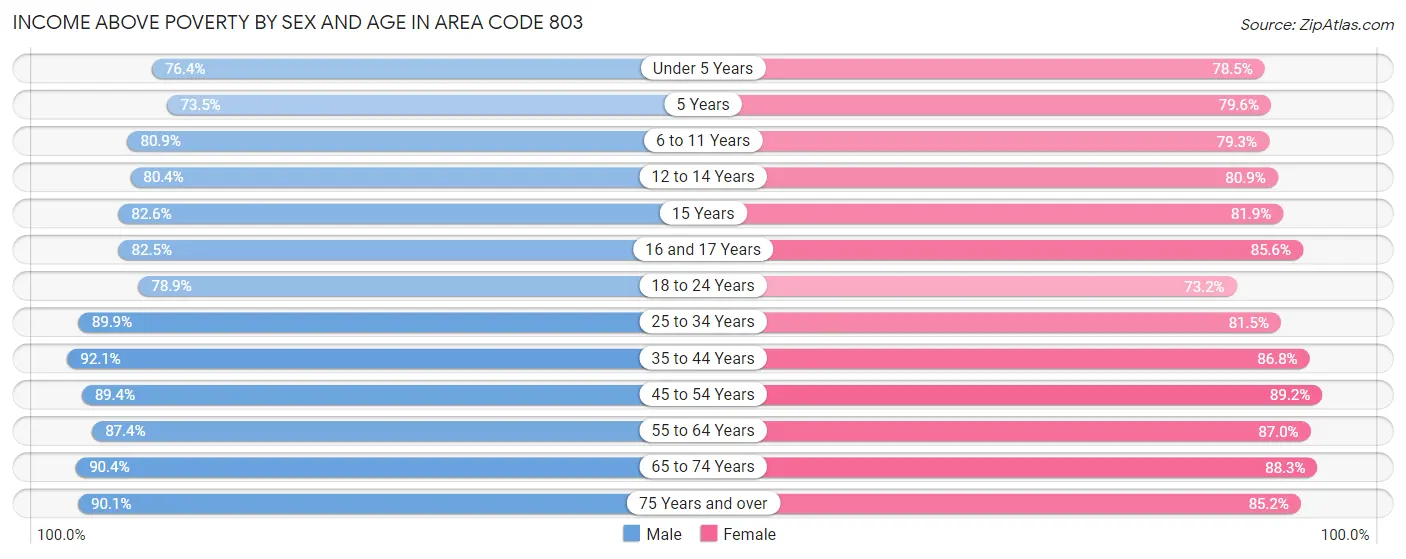
| Age Bracket | Male | Female |
| Under 5 Years | 36,655 (76.3%) | 35,745 (78.5%) |
| 5 Years | 6,395 (73.5%) | 7,691 (79.6%) |
| 6 to 11 Years | 50,516 (80.9%) | 48,490 (79.3%) |
| 12 to 14 Years | 28,537 (80.4%) | 25,525 (80.9%) |
| 15 Years | 9,587 (82.6%) | 9,304 (81.9%) |
| 16 and 17 Years | 18,124 (82.5%) | 17,318 (85.6%) |
| 18 to 24 Years | 58,191 (78.9%) | 52,209 (73.2%) |
| 25 to 34 Years | 92,247 (89.9%) | 88,870 (81.5%) |
| 35 to 44 Years | 91,214 (92.0%) | 94,680 (86.8%) |
| 45 to 54 Years | 90,118 (89.4%) | 95,280 (89.2%) |
| 55 to 64 Years | 90,983 (87.4%) | 99,246 (87.0%) |
| 65 to 74 Years | 71,670 (90.4%) | 83,100 (88.2%) |
| 75 Years and over | 40,330 (90.1%) | 53,545 (85.2%) |
| Total | 684,567 (86.4%) | 711,003 (83.9%) |
Income Below Poverty Among Married-Couple Families in Area Code 803
The poverty statistics for married-couple families in Area Code 803 show that 4.4% or 13,228 of the total 303,433 families live below the poverty line. Families with 5 or more children have the highest poverty rate of 14.5%, comprising of 223 families. On the other hand, families with no children have the lowest poverty rate of 3.9%, which includes 7,194 families.
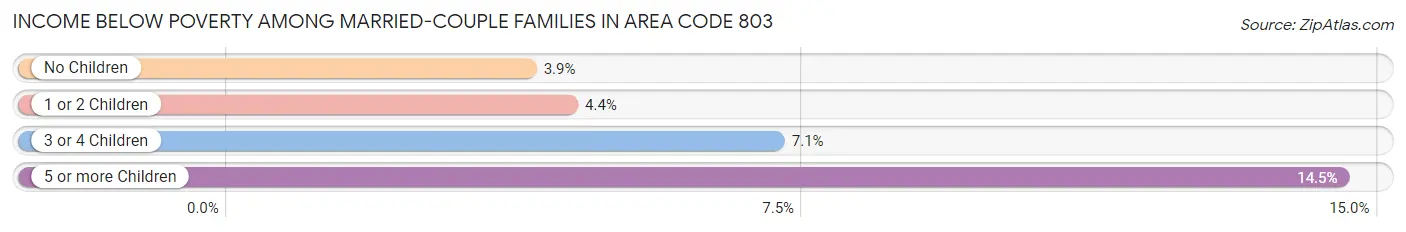
| Children | Above Poverty | Below Poverty |
| No Children | 177,108 (96.1%) | 7,194 (3.9%) |
| 1 or 2 Children | 91,571 (95.6%) | 4,256 (4.4%) |
| 3 or 4 Children | 20,212 (92.9%) | 1,555 (7.1%) |
| 5 or more Children | 1,314 (85.5%) | 223 (14.5%) |
| Total | 290,205 (95.6%) | 13,228 (4.4%) |
Income Below Poverty Among Single-Parent Households in Area Code 803
According to the poverty data in Area Code 803, 16.7% or 4,931 single-father households and 28.2% or 27,891 single-mother households are living below the poverty line. Among single-father households, those with 3 or 4 children have the highest poverty rate, with 533 households (24.4%) experiencing poverty. Likewise, among single-mother households, those with 5 or more children have the highest poverty rate, with 1,051 households (73.6%) falling below the poverty line.
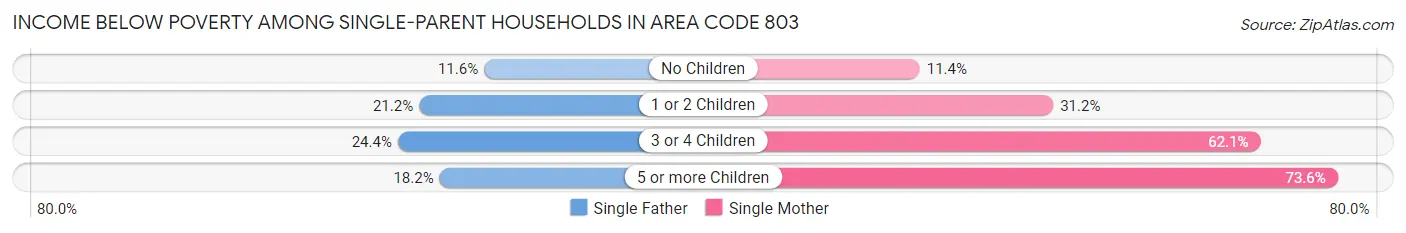
| Children | Single Father | Single Mother |
| No Children | 1,695 (11.6%) | 3,964 (11.4%) |
| 1 or 2 Children | 2,683 (21.2%) | 16,143 (31.2%) |
| 3 or 4 Children | 533 (24.4%) | 6,733 (62.1%) |
| 5 or more Children | 20 (18.2%) | 1,051 (73.6%) |
| Total | 4,931 (16.7%) | 27,891 (28.2%) |
Income Below Poverty Among Married-Couple vs Single-Parent Households in Area Code 803
The poverty data for Area Code 803 shows that 13,228 of the married-couple family households (4.4%) and 32,822 of the single-parent households (25.5%) are living below the poverty level. Within the married-couple family households, those with 5 or more children have the highest poverty rate, with 223 households (14.5%) falling below the poverty line. Among the single-parent households, those with 5 or more children have the highest poverty rate, with 1,071 household (69.6%) living below poverty.
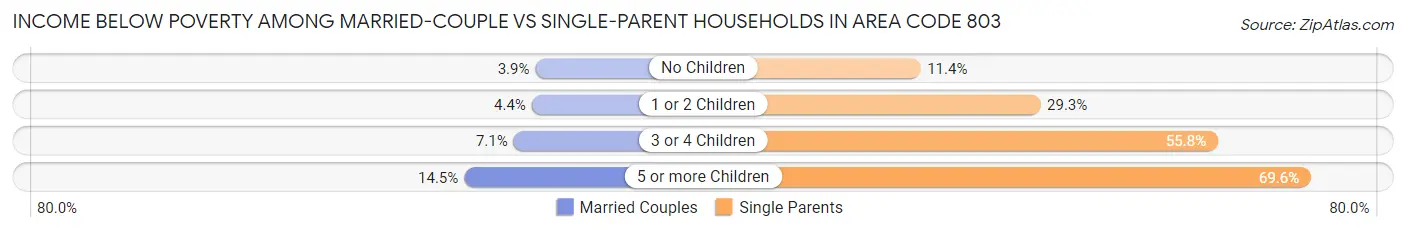
| Children | Married-Couple Families | Single-Parent Households |
| No Children | 7,194 (3.9%) | 5,659 (11.4%) |
| 1 or 2 Children | 4,256 (4.4%) | 18,826 (29.3%) |
| 3 or 4 Children | 1,555 (7.1%) | 7,266 (55.8%) |
| 5 or more Children | 223 (14.5%) | 1,071 (69.6%) |
| Total | 13,228 (4.4%) | 32,822 (25.5%) |
Race in Area Code 803
The most populous races in Area Code 803 are White / Caucasian (988,022 | 58.3%), Black / African American (556,382 | 32.8%), and Hispanic or Latino (95,703 | 5.7%).
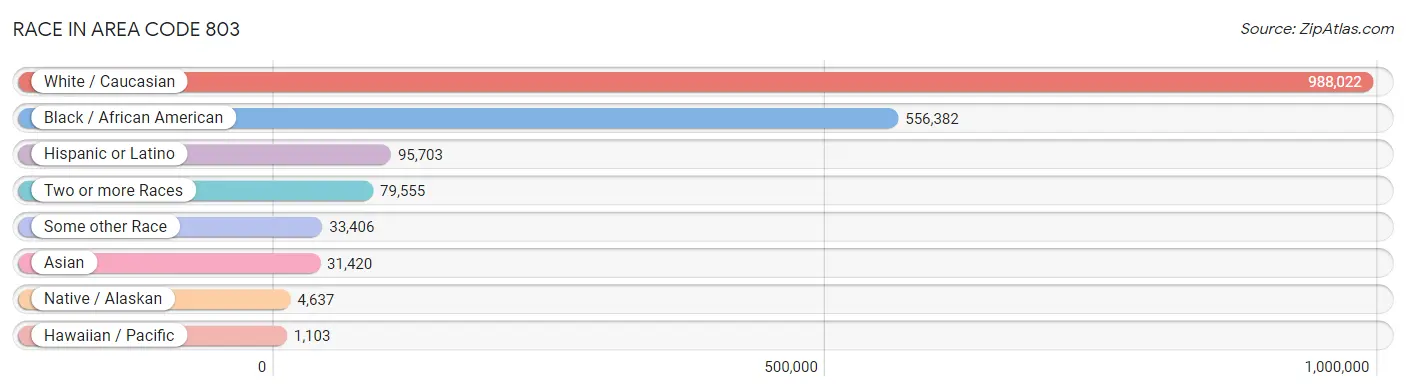
| Race | # Population | % Population |
| Asian | 31,420 | 1.8% |
| Black / African American | 556,382 | 32.8% |
| Hawaiian / Pacific | 1,103 | 0.1% |
| Hispanic or Latino | 95,703 | 5.7% |
| Native / Alaskan | 4,637 | 0.3% |
| White / Caucasian | 988,022 | 58.3% |
| Two or more Races | 79,555 | 4.7% |
| Some other Race | 33,406 | 2.0% |
| Total | 1,694,525 | 100.0% |
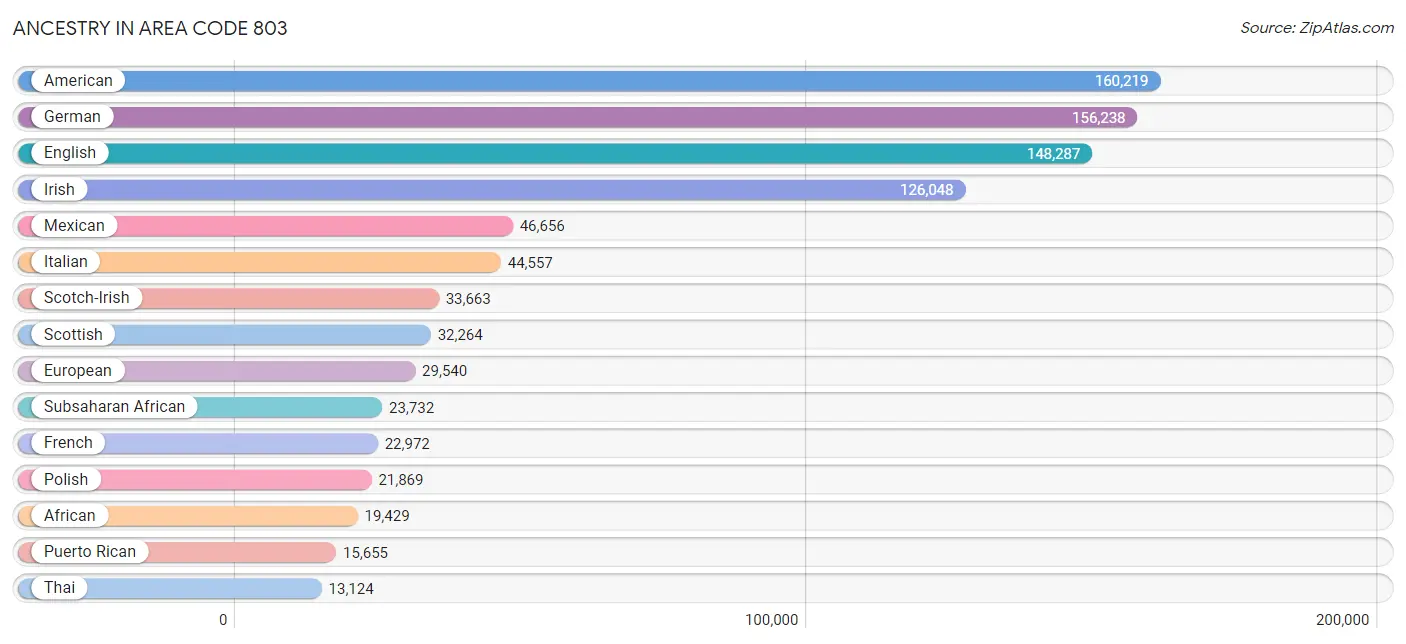
Ancestry in Area Code 803
The most populous ancestries reported in Area Code 803 are American (160,219 | 9.5%), German (156,238 | 9.2%), English (148,287 | 8.7%), Irish (126,048 | 7.4%), and Mexican (46,656 | 2.8%), together accounting for 37.6% of all Area Code 803 residents.
| Ancestry | # Population | % Population |
| African | 19,429 | 1.1% |
| Alaska Native | 7 | 0.0% |
| Albanian | 228 | 0.0% |
| Aleut | 18 | 0.0% |
| American | 160,219 | 9.5% |
| Apache | 326 | 0.0% |
| Arab | 5,862 | 0.4% |
| Arapaho | 1 | 0.0% |
| Argentinean | 279 | 0.0% |
| Armenian | 530 | 0.0% |
| Assyrian / Chaldean / Syriac | 13 | 0.0% |
| Australian | 208 | 0.0% |
| Austrian | 1,714 | 0.1% |
| Bahamian | 328 | 0.0% |
| Bangladeshi | 339 | 0.0% |
| Barbadian | 70 | 0.0% |
| Basque | 20 | 0.0% |
| Belgian | 852 | 0.1% |
| Belizean | 36 | 0.0% |
| Bhutanese | 2,596 | 0.2% |
| Blackfeet | 516 | 0.0% |
| Bolivian | 193 | 0.0% |
| Brazilian | 730 | 0.0% |
| British | 7,294 | 0.4% |
| British West Indian | 456 | 0.0% |
| Bulgarian | 85 | 0.0% |
| Burmese | 3,720 | 0.2% |
| Cajun | 202 | 0.0% |
| Cambodian | 75 | 0.0% |
| Canadian | 1,979 | 0.1% |
| Cape Verdean | 106 | 0.0% |
| Carpatho Rusyn | 21 | 0.0% |
| Celtic | 382 | 0.0% |
| Central American | 12,152 | 0.7% |
| Central American Indian | 517 | 0.0% |
| Cherokee | 5,881 | 0.4% |
| Cheyenne | 8 | 0.0% |
| Chickasaw | 63 | 0.0% |
| Chilean | 227 | 0.0% |
| Chippewa | 93 | 0.0% |
| Choctaw | 428 | 0.0% |
| Colombian | 3,019 | 0.2% |
| Comanche | 22 | 0.0% |
| Costa Rican | 865 | 0.1% |
| Cree | 21 | 0.0% |
| Creek | 95 | 0.0% |
| Croatian | 742 | 0.0% |
| Crow | 35 | 0.0% |
| Cuban | 4,683 | 0.3% |
| Cypriot | 67 | 0.0% |
| Czech | 2,421 | 0.1% |
| Czechoslovakian | 566 | 0.0% |
| Danish | 3,085 | 0.2% |
| Delaware | 6 | 0.0% |
| Dominican | 1,697 | 0.1% |
| Dutch | 10,556 | 0.6% |
| Dutch West Indian | 15 | 0.0% |
| Eastern European | 2,127 | 0.1% |
| Ecuadorian | 1,280 | 0.1% |
| Egyptian | 465 | 0.0% |
| English | 148,287 | 8.7% |
| Estonian | 44 | 0.0% |
| Ethiopian | 332 | 0.0% |
| European | 29,540 | 1.7% |
| Fijian | 10 | 0.0% |
| Filipino | 239 | 0.0% |
| Finnish | 1,366 | 0.1% |
| French | 22,972 | 1.4% |
| French American Indian | 83 | 0.0% |
| French Canadian | 4,291 | 0.3% |
| German | 156,238 | 9.2% |
| German Russian | 13 | 0.0% |
| Ghanaian | 387 | 0.0% |
| Greek | 3,808 | 0.2% |
| Guamanian / Chamorro | 836 | 0.1% |
| Guatemalan | 2,696 | 0.2% |
| Guyanese | 261 | 0.0% |
| Haitian | 1,409 | 0.1% |
| Honduran | 4,660 | 0.3% |
| Hopi | 24 | 0.0% |
| Houma | 55 | 0.0% |
| Hungarian | 3,174 | 0.2% |
| Icelander | 68 | 0.0% |
| Indian (Asian) | 6,002 | 0.4% |
| Indonesian | 164 | 0.0% |
| Inupiat | 1 | 0.0% |
| Iranian | 823 | 0.1% |
| Iraqi | 832 | 0.1% |
| Irish | 126,048 | 7.4% |
| Iroquois | 264 | 0.0% |
| Israeli | 198 | 0.0% |
| Italian | 44,557 | 2.6% |
| Jamaican | 4,531 | 0.3% |
| Japanese | 611 | 0.0% |
| Jordanian | 177 | 0.0% |
| Kenyan | 418 | 0.0% |
| Kiowa | 9 | 0.0% |
| Korean | 7,683 | 0.4% |
| Laotian | 357 | 0.0% |
| Latvian | 262 | 0.0% |
| Lebanese | 1,611 | 0.1% |
| Liberian | 366 | 0.0% |
| Lithuanian | 1,193 | 0.1% |
| Lumbee | 939 | 0.1% |
| Luxembourger | 59 | 0.0% |
| Macedonian | 29 | 0.0% |
| Malaysian | 685 | 0.0% |
| Maltese | 160 | 0.0% |
| Mexican | 46,656 | 2.8% |
| Mexican American Indian | 750 | 0.0% |
| Mongolian | 24 | 0.0% |
| Moroccan | 644 | 0.0% |
| Native Hawaiian | 1,267 | 0.1% |
| Navajo | 129 | 0.0% |
| New Zealander | 37 | 0.0% |
| Nicaraguan | 560 | 0.0% |
| Nigerian | 1,416 | 0.1% |
| Northern European | 2,729 | 0.2% |
| Norwegian | 6,396 | 0.4% |
| Okinawan | 78 | 0.0% |
| Osage | 4 | 0.0% |
| Ottawa | 9 | 0.0% |
| Paiute | 22 | 0.0% |
| Pakistani | 1,053 | 0.1% |
| Palestinian | 271 | 0.0% |
| Panamanian | 1,197 | 0.1% |
| Pennsylvania German | 199 | 0.0% |
| Peruvian | 868 | 0.1% |
| Polish | 21,869 | 1.3% |
| Portuguese | 2,907 | 0.2% |
| Potawatomi | 18 | 0.0% |
| Pueblo | 41 | 0.0% |
| Puerto Rican | 15,655 | 0.9% |
| Romanian | 980 | 0.1% |
| Russian | 4,962 | 0.3% |
| Salvadoran | 2,145 | 0.1% |
| Samoan | 601 | 0.0% |
| Scandinavian | 2,453 | 0.1% |
| Scotch-Irish | 33,663 | 2.0% |
| Scottish | 32,264 | 1.9% |
| Seminole | 151 | 0.0% |
| Senegalese | 277 | 0.0% |
| Serbian | 602 | 0.0% |
| Shoshone | 33 | 0.0% |
| Sierra Leonean | 35 | 0.0% |
| Sioux | 325 | 0.0% |
| Slavic | 625 | 0.0% |
| Slovak | 1,070 | 0.1% |
| Slovene | 418 | 0.0% |
| South African | 239 | 0.0% |
| South American | 7,335 | 0.4% |
| South American Indian | 137 | 0.0% |
| Spaniard | 2,107 | 0.1% |
| Spanish | 1,934 | 0.1% |
| Spanish American | 161 | 0.0% |
| Spanish American Indian | 1 | 0.0% |
| Sri Lankan | 3,971 | 0.2% |
| Subsaharan African | 23,732 | 1.4% |
| Sudanese | 103 | 0.0% |
| Swedish | 7,025 | 0.4% |
| Swiss | 3,114 | 0.2% |
| Syrian | 466 | 0.0% |
| Taiwanese | 14 | 0.0% |
| Thai | 13,124 | 0.8% |
| Tohono O'Odham | 15 | 0.0% |
| Trinidadian and Tobagonian | 409 | 0.0% |
| Turkish | 675 | 0.0% |
| U.S. Virgin Islander | 39 | 0.0% |
| Ugandan | 72 | 0.0% |
| Ukrainian | 2,585 | 0.2% |
| Uruguayan | 83 | 0.0% |
| Ute | 16 | 0.0% |
| Venezuelan | 1,386 | 0.1% |
| Vietnamese | 254 | 0.0% |
| Welsh | 7,400 | 0.4% |
| West Indian | 1,244 | 0.1% |
| Yugoslavian | 629 | 0.0% | View All 177 Rows |
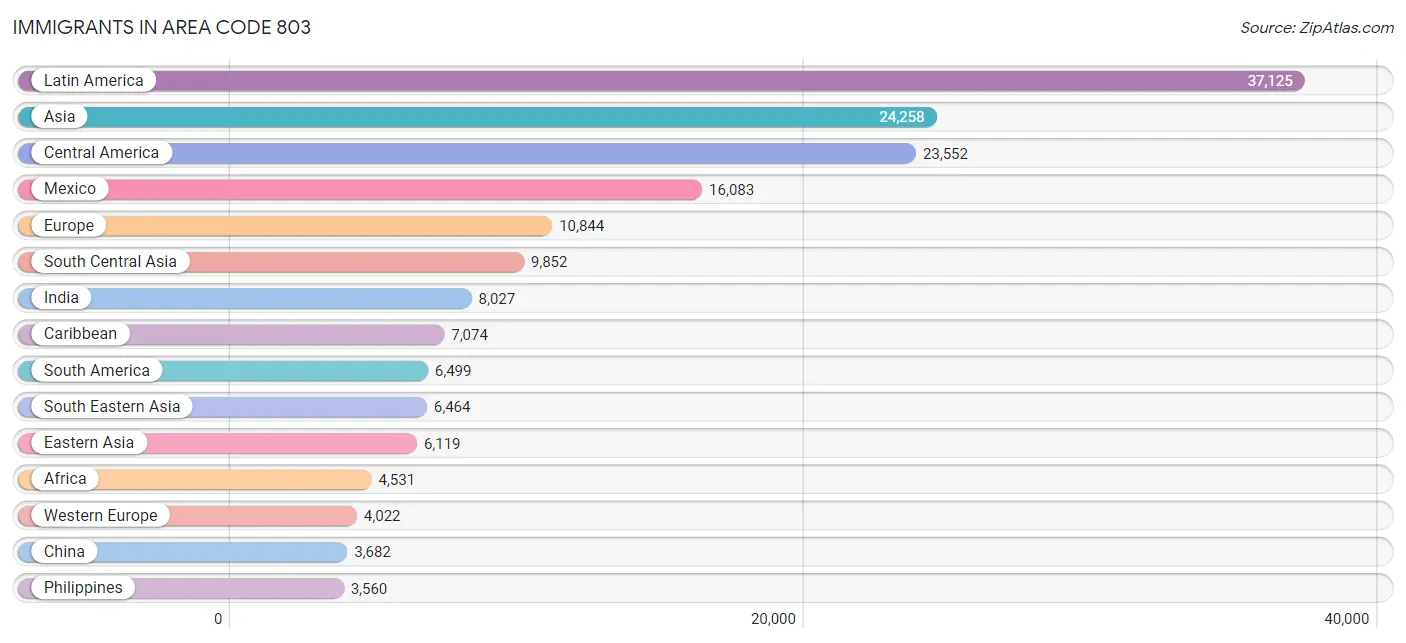
Immigrants in Area Code 803
The most numerous immigrant groups reported in Area Code 803 came from Latin America (37,125 | 2.2%), Asia (24,258 | 1.4%), Central America (23,552 | 1.4%), Mexico (16,083 | 0.9%), and Europe (10,844 | 0.6%), together accounting for 6.6% of all Area Code 803 residents.
| Immigration Origin | # Population | % Population |
| Africa | 4,531 | 0.3% |
| Albania | 17 | 0.0% |
| Argentina | 180 | 0.0% |
| Armenia | 25 | 0.0% |
| Asia | 24,258 | 1.4% |
| Australia | 114 | 0.0% |
| Austria | 92 | 0.0% |
| Azores | 35 | 0.0% |
| Bahamas | 228 | 0.0% |
| Bangladesh | 293 | 0.0% |
| Barbados | 134 | 0.0% |
| Belarus | 58 | 0.0% |
| Belgium | 83 | 0.0% |
| Belize | 51 | 0.0% |
| Bolivia | 76 | 0.0% |
| Bosnia and Herzegovina | 95 | 0.0% |
| Brazil | 1,035 | 0.1% |
| Bulgaria | 96 | 0.0% |
| Cabo Verde | 16 | 0.0% |
| Cambodia | 256 | 0.0% |
| Cameroon | 115 | 0.0% |
| Canada | 2,256 | 0.1% |
| Caribbean | 7,074 | 0.4% |
| Central America | 23,552 | 1.4% |
| Chile | 188 | 0.0% |
| China | 3,682 | 0.2% |
| Colombia | 2,239 | 0.1% |
| Congo | 57 | 0.0% |
| Costa Rica | 609 | 0.0% |
| Croatia | 25 | 0.0% |
| Cuba | 1,708 | 0.1% |
| Czechoslovakia | 26 | 0.0% |
| Denmark | 109 | 0.0% |
| Dominica | 92 | 0.0% |
| Dominican Republic | 599 | 0.0% |
| Eastern Africa | 1,601 | 0.1% |
| Eastern Asia | 6,119 | 0.4% |
| Eastern Europe | 2,643 | 0.2% |
| Ecuador | 889 | 0.1% |
| Egypt | 230 | 0.0% |
| El Salvador | 974 | 0.1% |
| England | 1,624 | 0.1% |
| Eritrea | 42 | 0.0% |
| Ethiopia | 308 | 0.0% |
| Europe | 10,844 | 0.6% |
| Fiji | 19 | 0.0% |
| France | 563 | 0.0% |
| Germany | 2,957 | 0.2% |
| Ghana | 269 | 0.0% |
| Greece | 234 | 0.0% |
| Grenada | 101 | 0.0% |
| Guatemala | 1,737 | 0.1% |
| Guyana | 183 | 0.0% |
| Haiti | 141 | 0.0% |
| Honduras | 3,122 | 0.2% |
| Hong Kong | 259 | 0.0% |
| Hungary | 171 | 0.0% |
| India | 8,027 | 0.5% |
| Indonesia | 105 | 0.0% |
| Iran | 572 | 0.0% |
| Iraq | 662 | 0.0% |
| Ireland | 165 | 0.0% |
| Israel | 42 | 0.0% |
| Italy | 343 | 0.0% |
| Jamaica | 3,256 | 0.2% |
| Japan | 599 | 0.0% |
| Jordan | 73 | 0.0% |
| Kazakhstan | 192 | 0.0% |
| Kenya | 692 | 0.0% |
| Korea | 1,783 | 0.1% |
| Kuwait | 212 | 0.0% |
| Laos | 258 | 0.0% |
| Latin America | 37,125 | 2.2% |
| Latvia | 20 | 0.0% |
| Lebanon | 93 | 0.0% |
| Liberia | 420 | 0.0% |
| Malaysia | 49 | 0.0% |
| Mexico | 16,083 | 0.9% |
| Micronesia | 111 | 0.0% |
| Middle Africa | 227 | 0.0% |
| Moldova | 45 | 0.0% |
| Morocco | 71 | 0.0% |
| Nepal | 141 | 0.0% |
| Netherlands | 229 | 0.0% |
| Nicaragua | 413 | 0.0% |
| Nigeria | 693 | 0.0% |
| North Macedonia | 23 | 0.0% |
| Northern Africa | 600 | 0.0% |
| Northern Europe | 3,082 | 0.2% |
| Norway | 3 | 0.0% |
| Oceania | 340 | 0.0% |
| Pakistan | 371 | 0.0% |
| Panama | 540 | 0.0% |
| Peru | 591 | 0.0% |
| Philippines | 3,560 | 0.2% |
| Poland | 510 | 0.0% |
| Portugal | 158 | 0.0% |
| Romania | 347 | 0.0% |
| Russia | 756 | 0.0% |
| Saudi Arabia | 79 | 0.0% |
| Scotland | 224 | 0.0% |
| Senegal | 203 | 0.0% |
| Serbia | 48 | 0.0% |
| Singapore | 83 | 0.0% |
| Somalia | 27 | 0.0% |
| South Africa | 173 | 0.0% |
| South America | 6,499 | 0.4% |
| South Central Asia | 9,852 | 0.6% |
| South Eastern Asia | 6,464 | 0.4% |
| Southern Europe | 1,097 | 0.1% |
| Spain | 362 | 0.0% |
| Sri Lanka | 57 | 0.0% |
| Sudan | 45 | 0.0% |
| Sweden | 213 | 0.0% |
| Switzerland | 98 | 0.0% |
| Syria | 63 | 0.0% |
| Taiwan | 164 | 0.0% |
| Thailand | 347 | 0.0% |
| Trinidad and Tobago | 232 | 0.0% |
| Turkey | 82 | 0.0% |
| Uganda | 180 | 0.0% |
| Ukraine | 292 | 0.0% |
| Uruguay | 31 | 0.0% |
| Uzbekistan | 147 | 0.0% |
| Venezuela | 951 | 0.1% |
| Vietnam | 1,712 | 0.1% |
| West Indies | 13 | 0.0% |
| Western Africa | 1,732 | 0.1% |
| Western Asia | 1,756 | 0.1% |
| Western Europe | 4,022 | 0.2% |
| Yemen | 155 | 0.0% |
| Zaire | 55 | 0.0% |
| Zimbabwe | 12 | 0.0% | View All 133 Rows |
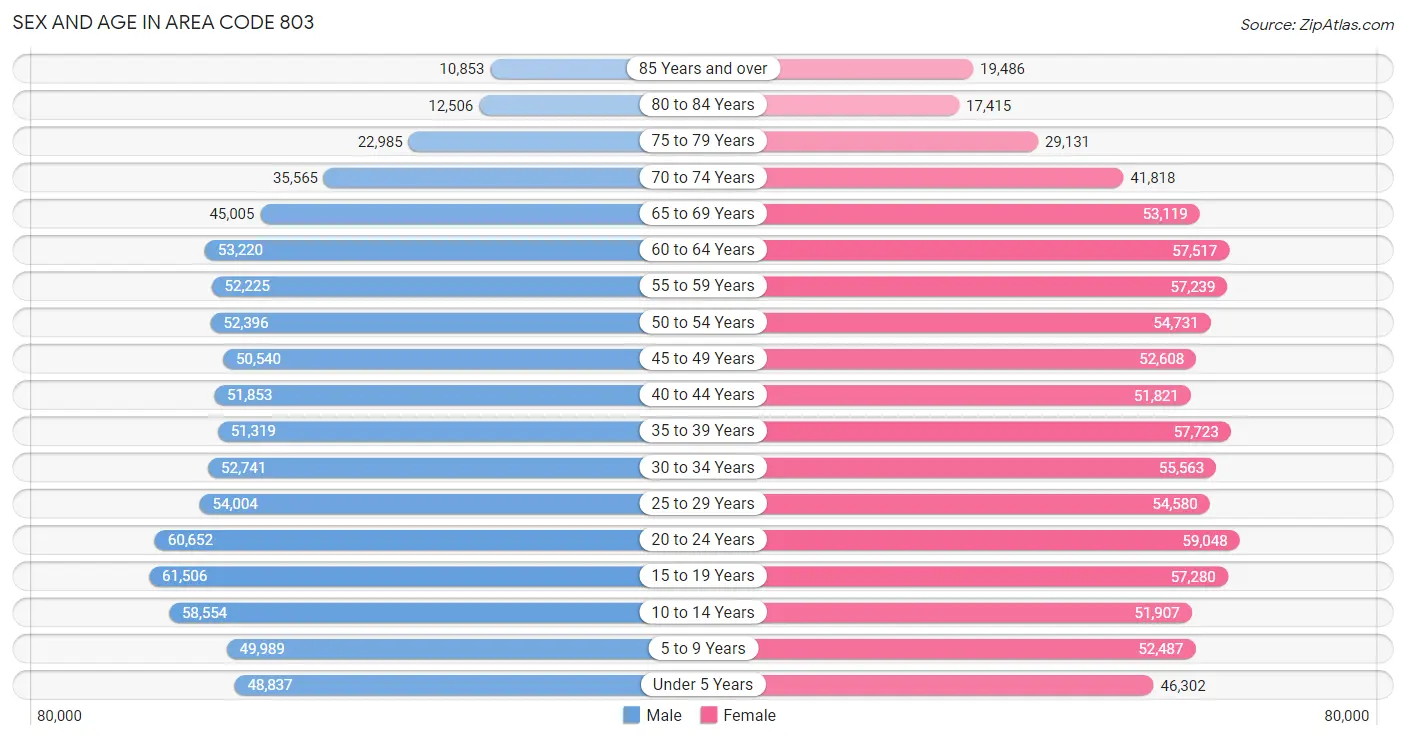
Sex and Age in Area Code 803
Sex and Age in Area Code 803
The most populous age groups in Area Code 803 are 15 to 19 Years (61,506 | 7.5%) for men and 20 to 24 Years (59,048 | 6.8%) for women.
| Age Bracket | Male | Female |
| Under 5 Years | 48,837 (5.9%) | 46,302 (5.3%) |
| 5 to 9 Years | 49,989 (6.1%) | 52,487 (6.0%) |
| 10 to 14 Years | 58,554 (7.1%) | 51,907 (6.0%) |
| 15 to 19 Years | 61,506 (7.5%) | 57,280 (6.6%) |
| 20 to 24 Years | 60,652 (7.3%) | 59,048 (6.8%) |
| 25 to 29 Years | 54,004 (6.6%) | 54,580 (6.3%) |
| 30 to 34 Years | 52,741 (6.4%) | 55,563 (6.4%) |
| 35 to 39 Years | 51,319 (6.2%) | 57,723 (6.6%) |
| 40 to 44 Years | 51,853 (6.3%) | 51,821 (6.0%) |
| 45 to 49 Years | 50,540 (6.1%) | 52,608 (6.0%) |
| 50 to 54 Years | 52,396 (6.4%) | 54,731 (6.3%) |
| 55 to 59 Years | 52,225 (6.3%) | 57,239 (6.6%) |
| 60 to 64 Years | 53,220 (6.5%) | 57,517 (6.6%) |
| 65 to 69 Years | 45,005 (5.5%) | 53,119 (6.1%) |
| 70 to 74 Years | 35,565 (4.3%) | 41,818 (4.8%) |
| 75 to 79 Years | 22,985 (2.8%) | 29,131 (3.4%) |
| 80 to 84 Years | 12,506 (1.5%) | 17,415 (2.0%) |
| 85 Years and over | 10,853 (1.3%) | 19,486 (2.2%) |
| Total | 824,750 (100.0%) | 869,775 (100.0%) |
Families and Households in Area Code 803
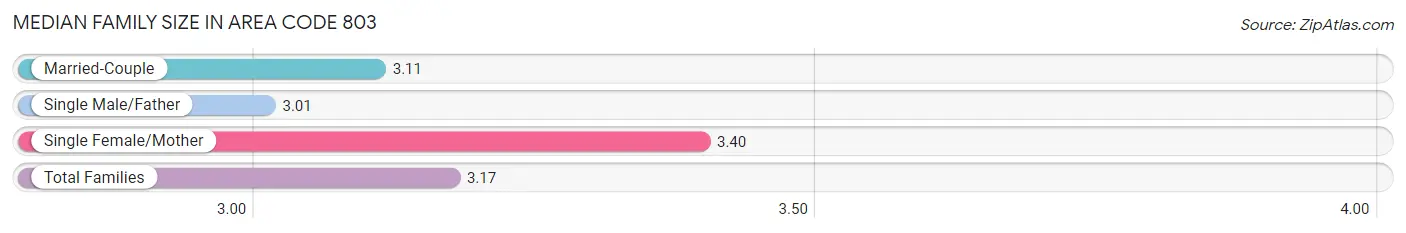
Median Family Size in Area Code 803
The median family size in Area Code 803 is 3.17 persons per family, with single female/mother families (98,884 | 22.9%) accounting for the largest median family size of 3.39643 persons per family. On the other hand, single male/father families (29,610 | 6.9%) represent the smallest median family size with 3.01 persons per family.
| Family Type | # Families | Family Size |
| Married-Couple | 303,433 (70.3%) | 3.11 |
| Single Male/Father | 29,610 (6.9%) | 3.01 |
| Single Female/Mother | 98,884 (22.9%) | 3.40 |
| Total Families | 431,927 (100.0%) | 3.17 |
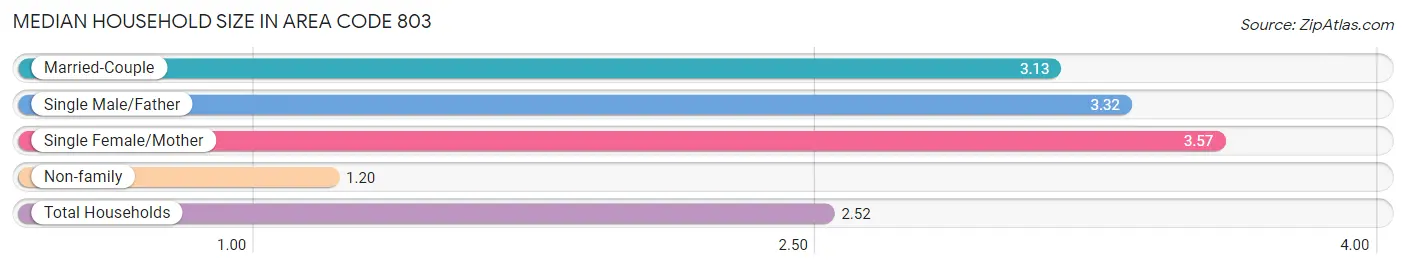
Median Household Size in Area Code 803
The median household size in Area Code 803 is 2.52 persons per household, with single female/mother households (98,884 | 14.9%) accounting for the largest median household size of 3.56713 persons per household. non-family households (233,634 | 35.1%) represent the smallest median household size with 1.20 persons per household.
| Household Type | # Households | Household Size |
| Married-Couple | 303,433 (45.6%) | 3.13 |
| Single Male/Father | 29,610 (4.4%) | 3.32 |
| Single Female/Mother | 98,884 (14.9%) | 3.57 |
| Non-family | 233,634 (35.1%) | 1.20 |
| Total Households | 665,561 (100.0%) | 2.52 |
Household Size by Marriage Status in Area Code 803
Out of a total of 665,561 households in Area Code 803, 431,927 (64.9%) are family households, while 233,634 (35.1%) are nonfamily households. The most numerous type of family households are 2-person households, comprising 202,963, and the most common type of nonfamily households are 1-person households, comprising 196,818.
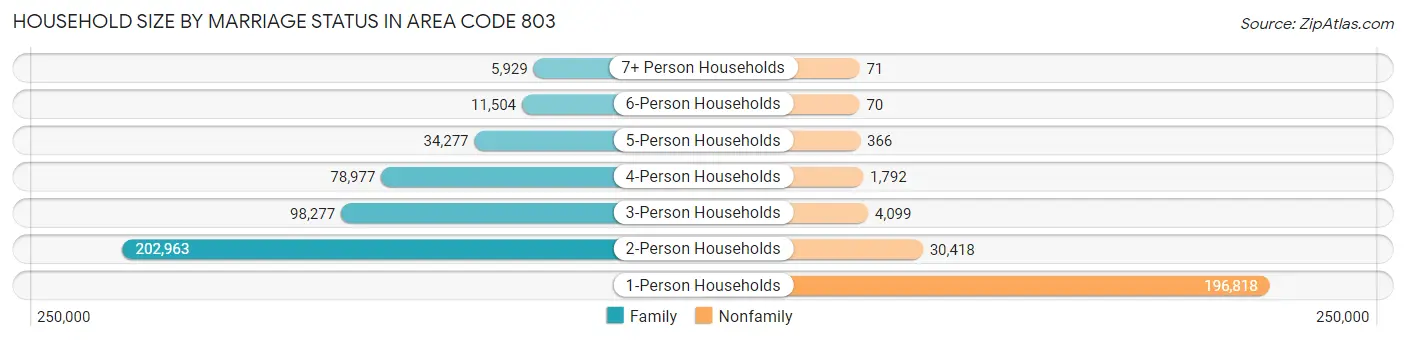
| Household Size | Family Households | Nonfamily Households |
| 1-Person Households | - | 196,818 (29.6%) |
| 2-Person Households | 202,963 (30.5%) | 30,418 (4.6%) |
| 3-Person Households | 98,277 (14.8%) | 4,099 (0.6%) |
| 4-Person Households | 78,977 (11.9%) | 1,792 (0.3%) |
| 5-Person Households | 34,277 (5.1%) | 366 (0.1%) |
| 6-Person Households | 11,504 (1.7%) | 70 (0.0%) |
| 7+ Person Households | 5,929 (0.9%) | 71 (0.0%) |
| Total | 431,927 (64.9%) | 233,634 (35.1%) |
Female Fertility in Area Code 803
Fertility by Age in Area Code 803
Average fertility rate in Area Code 803 is 69.2 births per 1,000 women. Women in the age bracket of 20 to 34 years have the highest fertility rate with 132.3 births per 1,000 women. Women in the age bracket of 20 to 34 years acount for 75.3% of all women with births.
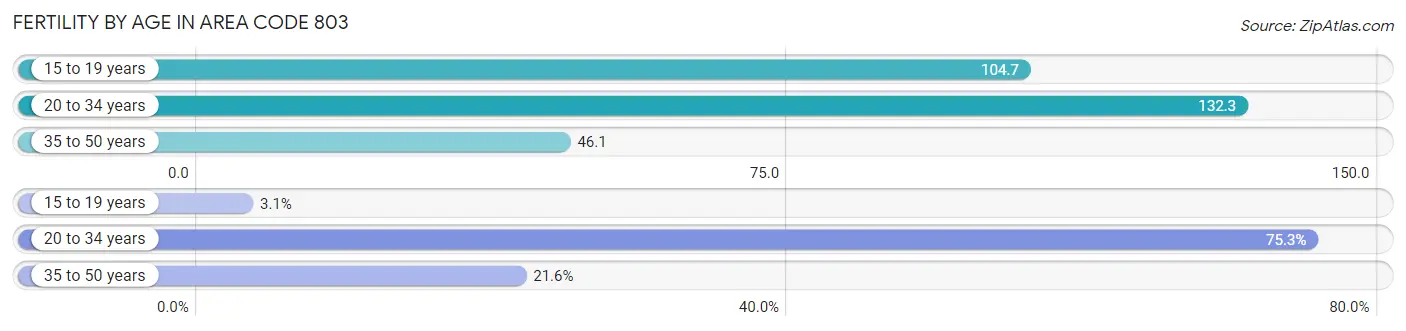
| Age Bracket | Women with Births | Births / 1,000 Women |
| 15 to 19 years | 667 (3.1%) | 104.7 |
| 20 to 34 years | 16,409 (75.3%) | 132.3 |
| 35 to 50 years | 4,706 (21.6%) | 46.1 |
| Total | 21,782 (100.0%) | 69.2 |
Fertility by Age by Marriage Status in Area Code 803
45.1% of women with births (21,782) in Area Code 803 are married. The highest percentage of unmarried women with births falls into 15 to 19 years age bracket with 97.0% of them unmarried at the time of birth, while the lowest percentage of unmarried women with births belong to 20 to 34 years age bracket with 58.1% of them unmarried.
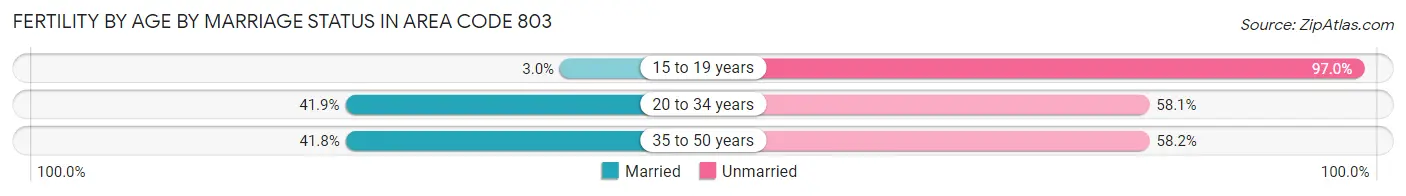
| Age Bracket | Married | Unmarried |
| 15 to 19 years | 20 (3.0%) | 647 (97.0%) |
| 20 to 34 years | 6,873 (41.9%) | 9,536 (58.1%) |
| 35 to 50 years | 1,969 (41.8%) | 2,737 (58.2%) |
| Total | 9,826 (45.1%) | 11,956 (54.9%) |
Fertility by Education in Area Code 803
Average fertility rate in Area Code 803 is 69.2 births per 1,000 women. Women with the education attainment of graduate degree have the highest fertility rate of 135.9 births per 1,000 women, while women with the education attainment of high school diploma have the lowest fertility at 95.9 births per 1,000 women. Women with the education attainment of college or associate's degree represent 37.0% of all women with births.
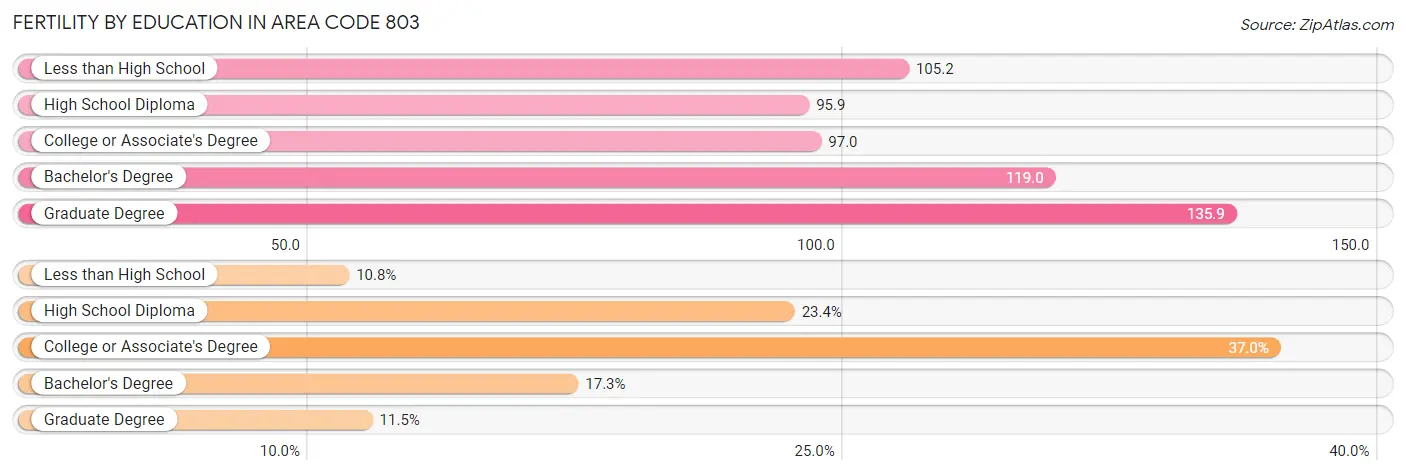
| Educational Attainment | Women with Births | Births / 1,000 Women |
| Less than High School | 2,362 (10.8%) | 105.2 |
| High School Diploma | 5,088 (23.4%) | 95.9 |
| College or Associate's Degree | 8,064 (37.0%) | 97.0 |
| Bachelor's Degree | 3,763 (17.3%) | 119.0 |
| Graduate Degree | 2,505 (11.5%) | 135.9 |
| Total | 21,782 (100.0%) | 69.2 |
Fertility by Education by Marriage Status in Area Code 803
54.9% of women with births in Area Code 803 are unmarried. Women with the educational attainment of graduate degree are most likely to be married with 44.9% of them married at childbirth, while women with the educational attainment of less than high school are least likely to be married with 85.4% of them unmarried at childbirth.
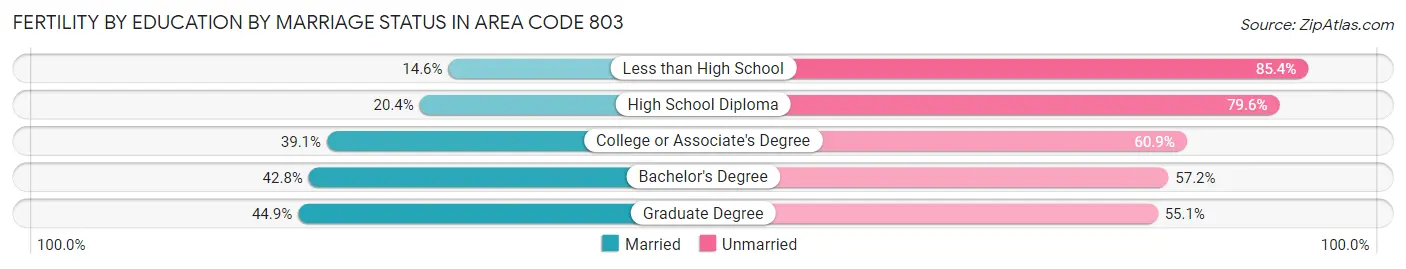
| Educational Attainment | Married | Unmarried |
| Less than High School | 345 (14.6%) | 2,017 (85.4%) |
| High School Diploma | 1,039 (20.4%) | 4,049 (79.6%) |
| College or Associate's Degree | 3,152 (39.1%) | 4,912 (60.9%) |
| Bachelor's Degree | 1,609 (42.8%) | 2,154 (57.2%) |
| Graduate Degree | 1,125 (44.9%) | 1,380 (55.1%) |
| Total | 9,826 (45.1%) | 11,956 (54.9%) |
Employment Characteristics in Area Code 803
Employment by Class of Employer in Area Code 803
Among the 773,615 employed individuals in Area Code 803, private company employees (509,916 | 65.9%), state government employees (58,358 | 7.5%), and local government employees (51,225 | 6.6%) make up the most common classes of employment.
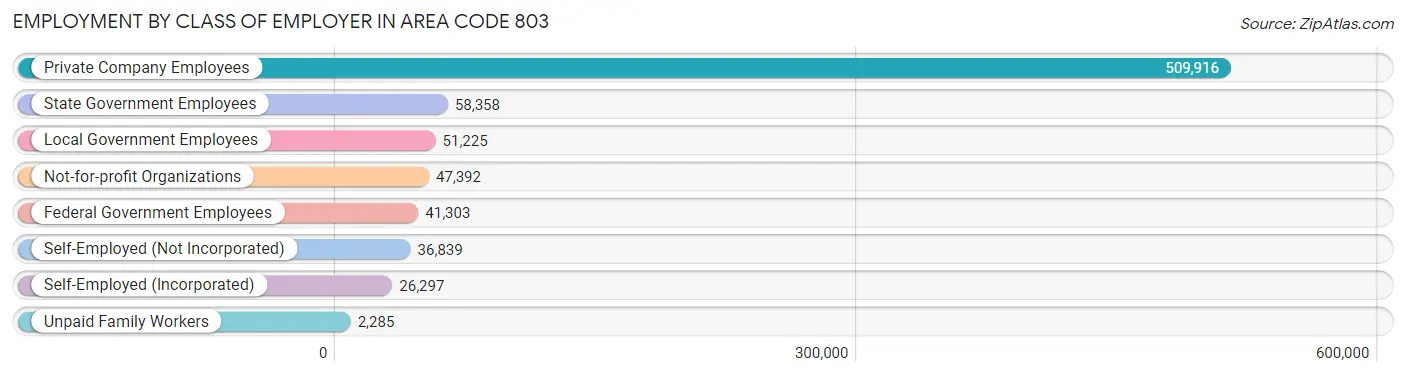
| Employer Class | # Employees | % Employees |
| Private Company Employees | 509,916 | 65.9% |
| Self-Employed (Incorporated) | 26,297 | 3.4% |
| Self-Employed (Not Incorporated) | 36,839 | 4.8% |
| Not-for-profit Organizations | 47,392 | 6.1% |
| Local Government Employees | 51,225 | 6.6% |
| State Government Employees | 58,358 | 7.5% |
| Federal Government Employees | 41,303 | 5.3% |
| Unpaid Family Workers | 2,285 | 0.3% |
| Total | 773,615 | 100.0% |
Employment Status by Age in Area Code 803
According to the labor force statistics for Area Code 803, out of the total population over 16 years of age (1,363,380), 57.1% or 778,217 individuals are in the labor force, with 8.7% or 67,938 of them unemployed. The age group with the highest labor force participation rate is 30 to 34 years, with 82.8% or 89,708 individuals in the labor force. Within the labor force, the 16 to 19 years age range has the highest percentage of unemployed individuals, with 2,471.4% or 943,630 of them being unemployed.
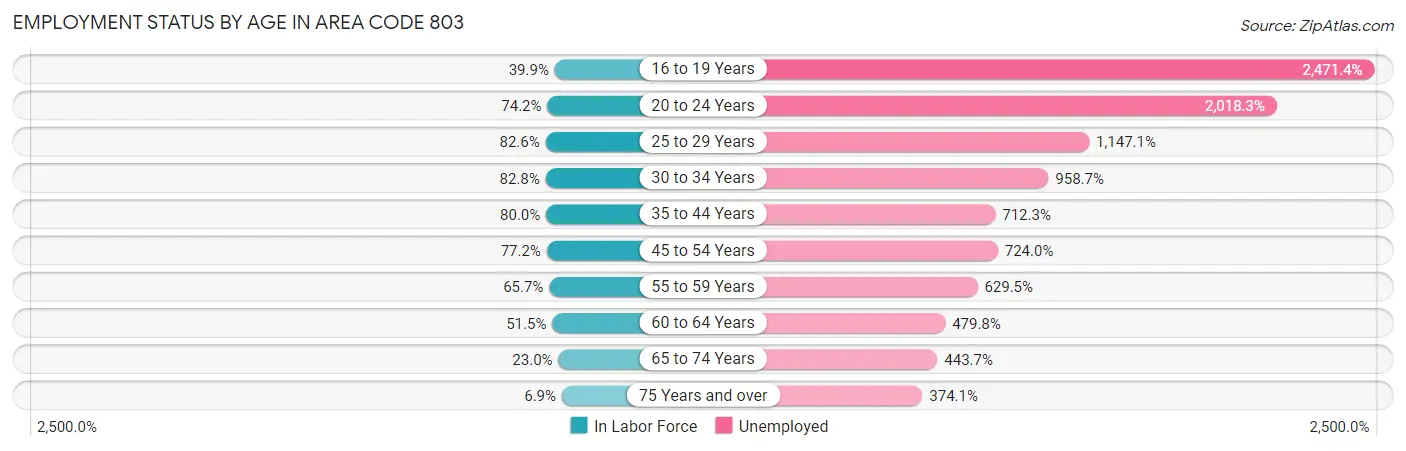
| Age Bracket | In Labor Force | Unemployed |
| 16 to 19 Years | 38,177 (39.9%) | 943,630 (2,471.4%) |
| 20 to 24 Years | 88,765 (74.2%) | 1,791,645 (2,018.3%) |
| 25 to 29 Years | 89,685 (82.6%) | 1,028,719 (1,147.1%) |
| 30 to 34 Years | 89,705 (82.8%) | 860,031 (958.7%) |
| 35 to 44 Years | 170,198 (80.0%) | 1,212,292 (712.3%) |
| 45 to 54 Years | 162,422 (77.2%) | 1,175,892 (724.0%) |
| 55 to 59 Years | 71,912 (65.7%) | 452,655 (629.5%) |
| 60 to 64 Years | 57,064 (51.5%) | 273,788 (479.8%) |
| 65 to 74 Years | 40,376 (23.0%) | 179,184 (443.7%) |
| 75 Years and over | 7,745 (6.9%) | 28,967 (374.1%) |
| Total | 778,282 (57.1%) | 67,970 (8.7%) |
Employment Status by Educational Attainment in Area Code 803
According to labor force statistics for Area Code 803, 73.1% of individuals (628,546) out of the total population between 25 and 64 years of age (860,080) are in the labor force, with 846.4% or 5,320,013 of them being unemployed. The group with the highest labor force participation rate are those with the educational attainment of bachelor's degree or higher, with 84.4% or 232,278 individuals in the labor force. Within the labor force, individuals with less than high school education have the highest percentage of unemployment, with 1,384.1% or 608,644 of them being unemployed.
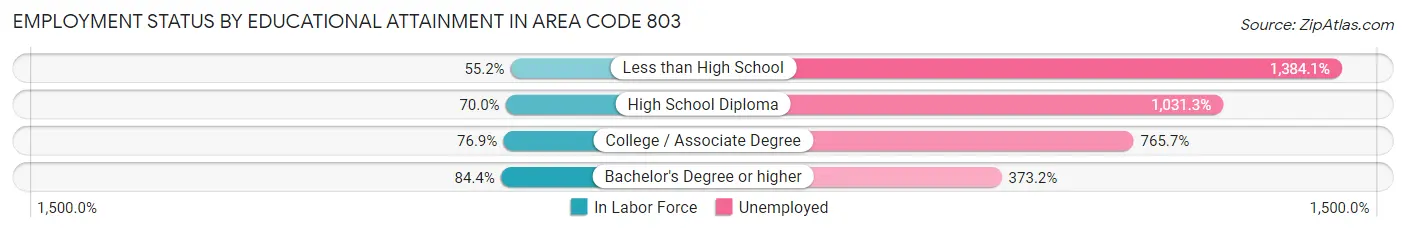
| Educational Attainment | In Labor Force | Unemployed |
| Less than High School | 43,975 (55.2%) | 1,103,211 (1,384.1%) |
| High School Diploma | 162,403 (70.0%) | 2,393,121 (1,031.3%) |
| College / Associate Degree | 210,031 (76.9%) | 2,090,989 (765.7%) |
| Bachelor's Degree or higher | 232,266 (84.4%) | 1,027,207 (373.2%) |
| Total | 628,554 (73.1%) | 7,279,717 (846.4%) |
Employment Occupations by Sex in Area Code 803
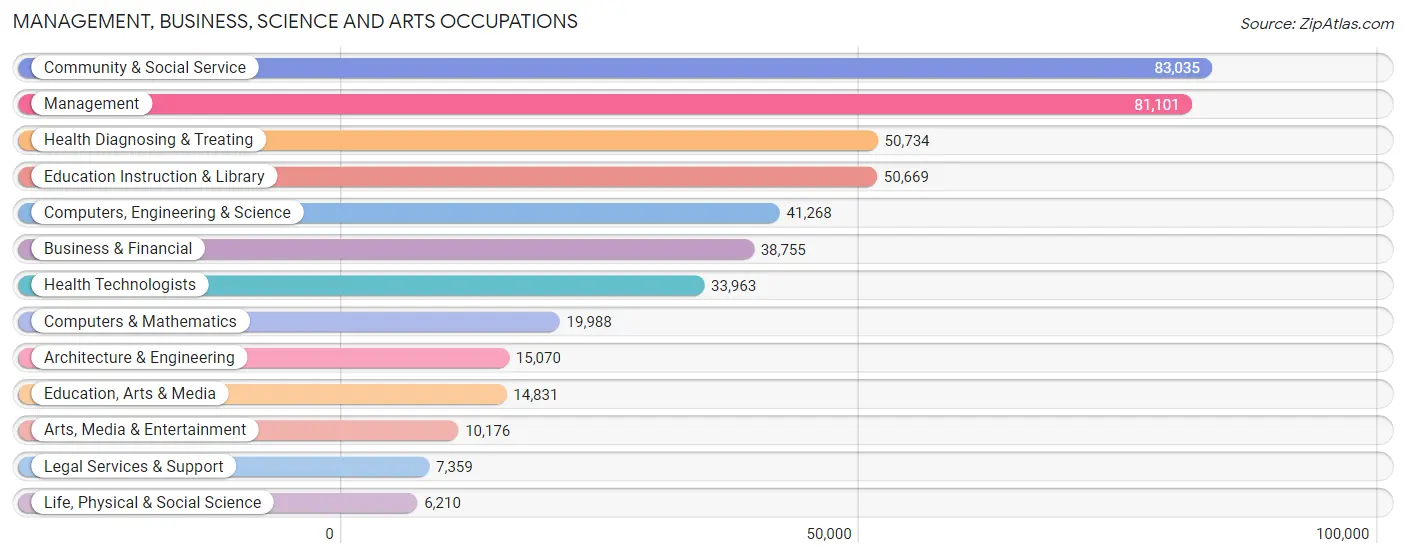
Management, Business, Science and Arts Occupations
The most common Management, Business, Science and Arts occupations in Area Code 803 are Community & Social Service (83,035 | 10.8%), Management (81,101 | 10.5%), Health Diagnosing & Treating (50,734 | 6.6%), Education Instruction & Library (50,669 | 6.6%), and Computers, Engineering & Science (41,268 | 5.3%).
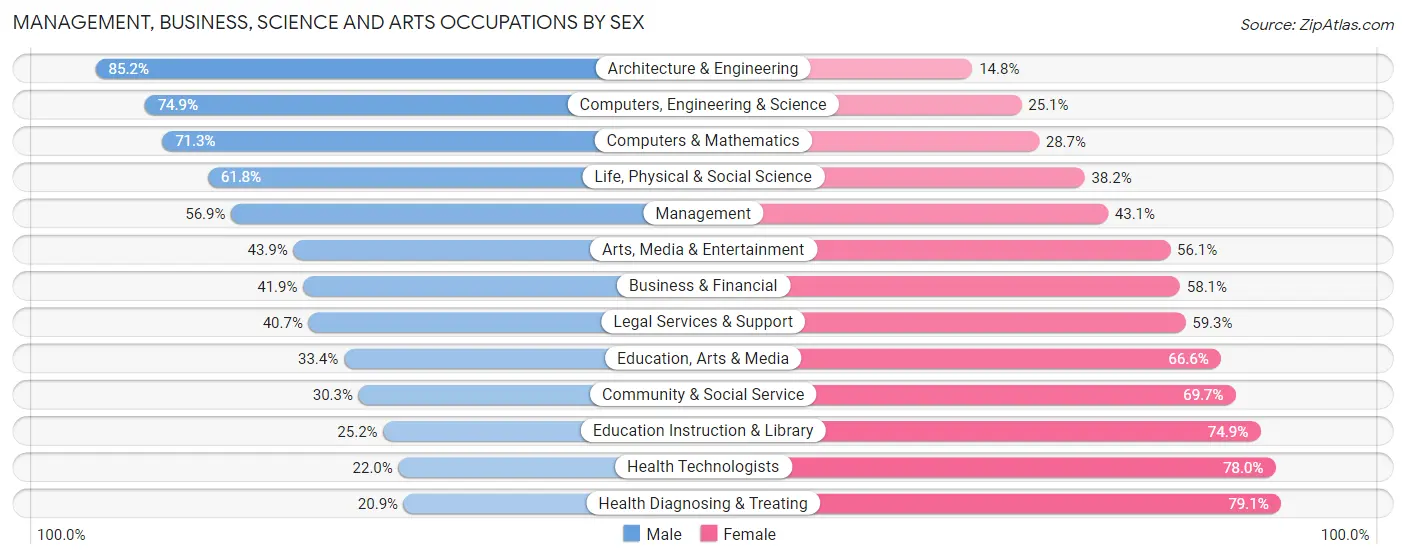
Management, Business, Science and Arts Occupations by Sex
Within the Management, Business, Science and Arts occupations in Area Code 803, the most male-oriented occupations are Architecture & Engineering (85.2%), Computers, Engineering & Science (74.9%), and Computers & Mathematics (71.3%), while the most female-oriented occupations are Health Diagnosing & Treating (79.1%), Health Technologists (78.0%), and Education Instruction & Library (74.9%).
| Occupation | Male | Female |
| Management | 46,133 (56.9%) | 34,968 (43.1%) |
| Business & Financial | 16,221 (41.9%) | 22,534 (58.1%) |
| Computers, Engineering & Science | 30,921 (74.9%) | 10,347 (25.1%) |
| Computers & Mathematics | 14,249 (71.3%) | 5,739 (28.7%) |
| Architecture & Engineering | 12,837 (85.2%) | 2,233 (14.8%) |
| Life, Physical & Social Science | 3,835 (61.8%) | 2,375 (38.2%) |
| Community & Social Service | 25,153 (30.3%) | 57,882 (69.7%) |
| Education, Arts & Media | 4,947 (33.4%) | 9,884 (66.6%) |
| Legal Services & Support | 2,997 (40.7%) | 4,362 (59.3%) |
| Education Instruction & Library | 12,742 (25.2%) | 37,927 (74.9%) |
| Arts, Media & Entertainment | 4,467 (43.9%) | 5,709 (56.1%) |
| Health Diagnosing & Treating | 10,593 (20.9%) | 40,141 (79.1%) |
| Health Technologists | 7,466 (22.0%) | 26,497 (78.0%) |
| Total (Category) | 129,021 (43.8%) | 165,872 (56.2%) |
| Total (Overall) | 392,472 (50.9%) | 378,407 (49.1%) |
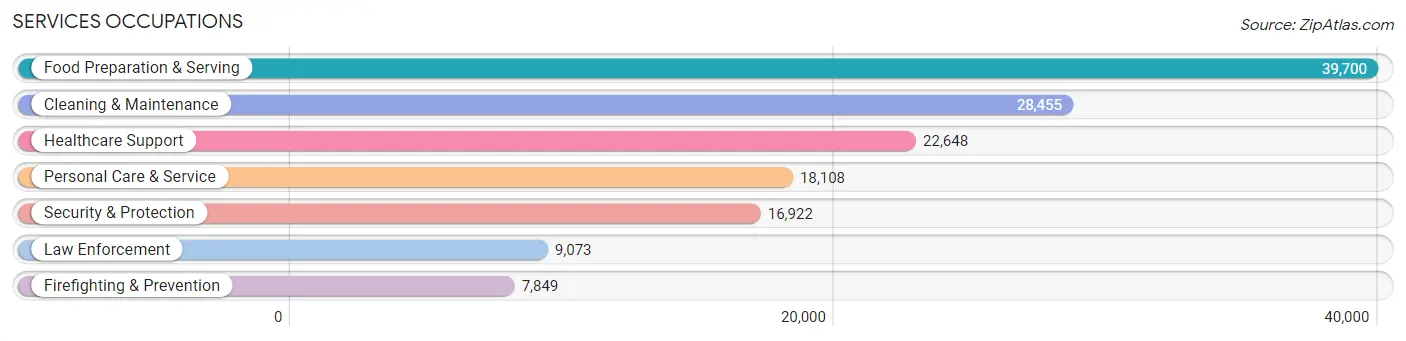
Services Occupations
The most common Services occupations in Area Code 803 are Food Preparation & Serving (39,700 | 5.1%), Cleaning & Maintenance (28,455 | 3.7%), Healthcare Support (22,648 | 2.9%), Personal Care & Service (18,108 | 2.4%), and Security & Protection (16,922 | 2.2%).
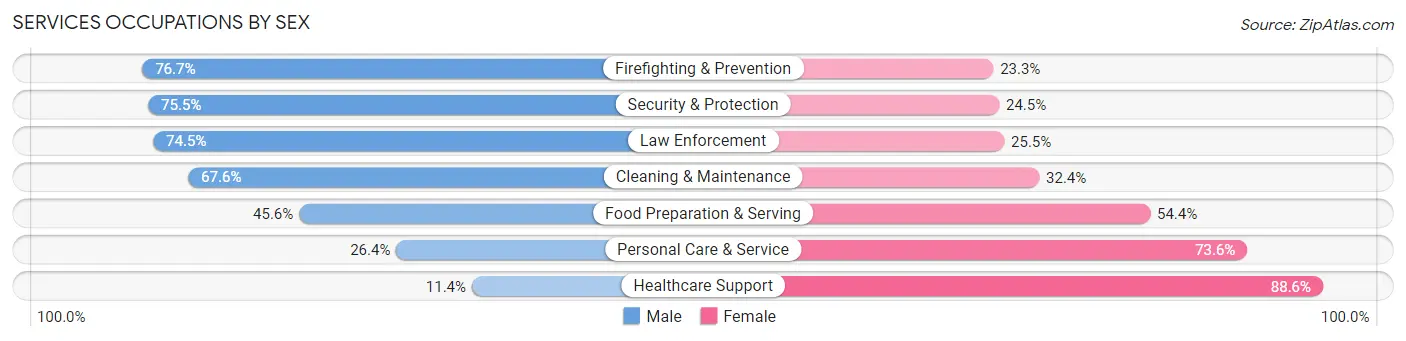
Services Occupations by Sex
Within the Services occupations in Area Code 803, the most male-oriented occupations are Firefighting & Prevention (76.7%), Security & Protection (75.5%), and Law Enforcement (74.5%), while the most female-oriented occupations are Healthcare Support (88.6%), Personal Care & Service (73.6%), and Food Preparation & Serving (54.4%).
| Occupation | Male | Female |
| Healthcare Support | 2,588 (11.4%) | 20,060 (88.6%) |
| Security & Protection | 12,783 (75.5%) | 4,139 (24.5%) |
| Firefighting & Prevention | 6,020 (76.7%) | 1,829 (23.3%) |
| Law Enforcement | 6,763 (74.5%) | 2,310 (25.5%) |
| Food Preparation & Serving | 18,119 (45.6%) | 21,581 (54.4%) |
| Cleaning & Maintenance | 19,239 (67.6%) | 9,216 (32.4%) |
| Personal Care & Service | 4,783 (26.4%) | 13,325 (73.6%) |
| Total (Category) | 57,512 (45.7%) | 68,321 (54.3%) |
| Total (Overall) | 392,472 (50.9%) | 378,407 (49.1%) |
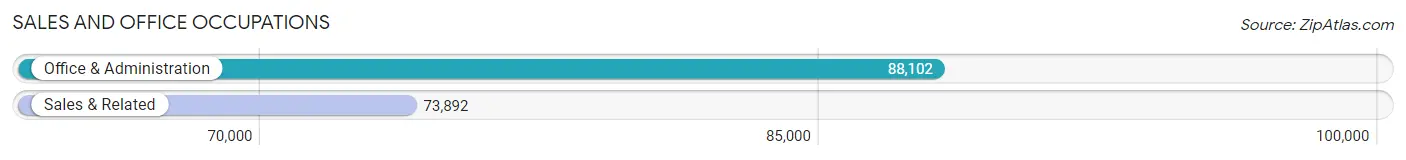
Sales and Office Occupations
The most common Sales and Office occupations in Area Code 803 are Office & Administration (88,102 | 11.4%), and Sales & Related (73,892 | 9.6%).
Sales and Office Occupations by Sex
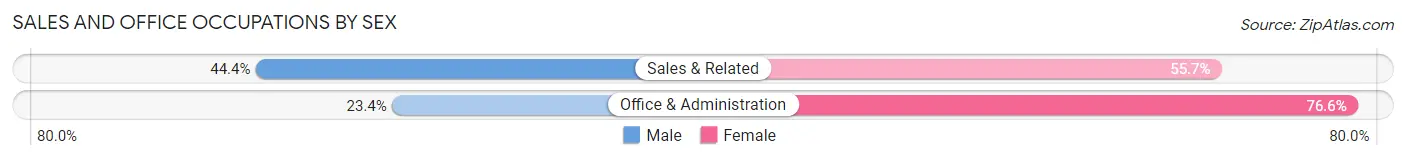
| Occupation | Male | Female |
| Sales & Related | 32,772 (44.4%) | 41,120 (55.6%) |
| Office & Administration | 20,607 (23.4%) | 67,495 (76.6%) |
| Total (Category) | 53,379 (33.0%) | 108,615 (67.0%) |
| Total (Overall) | 392,472 (50.9%) | 378,407 (49.1%) |
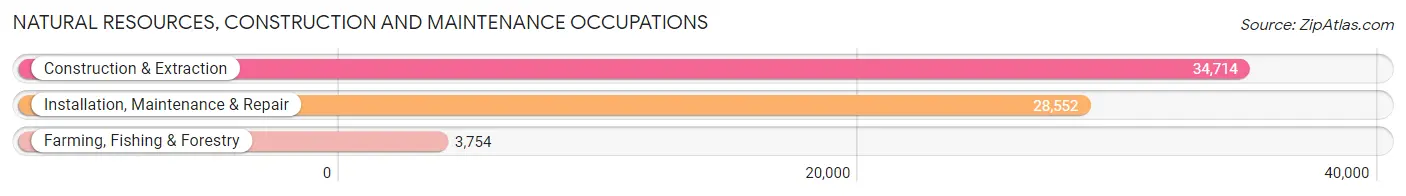
Natural Resources, Construction and Maintenance Occupations
The most common Natural Resources, Construction and Maintenance occupations in Area Code 803 are Construction & Extraction (34,714 | 4.5%), Installation, Maintenance & Repair (28,552 | 3.7%), and Farming, Fishing & Forestry (3,754 | 0.5%).
Natural Resources, Construction and Maintenance Occupations by Sex
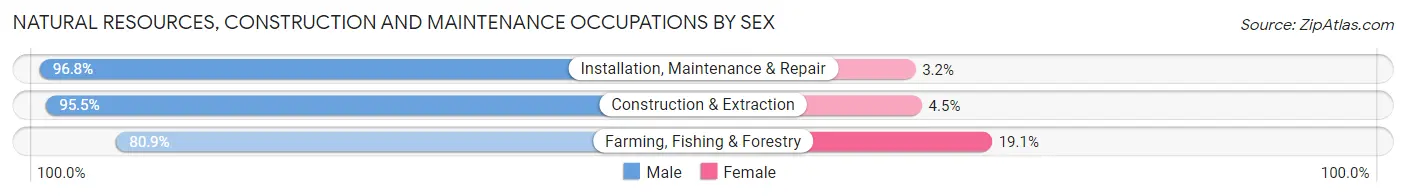
| Occupation | Male | Female |
| Farming, Fishing & Forestry | 3,037 (80.9%) | 717 (19.1%) |
| Construction & Extraction | 33,146 (95.5%) | 1,568 (4.5%) |
| Installation, Maintenance & Repair | 27,644 (96.8%) | 908 (3.2%) |
| Total (Category) | 63,827 (95.2%) | 3,193 (4.8%) |
| Total (Overall) | 392,472 (50.9%) | 378,407 (49.1%) |
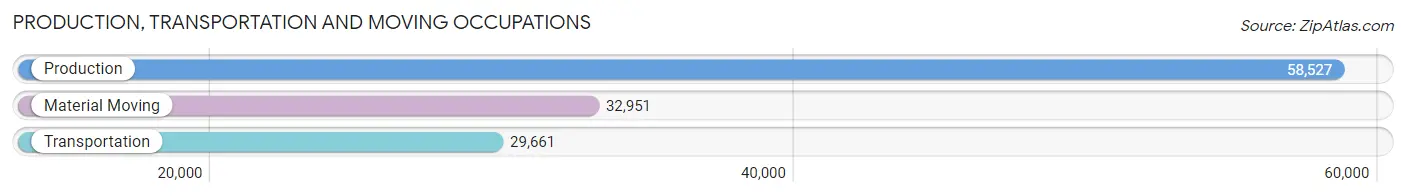
Production, Transportation and Moving Occupations
The most common Production, Transportation and Moving occupations in Area Code 803 are Production (58,527 | 7.6%), Material Moving (32,951 | 4.3%), and Transportation (29,661 | 3.8%).
Production, Transportation and Moving Occupations by Sex
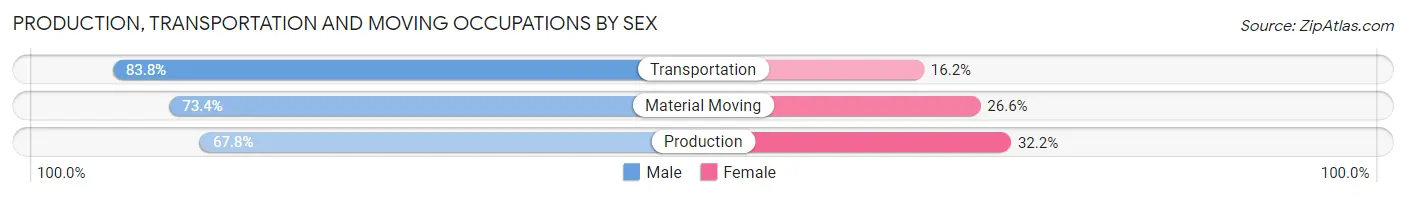
| Occupation | Male | Female |
| Production | 39,689 (67.8%) | 18,838 (32.2%) |
| Transportation | 24,852 (83.8%) | 4,809 (16.2%) |
| Material Moving | 24,192 (73.4%) | 8,759 (26.6%) |
| Total (Category) | 88,733 (73.3%) | 32,406 (26.8%) |
| Total (Overall) | 392,472 (50.9%) | 378,407 (49.1%) |
Employment Industries by Sex in Area Code 803
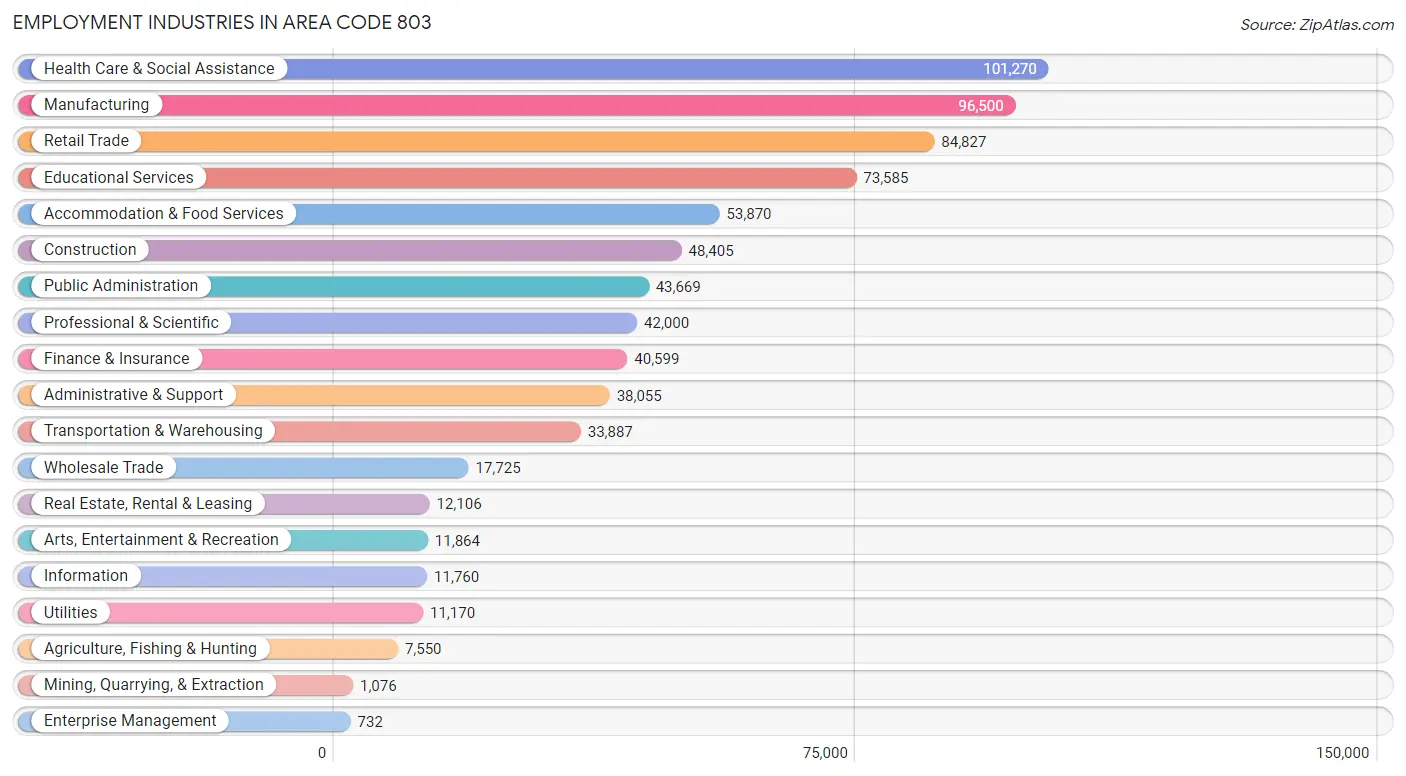
Employment Industries in Area Code 803
The major employment industries in Area Code 803 include Health Care & Social Assistance (101,270 | 13.1%), Manufacturing (96,500 | 12.5%), Retail Trade (84,827 | 11.0%), Educational Services (73,585 | 9.6%), and Accommodation & Food Services (53,870 | 7.0%).
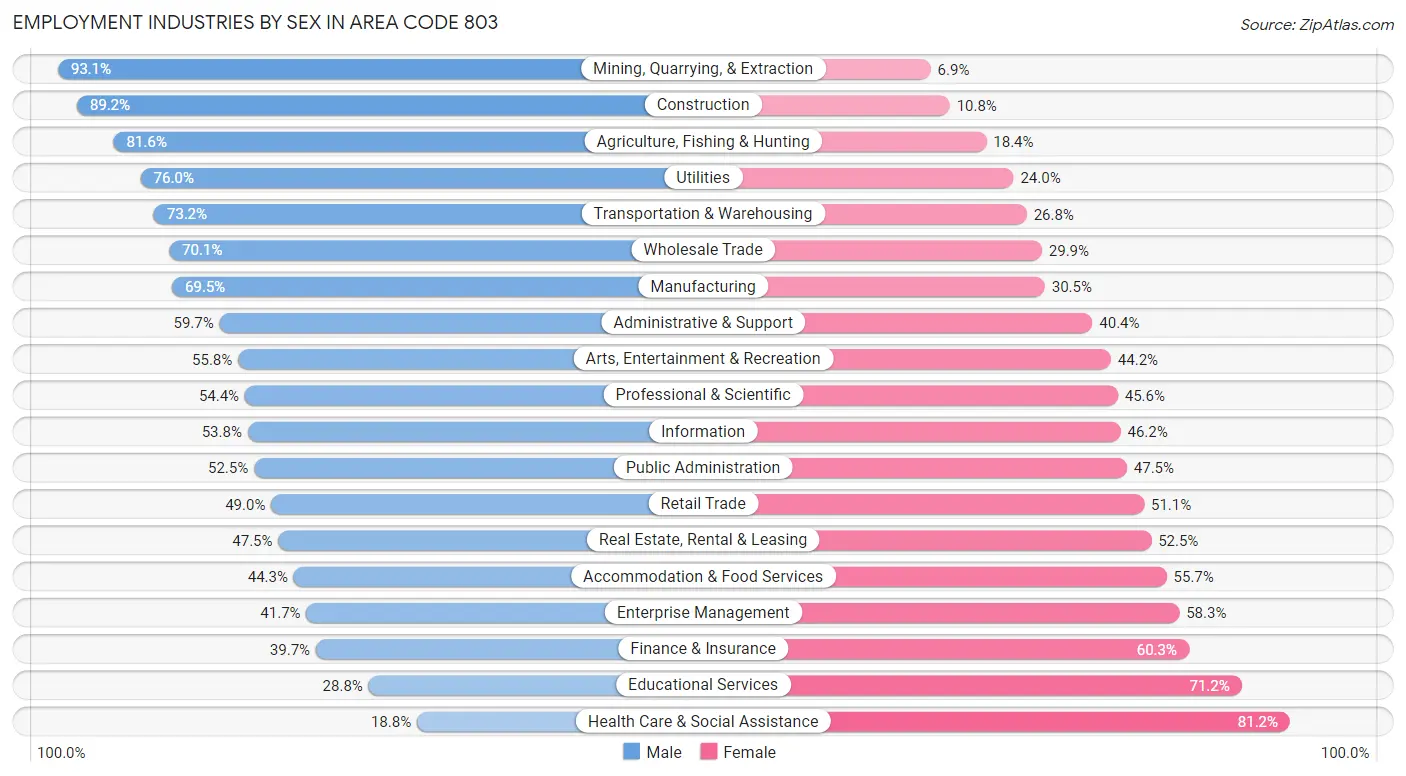
Employment Industries by Sex in Area Code 803
The Area Code 803 industries that see more men than women are Mining, Quarrying, & Extraction (93.1%), Construction (89.2%), and Agriculture, Fishing & Hunting (81.6%), whereas the industries that tend to have a higher number of women are Health Care & Social Assistance (81.2%), Educational Services (71.2%), and Finance & Insurance (60.3%).
| Industry | Male | Female |
| Agriculture, Fishing & Hunting | 6,160 (81.6%) | 1,390 (18.4%) |
| Mining, Quarrying, & Extraction | 1,002 (93.1%) | 74 (6.9%) |
| Construction | 43,166 (89.2%) | 5,239 (10.8%) |
| Manufacturing | 67,062 (69.5%) | 29,438 (30.5%) |
| Wholesale Trade | 12,425 (70.1%) | 5,300 (29.9%) |
| Retail Trade | 41,527 (48.9%) | 43,300 (51.0%) |
| Transportation & Warehousing | 24,818 (73.2%) | 9,069 (26.8%) |
| Utilities | 8,487 (76.0%) | 2,683 (24.0%) |
| Information | 6,329 (53.8%) | 5,431 (46.2%) |
| Finance & Insurance | 16,116 (39.7%) | 24,483 (60.3%) |
| Real Estate, Rental & Leasing | 5,747 (47.5%) | 6,359 (52.5%) |
| Professional & Scientific | 22,842 (54.4%) | 19,158 (45.6%) |
| Enterprise Management | 305 (41.7%) | 427 (58.3%) |
| Administrative & Support | 22,700 (59.7%) | 15,355 (40.4%) |
| Educational Services | 21,177 (28.8%) | 52,408 (71.2%) |
| Health Care & Social Assistance | 19,021 (18.8%) | 82,249 (81.2%) |
| Arts, Entertainment & Recreation | 6,621 (55.8%) | 5,243 (44.2%) |
| Accommodation & Food Services | 23,852 (44.3%) | 30,018 (55.7%) |
| Public Administration | 22,931 (52.5%) | 20,738 (47.5%) |
| Total | 392,472 (50.9%) | 378,407 (49.1%) |
Education in Area Code 803
School Enrollment in Area Code 803
The most common levels of schooling among the 406,039 students in Area Code 803 are high school (87,797 | 21.6%), middle school (87,211 | 21.5%), and college / undergraduate (86,199 | 21.2%).
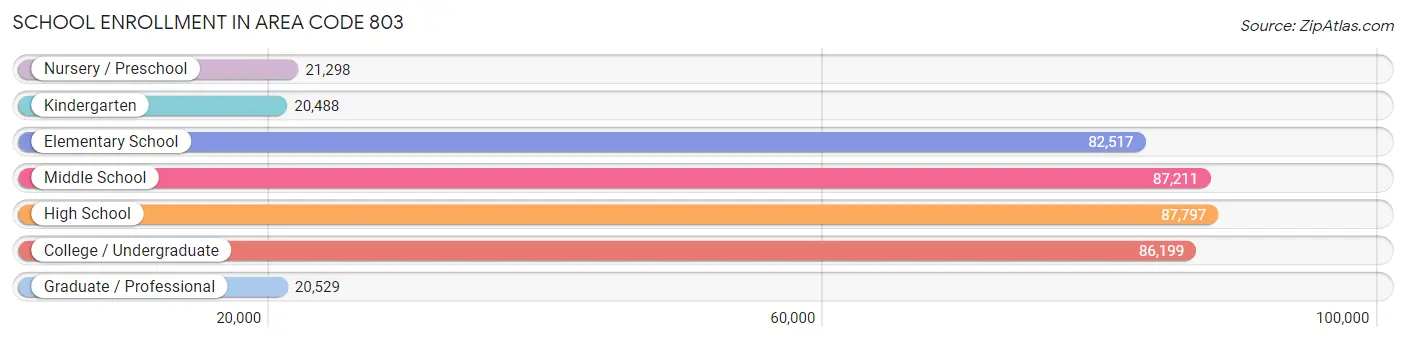
| School Level | # Students | % Students |
| Nursery / Preschool | 21,298 | 5.2% |
| Kindergarten | 20,488 | 5.1% |
| Elementary School | 82,517 | 20.3% |
| Middle School | 87,211 | 21.5% |
| High School | 87,797 | 21.6% |
| College / Undergraduate | 86,199 | 21.2% |
| Graduate / Professional | 20,529 | 5.1% |
| Total | 406,039 | 100.0% |
School Enrollment by Age by Funding Source in Area Code 803
Out of a total of 406,039 students who are enrolled in schools in Area Code 803, 58,253 (14.3%) attend a private institution, while the remaining 347,786 (85.7%) are enrolled in public schools. The age group of 3 to 4 year olds has the highest likelihood of being enrolled in private schools, with 7,359 (40.3% in the age bracket) enrolled. Conversely, the age group of 15 to 17 year olds has the lowest likelihood of being enrolled in a private school, with 56,847 (89.9% in the age bracket) attending a public institution.
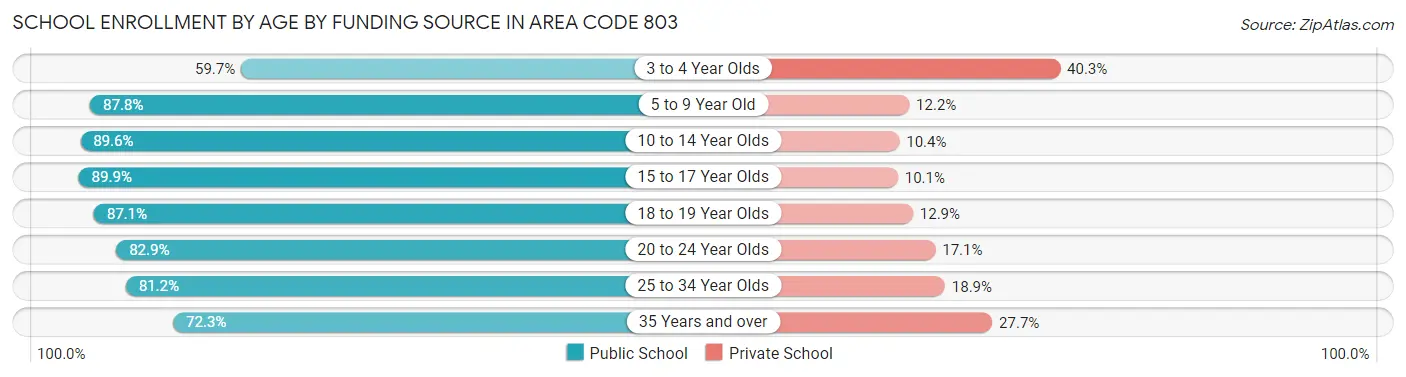
| Age Bracket | Public School | Private School |
| 3 to 4 Year Olds | 10,897 (59.7%) | 7,359 (40.3%) |
| 5 to 9 Year Old | 84,567 (87.8%) | 11,746 (12.2%) |
| 10 to 14 Year Olds | 96,499 (89.6%) | 11,156 (10.4%) |
| 15 to 17 Year Olds | 56,847 (89.9%) | 6,374 (10.1%) |
| 18 to 19 Year Olds | 31,242 (87.1%) | 4,624 (12.9%) |
| 20 to 24 Year Olds | 36,291 (82.9%) | 7,469 (17.1%) |
| 25 to 34 Year Olds | 16,710 (81.1%) | 3,882 (18.9%) |
| 35 Years and over | 14,739 (72.3%) | 5,637 (27.7%) |
| Total | 347,786 (85.7%) | 58,253 (14.3%) |
Educational Attainment by Field of Study in Area Code 803
Business (86,437 | 23.0%), education (50,024 | 13.3%), science & technology (37,203 | 9.9%), arts & humanities (25,840 | 6.9%), and social sciences (24,601 | 6.5%) are the most common fields of study among 376,032 individuals in Area Code 803 who have obtained a bachelor's degree or higher.
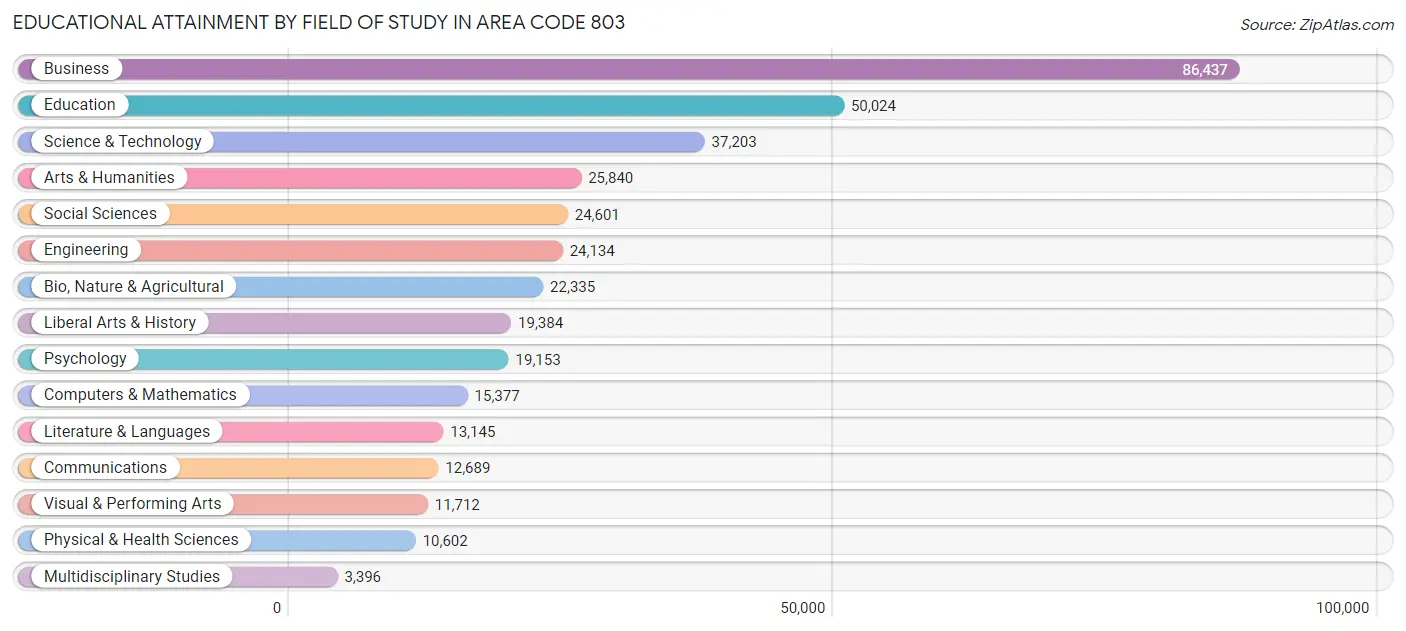
| Field of Study | # Graduates | % Graduates |
| Computers & Mathematics | 15,377 | 4.1% |
| Bio, Nature & Agricultural | 22,335 | 5.9% |
| Physical & Health Sciences | 10,602 | 2.8% |
| Psychology | 19,153 | 5.1% |
| Social Sciences | 24,601 | 6.5% |
| Engineering | 24,134 | 6.4% |
| Multidisciplinary Studies | 3,396 | 0.9% |
| Science & Technology | 37,203 | 9.9% |
| Business | 86,437 | 23.0% |
| Education | 50,024 | 13.3% |
| Literature & Languages | 13,145 | 3.5% |
| Liberal Arts & History | 19,384 | 5.1% |
| Visual & Performing Arts | 11,712 | 3.1% |
| Communications | 12,689 | 3.4% |
| Arts & Humanities | 25,840 | 6.9% |
| Total | 376,032 | 100.0% |
Transportation & Commute in Area Code 803
Vehicle Availability by Sex in Area Code 803
The most prevalent vehicle ownership categories in Area Code 803 are males with 2 vehicles (164,603, accounting for 42.2%) and females with 2 vehicles (145,267, making up 44.9%).
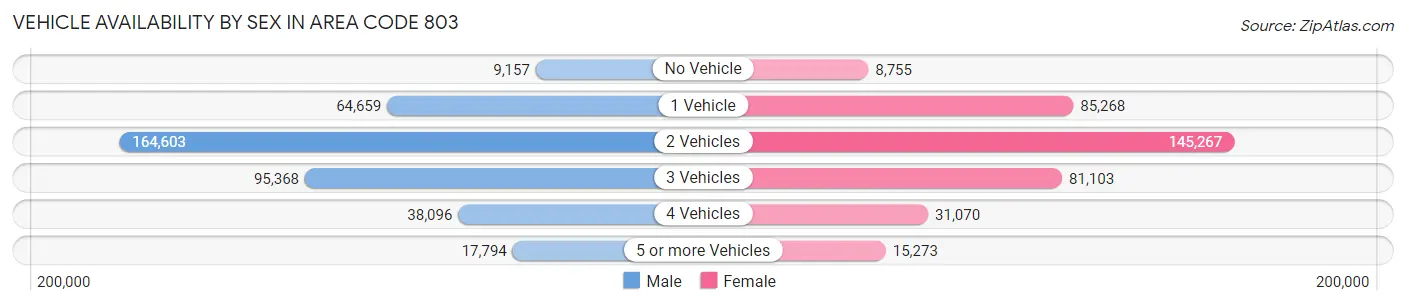
| Vehicles Available | Male | Female |
| No Vehicle | 9,157 (2.4%) | 8,755 (2.4%) |
| 1 Vehicle | 64,659 (16.6%) | 85,268 (23.3%) |
| 2 Vehicles | 164,603 (42.2%) | 145,267 (39.6%) |
| 3 Vehicles | 95,368 (24.5%) | 81,103 (22.1%) |
| 4 Vehicles | 38,096 (9.8%) | 31,070 (8.5%) |
| 5 or more Vehicles | 17,794 (4.6%) | 15,273 (4.2%) |
| Total | 389,677 (100.0%) | 366,736 (100.0%) |
Commute Time in Area Code 803
The most frequently occuring commute durations in Area Code 803 are 15 to 19 minutes (112,422 commuters, 15.9%), 20 to 24 minutes (106,597 commuters, 15.1%), and 30 to 34 minutes (100,877 commuters, 14.3%).
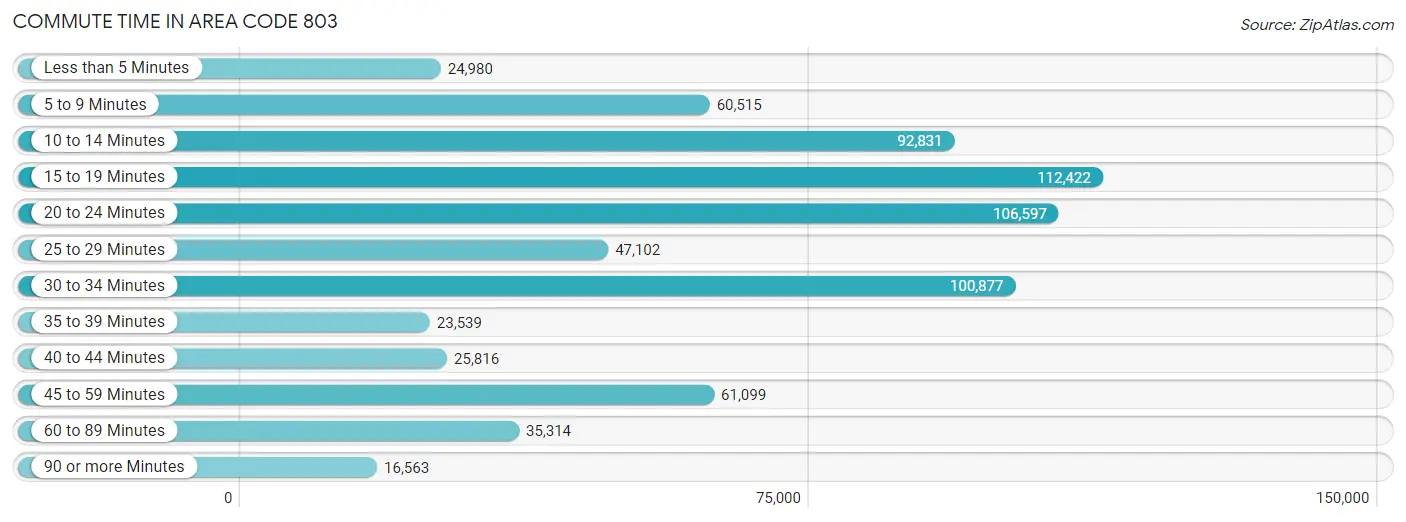
| Commute Time | # Commuters | % Commuters |
| Less than 5 Minutes | 24,980 | 3.5% |
| 5 to 9 Minutes | 60,515 | 8.6% |
| 10 to 14 Minutes | 92,831 | 13.1% |
| 15 to 19 Minutes | 112,422 | 15.9% |
| 20 to 24 Minutes | 106,597 | 15.1% |
| 25 to 29 Minutes | 47,102 | 6.7% |
| 30 to 34 Minutes | 100,877 | 14.3% |
| 35 to 39 Minutes | 23,539 | 3.3% |
| 40 to 44 Minutes | 25,816 | 3.6% |
| 45 to 59 Minutes | 61,099 | 8.6% |
| 60 to 89 Minutes | 35,314 | 5.0% |
| 90 or more Minutes | 16,563 | 2.3% |
Commute Time by Sex in Area Code 803
The most common commute times in Area Code 803 are 20 to 24 minutes (56,031 commuters, 15.2%) for males and 15 to 19 minutes (56,956 commuters, 16.8%) for females.
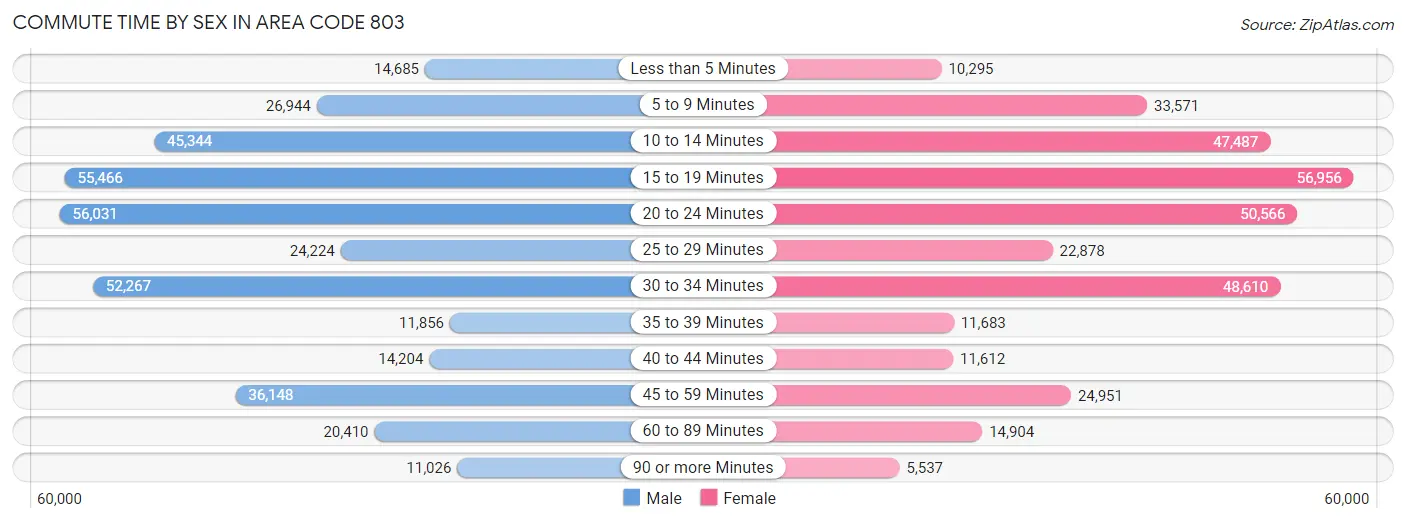
| Commute Time | Male | Female |
| Less than 5 Minutes | 14,685 (4.0%) | 10,295 (3.0%) |
| 5 to 9 Minutes | 26,944 (7.3%) | 33,571 (9.9%) |
| 10 to 14 Minutes | 45,344 (12.3%) | 47,487 (14.0%) |
| 15 to 19 Minutes | 55,466 (15.0%) | 56,956 (16.8%) |
| 20 to 24 Minutes | 56,031 (15.2%) | 50,566 (14.9%) |
| 25 to 29 Minutes | 24,224 (6.6%) | 22,878 (6.8%) |
| 30 to 34 Minutes | 52,267 (14.2%) | 48,610 (14.3%) |
| 35 to 39 Minutes | 11,856 (3.2%) | 11,683 (3.5%) |
| 40 to 44 Minutes | 14,204 (3.8%) | 11,612 (3.4%) |
| 45 to 59 Minutes | 36,148 (9.8%) | 24,951 (7.4%) |
| 60 to 89 Minutes | 20,410 (5.5%) | 14,904 (4.4%) |
| 90 or more Minutes | 11,026 (3.0%) | 5,537 (1.6%) |
Time of Departure to Work by Sex in Area Code 803
The most frequent times of departure to work in Area Code 803 are 7:00 AM to 7:29 AM (53,702, 14.6%) for males and 7:00 AM to 7:29 AM (55,861, 16.5%) for females.
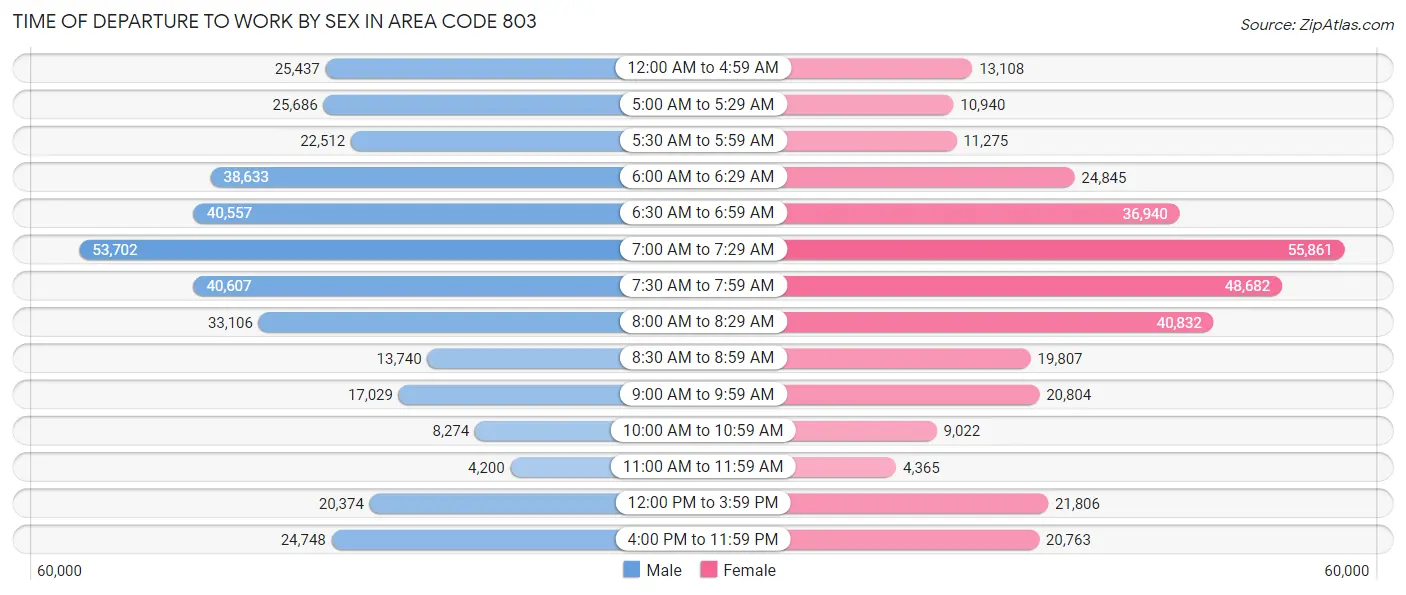
| Time of Departure | Male | Female |
| 12:00 AM to 4:59 AM | 25,437 (6.9%) | 13,108 (3.9%) |
| 5:00 AM to 5:29 AM | 25,686 (7.0%) | 10,940 (3.2%) |
| 5:30 AM to 5:59 AM | 22,512 (6.1%) | 11,275 (3.3%) |
| 6:00 AM to 6:29 AM | 38,633 (10.5%) | 24,845 (7.3%) |
| 6:30 AM to 6:59 AM | 40,557 (11.0%) | 36,940 (10.9%) |
| 7:00 AM to 7:29 AM | 53,702 (14.6%) | 55,861 (16.5%) |
| 7:30 AM to 7:59 AM | 40,607 (11.0%) | 48,682 (14.4%) |
| 8:00 AM to 8:29 AM | 33,106 (9.0%) | 40,832 (12.0%) |
| 8:30 AM to 8:59 AM | 13,740 (3.7%) | 19,807 (5.8%) |
| 9:00 AM to 9:59 AM | 17,029 (4.6%) | 20,804 (6.1%) |
| 10:00 AM to 10:59 AM | 8,274 (2.2%) | 9,022 (2.7%) |
| 11:00 AM to 11:59 AM | 4,200 (1.1%) | 4,365 (1.3%) |
| 12:00 PM to 3:59 PM | 20,374 (5.5%) | 21,806 (6.4%) |
| 4:00 PM to 11:59 PM | 24,748 (6.7%) | 20,763 (6.1%) |
| Total | 368,605 (100.0%) | 339,050 (100.0%) |
Housing Occupancy in Area Code 803
Occupancy by Ownership in Area Code 803
Of the total 665,561 dwellings in Area Code 803, owner-occupied units account for 469,622 (70.6%), while renter-occupied units make up 195,939 (29.4%).
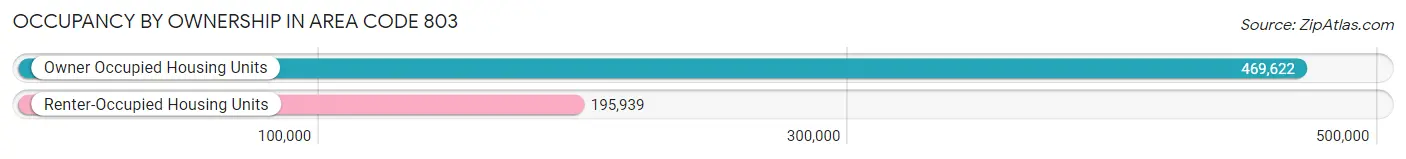
| Occupancy | # Housing Units | % Housing Units |
| Owner Occupied Housing Units | 469,622 | 70.6% |
| Renter-Occupied Housing Units | 195,939 | 29.4% |
| Total Occupied Housing Units | 665,561 | 100.0% |
Occupancy by Household Size in Area Code 803
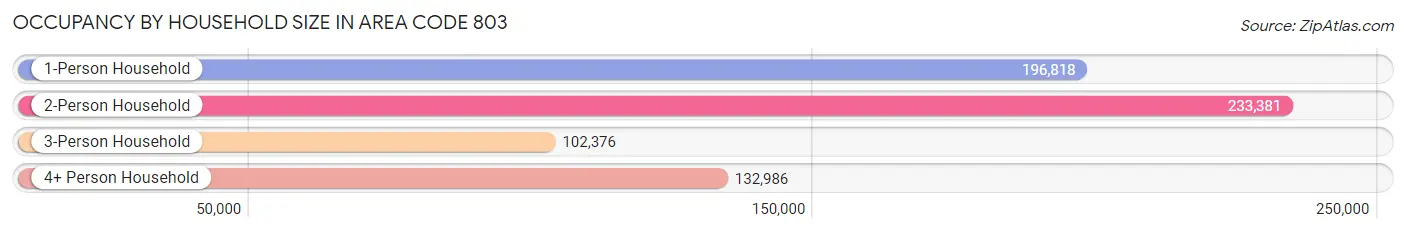
| Household Size | # Housing Units | % Housing Units |
| 1-Person Household | 196,818 | 29.6% |
| 2-Person Household | 233,381 | 35.1% |
| 3-Person Household | 102,376 | 15.4% |
| 4+ Person Household | 132,986 | 20.0% |
| Total Housing Units | 665,561 | 100.0% |
Occupancy by Ownership by Household Size in Area Code 803
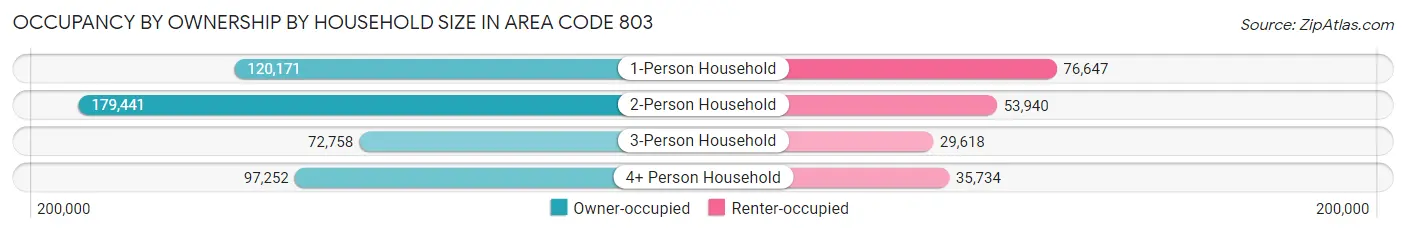
| Household Size | Owner-occupied | Renter-occupied |
| 1-Person Household | 120,171 (61.1%) | 76,647 (38.9%) |
| 2-Person Household | 179,441 (76.9%) | 53,940 (23.1%) |
| 3-Person Household | 72,758 (71.1%) | 29,618 (28.9%) |
| 4+ Person Household | 97,252 (73.1%) | 35,734 (26.9%) |
| Total Housing Units | 469,622 (70.6%) | 195,939 (29.4%) |
Occupancy by Educational Attainment in Area Code 803
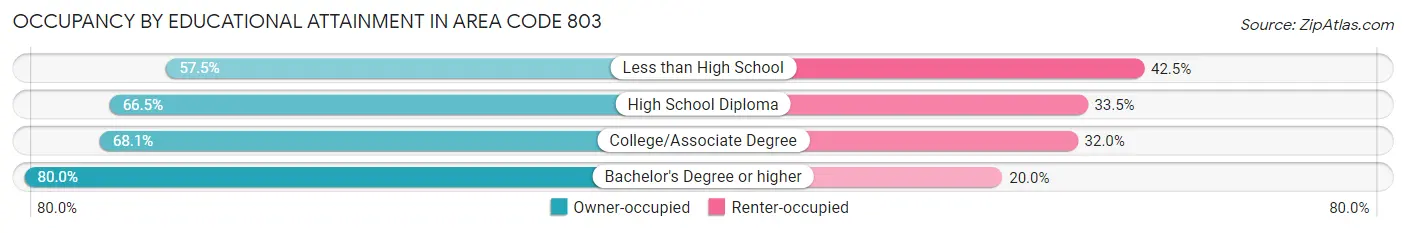
| Household Size | Owner-occupied | Renter-occupied |
| Less than High School | 34,671 (57.5%) | 25,616 (42.5%) |
| High School Diploma | 112,949 (66.5%) | 56,929 (33.5%) |
| College/Associate Degree | 149,740 (68.0%) | 70,294 (32.0%) |
| Bachelor's Degree or higher | 172,262 (80.0%) | 43,100 (20.0%) |
Occupancy by Age of Householder in Area Code 803
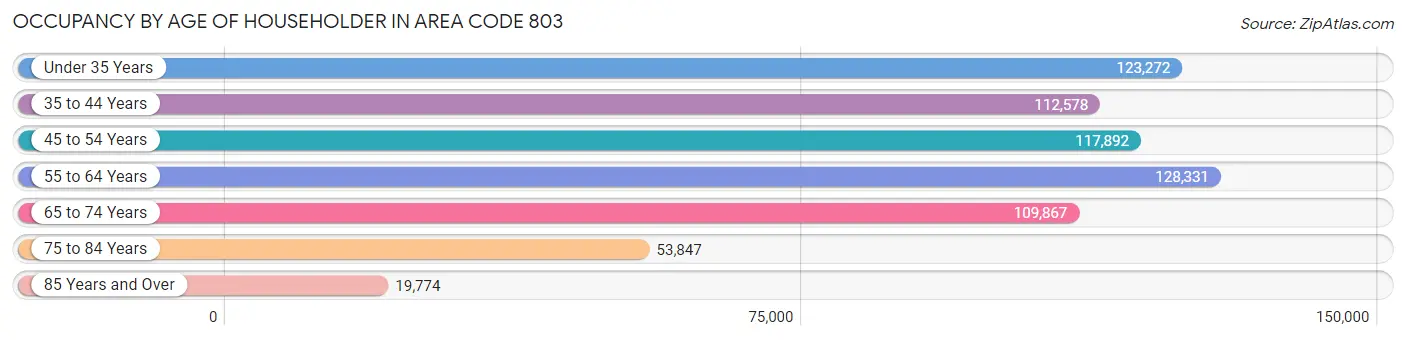
| Age Bracket | # Households | % Households |
| Under 35 Years | 123,272 | 18.5% |
| 35 to 44 Years | 112,578 | 16.9% |
| 45 to 54 Years | 117,892 | 17.7% |
| 55 to 64 Years | 128,331 | 19.3% |
| 65 to 74 Years | 109,867 | 16.5% |
| 75 to 84 Years | 53,847 | 8.1% |
| 85 Years and Over | 19,774 | 3.0% |
| Total | 665,561 | 100.0% |
Housing Finances in Area Code 803
Median Income by Occupancy in Area Code 803
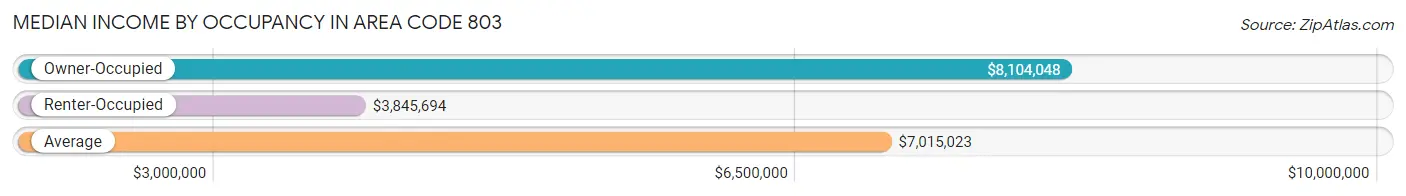
| Occupancy Type | # Households | Median Income |
| Owner-Occupied | 469,622 (70.6%) | $8,104,048 |
| Renter-Occupied | 195,939 (29.4%) | $3,845,694 |
| Average | 665,561 (100.0%) | $7,015,023 |
Occupancy by Householder Income Bracket in Area Code 803
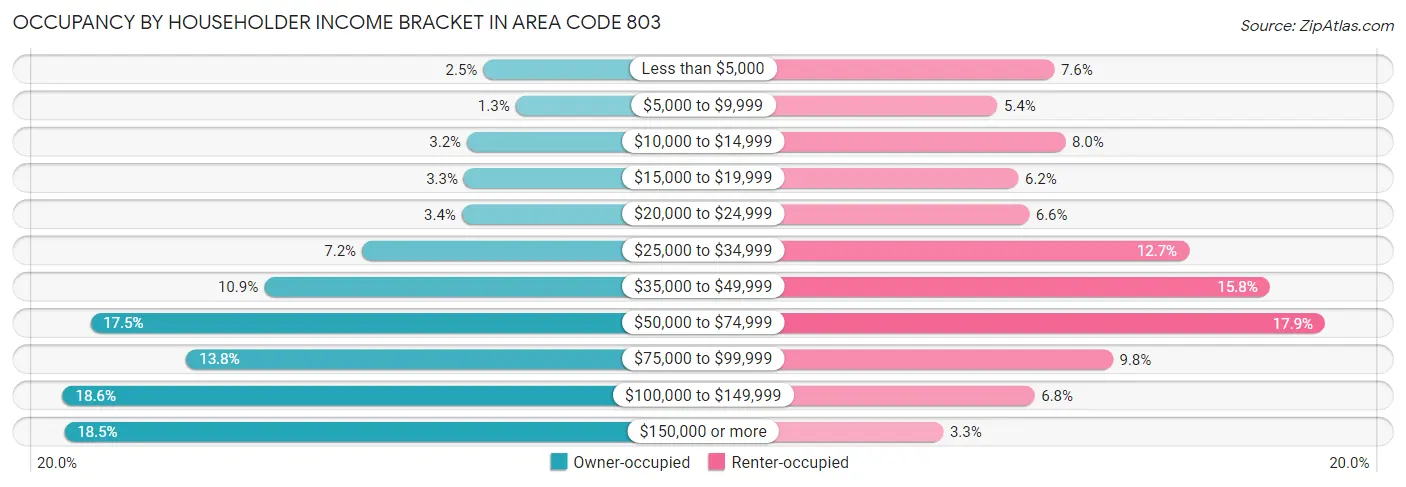
| Income Bracket | Owner-occupied | Renter-occupied |
| Less than $5,000 | 11,863 (2.5%) | 14,813 (7.6%) |
| $5,000 to $9,999 | 6,099 (1.3%) | 10,563 (5.4%) |
| $10,000 to $14,999 | 14,808 (3.2%) | 15,634 (8.0%) |
| $15,000 to $19,999 | 15,350 (3.3%) | 12,135 (6.2%) |
| $20,000 to $24,999 | 15,739 (3.4%) | 12,929 (6.6%) |
| $25,000 to $34,999 | 33,574 (7.1%) | 24,887 (12.7%) |
| $35,000 to $49,999 | 51,089 (10.9%) | 30,899 (15.8%) |
| $50,000 to $74,999 | 82,163 (17.5%) | 35,040 (17.9%) |
| $75,000 to $99,999 | 65,018 (13.8%) | 19,176 (9.8%) |
| $100,000 to $149,999 | 87,104 (18.5%) | 13,340 (6.8%) |
| $150,000 or more | 86,815 (18.5%) | 6,523 (3.3%) |
| Total | 469,622 (100.0%) | 195,939 (100.0%) |
Monthly Housing Cost Tiers in Area Code 803
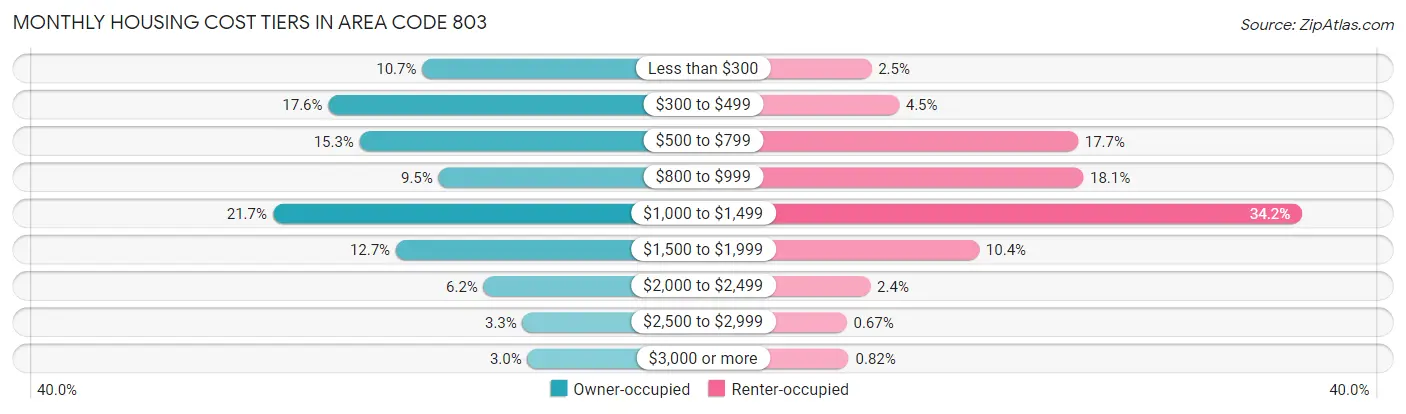
| Monthly Cost | Owner-occupied | Renter-occupied |
| Less than $300 | 50,281 (10.7%) | 4,886 (2.5%) |
| $300 to $499 | 82,792 (17.6%) | 8,864 (4.5%) |
| $500 to $799 | 71,953 (15.3%) | 34,677 (17.7%) |
| $800 to $999 | 44,646 (9.5%) | 35,436 (18.1%) |
| $1,000 to $1,499 | 101,994 (21.7%) | 67,054 (34.2%) |
| $1,500 to $1,999 | 59,397 (12.7%) | 20,408 (10.4%) |
| $2,000 to $2,499 | 29,064 (6.2%) | 4,718 (2.4%) |
| $2,500 to $2,999 | 15,572 (3.3%) | 1,308 (0.7%) |
| $3,000 or more | 13,923 (3.0%) | 1,601 (0.8%) |
| Total | 469,622 (100.0%) | 195,939 (100.0%) |
Physical Housing Characteristics in Area Code 803
Housing Structures in Area Code 803
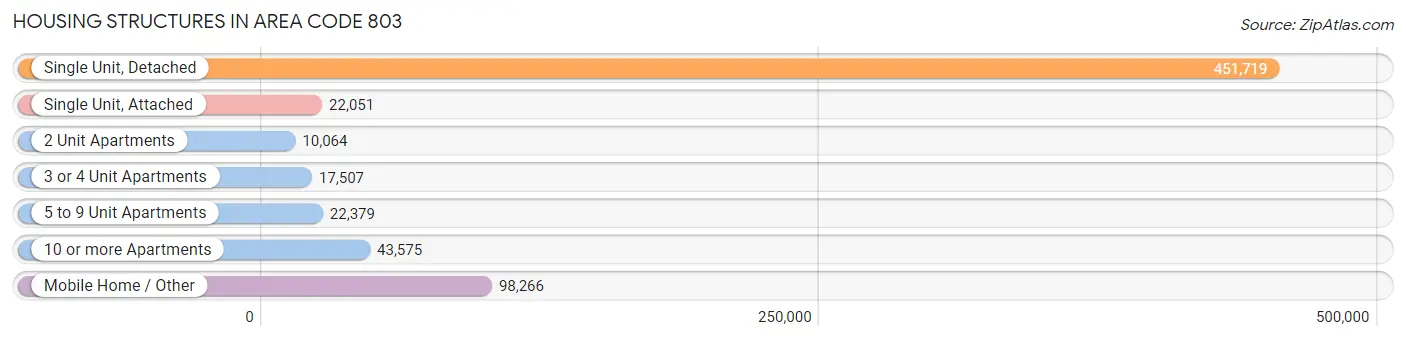
| Structure Type | # Housing Units | % Housing Units |
| Single Unit, Detached | 451,719 | 67.9% |
| Single Unit, Attached | 22,051 | 3.3% |
| 2 Unit Apartments | 10,064 | 1.5% |
| 3 or 4 Unit Apartments | 17,507 | 2.6% |
| 5 to 9 Unit Apartments | 22,379 | 3.4% |
| 10 or more Apartments | 43,575 | 6.6% |
| Mobile Home / Other | 98,266 | 14.8% |
| Total | 665,561 | 100.0% |
Housing Structures by Occupancy in Area Code 803
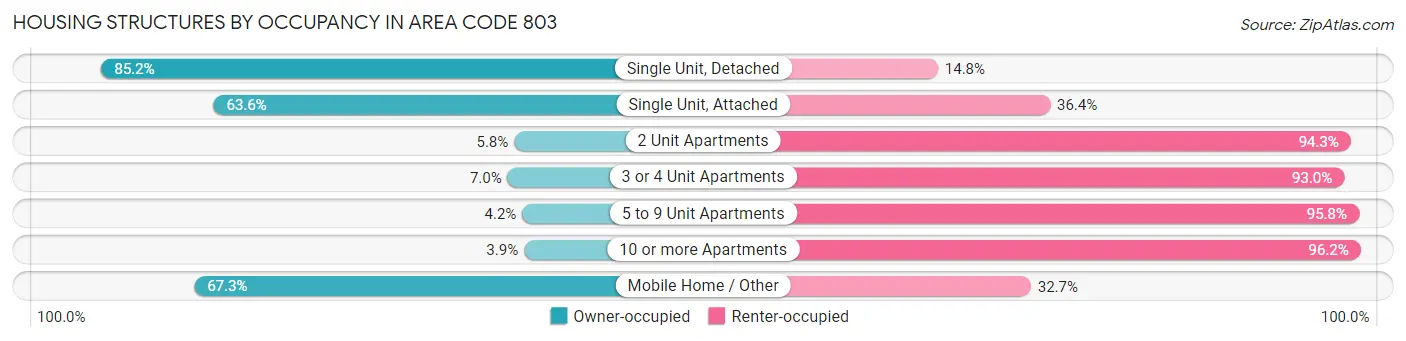
| Structure Type | Owner-occupied | Renter-occupied |
| Single Unit, Detached | 384,997 (85.2%) | 66,722 (14.8%) |
| Single Unit, Attached | 14,030 (63.6%) | 8,021 (36.4%) |
| 2 Unit Apartments | 579 (5.8%) | 9,485 (94.3%) |
| 3 or 4 Unit Apartments | 1,229 (7.0%) | 16,278 (93.0%) |
| 5 to 9 Unit Apartments | 939 (4.2%) | 21,440 (95.8%) |
| 10 or more Apartments | 1,679 (3.8%) | 41,896 (96.2%) |
| Mobile Home / Other | 66,169 (67.3%) | 32,097 (32.7%) |
| Total | 469,622 (70.6%) | 195,939 (29.4%) |
Housing Structures by Number of Rooms in Area Code 803
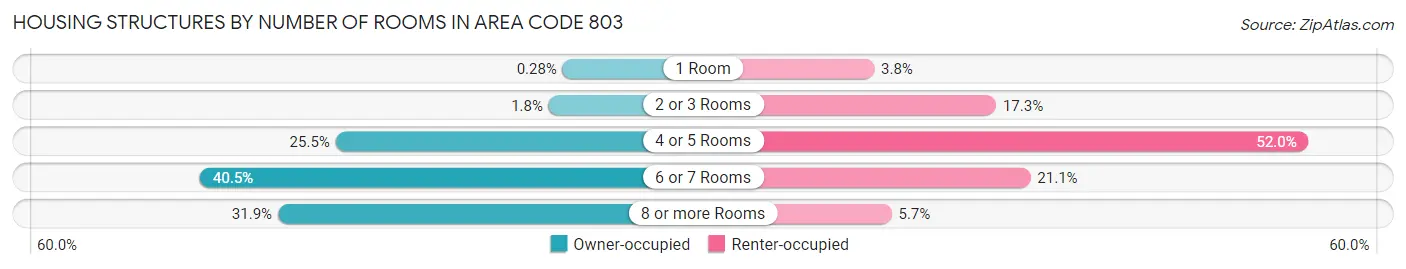
| Number of Rooms | Owner-occupied | Renter-occupied |
| 1 Room | 1,310 (0.3%) | 7,429 (3.8%) |
| 2 or 3 Rooms | 8,541 (1.8%) | 33,946 (17.3%) |
| 4 or 5 Rooms | 119,645 (25.5%) | 101,913 (52.0%) |
| 6 or 7 Rooms | 190,363 (40.5%) | 41,430 (21.1%) |
| 8 or more Rooms | 149,763 (31.9%) | 11,221 (5.7%) |
| Total | 469,622 (100.0%) | 195,939 (100.0%) |
Housing Structure by Heating Type in Area Code 803
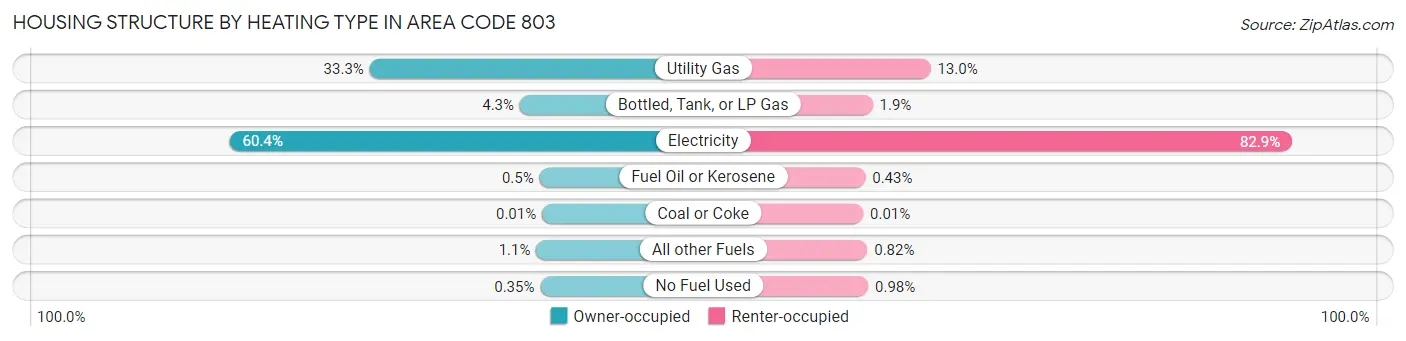
| Heating Type | Owner-occupied | Renter-occupied |
| Utility Gas | 156,457 (33.3%) | 25,539 (13.0%) |
| Bottled, Tank, or LP Gas | 20,215 (4.3%) | 3,617 (1.8%) |
| Electricity | 283,663 (60.4%) | 162,388 (82.9%) |
| Fuel Oil or Kerosene | 2,349 (0.5%) | 850 (0.4%) |
| Coal or Coke | 61 (0.0%) | 17 (0.0%) |
| All other Fuels | 5,239 (1.1%) | 1,616 (0.8%) |
| No Fuel Used | 1,638 (0.4%) | 1,912 (1.0%) |
| Total | 469,622 (100.0%) | 195,939 (100.0%) |
Household Vehicle Usage in Area Code 803
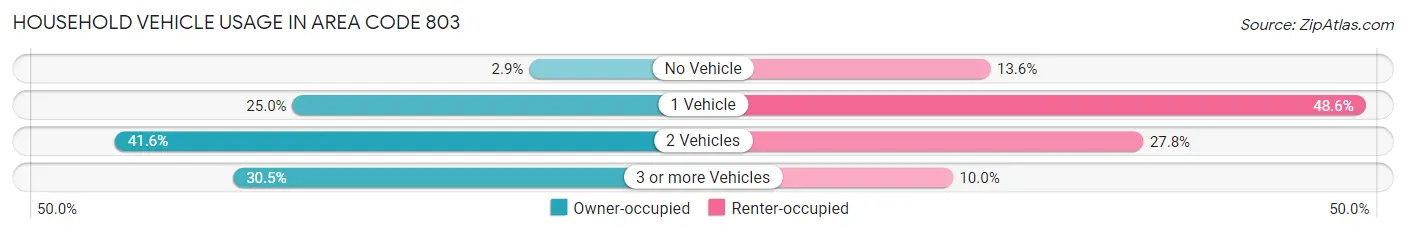
| Vehicles per Household | Owner-occupied | Renter-occupied |
| No Vehicle | 13,613 (2.9%) | 26,553 (13.6%) |
| 1 Vehicle | 117,425 (25.0%) | 95,200 (48.6%) |
| 2 Vehicles | 195,242 (41.6%) | 54,509 (27.8%) |
| 3 or more Vehicles | 143,342 (30.5%) | 19,677 (10.0%) |
| Total | 469,622 (100.0%) | 195,939 (100.0%) |
Real Estate & Mortgages in Area Code 803
Real Estate and Mortgage Overview in Area Code 803
| Characteristic | Without Mortgage | With Mortgage |
| Housing Units | 192,453 | 277,169 |
| Median Property Value | $15,478,600 | $21,523,500 |
| Median Household Income | $6,430,582 | $65,741 |
| Monthly Housing Costs | $52,022 | $13,601 |
| Real Estate Taxes | $91,388 | $11,503 |
Property Value by Mortgage Status in Area Code 803
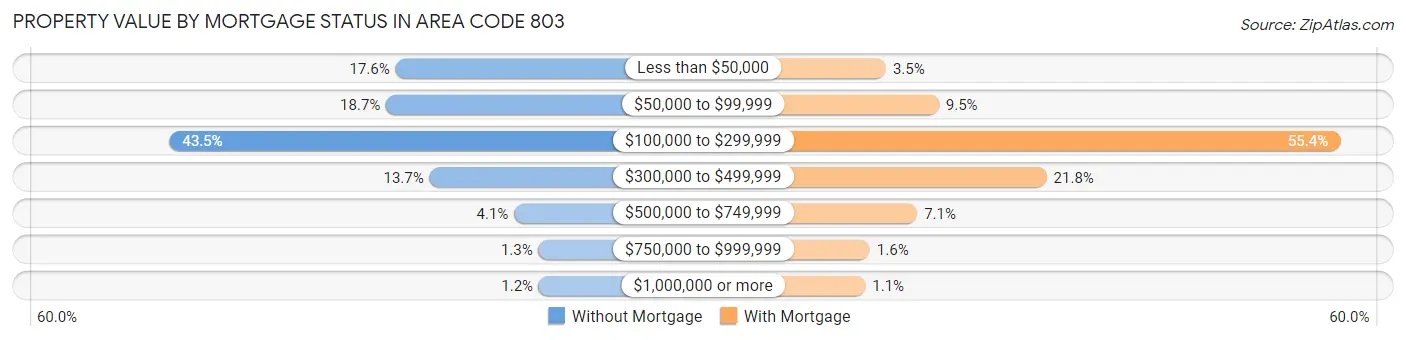
| Property Value | Without Mortgage | With Mortgage |
| Less than $50,000 | 33,890 (17.6%) | 9,639 (3.5%) |
| $50,000 to $99,999 | 35,956 (18.7%) | 26,393 (9.5%) |
| $100,000 to $299,999 | 83,614 (43.4%) | 153,431 (55.4%) |
| $300,000 to $499,999 | 26,414 (13.7%) | 60,522 (21.8%) |
| $500,000 to $749,999 | 7,795 (4.1%) | 19,529 (7.0%) |
| $750,000 to $999,999 | 2,429 (1.3%) | 4,556 (1.6%) |
| $1,000,000 or more | 2,355 (1.2%) | 3,099 (1.1%) |
| Total | 192,453 (100.0%) | 277,169 (100.0%) |
Household Income by Mortgage Status in Area Code 803
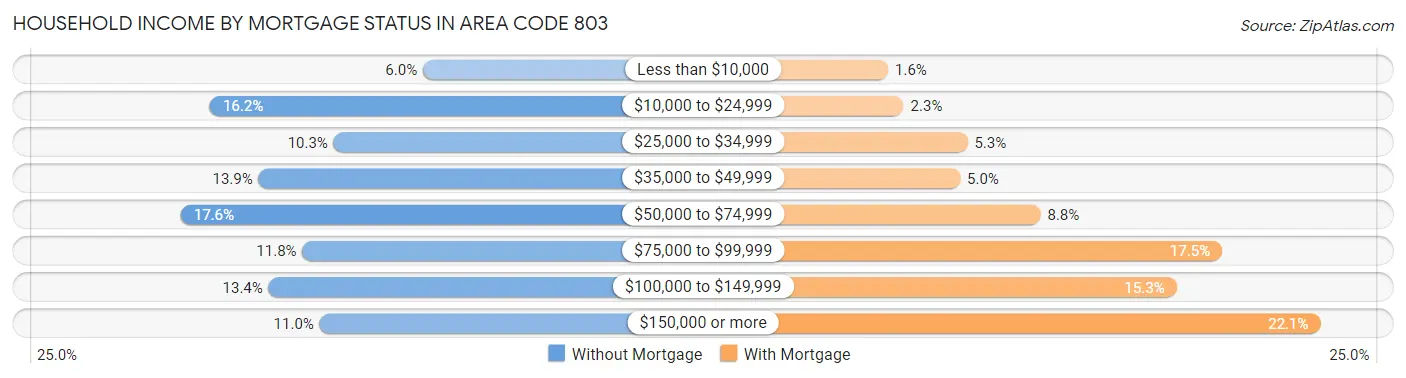
| Household Income | Without Mortgage | With Mortgage |
| Less than $10,000 | 11,609 (6.0%) | 4,288 (1.5%) |
| $10,000 to $24,999 | 31,119 (16.2%) | 6,353 (2.3%) |
| $25,000 to $34,999 | 19,781 (10.3%) | 14,778 (5.3%) |
| $35,000 to $49,999 | 26,667 (13.9%) | 13,793 (5.0%) |
| $50,000 to $74,999 | 33,801 (17.6%) | 24,422 (8.8%) |
| $75,000 to $99,999 | 22,643 (11.8%) | 48,362 (17.4%) |
| $100,000 to $149,999 | 25,759 (13.4%) | 42,375 (15.3%) |
| $150,000 or more | 21,074 (11.0%) | 61,345 (22.1%) |
| Total | 192,453 (100.0%) | 277,169 (100.0%) |
Property Value to Household Income Ratio in Area Code 803
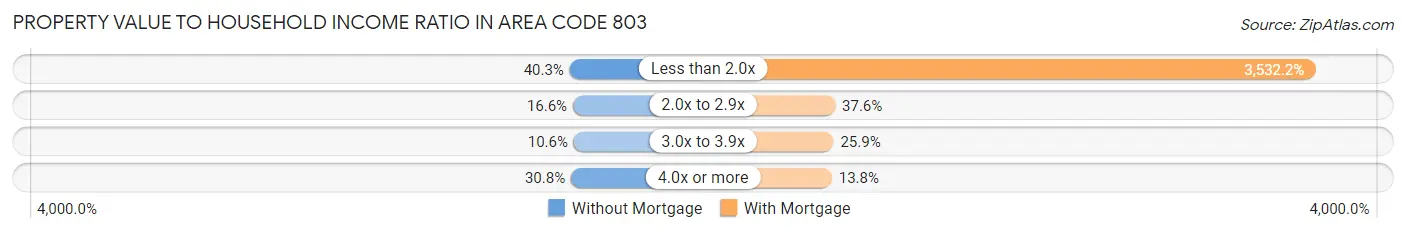
| Value-to-Income Ratio | Without Mortgage | With Mortgage |
| Less than 2.0x | 77,525 (40.3%) | 9,790,141 (3,532.2%) |
| 2.0x to 2.9x | 31,881 (16.6%) | 104,220 (37.6%) |
| 3.0x to 3.9x | 20,392 (10.6%) | 71,729 (25.9%) |
| 4.0x or more | 59,297 (30.8%) | 38,104 (13.8%) |
| Total | 192,453 (100.0%) | 277,169 (100.0%) |
Real Estate Taxes by Mortgage Status in Area Code 803
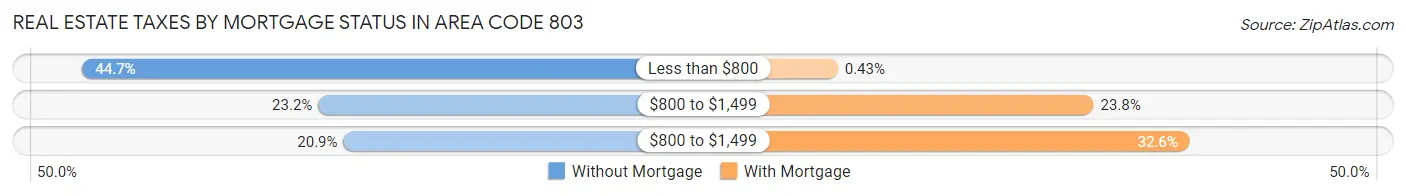
| Property Taxes | Without Mortgage | With Mortgage |
| Less than $800 | 86,070 (44.7%) | 1,200 (0.4%) |
| $800 to $1,499 | 44,623 (23.2%) | 65,941 (23.8%) |
| $800 to $1,499 | 40,205 (20.9%) | 90,300 (32.6%) |
| Total | 192,453 (100.0%) | 277,169 (100.0%) |
Health & Disability in Area Code 803
Health Insurance Coverage by Age in Area Code 803
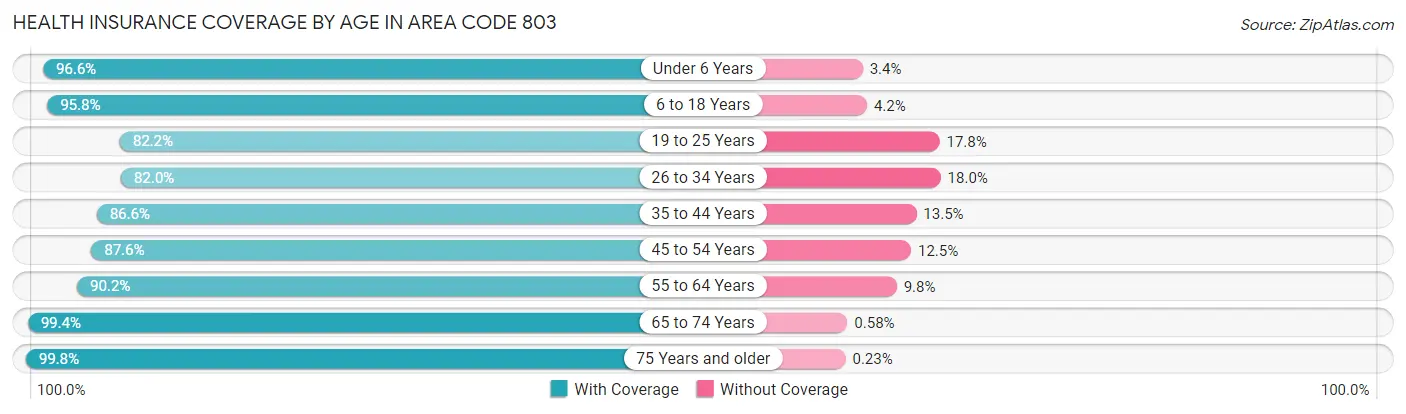
| Age Bracket | With Coverage | Without Coverage |
| Under 6 Years | 109,928 (96.6%) | 3,901 (3.4%) |
| 6 to 18 Years | 272,817 (95.8%) | 12,059 (4.2%) |
| 19 to 25 Years | 128,306 (82.2%) | 27,701 (17.8%) |
| 26 to 34 Years | 152,337 (82.0%) | 33,382 (18.0%) |
| 35 to 44 Years | 177,718 (86.6%) | 27,626 (13.5%) |
| 45 to 54 Years | 180,939 (87.5%) | 25,734 (12.4%) |
| 55 to 64 Years | 196,794 (90.2%) | 21,333 (9.8%) |
| 65 to 74 Years | 172,416 (99.4%) | 1,013 (0.6%) |
| 75 Years and older | 107,403 (99.8%) | 247 (0.2%) |
| Total | 1,498,658 (90.7%) | 152,996 (9.3%) |
Health Insurance Coverage by Citizenship Status in Area Code 803
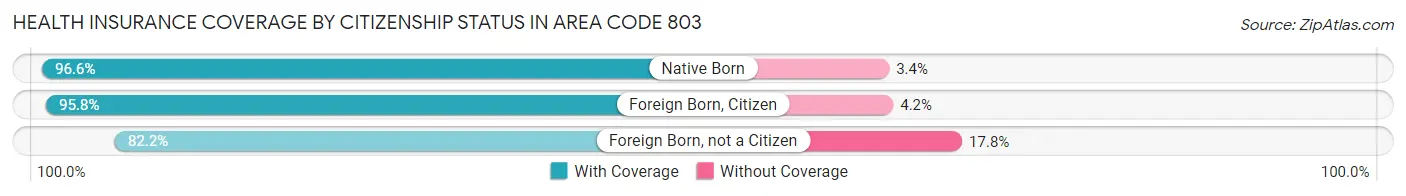
| Citizenship Status | With Coverage | Without Coverage |
| Native Born | 109,928 (96.6%) | 3,901 (3.4%) |
| Foreign Born, Citizen | 272,817 (95.8%) | 12,059 (4.2%) |
| Foreign Born, not a Citizen | 128,306 (82.2%) | 27,701 (17.8%) |
Health Insurance Coverage by Household Income in Area Code 803
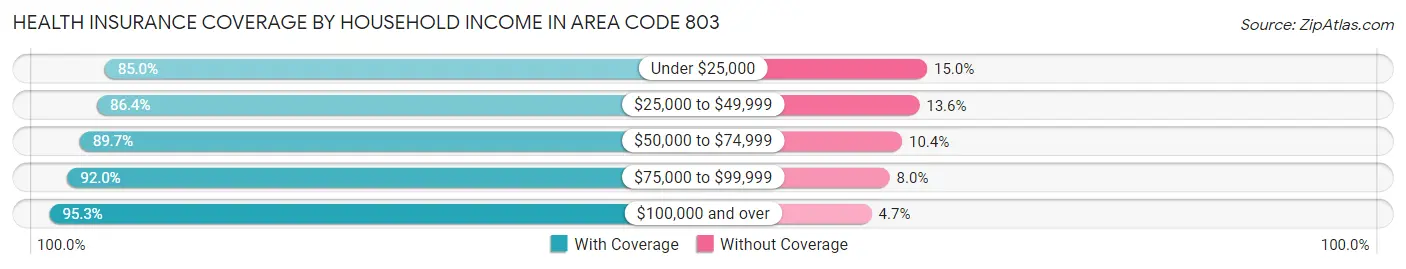
| Household Income | With Coverage | Without Coverage |
| Under $25,000 | 195,761 (85.0%) | 34,631 (15.0%) |
| $25,000 to $49,999 | 254,291 (86.4%) | 39,966 (13.6%) |
| $50,000 to $74,999 | 258,067 (89.6%) | 29,792 (10.3%) |
| $75,000 to $99,999 | 213,134 (92.0%) | 18,598 (8.0%) |
| $100,000 and over | 557,414 (95.3%) | 27,246 (4.7%) |
Public vs Private Health Insurance Coverage by Age in Area Code 803
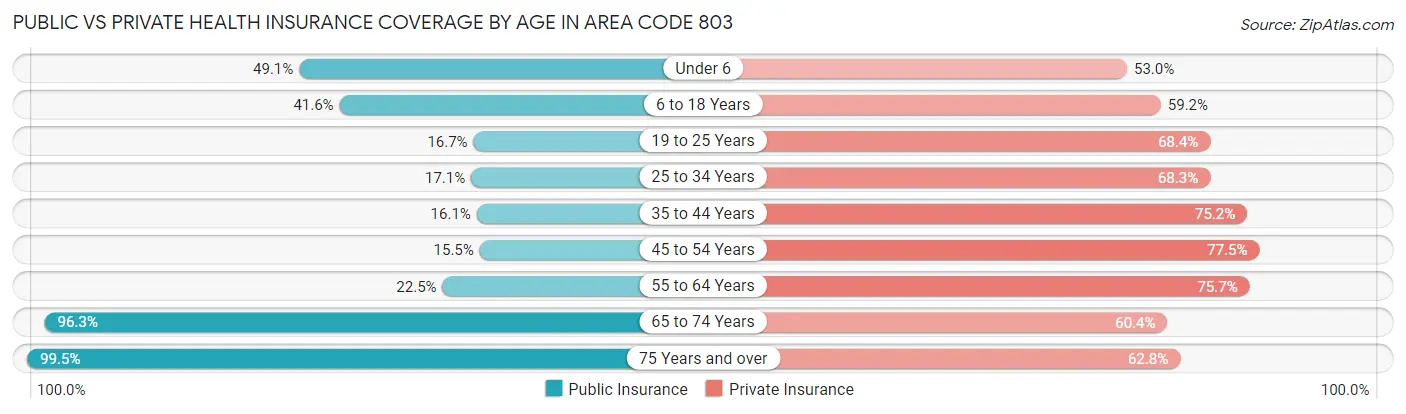
| Age Bracket | Public Insurance | Private Insurance |
| Under 6 | 55,838 (49.0%) | 60,273 (52.9%) |
| 6 to 18 Years | 118,395 (41.6%) | 168,711 (59.2%) |
| 19 to 25 Years | 26,030 (16.7%) | 106,662 (68.4%) |
| 25 to 34 Years | 31,841 (17.1%) | 126,909 (68.3%) |
| 35 to 44 Years | 33,032 (16.1%) | 154,470 (75.2%) |
| 45 to 54 Years | 32,126 (15.5%) | 160,157 (77.5%) |
| 55 to 64 Years | 48,973 (22.5%) | 165,050 (75.7%) |
| 65 to 74 Years | 166,992 (96.3%) | 104,787 (60.4%) |
| 75 Years and over | 107,160 (99.5%) | 67,569 (62.8%) |
| Total | 620,387 (37.6%) | 1,114,588 (67.5%) |
Disability Status by Sex by Age in Area Code 803
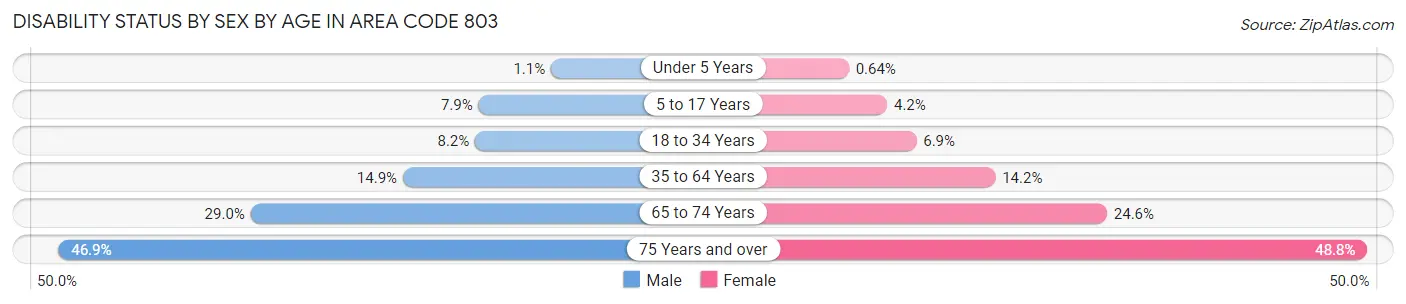
| Age Bracket | Male | Female |
| Under 5 Years | 557 (1.1%) | 295 (0.6%) |
| 5 to 17 Years | 11,169 (7.9%) | 5,713 (4.2%) |
| 18 to 34 Years | 14,610 (8.2%) | 13,061 (6.9%) |
| 35 to 64 Years | 44,789 (14.9%) | 46,897 (14.2%) |
| 65 to 74 Years | 23,007 (29.0%) | 23,164 (24.6%) |
| 75 Years and over | 20,990 (46.9%) | 30,662 (48.8%) |
Disability Class by Sex by Age in Area Code 803
Disability Class: Hearing Difficulty
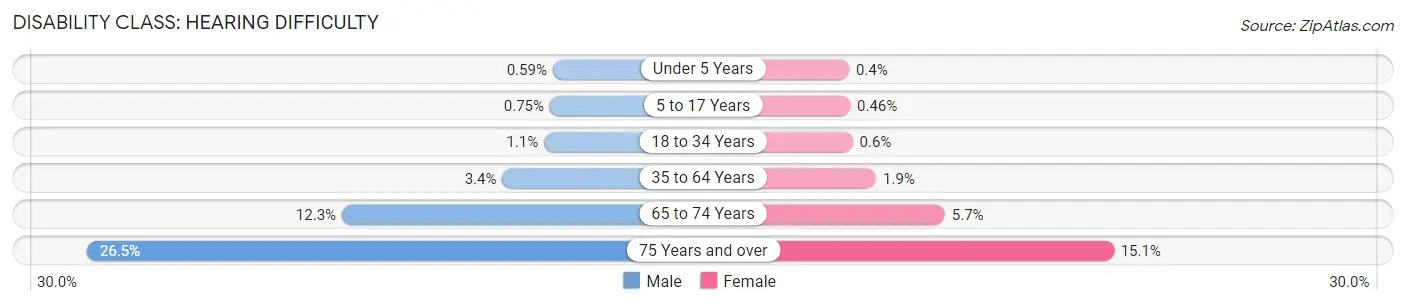
| Age Bracket | Male | Female |
| Under 5 Years | 287 (0.6%) | 184 (0.4%) |
| 5 to 17 Years | 1,066 (0.7%) | 620 (0.5%) |
| 18 to 34 Years | 1,911 (1.1%) | 1,143 (0.6%) |
| 35 to 64 Years | 10,235 (3.4%) | 6,304 (1.9%) |
| 65 to 74 Years | 9,773 (12.3%) | 5,409 (5.7%) |
| 75 Years and over | 11,879 (26.5%) | 9,515 (15.1%) |
Disability Class: Vision Difficulty
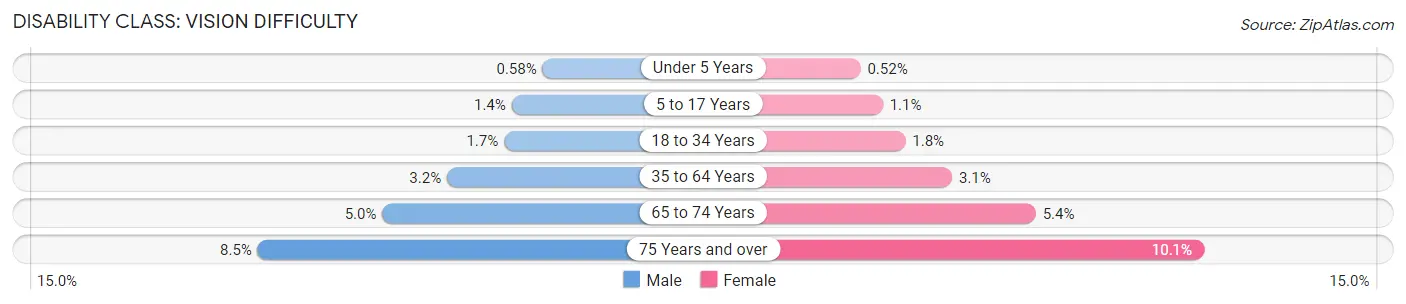
| Age Bracket | Male | Female |
| Under 5 Years | 282 (0.6%) | 241 (0.5%) |
| 5 to 17 Years | 2,043 (1.4%) | 1,551 (1.1%) |
| 18 to 34 Years | 2,939 (1.7%) | 3,350 (1.8%) |
| 35 to 64 Years | 9,738 (3.2%) | 10,115 (3.1%) |
| 65 to 74 Years | 3,998 (5.0%) | 5,087 (5.4%) |
| 75 Years and over | 3,813 (8.5%) | 6,340 (10.1%) |
Disability Class: Cognitive Difficulty
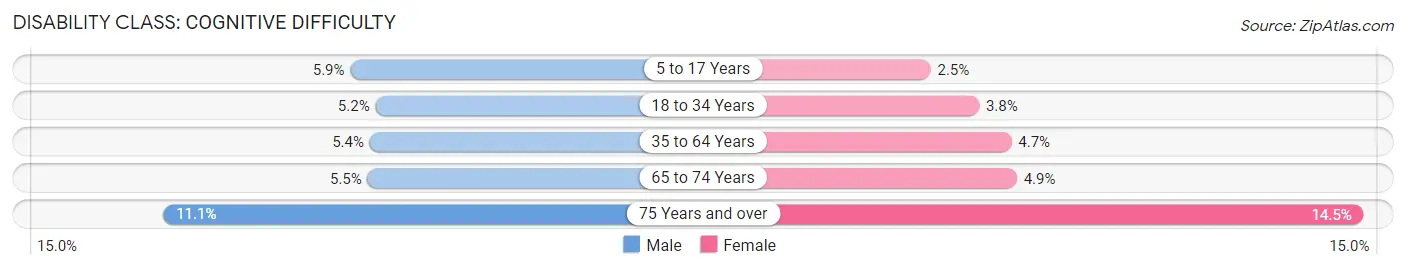
| Age Bracket | Male | Female |
| 5 to 17 Years | 8,412 (5.9%) | 3,365 (2.5%) |
| 18 to 34 Years | 9,316 (5.2%) | 7,224 (3.8%) |
| 35 to 64 Years | 16,217 (5.4%) | 15,551 (4.7%) |
| 65 to 74 Years | 4,317 (5.4%) | 4,584 (4.9%) |
| 75 Years and over | 4,988 (11.1%) | 9,132 (14.5%) |
Disability Class: Ambulatory Difficulty
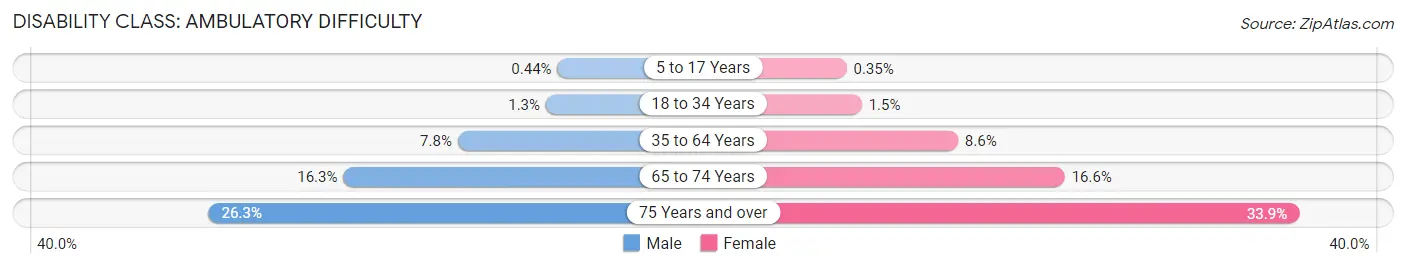
| Age Bracket | Male | Female |
| 5 to 17 Years | 630 (0.4%) | 472 (0.4%) |
| 18 to 34 Years | 2,319 (1.3%) | 2,789 (1.5%) |
| 35 to 64 Years | 23,579 (7.8%) | 28,384 (8.6%) |
| 65 to 74 Years | 12,954 (16.3%) | 15,583 (16.6%) |
| 75 Years and over | 11,796 (26.3%) | 21,336 (33.9%) |
Disability Class: Self-Care Difficulty
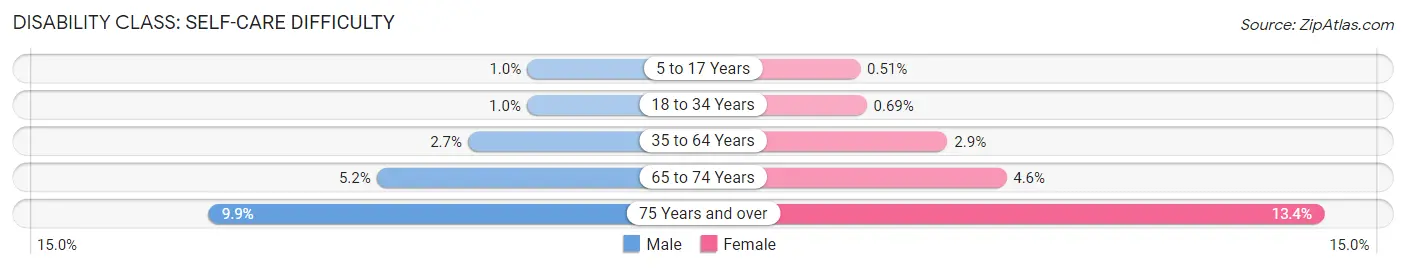
| Age Bracket | Male | Female |
| 5 to 17 Years | 1,427 (1.0%) | 689 (0.5%) |
| 18 to 34 Years | 1,825 (1.0%) | 1,298 (0.7%) |
| 35 to 64 Years | 8,012 (2.7%) | 9,682 (2.9%) |
| 65 to 74 Years | 4,124 (5.2%) | 4,315 (4.6%) |
| 75 Years and over | 4,419 (9.9%) | 8,435 (13.4%) |
Technology Access in Area Code 803
Computing Device Access in Area Code 803
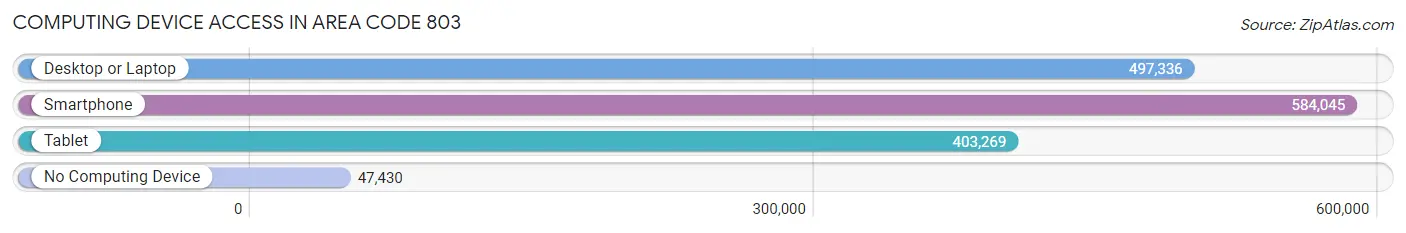
| Device Type | # Households | % Households |
| Desktop or Laptop | 497,336 | 74.7% |
| Smartphone | 584,045 | 87.7% |
| Tablet | 403,269 | 60.6% |
| No Computing Device | 47,430 | 7.1% |
| Total | 665,561 | 100.0% |
Internet Access in Area Code 803
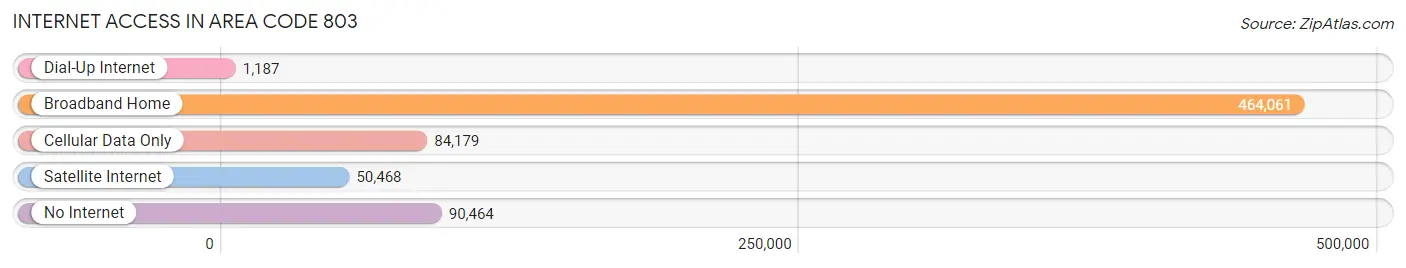
| Internet Type | # Households | % Households |
| Dial-Up Internet | 1,187 | 0.2% |
| Broadband Home | 464,061 | 69.7% |
| Cellular Data Only | 84,179 | 12.7% |
| Satellite Internet | 50,468 | 7.6% |
| No Internet | 90,464 | 13.6% |
| Total | 665,561 | 100.0% |
Area Code 803 Summary
Geography
Area code 803 is located in the state of South Carolina. It covers the entire state, including the cities of Columbia, Charleston, and Greenville. It is bordered by North Carolina to the north, Georgia to the south, and the Atlantic Ocean to the east.
Social
Area code 803 is home to a diverse population of people from all walks of life. The area is known for its friendly and welcoming atmosphere, and its residents are proud of their Southern heritage. The area is also home to a variety of cultural attractions, including museums, galleries, and performing arts venues.
Economics
Area code 803 is a major economic hub in South Carolina. The area is home to a number of large corporations, including Boeing, Michelin, and BMW. The area also has a thriving tourism industry, with many visitors coming to enjoy the area's beaches, golf courses, and other attractions.
Demographics
Area code 803 is home to a diverse population of people from all walks of life. According to the most recent census, the population of the area is approximately 4.5 million people. The area is predominantly white, with African Americans making up the largest minority group. The median household income in the area is around $50,000.
Common Questions
What is Per Capita Income in Area Code 803?
Per Capita income in Area Code 803 is $28,585.
What is the Median Family Income in Area Code 803?
Median Family Income in Area Code 803 is $69,357.
What is the Median Household income in Area Code 803?
Median Household Income in Area Code 803 is $54,805.
What is Income or Wage Gap in Area Code 803?
Income or Wage Gap in Area Code 803 is 27.9%.
Women in Area Code 803 earn 72.1 cents for every dollar earned by a man.
What is Family Income Deficit in Area Code 803?
Family Income Deficit in Area Code 803 is $10,872.
Families that are below poverty line in Area Code 803 earn $10,872 less on average than the poverty threshold level.
What is Inequality or Gini Index in Area Code 803?
Inequality or Gini Index in Area Code 803 is 57.69.
What is the Total Population of Area Code 803?
Total Population of Area Code 803 is 1,694,525.
What is the Total Male Population of Area Code 803?
Total Male Population of Area Code 803 is 824,750.
What is the Total Female Population of Area Code 803?
Total Female Population of Area Code 803 is 869,775.
What is the Ratio of Males per 100 Females in Area Code 803?
There are 94.82 Males per 100 Females in Area Code 803.
What is the Ratio of Females per 100 Males in Area Code 803?
There are 105.46 Females per 100 Males in Area Code 803.
What is the Median Population Age in Area Code 803?
Median Population Age in Area Code 803 is 40.6 Years.
What is the Average Family Size in Area Code 803
Average Family Size in Area Code 803 is 3.2 People.
What is the Average Household Size in Area Code 803
Average Household Size in Area Code 803 is 2.5 People.
How Large is the Labor Force in Area Code 803?
There are 778,282 People in the Labor Forcein in Area Code 803.
What is the Percentage of People in the Labor Force in Area Code 803?
57.1% of People are in the Labor Force in Area Code 803.
What is the Unemployment Rate in Area Code 803?
Unemployment Rate in Area Code 803 is 8.7%.