Zip Codes with the Lowest Poverty Level Among Children Under the Age of 5 in Las Vegas, NV

RELATED REPORTS & OPTIONS

Lowest Poverty | Child 0-5
Population
Families and Households
Female Fertility
Female Fertility (Unmarried)
Race (Community Size)
Race (Percentage)
Ancestry (Community Size)
AfghanAfricanAlaska NativeAlbanianAleutAmericanApacheArabArapahoArgentineanArmenianAssyrian / Chaldean / SyriacAustralianAustrianBangladeshiBarbadianBasqueBelgianBelizeanBhutaneseBlackfeetBolivianBrazilianBritishBritish West IndianBulgarianBurmeseCajunCambodianCanadianCape VerdeanCelticCentral AmericanCentral American IndianCherokeeCheyenneChickasawChileanChineseChippewaChoctawColombianComancheCosta RicanCreeCreekCroatianCubanCzechCzechoslovakianDanishDelawareDominicanDutchDutch West IndianEastern EuropeanEcuadorianEgyptianEnglishEstonianEthiopianEuropeanFijianFilipinoFinnishFrenchFrench American IndianFrench CanadianGermanGerman RussianGhanaianGreekGuamanian / ChamorroGuatemalanGuyaneseHaitianHonduranHopiHungarianIcelanderIndian (Asian)IndonesianInupiatIranianIraqiIrishIroquoisIsraeliItalianJamaicanJapaneseJordanianKenyanKoreanLaotianLatvianLebaneseLiberianLithuanianLuxembourgerMacedonianMalaysianMalteseMenomineeMexicanMexican American IndianMongolianMoroccanNative HawaiianNavajoNew ZealanderNicaraguanNigerianNorthern EuropeanNorwegianOkinawanOsagePaiutePakistaniPalestinianPanamanianParaguayanPennsylvania GermanPeruvianPimaPolishPortuguesePotawatomiPuebloPuerto RicanPuget Sound SalishRomanianRussianSalvadoranSamoanScandinavianScotch-IrishScottishSeminoleSenegaleseSerbianShoshoneSierra LeoneanSiouxSlavicSlovakSloveneSomaliSouth AfricanSouth AmericanSouth American IndianSoviet UnionSpaniardSpanishSpanish AmericanSpanish American IndianSri LankanSubsaharan AfricanSudaneseSwedishSwissSyrianThaiTlingit-HaidaTohono O'OdhamTonganTrinidadian and TobagonianTurkishU.S. Virgin IslanderUgandanUkrainianUruguayanUteVenezuelanVietnameseWelshWest IndianYaquiYugoslavianYumanYup'ikZimbabwean
Ancestry (Percentage)
AfghanAfricanAlaska NativeAlbanianAleutAmericanApacheArabArapahoArgentineanArmenianAssyrian / Chaldean / SyriacAustralianAustrianBangladeshiBarbadianBasqueBelgianBelizeanBhutaneseBlackfeetBolivianBrazilianBritishBritish West IndianBulgarianBurmeseCajunCambodianCanadianCape VerdeanCelticCentral AmericanCentral American IndianCherokeeCheyenneChickasawChileanChineseChippewaChoctawColombianComancheCosta RicanCreeCreekCroatianCubanCzechCzechoslovakianDanishDelawareDominicanDutchDutch West IndianEastern EuropeanEcuadorianEgyptianEnglishEstonianEthiopianEuropeanFijianFilipinoFinnishFrenchFrench American IndianFrench CanadianGermanGerman RussianGhanaianGreekGuamanian / ChamorroGuatemalanGuyaneseHaitianHonduranHopiHungarianIcelanderIndian (Asian)IndonesianInupiatIranianIraqiIrishIroquoisIsraeliItalianJamaicanJapaneseJordanianKenyanKoreanLaotianLatvianLebaneseLiberianLithuanianLuxembourgerMacedonianMalaysianMalteseMenomineeMexicanMexican American IndianMongolianMoroccanNative HawaiianNavajoNew ZealanderNicaraguanNigerianNorthern EuropeanNorwegianOkinawanOsagePaiutePakistaniPalestinianPanamanianParaguayanPennsylvania GermanPeruvianPimaPolishPortuguesePotawatomiPuebloPuerto RicanPuget Sound SalishRomanianRussianSalvadoranSamoanScandinavianScotch-IrishScottishSeminoleSenegaleseSerbianShoshoneSierra LeoneanSiouxSlavicSlovakSloveneSomaliSouth AfricanSouth AmericanSouth American IndianSoviet UnionSpaniardSpanishSpanish AmericanSpanish American IndianSri LankanSubsaharan AfricanSudaneseSwedishSwissSyrianThaiTlingit-HaidaTohono O'OdhamTonganTrinidadian and TobagonianTurkishU.S. Virgin IslanderUgandanUkrainianUruguayanUteVenezuelanVietnameseWelshWest IndianYaquiYugoslavianYumanYup'ikZimbabwean
Immigrant Origin (Total)
AfghanistanAfricaAlbaniaArgentinaArmeniaAsiaAustraliaAustriaBahamasBangladeshBarbadosBelarusBelgiumBelizeBoliviaBosnia and HerzegovinaBrazilBulgariaBurma / MyanmarCambodiaCameroonCanadaCaribbeanCentral AmericaChileChinaColombiaCosta RicaCroatiaCubaCzechoslovakiaDenmarkDominican RepublicEastern AfricaEastern AsiaEastern EuropeEcuadorEgyptEl SalvadorEnglandEritreaEthiopiaEuropeFijiFranceGermanyGhanaGreeceGuatemalaGuyanaHaitiHondurasHong KongHungaryIndiaIndonesiaIranIraqIrelandIsraelItalyJamaicaJapanJordanKazakhstanKenyaKoreaLaosLatin AmericaLatviaLebanonLiberiaLithuaniaMalaysiaMexicoMicronesiaMiddle AfricaMoldovaMoroccoNepalNetherlandsNicaraguaNigeriaNorth MacedoniaNorthern AfricaNorthern EuropeNorwayOceaniaPakistanPanamaPeruPhilippinesPolandPortugalRomaniaRussiaSaudi ArabiaScotlandSenegalSerbiaSierra LeoneSingaporeSomaliaSouth AfricaSouth AmericaSouth Central AsiaSouth Eastern AsiaSouthern EuropeSpainSri LankaSudanSwedenSwitzerlandSyriaTaiwanThailandTrinidad and TobagoTurkeyUgandaUkraineUruguayUzbekistanVenezuelaVietnamWest IndiesWestern AfricaWestern AsiaWestern EuropeYemenZaireZimbabwe
Immigrant Origin (Percentage)
AfghanistanAfricaAlbaniaArgentinaArmeniaAsiaAustraliaAustriaBahamasBangladeshBarbadosBelarusBelgiumBelizeBoliviaBosnia and HerzegovinaBrazilBulgariaBurma / MyanmarCambodiaCameroonCanadaCaribbeanCentral AmericaChileChinaColombiaCosta RicaCroatiaCubaCzechoslovakiaDenmarkDominican RepublicEastern AfricaEastern AsiaEastern EuropeEcuadorEgyptEl SalvadorEnglandEritreaEthiopiaEuropeFijiFranceGermanyGhanaGreeceGuatemalaGuyanaHaitiHondurasHong KongHungaryIndiaIndonesiaIranIraqIrelandIsraelItalyJamaicaJapanJordanKazakhstanKenyaKoreaLaosLatin AmericaLatviaLebanonLiberiaLithuaniaMalaysiaMexicoMicronesiaMiddle AfricaMoldovaMoroccoNepalNetherlandsNicaraguaNigeriaNorth MacedoniaNorthern AfricaNorthern EuropeNorwayOceaniaPakistanPanamaPeruPhilippinesPolandPortugalRomaniaRussiaSaudi ArabiaScotlandSenegalSerbiaSierra LeoneSingaporeSomaliaSouth AfricaSouth AmericaSouth Central AsiaSouth Eastern AsiaSouthern EuropeSpainSri LankaSudanSwedenSwitzerlandSyriaTaiwanThailandTrinidad and TobagoTurkeyUgandaUkraineUruguayUzbekistanVenezuelaVietnamWest IndiesWestern AfricaWestern AsiaWestern EuropeYemenZaireZimbabwe
Income
Income (Families)
Income (Households)
Poverty
Poverty (Families)
Unemployment
Employment Occupations
Employment Industries
Employer Class
Commute Time
Commute Means
School Enrollment
Education by Degree Field
Occupancy
Finances
Physical Characteristics
Las Vegas
Compare Zip Codes
Comparison Subject

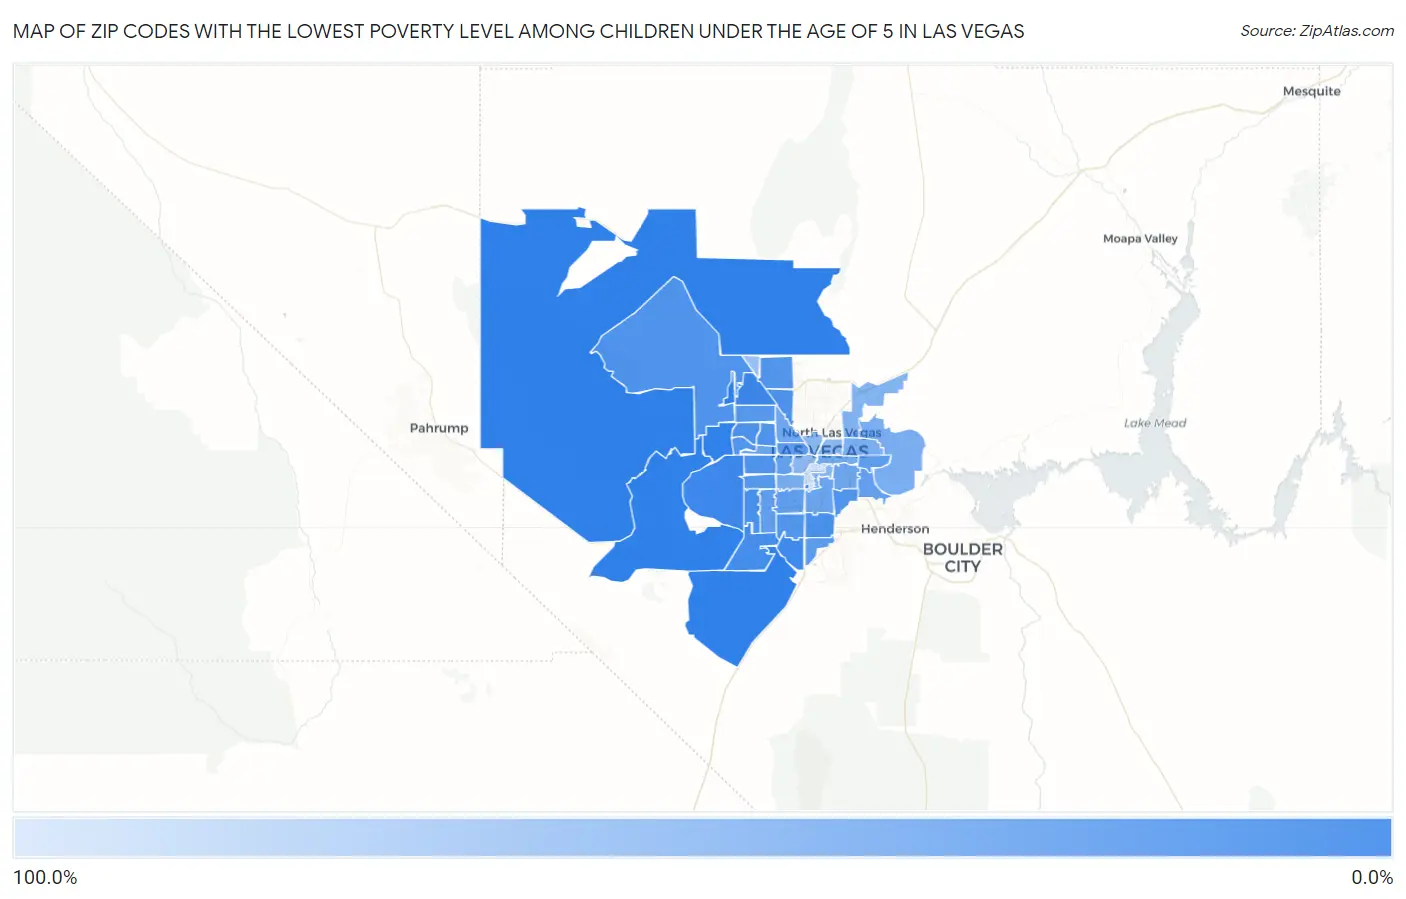
Map of Zip Codes with the Lowest Poverty Level Among Children Under the Age of 5 in Las Vegas

100.0%
0.0%
Zip Codes with the Lowest Poverty Level Among Children Under the Age of 5 in Las Vegas Map

Zip Codes with the Lowest Poverty Level Among Children Under the Age of 5 in Las Vegas, NV

Zip Code Child Poverty vs State vs National
1.891354.4%18.2%(-13.8)#1118.1%(-13.6)#2,502
2.891494.5%18.2%(-13.8)#1218.1%(-13.6)#2,522
3.891415.9%18.2%(-12.3)#1518.1%(-12.1)#3,552
4.891788.7%18.2%(-9.48)#2818.1%(-9.33)#5,427
5.891489.8%18.2%(-8.46)#3518.1%(-8.31)#6,106
6.891239.9%18.2%(-8.36)#3718.1%(-8.21)#6,165
7.8913410.8%18.2%(-7.37)#3818.1%(-7.22)#6,742
8.8916611.7%18.2%(-6.47)#3918.1%(-6.32)#7,296
9.8911711.8%18.2%(-6.44)#4018.1%(-6.29)#7,324
10.8913012.0%18.2%(-6.25)#4118.1%(-6.10)#7,433
11.8912812.1%18.2%(-6.09)#4218.1%(-5.94)#7,536
12.8912013.3%18.2%(-4.95)#4618.1%(-4.80)#8,190
13.8914414.3%18.2%(-3.96)#4918.1%(-3.81)#8,764
14.8913914.4%18.2%(-3.85)#5118.1%(-3.70)#8,873
15.8913114.4%18.2%(-3.79)#5218.1%(-3.64)#8,901
16.8914715.9%18.2%(-2.32)#5718.1%(-2.17)#9,699
17.8912916.3%18.2%(-1.88)#5818.1%(-1.73)#9,931
18.8918319.1%18.2%(+0.937)#6618.1%(+1.09)#11,234
19.8910720.1%18.2%(+1.86)#6918.1%(+2.01)#11,685
20.8911820.8%18.2%(+2.57)#7118.1%(+2.72)#11,984
21.8911320.8%18.2%(+2.62)#7218.1%(+2.77)#12,014
22.8914221.0%18.2%(+2.74)#7318.1%(+2.89)#12,056
23.8912222.2%18.2%(+4.00)#7718.1%(+4.15)#12,559
24.8914622.3%18.2%(+4.10)#7818.1%(+4.25)#12,630
25.8911925.7%18.2%(+7.52)#8418.1%(+7.67)#13,942
26.8912126.8%18.2%(+8.58)#8518.1%(+8.73)#14,302
27.8914527.3%18.2%(+9.12)#8618.1%(+9.26)#14,475
28.8910828.1%18.2%(+9.89)#8718.1%(+10.0)#14,724
29.8910430.9%18.2%(+12.7)#8918.1%(+12.8)#15,548
30.8910333.2%18.2%(+15.0)#9018.1%(+15.1)#16,123
31.8915633.8%18.2%(+15.5)#9118.1%(+15.7)#16,314
32.8911034.6%18.2%(+16.4)#9218.1%(+16.5)#16,504
33.8911538.6%18.2%(+20.4)#9418.1%(+20.5)#17,385
34.8910641.6%18.2%(+23.4)#9818.1%(+23.5)#17,938
35.8916942.2%18.2%(+24.0)#10018.1%(+24.1)#18,044
36.8910142.7%18.2%(+24.5)#10118.1%(+24.6)#18,137
37.8910243.8%18.2%(+25.6)#10218.1%(+25.7)#18,307
38.8914351.9%18.2%(+33.7)#10318.1%(+33.9)#19,325
39.8910987.5%18.2%(+69.3)#10718.1%(+69.4)#21,005

Common Questions

What are the Top 10 Zip Codes with the Lowest Poverty Level Among Children Under the Age of 5 in Las Vegas, NV?
Top 10 Zip Codes with the Lowest Poverty Level Among Children Under the Age of 5 in Las Vegas, NV are:
#1
0.0%
#2
0.0%
#3
0.0%
#4
0.0%
#5
0.0%
#6
4.4%
#7
4.5%
#8
5.9%
#9
8.7%
#10
9.8%
What zip code has the Lowest Poverty Level Among Children Under the Age of 5 in Las Vegas, NV?
89135 has the Lowest Poverty Level Among Children Under the Age of 5 in Las Vegas, NV with 4.4%.
What is the Poverty Level Among Children Under the Age of 5 in Las Vegas, NV?
Poverty Level Among Children Under the Age of 5 in Las Vegas is 24.1%.
What is the Poverty Level Among Children Under the Age of 5 in Nevada?
Poverty Level Among Children Under the Age of 5 in Nevada is 18.2%.
What is the Poverty Level Among Children Under the Age of 5 in the United States?
Poverty Level Among Children Under the Age of 5 in the United States is 18.1%.