Poweshiek County, IA Map & Demographics
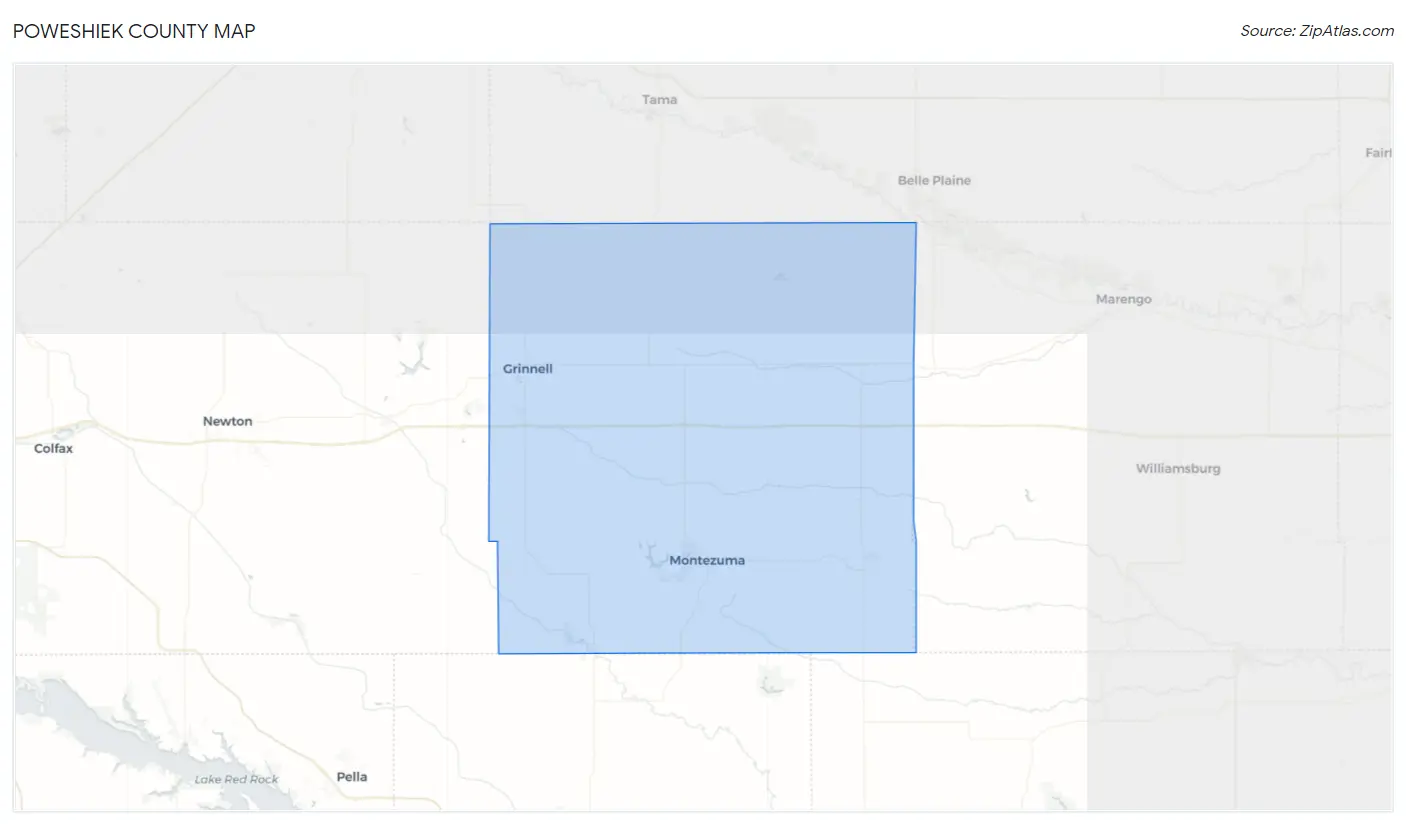
Poweshiek County Map
Poweshiek County Overview
$37,527
PER CAPITA INCOME
$90,108
AVG FAMILY INCOME
$61,192
AVG HOUSEHOLD INCOME
46.9%
WAGE / INCOME GAP [ % ]
53.1¢/ $1
WAGE / INCOME GAP [ $ ]
$9,543
FAMILY INCOME DEFICIT
0.48
INEQUALITY / GINI INDEX
18,608
TOTAL POPULATION
9,129
MALE POPULATION
9,479
FEMALE POPULATION
96.31
MALES / 100 FEMALES
103.83
FEMALES / 100 MALES
40.7
MEDIAN AGE
2.9
AVG FAMILY SIZE
2.2
AVG HOUSEHOLD SIZE
9,668
LABOR FORCE [ PEOPLE ]
62.5%
PERCENT IN LABOR FORCE
4.6%
UNEMPLOYMENT RATE
Income in Poweshiek County
Income Overview in Poweshiek County
Per Capita Income in Poweshiek County is $37,527, while median incomes of families and households are $90,108 and $61,192 respectively.
| Characteristic | Number | Measure |
| Per Capita Income | 18,608 | $37,527 |
| Median Family Income | 4,435 | $90,108 |
| Mean Family Income | 4,435 | $117,154 |
| Median Household Income | 7,761 | $61,192 |
| Mean Household Income | 7,761 | $87,550 |
| Income Deficit | 4,435 | $9,543 |
| Wage / Income Gap (%) | 18,608 | 46.90% |
| Wage / Income Gap ($) | 18,608 | 53.10¢ per $1 |
| Gini / Inequality Index | 18,608 | 0.48 |
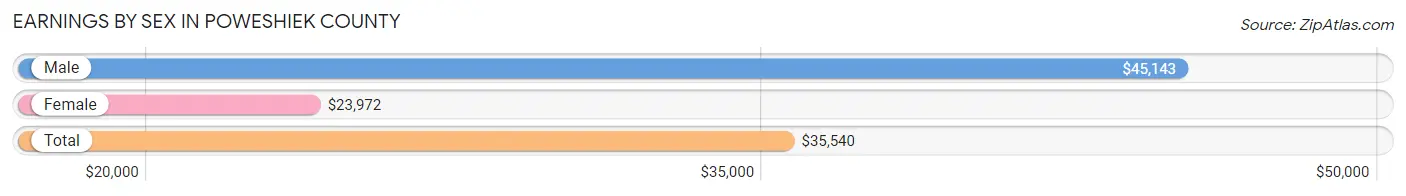
Earnings by Sex in Poweshiek County
Average Earnings in Poweshiek County are $35,540, $45,143 for men and $23,972 for women, a difference of 46.9%.
| Sex | Number | Average Earnings |
| Male | 5,493 (52.4%) | $45,143 |
| Female | 4,979 (47.5%) | $23,972 |
| Total | 10,472 (100.0%) | $35,540 |
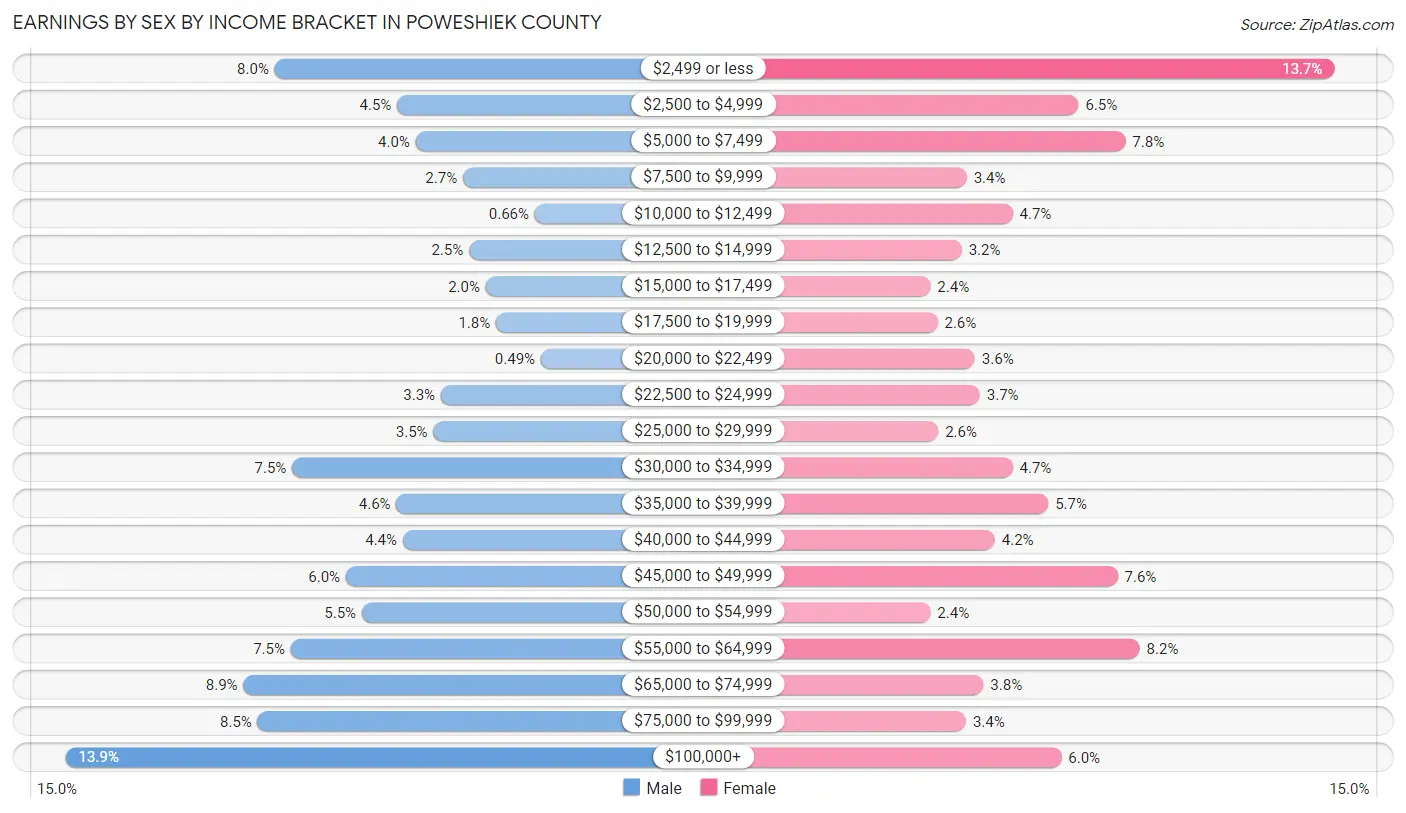
Earnings by Sex by Income Bracket in Poweshiek County
The most common earnings brackets in Poweshiek County are $100,000+ for men (761 | 13.9%) and $2,499 or less for women (682 | 13.7%).
| Income | Male | Female |
| $2,499 or less | 438 (8.0%) | 682 (13.7%) |
| $2,500 to $4,999 | 249 (4.5%) | 324 (6.5%) |
| $5,000 to $7,499 | 220 (4.0%) | 390 (7.8%) |
| $7,500 to $9,999 | 147 (2.7%) | 168 (3.4%) |
| $10,000 to $12,499 | 36 (0.7%) | 232 (4.7%) |
| $12,500 to $14,999 | 138 (2.5%) | 161 (3.2%) |
| $15,000 to $17,499 | 112 (2.0%) | 117 (2.4%) |
| $17,500 to $19,999 | 96 (1.8%) | 127 (2.5%) |
| $20,000 to $22,499 | 27 (0.5%) | 179 (3.6%) |
| $22,500 to $24,999 | 181 (3.3%) | 186 (3.7%) |
| $25,000 to $29,999 | 193 (3.5%) | 128 (2.6%) |
| $30,000 to $34,999 | 411 (7.5%) | 232 (4.7%) |
| $35,000 to $39,999 | 250 (4.5%) | 282 (5.7%) |
| $40,000 to $44,999 | 240 (4.4%) | 207 (4.2%) |
| $45,000 to $49,999 | 328 (6.0%) | 379 (7.6%) |
| $50,000 to $54,999 | 303 (5.5%) | 117 (2.4%) |
| $55,000 to $64,999 | 413 (7.5%) | 410 (8.2%) |
| $65,000 to $74,999 | 486 (8.8%) | 191 (3.8%) |
| $75,000 to $99,999 | 464 (8.5%) | 167 (3.4%) |
| $100,000+ | 761 (13.9%) | 300 (6.0%) |
| Total | 5,493 (100.0%) | 4,979 (100.0%) |
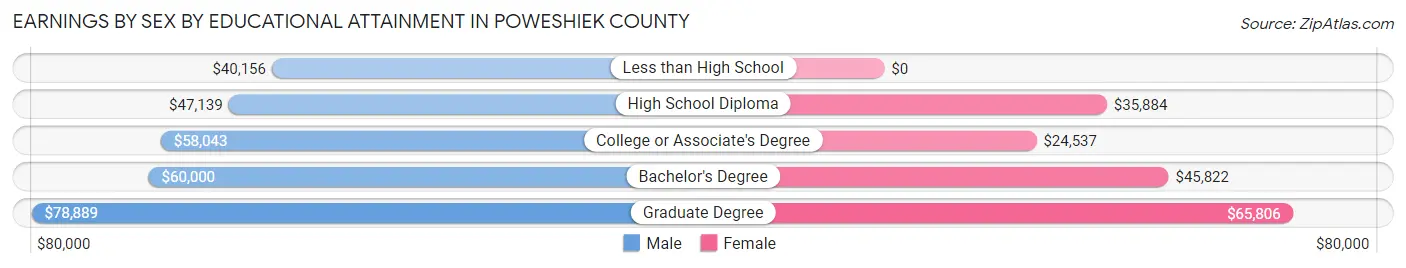
Earnings by Sex by Educational Attainment in Poweshiek County
Average earnings in Poweshiek County are $53,935 for men and $37,992 for women, a difference of 29.6%. Men with an educational attainment of graduate degree enjoy the highest average annual earnings of $78,889, while those with less than high school education earn the least with $40,156. Women with an educational attainment of graduate degree earn the most with the average annual earnings of $65,806, while those with college or associate's degree education have the smallest earnings of $24,537.
| Educational Attainment | Male Income | Female Income |
| Less than High School | $40,156 | $0 |
| High School Diploma | $47,139 | $35,884 |
| College or Associate's Degree | $58,043 | $24,537 |
| Bachelor's Degree | $60,000 | $45,822 |
| Graduate Degree | $78,889 | $65,806 |
| Total | $53,935 | $37,992 |
Family Income in Poweshiek County
Family Income Brackets in Poweshiek County
According to the Poweshiek County family income data, there are 1,051 families falling into the $100,000 to $149,999 income range, which is the most common income bracket and makes up 23.7% of all families. Conversely, the less than $10,000 income bracket is the least frequent group with only 80 families (1.8%) belonging to this category.
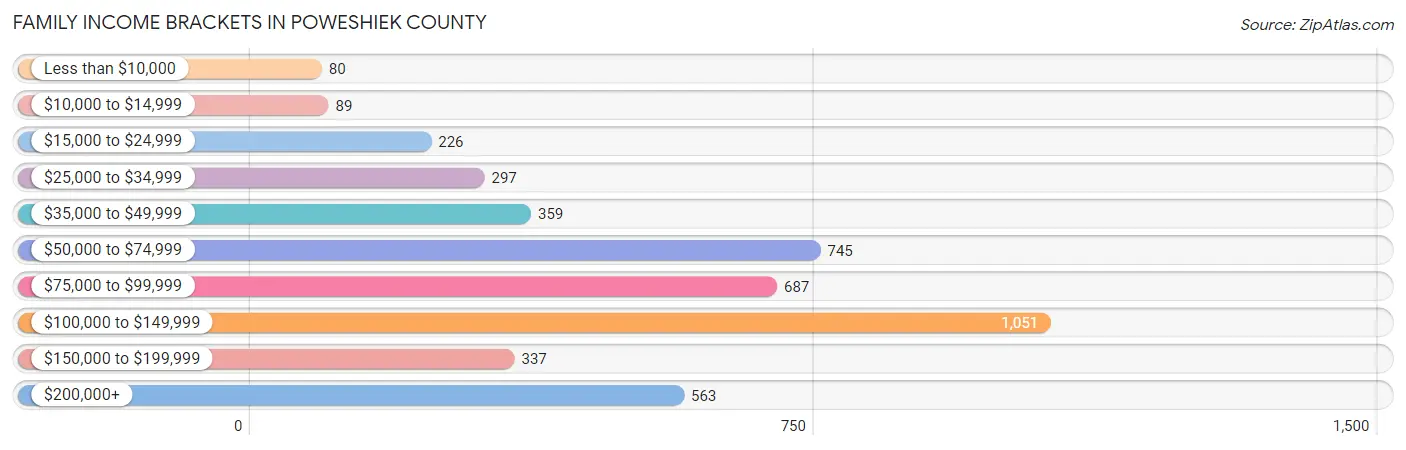
| Income Bracket | # Families | % Families |
| Less than $10,000 | 80 | 1.8% |
| $10,000 to $14,999 | 89 | 2.0% |
| $15,000 to $24,999 | 226 | 5.1% |
| $25,000 to $34,999 | 297 | 6.7% |
| $35,000 to $49,999 | 359 | 8.1% |
| $50,000 to $74,999 | 745 | 16.8% |
| $75,000 to $99,999 | 687 | 15.5% |
| $100,000 to $149,999 | 1,051 | 23.7% |
| $150,000 to $199,999 | 337 | 7.6% |
| $200,000+ | 563 | 12.7% |
Family Income by Famaliy Size in Poweshiek County
6-person families (135 | 3.0%) account for the highest median family income in Poweshiek County with $129,063 per family, while 2-person families (2,452 | 55.3%) have the highest median income of $39,764 per family member.
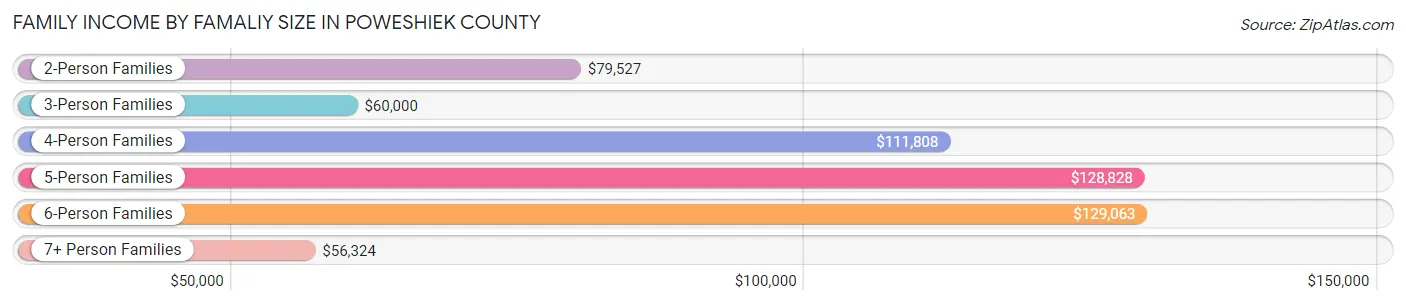
| Income Bracket | # Families | Median Income |
| 2-Person Families | 2,452 (55.3%) | $79,527 |
| 3-Person Families | 752 (17.0%) | $60,000 |
| 4-Person Families | 717 (16.2%) | $111,808 |
| 5-Person Families | 359 (8.1%) | $128,828 |
| 6-Person Families | 135 (3.0%) | $129,063 |
| 7+ Person Families | 20 (0.4%) | $56,324 |
| Total | 4,435 (100.0%) | $90,108 |
Family Income by Number of Earners in Poweshiek County
The median family income in Poweshiek County is $90,108, with families comprising 3+ earners (367) having the highest median family income of $136,322, while families with no earners (849) have the lowest median family income of $56,161, accounting for 8.3% and 19.1% of families, respectively.
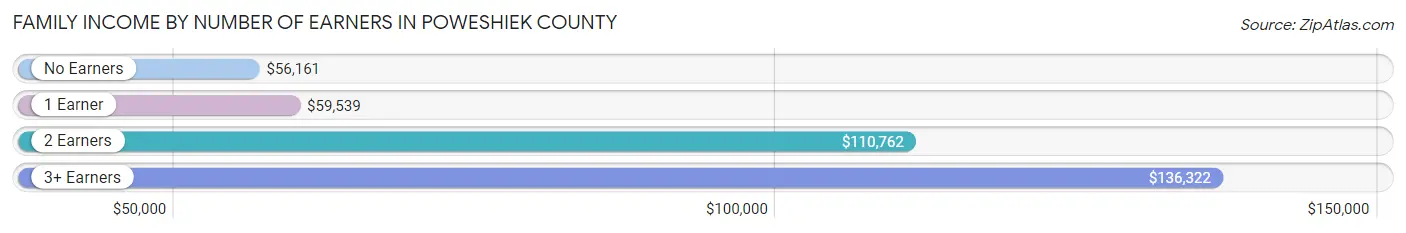
| Number of Earners | # Families | Median Income |
| No Earners | 849 (19.1%) | $56,161 |
| 1 Earner | 1,143 (25.8%) | $59,539 |
| 2 Earners | 2,076 (46.8%) | $110,762 |
| 3+ Earners | 367 (8.3%) | $136,322 |
| Total | 4,435 (100.0%) | $90,108 |
Household Income in Poweshiek County
Household Income Brackets in Poweshiek County
With 1,405 households falling in the category, the $50,000 to $74,999 income range is the most frequent in Poweshiek County, accounting for 18.1% of all households. In contrast, only 357 households (4.6%) fall into the less than $10,000 income bracket, making it the least populous group.
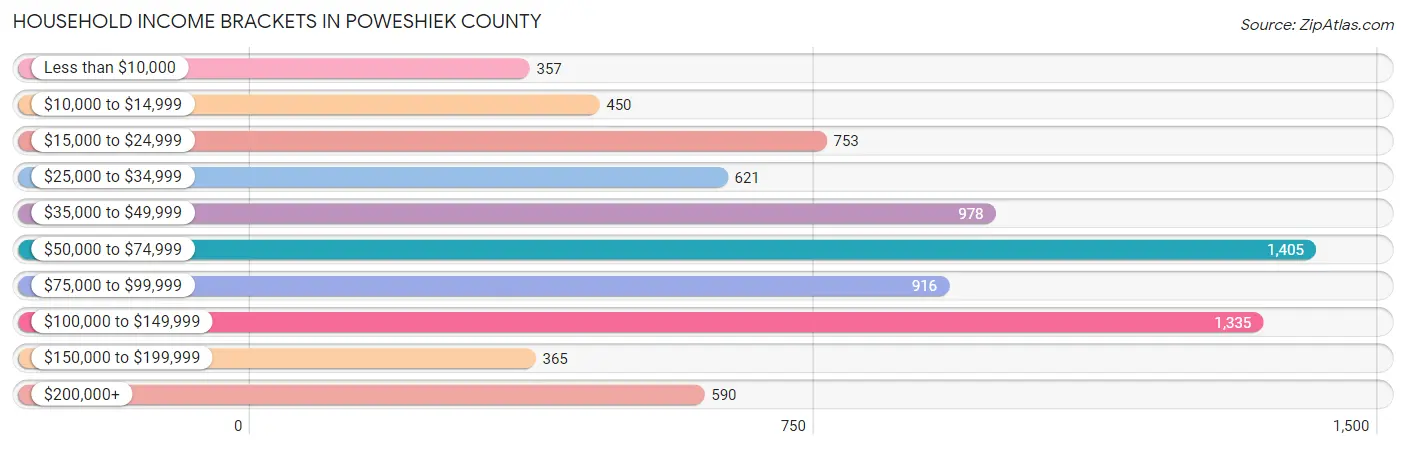
| Income Bracket | # Households | % Households |
| Less than $10,000 | 357 | 4.6% |
| $10,000 to $14,999 | 450 | 5.8% |
| $15,000 to $24,999 | 753 | 9.7% |
| $25,000 to $34,999 | 621 | 8.0% |
| $35,000 to $49,999 | 978 | 12.6% |
| $50,000 to $74,999 | 1,405 | 18.1% |
| $75,000 to $99,999 | 916 | 11.8% |
| $100,000 to $149,999 | 1,335 | 17.2% |
| $150,000 to $199,999 | 365 | 4.7% |
| $200,000+ | 590 | 7.6% |
Household Income by Householder Age in Poweshiek County
The median household income in Poweshiek County is $61,192, with the highest median household income of $81,122 found in the 25 to 44 years age bracket for the primary householder. A total of 2,072 households (26.7%) fall into this category. Meanwhile, the 15 to 24 years age bracket for the primary householder has the lowest median household income of $39,673, with 391 households (5.0%) in this group.
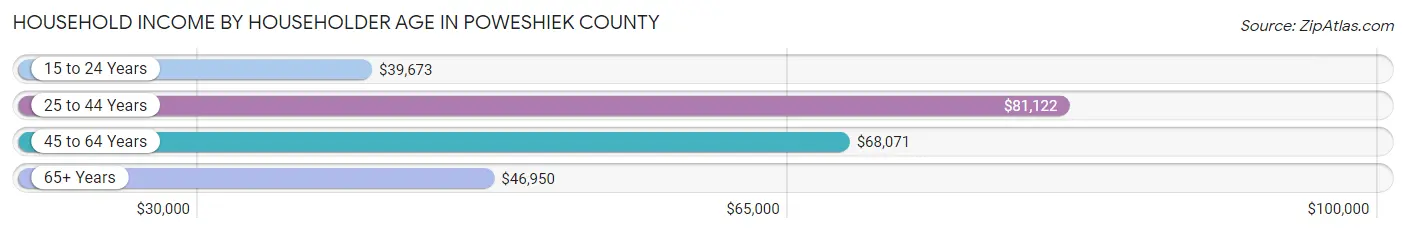
| Income Bracket | # Households | Median Income |
| 15 to 24 Years | 391 (5.0%) | $39,673 |
| 25 to 44 Years | 2,072 (26.7%) | $81,122 |
| 45 to 64 Years | 2,832 (36.5%) | $68,071 |
| 65+ Years | 2,466 (31.8%) | $46,950 |
| Total | 7,761 (100.0%) | $61,192 |
Poverty in Poweshiek County
Income Below Poverty by Sex and Age in Poweshiek County
With 7.5% poverty level for males and 14.1% for females among the residents of Poweshiek County, 18 to 24 year old males and 18 to 24 year old females are the most vulnerable to poverty, with 171 males (17.4%) and 127 females (28.4%) in their respective age groups living below the poverty level.
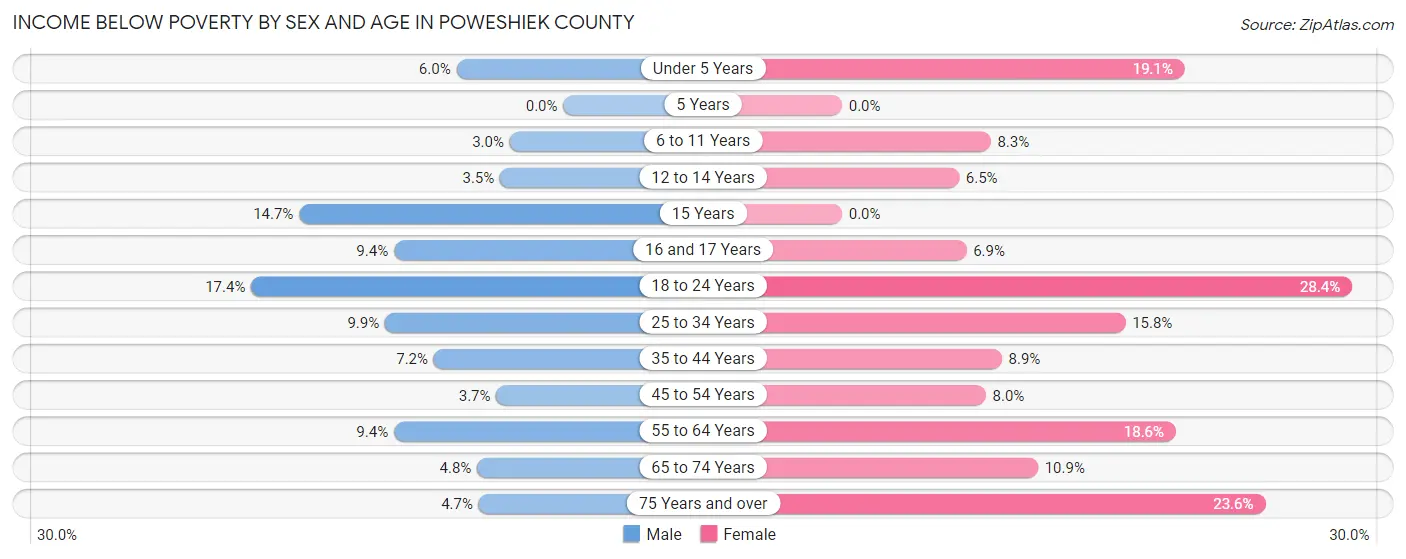
| Age Bracket | Male | Female |
| Under 5 Years | 27 (5.9%) | 76 (19.1%) |
| 5 Years | 0 (0.0%) | 0 (0.0%) |
| 6 to 11 Years | 18 (3.0%) | 55 (8.3%) |
| 12 to 14 Years | 10 (3.5%) | 26 (6.5%) |
| 15 Years | 10 (14.7%) | 0 (0.0%) |
| 16 and 17 Years | 25 (9.4%) | 19 (6.9%) |
| 18 to 24 Years | 171 (17.4%) | 127 (28.4%) |
| 25 to 34 Years | 85 (9.9%) | 148 (15.8%) |
| 35 to 44 Years | 69 (7.2%) | 87 (8.9%) |
| 45 to 54 Years | 39 (3.7%) | 81 (8.0%) |
| 55 to 64 Years | 111 (9.4%) | 240 (18.6%) |
| 65 to 74 Years | 48 (4.8%) | 111 (10.9%) |
| 75 Years and over | 33 (4.7%) | 212 (23.6%) |
| Total | 646 (7.5%) | 1,182 (14.1%) |
Income Above Poverty by Sex and Age in Poweshiek County
According to the poverty statistics in Poweshiek County, males aged 5 years and females aged 5 years are the age groups that are most secure financially, with 100.0% of males and 100.0% of females in these age groups living above the poverty line.
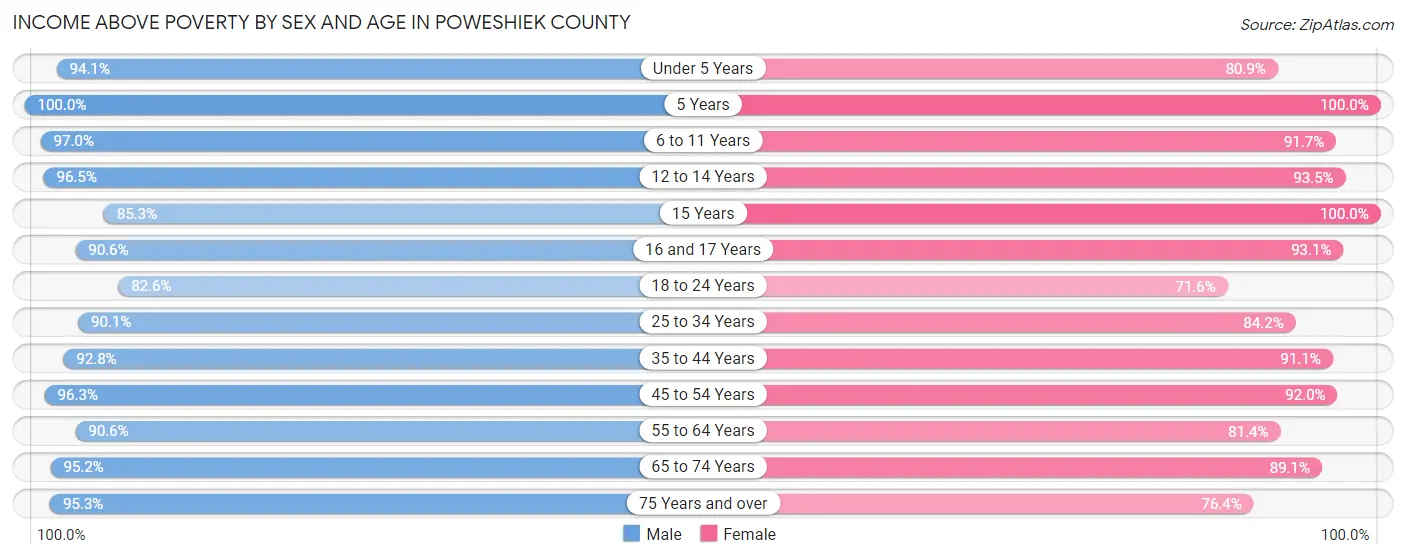
| Age Bracket | Male | Female |
| Under 5 Years | 427 (94.1%) | 322 (80.9%) |
| 5 Years | 170 (100.0%) | 30 (100.0%) |
| 6 to 11 Years | 587 (97.0%) | 609 (91.7%) |
| 12 to 14 Years | 274 (96.5%) | 373 (93.5%) |
| 15 Years | 58 (85.3%) | 65 (100.0%) |
| 16 and 17 Years | 240 (90.6%) | 255 (93.1%) |
| 18 to 24 Years | 813 (82.6%) | 320 (71.6%) |
| 25 to 34 Years | 771 (90.1%) | 790 (84.2%) |
| 35 to 44 Years | 888 (92.8%) | 891 (91.1%) |
| 45 to 54 Years | 1,007 (96.3%) | 930 (92.0%) |
| 55 to 64 Years | 1,066 (90.6%) | 1,050 (81.4%) |
| 65 to 74 Years | 953 (95.2%) | 906 (89.1%) |
| 75 Years and over | 668 (95.3%) | 687 (76.4%) |
| Total | 7,922 (92.5%) | 7,228 (86.0%) |
Income Below Poverty Among Married-Couple Families in Poweshiek County
The poverty statistics for married-couple families in Poweshiek County show that 2.0% or 71 of the total 3,611 families live below the poverty line. Families with 5 or more children have the highest poverty rate of 33.3%, comprising of 1 families. On the other hand, families with 1 or 2 children have the lowest poverty rate of 0.7%, which includes 7 families.
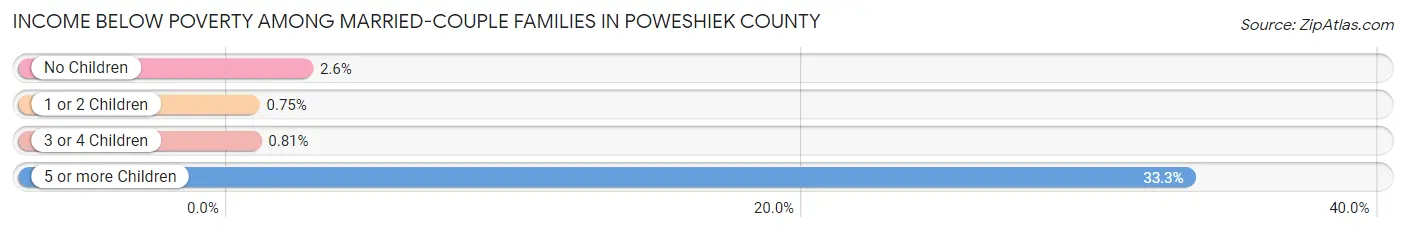
| Children | Above Poverty | Below Poverty |
| No Children | 2,238 (97.4%) | 60 (2.6%) |
| 1 or 2 Children | 931 (99.3%) | 7 (0.7%) |
| 3 or 4 Children | 369 (99.2%) | 3 (0.8%) |
| 5 or more Children | 2 (66.7%) | 1 (33.3%) |
| Total | 3,540 (98.0%) | 71 (2.0%) |
Income Below Poverty Among Single-Parent Households in Poweshiek County
According to the poverty data in Poweshiek County, 25.7% or 97 single-father households and 26.5% or 118 single-mother households are living below the poverty line. Among single-father households, those with 3 or 4 children have the highest poverty rate, with 31 households (93.9%) experiencing poverty. Likewise, among single-mother households, those with 3 or 4 children have the highest poverty rate, with 18 households (56.2%) falling below the poverty line.
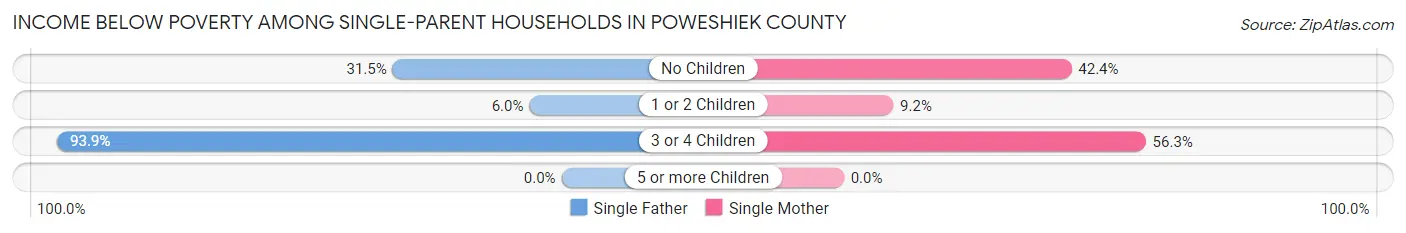
| Children | Single Father | Single Mother |
| No Children | 56 (31.5%) | 81 (42.4%) |
| 1 or 2 Children | 10 (6.0%) | 19 (9.2%) |
| 3 or 4 Children | 31 (93.9%) | 18 (56.2%) |
| 5 or more Children | 0 (0.0%) | 0 (0.0%) |
| Total | 97 (25.7%) | 118 (26.5%) |
Income Below Poverty Among Married-Couple vs Single-Parent Households in Poweshiek County
The poverty data for Poweshiek County shows that 71 of the married-couple family households (2.0%) and 215 of the single-parent households (26.1%) are living below the poverty level. Within the married-couple family households, those with 5 or more children have the highest poverty rate, with 1 households (33.3%) falling below the poverty line. Among the single-parent households, those with 3 or 4 children have the highest poverty rate, with 49 household (75.4%) living below poverty.
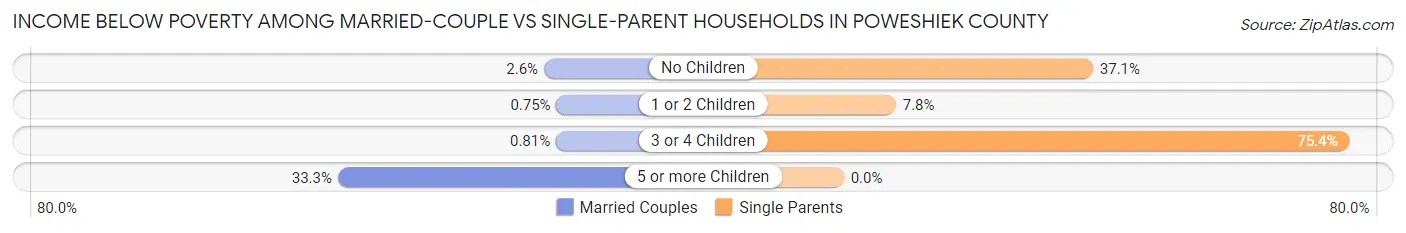
| Children | Married-Couple Families | Single-Parent Households |
| No Children | 60 (2.6%) | 137 (37.1%) |
| 1 or 2 Children | 7 (0.7%) | 29 (7.8%) |
| 3 or 4 Children | 3 (0.8%) | 49 (75.4%) |
| 5 or more Children | 1 (33.3%) | 0 (0.0%) |
| Total | 71 (2.0%) | 215 (26.1%) |
Race in Poweshiek County
The most populous races in Poweshiek County are White / Caucasian (17,179 | 92.3%), Hispanic or Latino (639 | 3.4%), and Two or more Races (558 | 3.0%).
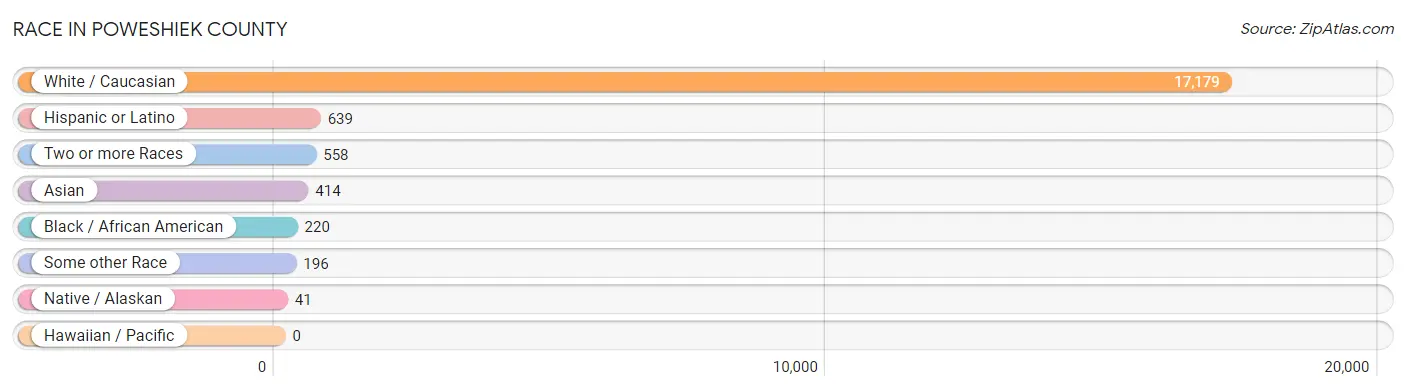
| Race | # Population | % Population |
| Asian | 414 | 2.2% |
| Black / African American | 220 | 1.2% |
| Hawaiian / Pacific | 0 | 0.0% |
| Hispanic or Latino | 639 | 3.4% |
| Native / Alaskan | 41 | 0.2% |
| White / Caucasian | 17,179 | 92.3% |
| Two or more Races | 558 | 3.0% |
| Some other Race | 196 | 1.1% |
| Total | 18,608 | 100.0% |
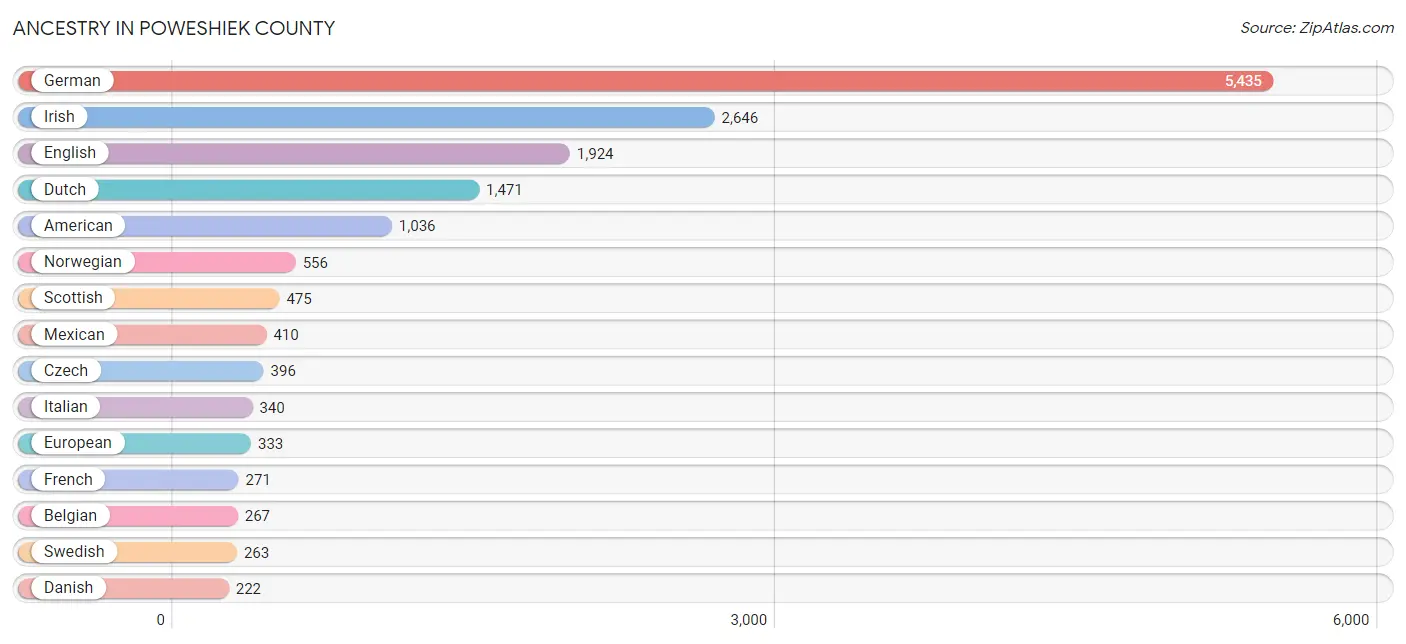
Ancestry in Poweshiek County
The most populous ancestries reported in Poweshiek County are German (5,435 | 29.2%), Irish (2,646 | 14.2%), English (1,924 | 10.3%), Dutch (1,471 | 7.9%), and American (1,036 | 5.6%), together accounting for 67.2% of all Poweshiek County residents.
| Ancestry | # Population | % Population |
| African | 142 | 0.8% |
| Aleut | 5 | 0.0% |
| American | 1,036 | 5.6% |
| Arab | 14 | 0.1% |
| Armenian | 30 | 0.2% |
| Australian | 8 | 0.0% |
| Austrian | 17 | 0.1% |
| Belgian | 267 | 1.4% |
| Bhutanese | 54 | 0.3% |
| Blackfeet | 3 | 0.0% |
| Bolivian | 17 | 0.1% |
| Brazilian | 3 | 0.0% |
| British | 101 | 0.5% |
| Burmese | 132 | 0.7% |
| Canadian | 48 | 0.3% |
| Celtic | 8 | 0.0% |
| Central American | 39 | 0.2% |
| Cherokee | 18 | 0.1% |
| Colombian | 5 | 0.0% |
| Cuban | 5 | 0.0% |
| Czech | 396 | 2.1% |
| Czechoslovakian | 48 | 0.3% |
| Danish | 222 | 1.2% |
| Dominican | 1 | 0.0% |
| Dutch | 1,471 | 7.9% |
| Eastern European | 106 | 0.6% |
| English | 1,924 | 10.3% |
| European | 333 | 1.8% |
| Filipino | 50 | 0.3% |
| Finnish | 8 | 0.0% |
| French | 271 | 1.5% |
| French Canadian | 21 | 0.1% |
| German | 5,435 | 29.2% |
| Greek | 38 | 0.2% |
| Guyanese | 11 | 0.1% |
| Haitian | 20 | 0.1% |
| Honduran | 37 | 0.2% |
| Hungarian | 1 | 0.0% |
| Indian (Asian) | 113 | 0.6% |
| Irish | 2,646 | 14.2% |
| Italian | 340 | 1.8% |
| Korean | 3 | 0.0% |
| Lithuanian | 2 | 0.0% |
| Mexican | 410 | 2.2% |
| Moroccan | 9 | 0.1% |
| Northern European | 14 | 0.1% |
| Norwegian | 556 | 3.0% |
| Palestinian | 5 | 0.0% |
| Pennsylvania German | 8 | 0.0% |
| Polish | 112 | 0.6% |
| Portuguese | 18 | 0.1% |
| Puerto Rican | 47 | 0.3% |
| Russian | 80 | 0.4% |
| Salvadoran | 2 | 0.0% |
| Scandinavian | 79 | 0.4% |
| Scotch-Irish | 129 | 0.7% |
| Scottish | 475 | 2.5% |
| Sioux | 26 | 0.1% |
| South American | 22 | 0.1% |
| Spaniard | 25 | 0.1% |
| Spanish | 26 | 0.1% |
| Sri Lankan | 17 | 0.1% |
| Subsaharan African | 143 | 0.8% |
| Swedish | 263 | 1.4% |
| Swiss | 33 | 0.2% |
| Thai | 103 | 0.5% |
| Trinidadian and Tobagonian | 11 | 0.1% |
| Ukrainian | 8 | 0.0% |
| Welsh | 121 | 0.6% |
| Yugoslavian | 3 | 0.0% |
| Zimbabwean | 1 | 0.0% | View All 71 Rows |
Immigrants in Poweshiek County
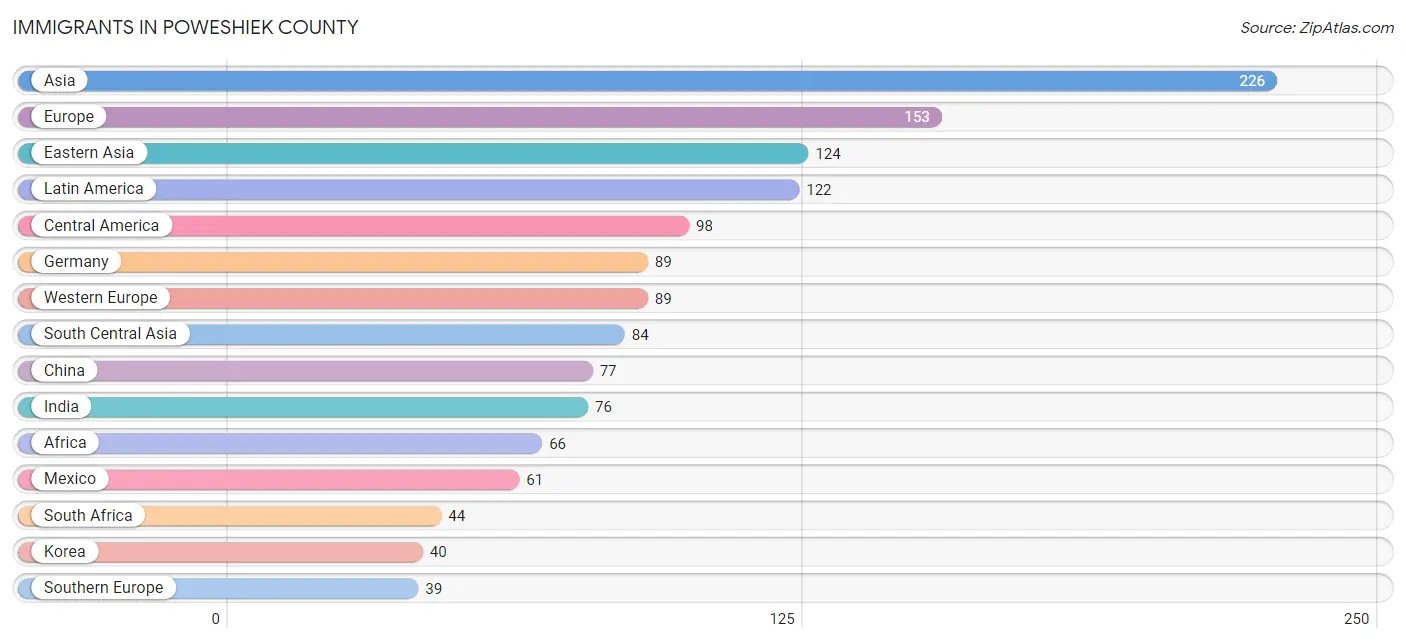
The most numerous immigrant groups reported in Poweshiek County came from Asia (226 | 1.2%), Europe (153 | 0.8%), Eastern Asia (124 | 0.7%), Latin America (122 | 0.7%), and Central America (98 | 0.5%), together accounting for 3.9% of all Poweshiek County residents.
| Immigration Origin | # Population | % Population |
| Africa | 66 | 0.4% |
| Asia | 226 | 1.2% |
| Australia | 1 | 0.0% |
| Brazil | 18 | 0.1% |
| Canada | 25 | 0.1% |
| Caribbean | 1 | 0.0% |
| Central America | 98 | 0.5% |
| China | 77 | 0.4% |
| Colombia | 5 | 0.0% |
| Eastern Africa | 9 | 0.1% |
| Eastern Asia | 124 | 0.7% |
| Eastern Europe | 4 | 0.0% |
| Egypt | 1 | 0.0% |
| Europe | 153 | 0.8% |
| Germany | 89 | 0.5% |
| Ghana | 3 | 0.0% |
| Greece | 27 | 0.2% |
| Haiti | 1 | 0.0% |
| Honduras | 37 | 0.2% |
| Hong Kong | 31 | 0.2% |
| India | 76 | 0.4% |
| Korea | 40 | 0.2% |
| Latin America | 122 | 0.7% |
| Mexico | 61 | 0.3% |
| Morocco | 9 | 0.1% |
| Nepal | 4 | 0.0% |
| Northern Africa | 10 | 0.1% |
| Northern Europe | 21 | 0.1% |
| Oceania | 1 | 0.0% |
| Pakistan | 4 | 0.0% |
| Philippines | 1 | 0.0% |
| Somalia | 9 | 0.1% |
| South Africa | 44 | 0.2% |
| South America | 23 | 0.1% |
| South Central Asia | 84 | 0.4% |
| South Eastern Asia | 18 | 0.1% |
| Southern Europe | 39 | 0.2% |
| Spain | 12 | 0.1% |
| Ukraine | 4 | 0.0% |
| Vietnam | 17 | 0.1% |
| Western Africa | 3 | 0.0% |
| Western Europe | 89 | 0.5% | View All 42 Rows |
Sex and Age in Poweshiek County
Sex and Age in Poweshiek County
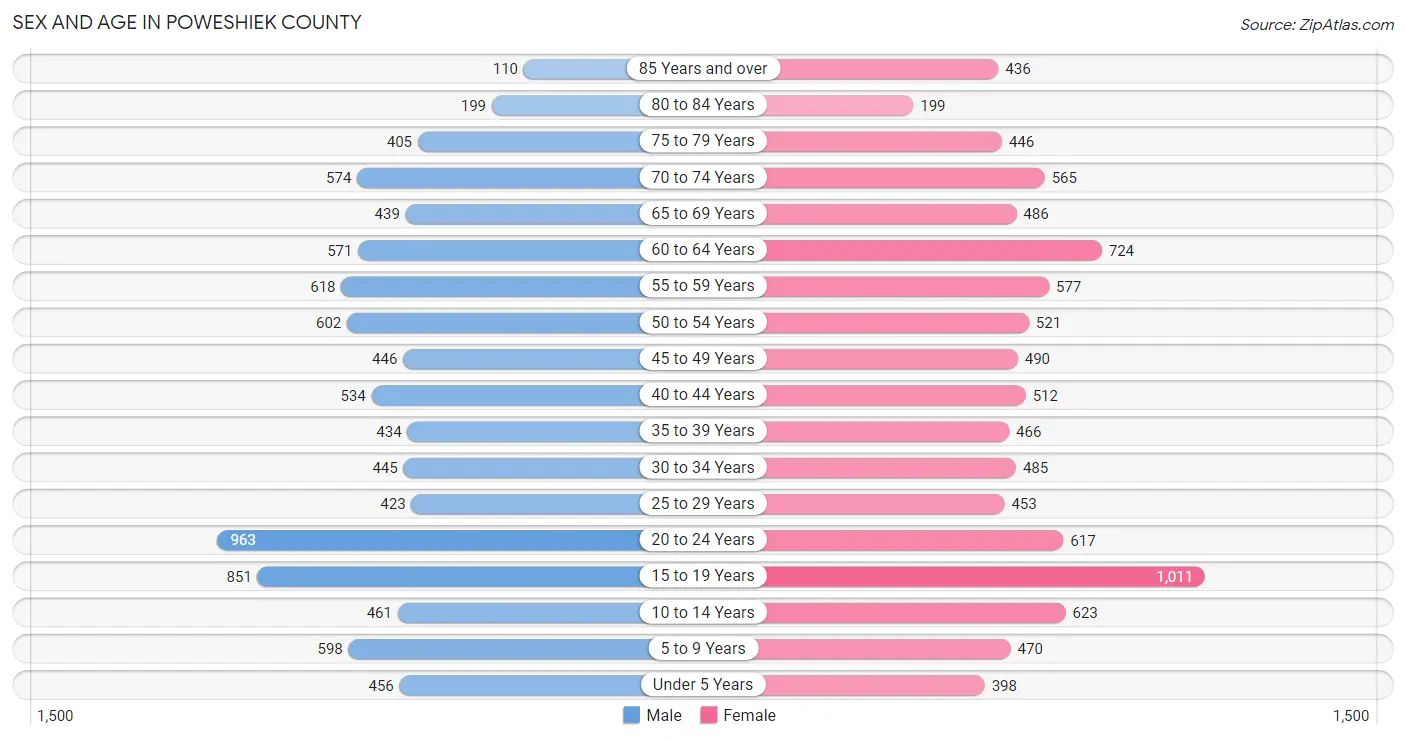
The most populous age groups in Poweshiek County are 20 to 24 Years (963 | 10.5%) for men and 15 to 19 Years (1,011 | 10.7%) for women.
| Age Bracket | Male | Female |
| Under 5 Years | 456 (5.0%) | 398 (4.2%) |
| 5 to 9 Years | 598 (6.6%) | 470 (5.0%) |
| 10 to 14 Years | 461 (5.1%) | 623 (6.6%) |
| 15 to 19 Years | 851 (9.3%) | 1,011 (10.7%) |
| 20 to 24 Years | 963 (10.5%) | 617 (6.5%) |
| 25 to 29 Years | 423 (4.6%) | 453 (4.8%) |
| 30 to 34 Years | 445 (4.9%) | 485 (5.1%) |
| 35 to 39 Years | 434 (4.8%) | 466 (4.9%) |
| 40 to 44 Years | 534 (5.9%) | 512 (5.4%) |
| 45 to 49 Years | 446 (4.9%) | 490 (5.2%) |
| 50 to 54 Years | 602 (6.6%) | 521 (5.5%) |
| 55 to 59 Years | 618 (6.8%) | 577 (6.1%) |
| 60 to 64 Years | 571 (6.2%) | 724 (7.6%) |
| 65 to 69 Years | 439 (4.8%) | 486 (5.1%) |
| 70 to 74 Years | 574 (6.3%) | 565 (6.0%) |
| 75 to 79 Years | 405 (4.4%) | 446 (4.7%) |
| 80 to 84 Years | 199 (2.2%) | 199 (2.1%) |
| 85 Years and over | 110 (1.2%) | 436 (4.6%) |
| Total | 9,129 (100.0%) | 9,479 (100.0%) |
Families and Households in Poweshiek County
Median Family Size in Poweshiek County
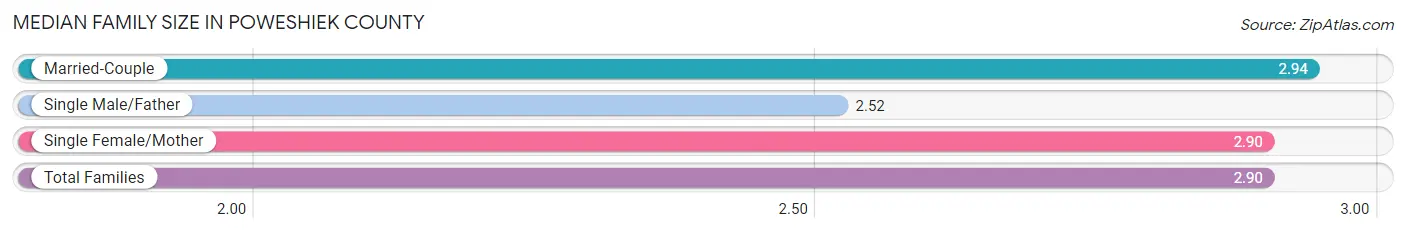
The median family size in Poweshiek County is 2.90 persons per family, with married-couple families (3,611 | 81.4%) accounting for the largest median family size of 2.94 persons per family. On the other hand, single male/father families (378 | 8.5%) represent the smallest median family size with 2.52 persons per family.
| Family Type | # Families | Family Size |
| Married-Couple | 3,611 (81.4%) | 2.94 |
| Single Male/Father | 378 (8.5%) | 2.52 |
| Single Female/Mother | 446 (10.1%) | 2.90 |
| Total Families | 4,435 (100.0%) | 2.90 |
Median Household Size in Poweshiek County
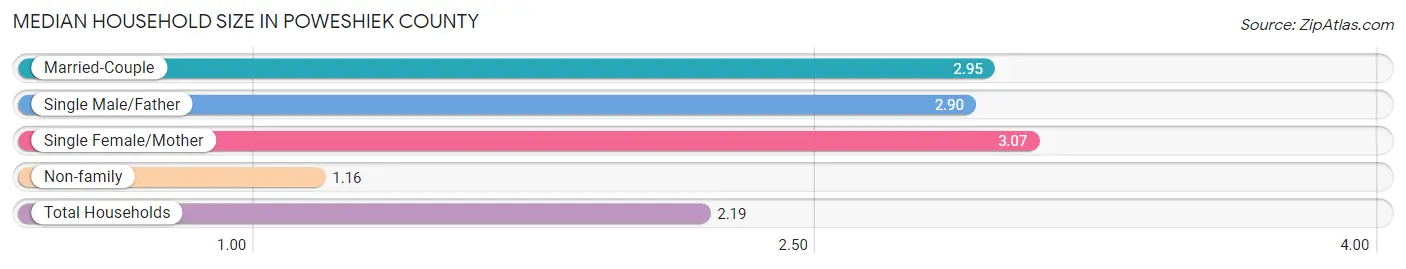
The median household size in Poweshiek County is 2.19 persons per household, with single female/mother households (446 | 5.8%) accounting for the largest median household size of 3.07 persons per household. non-family households (3,326 | 42.9%) represent the smallest median household size with 1.16 persons per household.
| Household Type | # Households | Household Size |
| Married-Couple | 3,611 (46.5%) | 2.95 |
| Single Male/Father | 378 (4.9%) | 2.90 |
| Single Female/Mother | 446 (5.8%) | 3.07 |
| Non-family | 3,326 (42.9%) | 1.16 |
| Total Households | 7,761 (100.0%) | 2.19 |
Household Size by Marriage Status in Poweshiek County
Out of a total of 7,761 households in Poweshiek County, 4,435 (57.1%) are family households, while 3,326 (42.9%) are nonfamily households. The most numerous type of family households are 2-person households, comprising 2,415, and the most common type of nonfamily households are 1-person households, comprising 2,835.
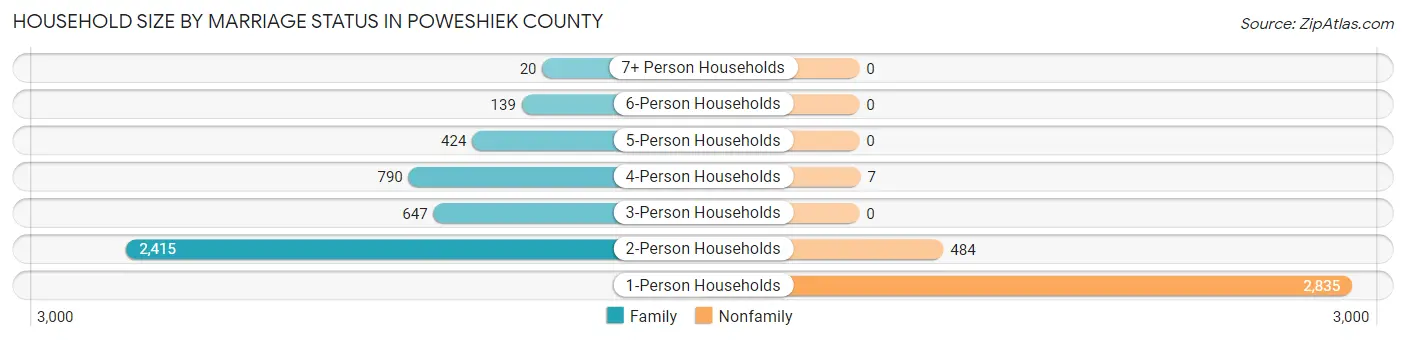
| Household Size | Family Households | Nonfamily Households |
| 1-Person Households | - | 2,835 (36.5%) |
| 2-Person Households | 2,415 (31.1%) | 484 (6.2%) |
| 3-Person Households | 647 (8.3%) | 0 (0.0%) |
| 4-Person Households | 790 (10.2%) | 7 (0.1%) |
| 5-Person Households | 424 (5.5%) | 0 (0.0%) |
| 6-Person Households | 139 (1.8%) | 0 (0.0%) |
| 7+ Person Households | 20 (0.3%) | 0 (0.0%) |
| Total | 4,435 (57.1%) | 3,326 (42.9%) |
Female Fertility in Poweshiek County
Fertility by Age in Poweshiek County
Average fertility rate in Poweshiek County is 27.0 births per 1,000 women. Women in the age bracket of 20 to 34 years have the highest fertility rate with 70.0 births per 1,000 women. Women in the age bracket of 20 to 34 years acount for 96.5% of all women with births.
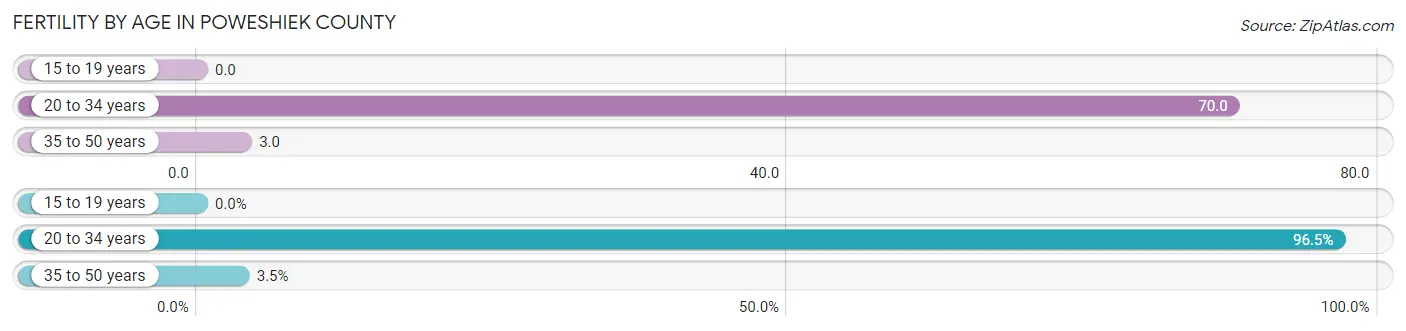
| Age Bracket | Women with Births | Births / 1,000 Women |
| 15 to 19 years | 0 (0.0%) | 0.0 |
| 20 to 34 years | 109 (96.5%) | 70.0 |
| 35 to 50 years | 4 (3.5%) | 3.0 |
| Total | 113 (100.0%) | 27.0 |
Fertility by Age by Marriage Status in Poweshiek County
65.5% of women with births (113) in Poweshiek County are married. The highest percentage of unmarried women with births falls into 20 to 34 years age bracket with 35.8% of them unmarried at the time of birth, while the lowest percentage of unmarried women with births belong to 35 to 50 years age bracket with 0.0% of them unmarried.
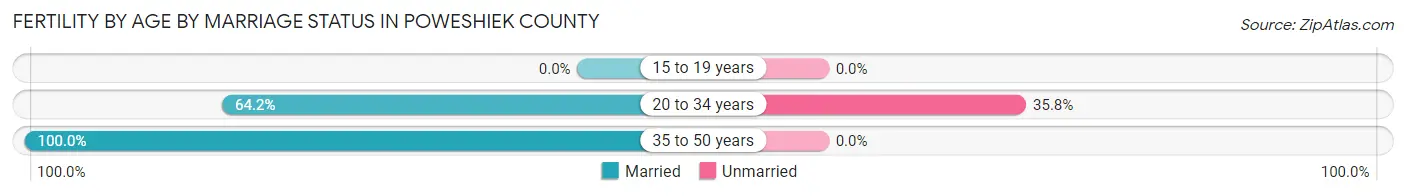
| Age Bracket | Married | Unmarried |
| 15 to 19 years | 0 (0.0%) | 0 (0.0%) |
| 20 to 34 years | 70 (64.2%) | 39 (35.8%) |
| 35 to 50 years | 4 (100.0%) | 0 (0.0%) |
| Total | 74 (65.5%) | 39 (34.5%) |
Fertility by Education in Poweshiek County
Average fertility rate in Poweshiek County is 27.0 births per 1,000 women. Women with the education attainment of less than high school have the highest fertility rate of 98.0 births per 1,000 women, while women with the education attainment of high school diploma have the lowest fertility at 5.0 births per 1,000 women. Women with the education attainment of less than high school represent 38.1% of all women with births.

| Educational Attainment | Women with Births | Births / 1,000 Women |
| Less than High School | 43 (38.1%) | 98.0 |
| High School Diploma | 4 (3.5%) | 5.0 |
| College or Associate's Degree | 10 (8.8%) | 6.0 |
| Bachelor's Degree | 34 (30.1%) | 53.0 |
| Graduate Degree | 22 (19.5%) | 48.0 |
| Total | 113 (100.0%) | 27.0 |
Fertility by Education by Marriage Status in Poweshiek County
34.5% of women with births in Poweshiek County are unmarried. Women with the educational attainment of high school diploma are most likely to be married with 100.0% of them married at childbirth, while women with the educational attainment of less than high school are least likely to be married with 90.7% of them unmarried at childbirth.
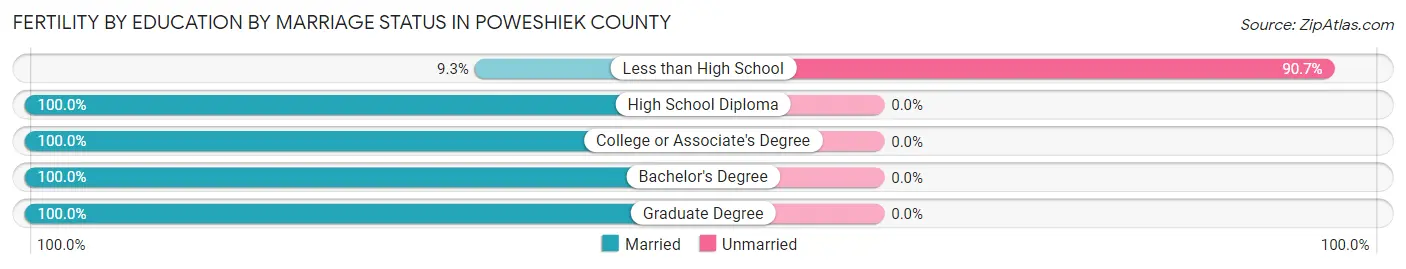
| Educational Attainment | Married | Unmarried |
| Less than High School | 4 (9.3%) | 39 (90.7%) |
| High School Diploma | 4 (100.0%) | 0 (0.0%) |
| College or Associate's Degree | 10 (100.0%) | 0 (0.0%) |
| Bachelor's Degree | 34 (100.0%) | 0 (0.0%) |
| Graduate Degree | 22 (100.0%) | 0 (0.0%) |
| Total | 74 (65.5%) | 39 (34.5%) |
Employment Characteristics in Poweshiek County
Employment by Class of Employer in Poweshiek County
Among the 8,988 employed individuals in Poweshiek County, private company employees (5,175 | 57.6%), not-for-profit organizations (1,350 | 15.0%), and self-employed (not incorporated) (913 | 10.2%) make up the most common classes of employment.
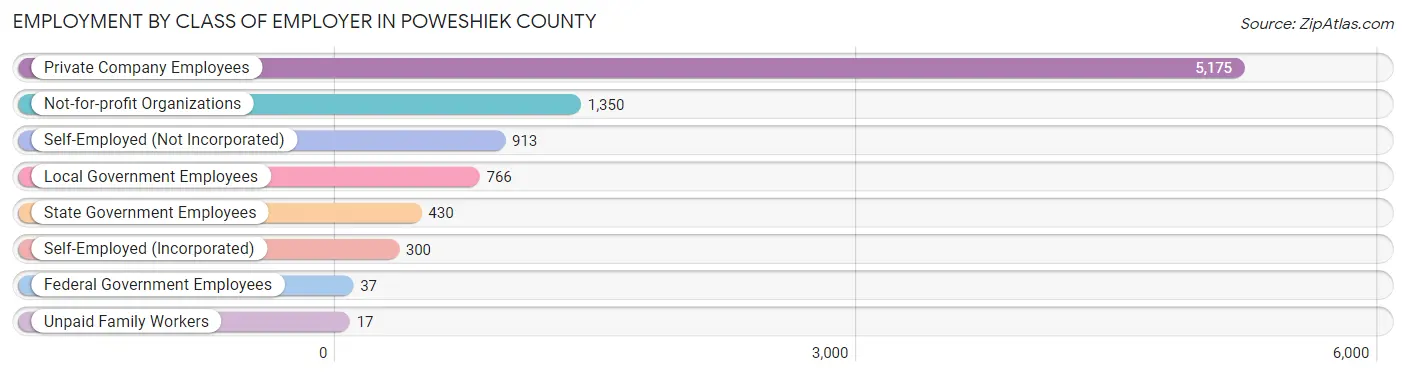
| Employer Class | # Employees | % Employees |
| Private Company Employees | 5,175 | 57.6% |
| Self-Employed (Incorporated) | 300 | 3.3% |
| Self-Employed (Not Incorporated) | 913 | 10.2% |
| Not-for-profit Organizations | 1,350 | 15.0% |
| Local Government Employees | 766 | 8.5% |
| State Government Employees | 430 | 4.8% |
| Federal Government Employees | 37 | 0.4% |
| Unpaid Family Workers | 17 | 0.2% |
| Total | 8,988 | 100.0% |
Employment Status by Age in Poweshiek County
According to the labor force statistics for Poweshiek County, out of the total population over 16 years of age (15,469), 62.5% or 9,668 individuals are in the labor force, with 4.6% or 445 of them unemployed. The age group with the highest labor force participation rate is 45 to 54 years, with 92.6% or 1,907 individuals in the labor force. Within the labor force, the 65 to 74 years age range has the highest percentage of unemployed individuals, with 14.1% or 87 of them being unemployed.
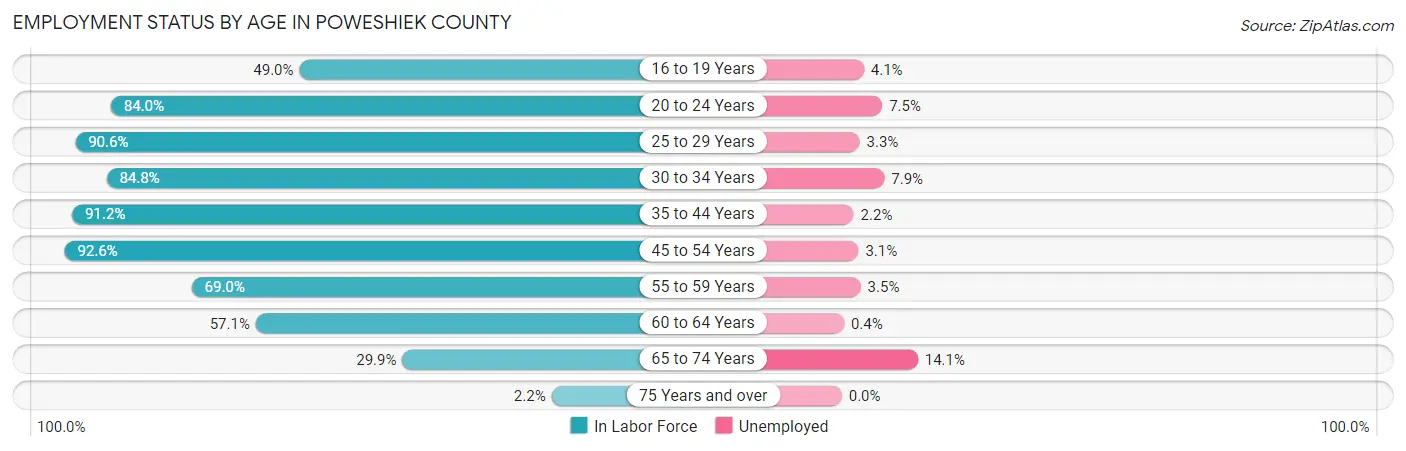
| Age Bracket | In Labor Force | Unemployed |
| 16 to 19 Years | 847 (49.0%) | 35 (4.1%) |
| 20 to 24 Years | 1,327 (84.0%) | 100 (7.5%) |
| 25 to 29 Years | 794 (90.6%) | 26 (3.3%) |
| 30 to 34 Years | 789 (84.8%) | 62 (7.9%) |
| 35 to 44 Years | 1,775 (91.2%) | 39 (2.2%) |
| 45 to 54 Years | 1,907 (92.6%) | 59 (3.1%) |
| 55 to 59 Years | 825 (69.0%) | 29 (3.5%) |
| 60 to 64 Years | 739 (57.1%) | 3 (0.4%) |
| 65 to 74 Years | 617 (29.9%) | 87 (14.1%) |
| 75 Years and over | 39 (2.2%) | 0 (0.0%) |
| Total | 9,668 (62.5%) | 445 (4.6%) |
Employment Status by Educational Attainment in Poweshiek County
According to labor force statistics for Poweshiek County, 82.3% of individuals (6,832) out of the total population between 25 and 64 years of age (8,301) are in the labor force, with 3.2% or 219 of them being unemployed. The group with the highest labor force participation rate are those with the educational attainment of bachelor's degree or higher, with 94.9% or 2,342 individuals in the labor force. Within the labor force, individuals with less than high school education have the highest percentage of unemployment, with 22.8% or 58 of them being unemployed.
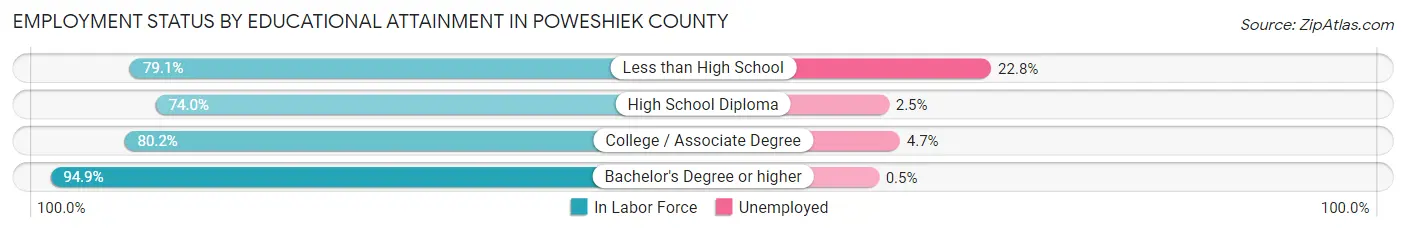
| Educational Attainment | In Labor Force | Unemployed |
| Less than High School | 254 (79.1%) | 73 (22.8%) |
| High School Diploma | 2,268 (74.0%) | 77 (2.5%) |
| College / Associate Degree | 1,962 (80.2%) | 115 (4.7%) |
| Bachelor's Degree or higher | 2,342 (94.9%) | 12 (0.5%) |
| Total | 6,832 (82.3%) | 266 (3.2%) |
Employment Occupations by Sex in Poweshiek County
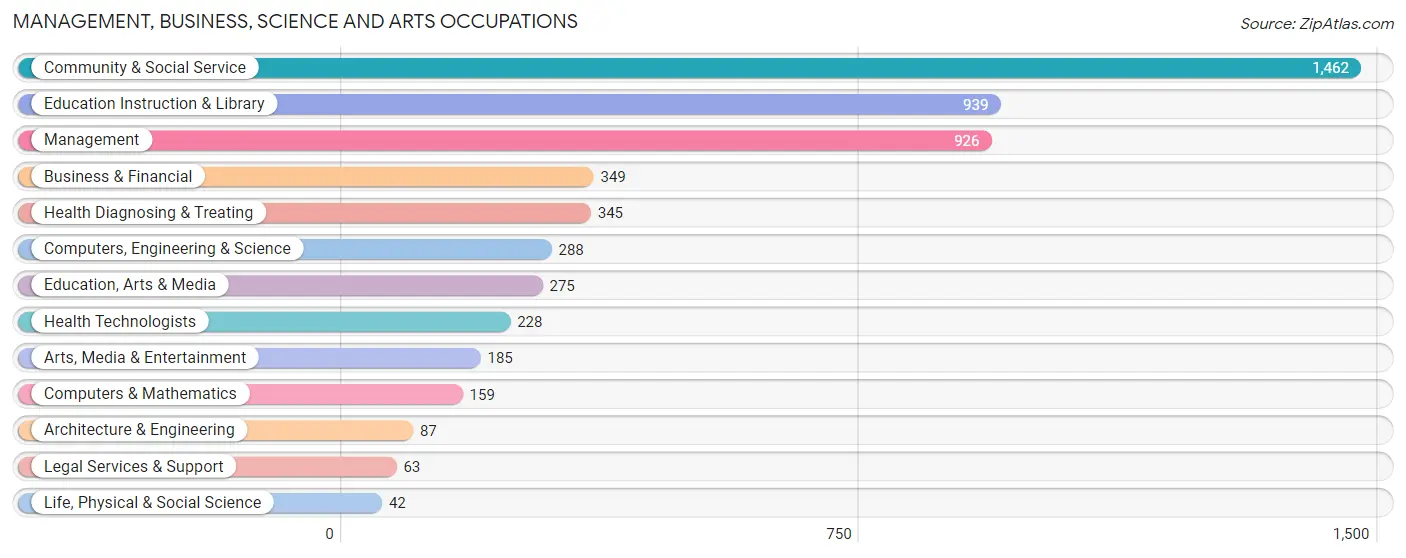
Management, Business, Science and Arts Occupations
The most common Management, Business, Science and Arts occupations in Poweshiek County are Community & Social Service (1,462 | 15.9%), Education Instruction & Library (939 | 10.2%), Management (926 | 10.0%), Business & Financial (349 | 3.8%), and Health Diagnosing & Treating (345 | 3.7%).
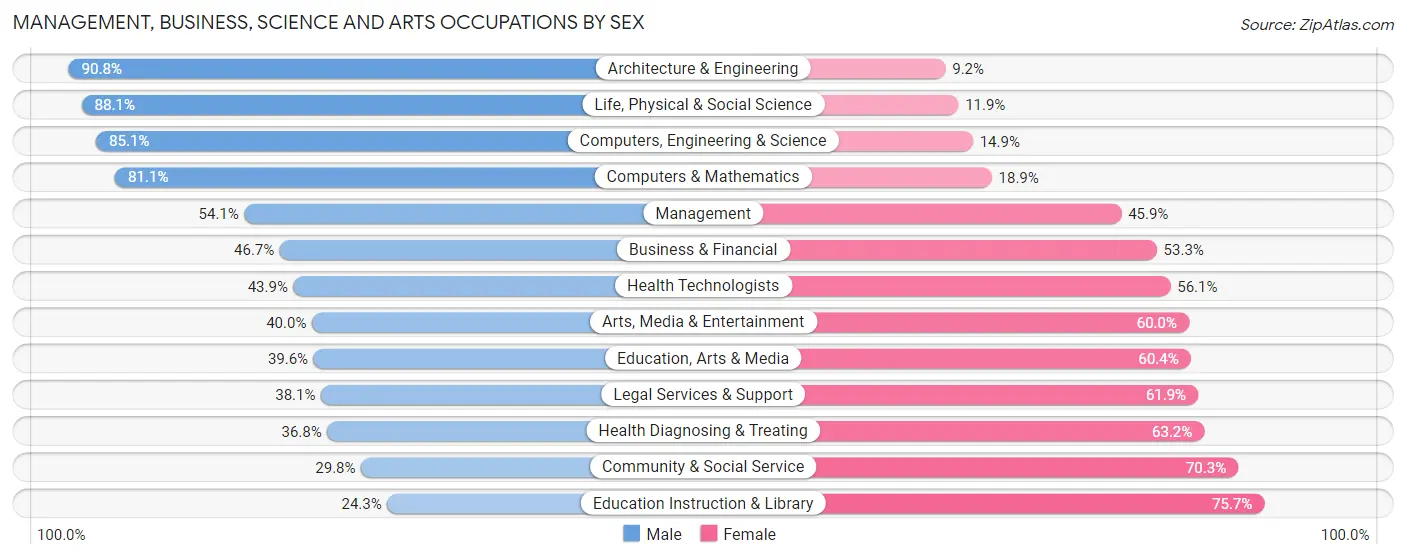
Management, Business, Science and Arts Occupations by Sex
Within the Management, Business, Science and Arts occupations in Poweshiek County, the most male-oriented occupations are Architecture & Engineering (90.8%), Life, Physical & Social Science (88.1%), and Computers, Engineering & Science (85.1%), while the most female-oriented occupations are Education Instruction & Library (75.7%), Community & Social Service (70.3%), and Health Diagnosing & Treating (63.2%).
| Occupation | Male | Female |
| Management | 501 (54.1%) | 425 (45.9%) |
| Business & Financial | 163 (46.7%) | 186 (53.3%) |
| Computers, Engineering & Science | 245 (85.1%) | 43 (14.9%) |
| Computers & Mathematics | 129 (81.1%) | 30 (18.9%) |
| Architecture & Engineering | 79 (90.8%) | 8 (9.2%) |
| Life, Physical & Social Science | 37 (88.1%) | 5 (11.9%) |
| Community & Social Service | 435 (29.7%) | 1,027 (70.3%) |
| Education, Arts & Media | 109 (39.6%) | 166 (60.4%) |
| Legal Services & Support | 24 (38.1%) | 39 (61.9%) |
| Education Instruction & Library | 228 (24.3%) | 711 (75.7%) |
| Arts, Media & Entertainment | 74 (40.0%) | 111 (60.0%) |
| Health Diagnosing & Treating | 127 (36.8%) | 218 (63.2%) |
| Health Technologists | 100 (43.9%) | 128 (56.1%) |
| Total (Category) | 1,471 (43.6%) | 1,899 (56.4%) |
| Total (Overall) | 4,781 (51.8%) | 4,439 (48.1%) |
Services Occupations
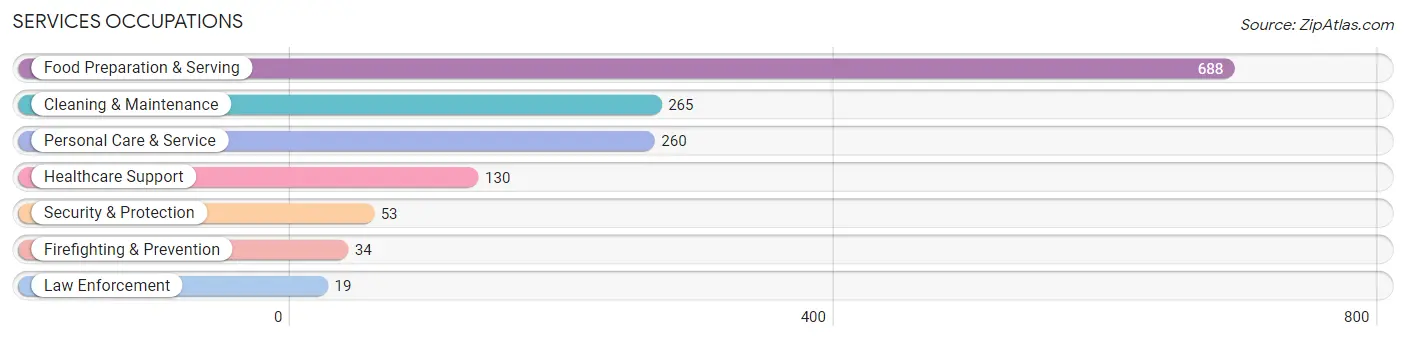
The most common Services occupations in Poweshiek County are Food Preparation & Serving (688 | 7.5%), Cleaning & Maintenance (265 | 2.9%), Personal Care & Service (260 | 2.8%), Healthcare Support (130 | 1.4%), and Security & Protection (53 | 0.6%).
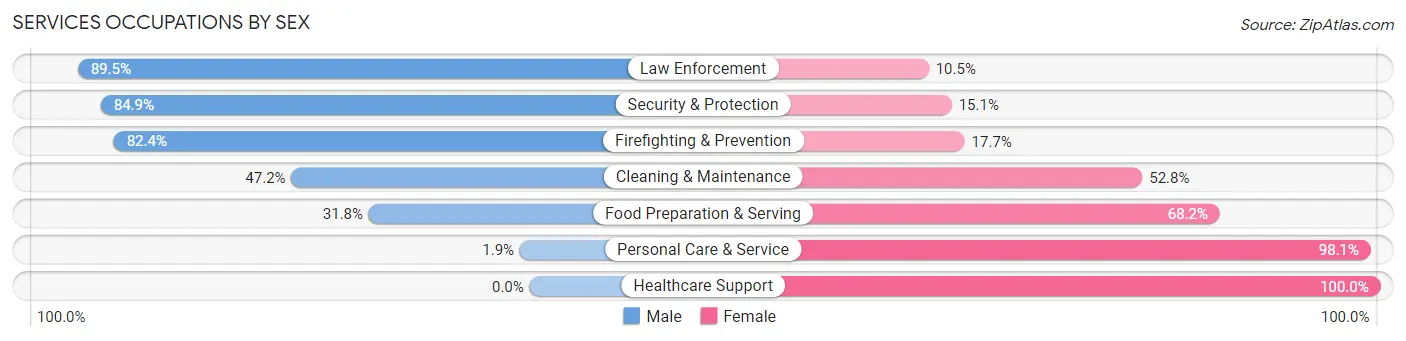
Services Occupations by Sex
Within the Services occupations in Poweshiek County, the most male-oriented occupations are Law Enforcement (89.5%), Security & Protection (84.9%), and Firefighting & Prevention (82.4%), while the most female-oriented occupations are Healthcare Support (100.0%), Personal Care & Service (98.1%), and Food Preparation & Serving (68.2%).
| Occupation | Male | Female |
| Healthcare Support | 0 (0.0%) | 130 (100.0%) |
| Security & Protection | 45 (84.9%) | 8 (15.1%) |
| Firefighting & Prevention | 28 (82.4%) | 6 (17.6%) |
| Law Enforcement | 17 (89.5%) | 2 (10.5%) |
| Food Preparation & Serving | 219 (31.8%) | 469 (68.2%) |
| Cleaning & Maintenance | 125 (47.2%) | 140 (52.8%) |
| Personal Care & Service | 5 (1.9%) | 255 (98.1%) |
| Total (Category) | 394 (28.2%) | 1,002 (71.8%) |
| Total (Overall) | 4,781 (51.8%) | 4,439 (48.1%) |
Sales and Office Occupations
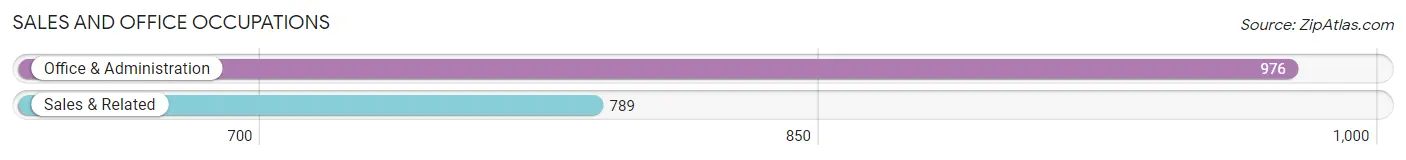
The most common Sales and Office occupations in Poweshiek County are Office & Administration (976 | 10.6%), and Sales & Related (789 | 8.6%).
Sales and Office Occupations by Sex
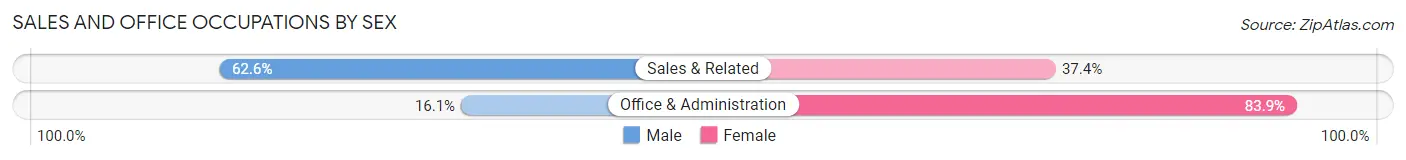
| Occupation | Male | Female |
| Sales & Related | 494 (62.6%) | 295 (37.4%) |
| Office & Administration | 157 (16.1%) | 819 (83.9%) |
| Total (Category) | 651 (36.9%) | 1,114 (63.1%) |
| Total (Overall) | 4,781 (51.8%) | 4,439 (48.1%) |
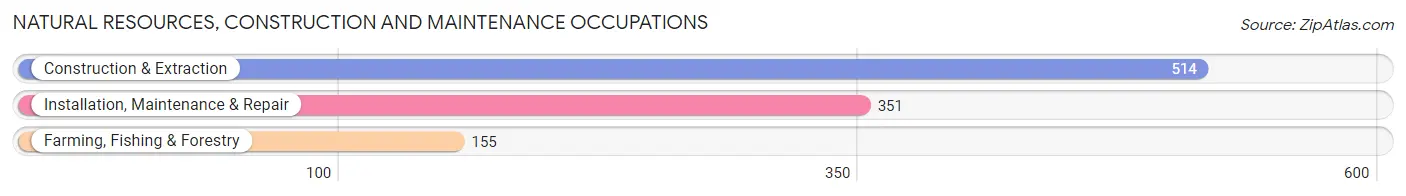
Natural Resources, Construction and Maintenance Occupations
The most common Natural Resources, Construction and Maintenance occupations in Poweshiek County are Construction & Extraction (514 | 5.6%), Installation, Maintenance & Repair (351 | 3.8%), and Farming, Fishing & Forestry (155 | 1.7%).
Natural Resources, Construction and Maintenance Occupations by Sex
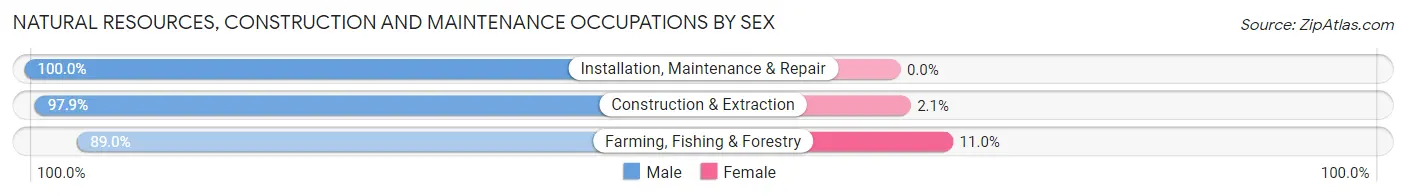
| Occupation | Male | Female |
| Farming, Fishing & Forestry | 138 (89.0%) | 17 (11.0%) |
| Construction & Extraction | 503 (97.9%) | 11 (2.1%) |
| Installation, Maintenance & Repair | 351 (100.0%) | 0 (0.0%) |
| Total (Category) | 992 (97.3%) | 28 (2.8%) |
| Total (Overall) | 4,781 (51.8%) | 4,439 (48.1%) |
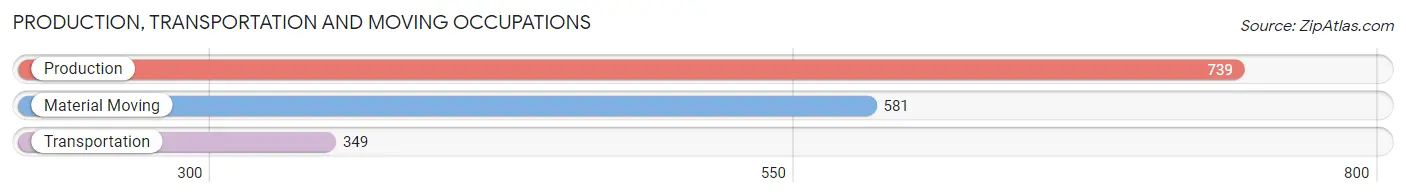
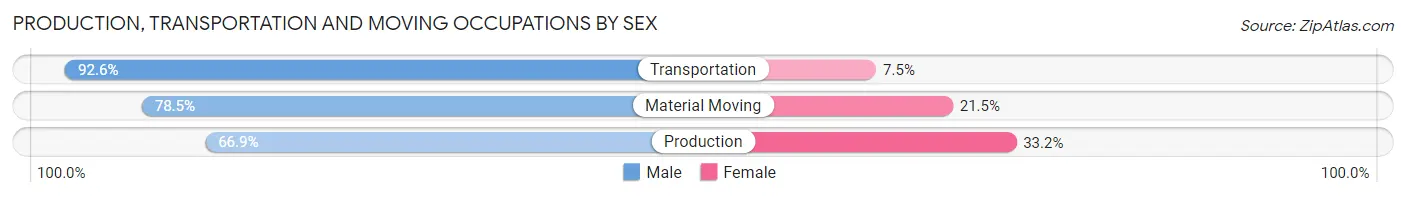
Production, Transportation and Moving Occupations
The most common Production, Transportation and Moving occupations in Poweshiek County are Production (739 | 8.0%), Material Moving (581 | 6.3%), and Transportation (349 | 3.8%).
Production, Transportation and Moving Occupations by Sex
| Occupation | Male | Female |
| Production | 494 (66.8%) | 245 (33.2%) |
| Transportation | 323 (92.5%) | 26 (7.4%) |
| Material Moving | 456 (78.5%) | 125 (21.5%) |
| Total (Category) | 1,273 (76.3%) | 396 (23.7%) |
| Total (Overall) | 4,781 (51.8%) | 4,439 (48.1%) |
Employment Industries by Sex in Poweshiek County
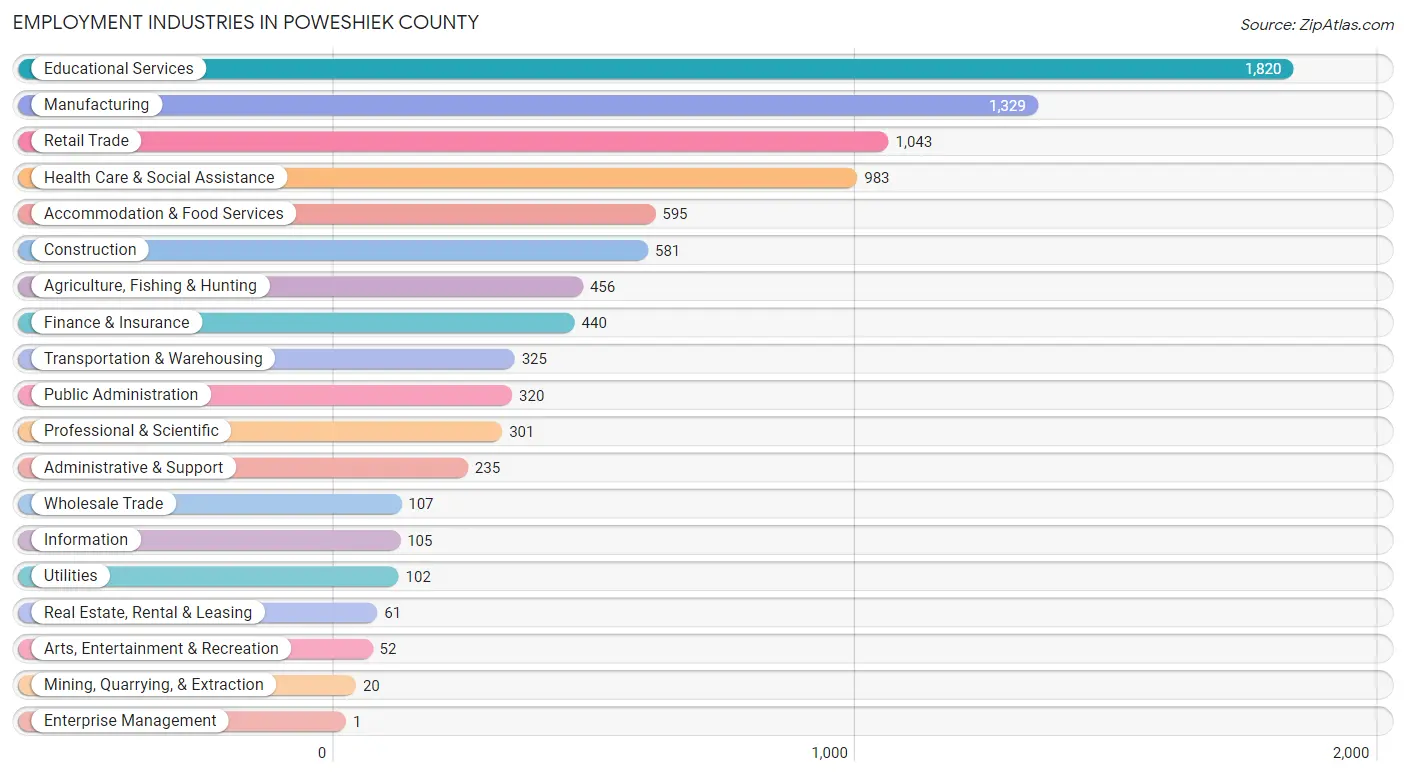
Employment Industries in Poweshiek County
The major employment industries in Poweshiek County include Educational Services (1,820 | 19.7%), Manufacturing (1,329 | 14.4%), Retail Trade (1,043 | 11.3%), Health Care & Social Assistance (983 | 10.7%), and Accommodation & Food Services (595 | 6.5%).
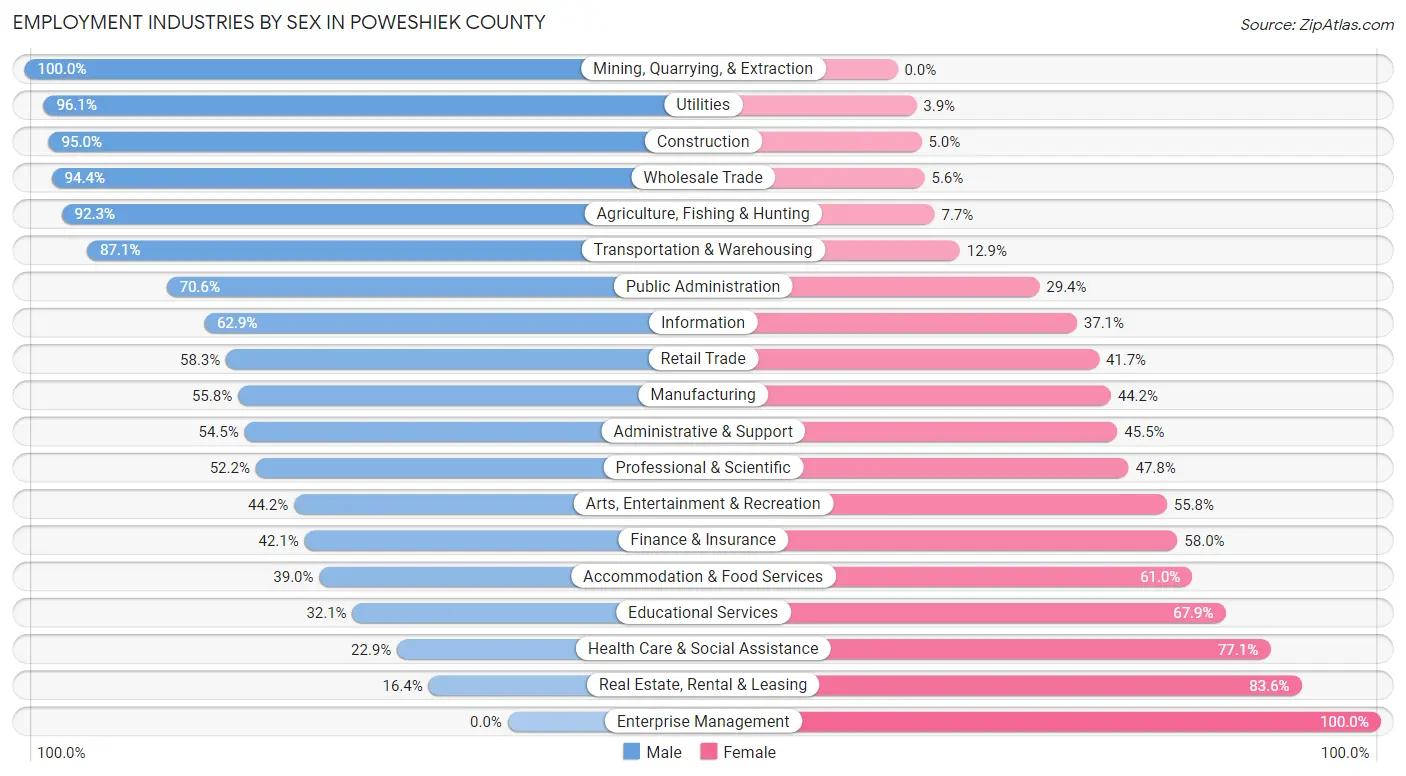
Employment Industries by Sex in Poweshiek County
The Poweshiek County industries that see more men than women are Mining, Quarrying, & Extraction (100.0%), Utilities (96.1%), and Construction (95.0%), whereas the industries that tend to have a higher number of women are Enterprise Management (100.0%), Real Estate, Rental & Leasing (83.6%), and Health Care & Social Assistance (77.1%).
| Industry | Male | Female |
| Agriculture, Fishing & Hunting | 421 (92.3%) | 35 (7.7%) |
| Mining, Quarrying, & Extraction | 20 (100.0%) | 0 (0.0%) |
| Construction | 552 (95.0%) | 29 (5.0%) |
| Manufacturing | 742 (55.8%) | 587 (44.2%) |
| Wholesale Trade | 101 (94.4%) | 6 (5.6%) |
| Retail Trade | 608 (58.3%) | 435 (41.7%) |
| Transportation & Warehousing | 283 (87.1%) | 42 (12.9%) |
| Utilities | 98 (96.1%) | 4 (3.9%) |
| Information | 66 (62.9%) | 39 (37.1%) |
| Finance & Insurance | 185 (42.0%) | 255 (58.0%) |
| Real Estate, Rental & Leasing | 10 (16.4%) | 51 (83.6%) |
| Professional & Scientific | 157 (52.2%) | 144 (47.8%) |
| Enterprise Management | 0 (0.0%) | 1 (100.0%) |
| Administrative & Support | 128 (54.5%) | 107 (45.5%) |
| Educational Services | 585 (32.1%) | 1,235 (67.9%) |
| Health Care & Social Assistance | 225 (22.9%) | 758 (77.1%) |
| Arts, Entertainment & Recreation | 23 (44.2%) | 29 (55.8%) |
| Accommodation & Food Services | 232 (39.0%) | 363 (61.0%) |
| Public Administration | 226 (70.6%) | 94 (29.4%) |
| Total | 4,781 (51.8%) | 4,439 (48.1%) |
Education in Poweshiek County
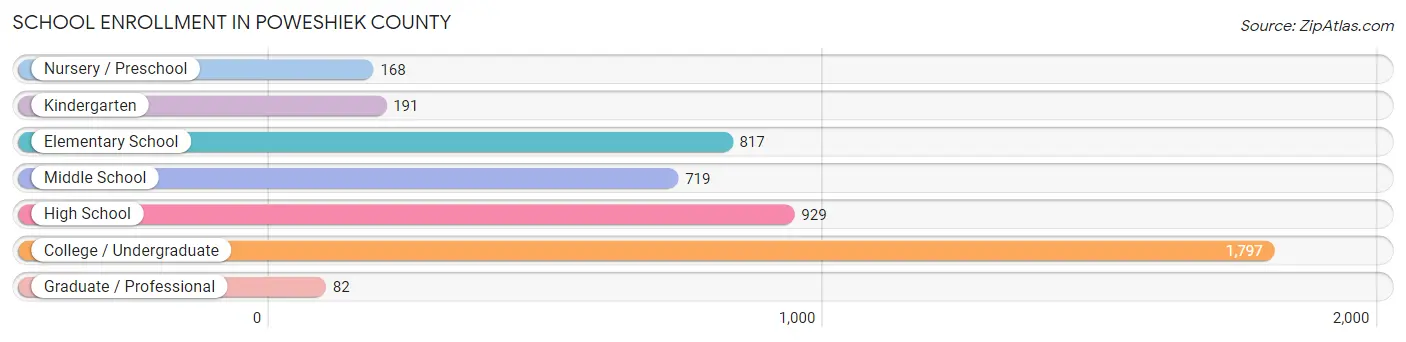
School Enrollment in Poweshiek County
The most common levels of schooling among the 4,703 students in Poweshiek County are college / undergraduate (1,797 | 38.2%), high school (929 | 19.8%), and elementary school (817 | 17.4%).
| School Level | # Students | % Students |
| Nursery / Preschool | 168 | 3.6% |
| Kindergarten | 191 | 4.1% |
| Elementary School | 817 | 17.4% |
| Middle School | 719 | 15.3% |
| High School | 929 | 19.8% |
| College / Undergraduate | 1,797 | 38.2% |
| Graduate / Professional | 82 | 1.7% |
| Total | 4,703 | 100.0% |
School Enrollment by Age by Funding Source in Poweshiek County
Out of a total of 4,703 students who are enrolled in schools in Poweshiek County, 1,853 (39.4%) attend a private institution, while the remaining 2,850 (60.6%) are enrolled in public schools. The age group of 18 to 19 year olds has the highest likelihood of being enrolled in private schools, with 984 (93.5% in the age bracket) enrolled. Conversely, the age group of 10 to 14 year olds has the lowest likelihood of being enrolled in a private school, with 991 (94.1% in the age bracket) attending a public institution.
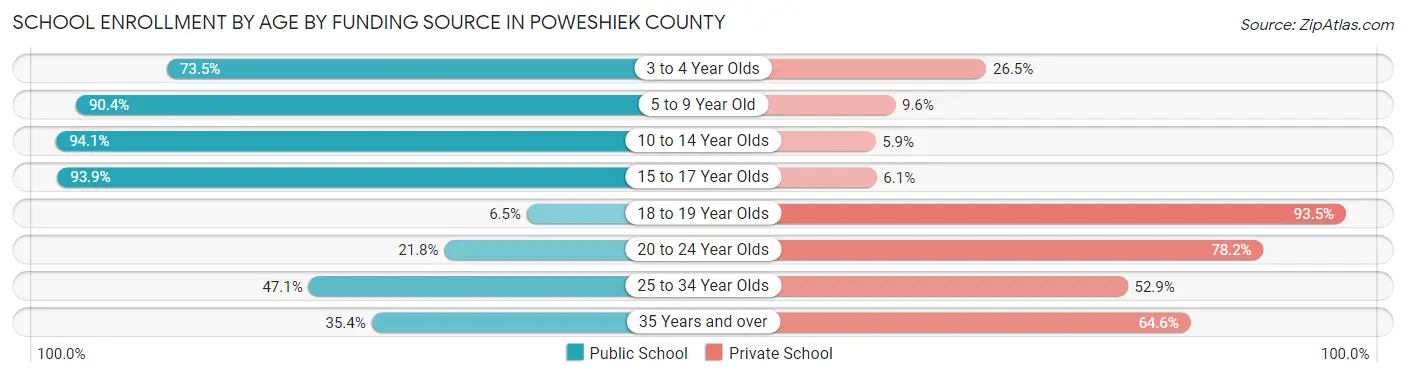
| Age Bracket | Public School | Private School |
| 3 to 4 Year Olds | 97 (73.5%) | 35 (26.5%) |
| 5 to 9 Year Old | 822 (90.4%) | 87 (9.6%) |
| 10 to 14 Year Olds | 991 (94.1%) | 62 (5.9%) |
| 15 to 17 Year Olds | 646 (93.9%) | 42 (6.1%) |
| 18 to 19 Year Olds | 68 (6.5%) | 984 (93.5%) |
| 20 to 24 Year Olds | 149 (21.8%) | 534 (78.2%) |
| 25 to 34 Year Olds | 49 (47.1%) | 55 (52.9%) |
| 35 Years and over | 29 (35.4%) | 53 (64.6%) |
| Total | 2,850 (60.6%) | 1,853 (39.4%) |
Educational Attainment by Field of Study in Poweshiek County
Education (664 | 17.8%), business (513 | 13.8%), social sciences (479 | 12.9%), literature & languages (316 | 8.5%), and bio, nature & agricultural (301 | 8.1%) are the most common fields of study among 3,725 individuals in Poweshiek County who have obtained a bachelor's degree or higher.
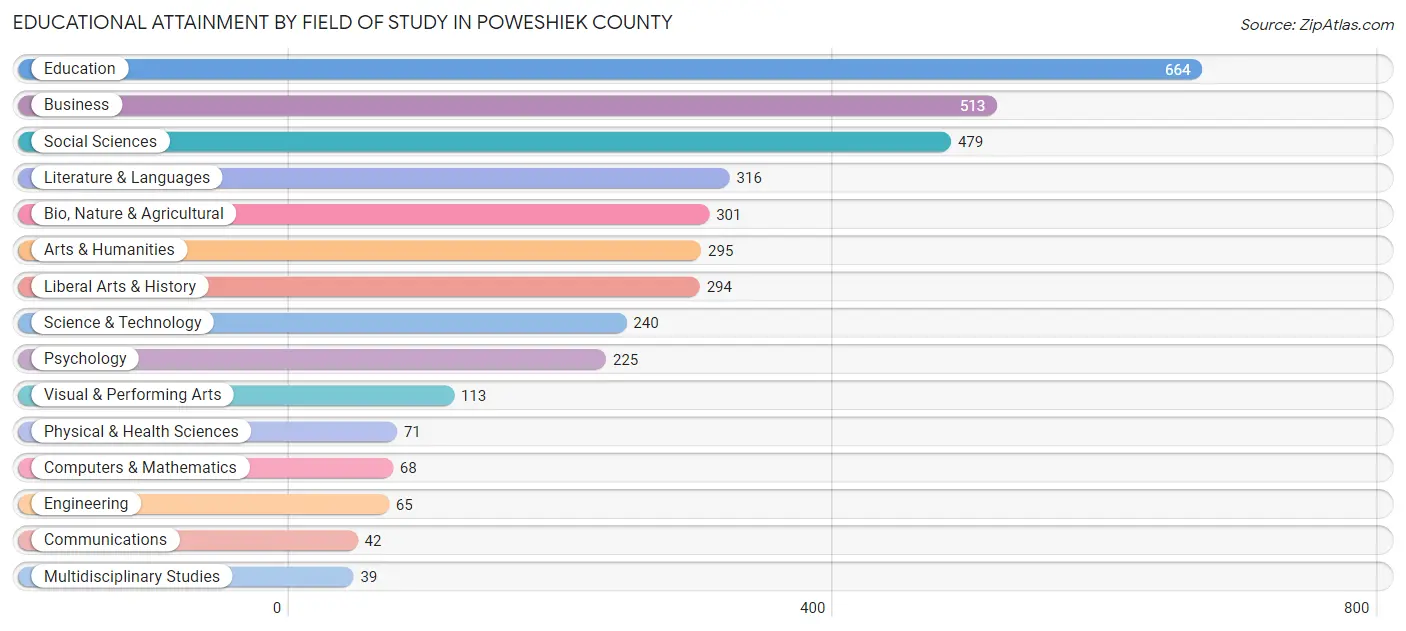
| Field of Study | # Graduates | % Graduates |
| Computers & Mathematics | 68 | 1.8% |
| Bio, Nature & Agricultural | 301 | 8.1% |
| Physical & Health Sciences | 71 | 1.9% |
| Psychology | 225 | 6.0% |
| Social Sciences | 479 | 12.9% |
| Engineering | 65 | 1.7% |
| Multidisciplinary Studies | 39 | 1.1% |
| Science & Technology | 240 | 6.4% |
| Business | 513 | 13.8% |
| Education | 664 | 17.8% |
| Literature & Languages | 316 | 8.5% |
| Liberal Arts & History | 294 | 7.9% |
| Visual & Performing Arts | 113 | 3.0% |
| Communications | 42 | 1.1% |
| Arts & Humanities | 295 | 7.9% |
| Total | 3,725 | 100.0% |
Transportation & Commute in Poweshiek County
Vehicle Availability by Sex in Poweshiek County
The most prevalent vehicle ownership categories in Poweshiek County are males with 2 vehicles (1,954, accounting for 43.5%) and females with 2 vehicles (1,385, making up 52.1%).
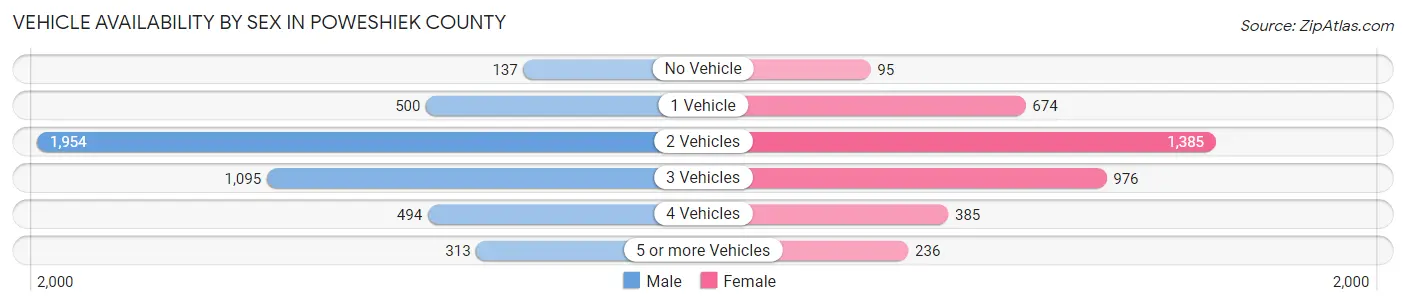
| Vehicles Available | Male | Female |
| No Vehicle | 137 (3.0%) | 95 (2.5%) |
| 1 Vehicle | 500 (11.1%) | 674 (18.0%) |
| 2 Vehicles | 1,954 (43.5%) | 1,385 (36.9%) |
| 3 Vehicles | 1,095 (24.4%) | 976 (26.0%) |
| 4 Vehicles | 494 (11.0%) | 385 (10.3%) |
| 5 or more Vehicles | 313 (7.0%) | 236 (6.3%) |
| Total | 4,493 (100.0%) | 3,751 (100.0%) |
Commute Time in Poweshiek County
The most frequently occuring commute durations in Poweshiek County are 5 to 9 minutes (2,458 commuters, 30.7%), less than 5 minutes (1,095 commuters, 13.7%), and 10 to 14 minutes (989 commuters, 12.3%).
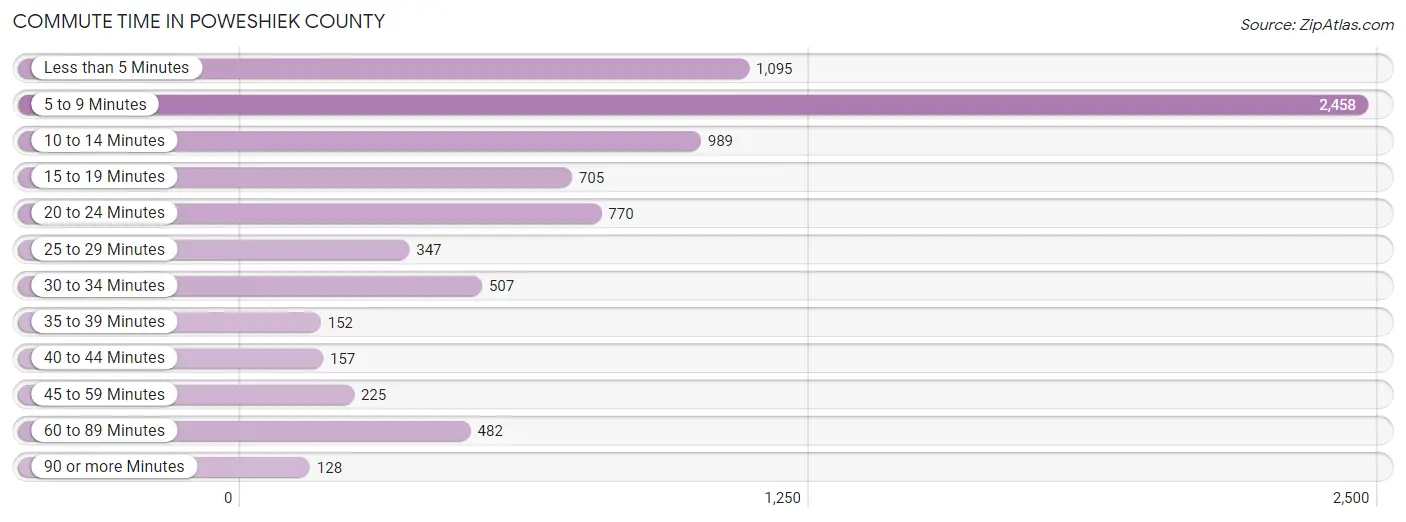
| Commute Time | # Commuters | % Commuters |
| Less than 5 Minutes | 1,095 | 13.7% |
| 5 to 9 Minutes | 2,458 | 30.7% |
| 10 to 14 Minutes | 989 | 12.3% |
| 15 to 19 Minutes | 705 | 8.8% |
| 20 to 24 Minutes | 770 | 9.6% |
| 25 to 29 Minutes | 347 | 4.3% |
| 30 to 34 Minutes | 507 | 6.3% |
| 35 to 39 Minutes | 152 | 1.9% |
| 40 to 44 Minutes | 157 | 2.0% |
| 45 to 59 Minutes | 225 | 2.8% |
| 60 to 89 Minutes | 482 | 6.0% |
| 90 or more Minutes | 128 | 1.6% |
Commute Time by Sex in Poweshiek County
The most common commute times in Poweshiek County are 5 to 9 minutes (1,234 commuters, 28.9%) for males and 5 to 9 minutes (1,224 commuters, 32.7%) for females.
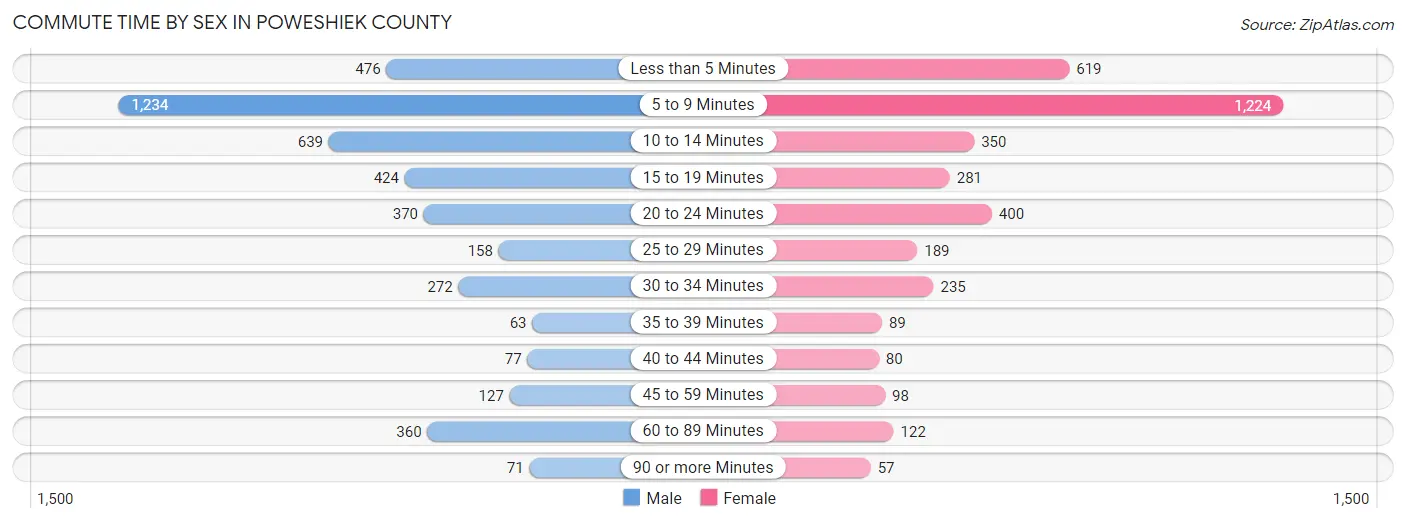
| Commute Time | Male | Female |
| Less than 5 Minutes | 476 (11.1%) | 619 (16.5%) |
| 5 to 9 Minutes | 1,234 (28.9%) | 1,224 (32.7%) |
| 10 to 14 Minutes | 639 (15.0%) | 350 (9.3%) |
| 15 to 19 Minutes | 424 (9.9%) | 281 (7.5%) |
| 20 to 24 Minutes | 370 (8.7%) | 400 (10.7%) |
| 25 to 29 Minutes | 158 (3.7%) | 189 (5.1%) |
| 30 to 34 Minutes | 272 (6.4%) | 235 (6.3%) |
| 35 to 39 Minutes | 63 (1.5%) | 89 (2.4%) |
| 40 to 44 Minutes | 77 (1.8%) | 80 (2.1%) |
| 45 to 59 Minutes | 127 (3.0%) | 98 (2.6%) |
| 60 to 89 Minutes | 360 (8.4%) | 122 (3.3%) |
| 90 or more Minutes | 71 (1.7%) | 57 (1.5%) |
Time of Departure to Work by Sex in Poweshiek County
The most frequent times of departure to work in Poweshiek County are 7:00 AM to 7:29 AM (778, 18.2%) for males and 7:30 AM to 7:59 AM (881, 23.5%) for females.
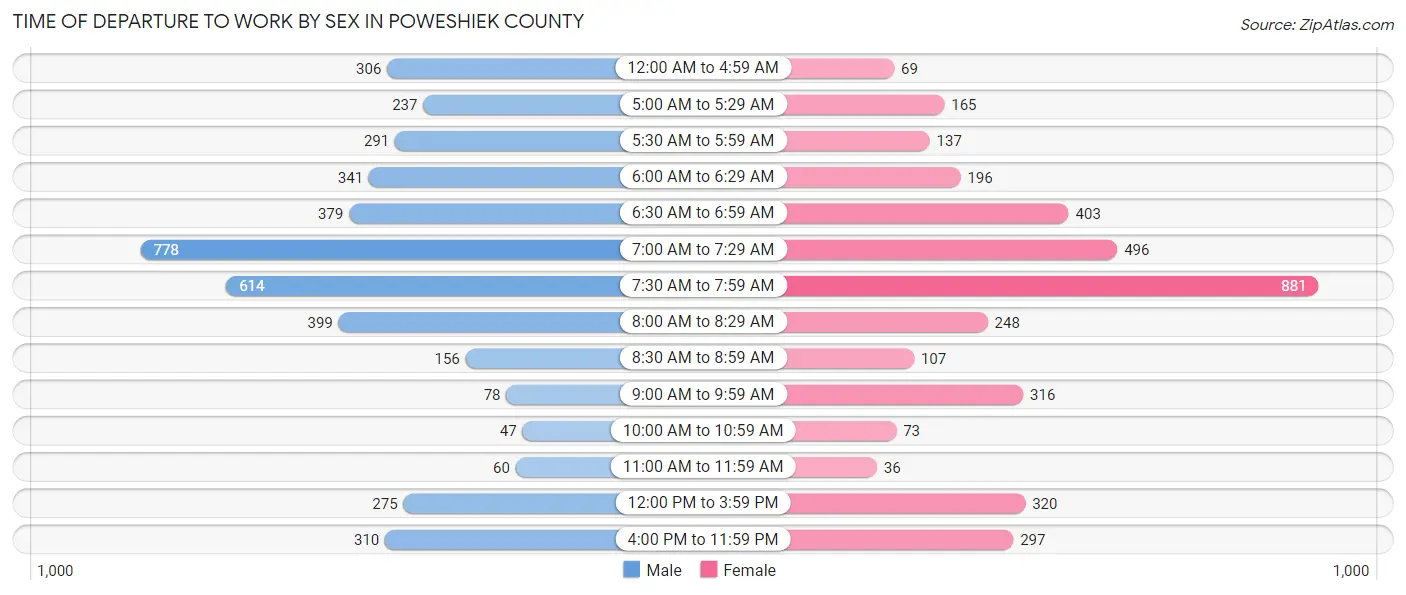
| Time of Departure | Male | Female |
| 12:00 AM to 4:59 AM | 306 (7.2%) | 69 (1.8%) |
| 5:00 AM to 5:29 AM | 237 (5.6%) | 165 (4.4%) |
| 5:30 AM to 5:59 AM | 291 (6.8%) | 137 (3.7%) |
| 6:00 AM to 6:29 AM | 341 (8.0%) | 196 (5.2%) |
| 6:30 AM to 6:59 AM | 379 (8.9%) | 403 (10.8%) |
| 7:00 AM to 7:29 AM | 778 (18.2%) | 496 (13.3%) |
| 7:30 AM to 7:59 AM | 614 (14.4%) | 881 (23.5%) |
| 8:00 AM to 8:29 AM | 399 (9.3%) | 248 (6.6%) |
| 8:30 AM to 8:59 AM | 156 (3.6%) | 107 (2.9%) |
| 9:00 AM to 9:59 AM | 78 (1.8%) | 316 (8.4%) |
| 10:00 AM to 10:59 AM | 47 (1.1%) | 73 (1.9%) |
| 11:00 AM to 11:59 AM | 60 (1.4%) | 36 (1.0%) |
| 12:00 PM to 3:59 PM | 275 (6.4%) | 320 (8.6%) |
| 4:00 PM to 11:59 PM | 310 (7.3%) | 297 (7.9%) |
| Total | 4,271 (100.0%) | 3,744 (100.0%) |
Housing Occupancy in Poweshiek County
Occupancy by Ownership in Poweshiek County
Of the total 7,761 dwellings in Poweshiek County, owner-occupied units account for 5,472 (70.5%), while renter-occupied units make up 2,289 (29.5%).
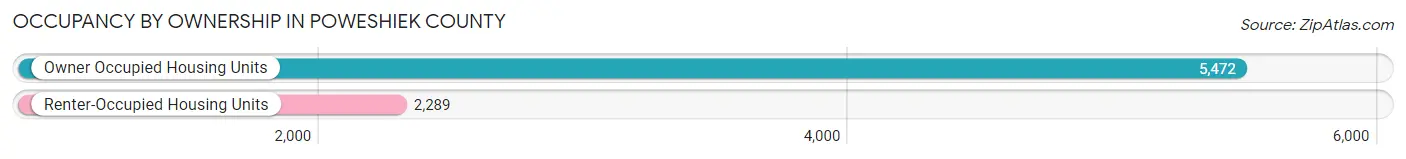
| Occupancy | # Housing Units | % Housing Units |
| Owner Occupied Housing Units | 5,472 | 70.5% |
| Renter-Occupied Housing Units | 2,289 | 29.5% |
| Total Occupied Housing Units | 7,761 | 100.0% |
Occupancy by Household Size in Poweshiek County
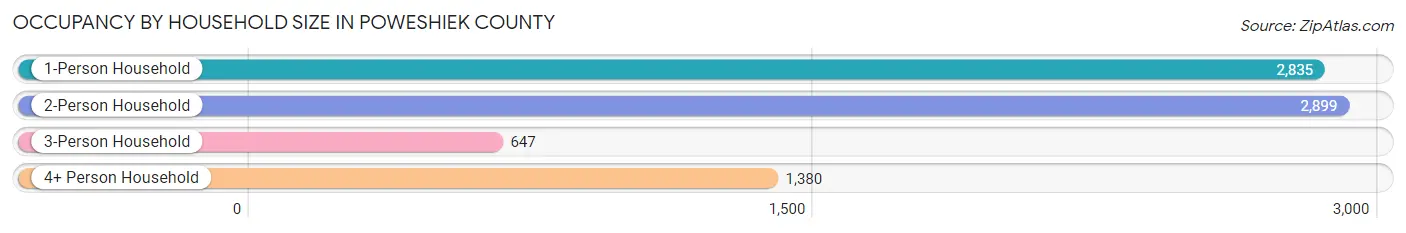
| Household Size | # Housing Units | % Housing Units |
| 1-Person Household | 2,835 | 36.5% |
| 2-Person Household | 2,899 | 37.3% |
| 3-Person Household | 647 | 8.3% |
| 4+ Person Household | 1,380 | 17.8% |
| Total Housing Units | 7,761 | 100.0% |
Occupancy by Ownership by Household Size in Poweshiek County
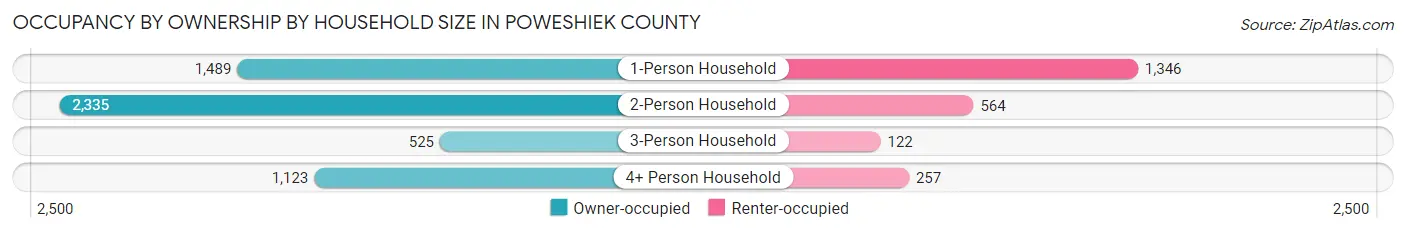
| Household Size | Owner-occupied | Renter-occupied |
| 1-Person Household | 1,489 (52.5%) | 1,346 (47.5%) |
| 2-Person Household | 2,335 (80.5%) | 564 (19.5%) |
| 3-Person Household | 525 (81.1%) | 122 (18.9%) |
| 4+ Person Household | 1,123 (81.4%) | 257 (18.6%) |
| Total Housing Units | 5,472 (70.5%) | 2,289 (29.5%) |
Occupancy by Educational Attainment in Poweshiek County
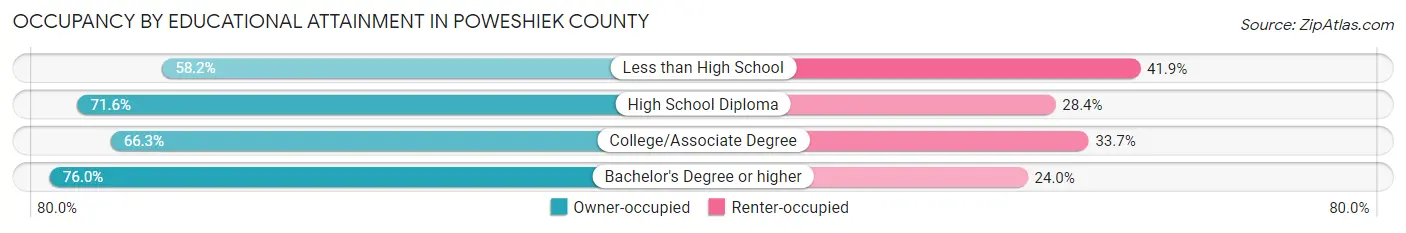
| Household Size | Owner-occupied | Renter-occupied |
| Less than High School | 207 (58.2%) | 149 (41.8%) |
| High School Diploma | 2,111 (71.6%) | 838 (28.4%) |
| College/Associate Degree | 1,591 (66.3%) | 808 (33.7%) |
| Bachelor's Degree or higher | 1,563 (76.0%) | 494 (24.0%) |
Occupancy by Age of Householder in Poweshiek County
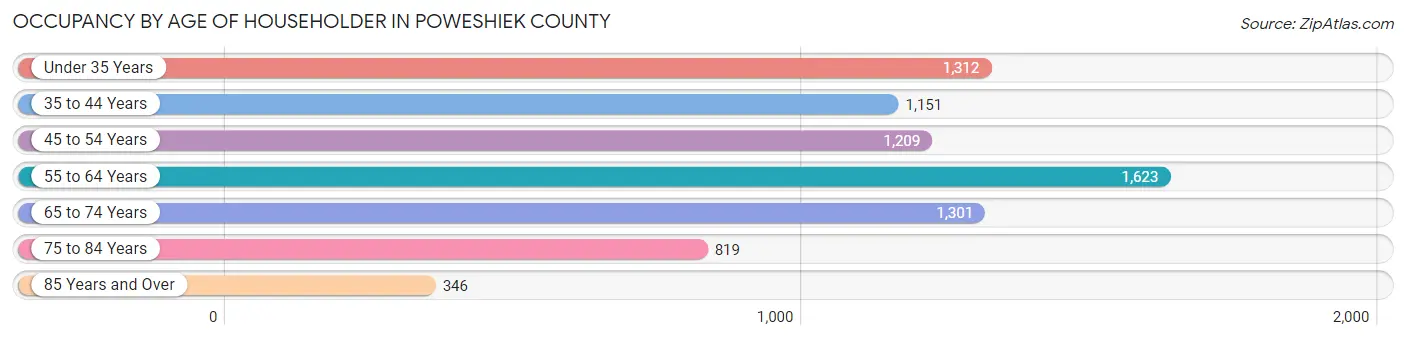
| Age Bracket | # Households | % Households |
| Under 35 Years | 1,312 | 16.9% |
| 35 to 44 Years | 1,151 | 14.8% |
| 45 to 54 Years | 1,209 | 15.6% |
| 55 to 64 Years | 1,623 | 20.9% |
| 65 to 74 Years | 1,301 | 16.8% |
| 75 to 84 Years | 819 | 10.5% |
| 85 Years and Over | 346 | 4.5% |
| Total | 7,761 | 100.0% |
Housing Finances in Poweshiek County
Median Income by Occupancy in Poweshiek County
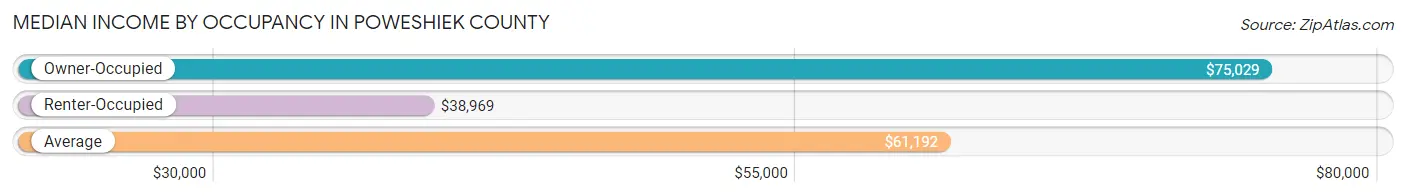
| Occupancy Type | # Households | Median Income |
| Owner-Occupied | 5,472 (70.5%) | $75,029 |
| Renter-Occupied | 2,289 (29.5%) | $38,969 |
| Average | 7,761 (100.0%) | $61,192 |
Occupancy by Householder Income Bracket in Poweshiek County
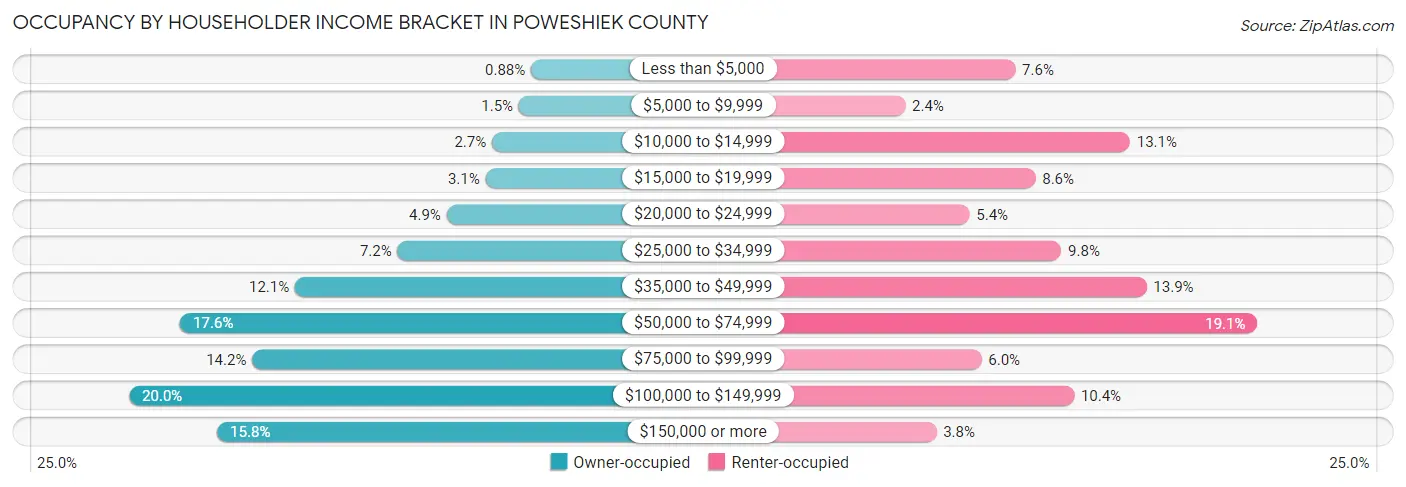
| Income Bracket | Owner-occupied | Renter-occupied |
| Less than $5,000 | 48 (0.9%) | 174 (7.6%) |
| $5,000 to $9,999 | 80 (1.5%) | 54 (2.4%) |
| $10,000 to $14,999 | 150 (2.7%) | 299 (13.1%) |
| $15,000 to $19,999 | 167 (3.0%) | 196 (8.6%) |
| $20,000 to $24,999 | 268 (4.9%) | 124 (5.4%) |
| $25,000 to $34,999 | 396 (7.2%) | 224 (9.8%) |
| $35,000 to $49,999 | 663 (12.1%) | 317 (13.9%) |
| $50,000 to $74,999 | 963 (17.6%) | 438 (19.1%) |
| $75,000 to $99,999 | 775 (14.2%) | 137 (6.0%) |
| $100,000 to $149,999 | 1,096 (20.0%) | 238 (10.4%) |
| $150,000 or more | 866 (15.8%) | 88 (3.8%) |
| Total | 5,472 (100.0%) | 2,289 (100.0%) |
Monthly Housing Cost Tiers in Poweshiek County
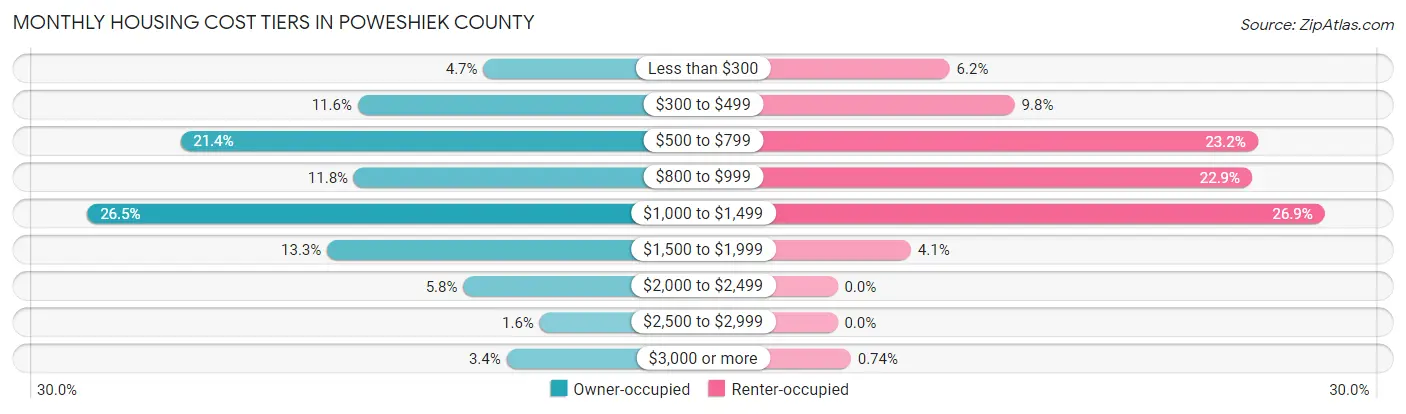
| Monthly Cost | Owner-occupied | Renter-occupied |
| Less than $300 | 255 (4.7%) | 142 (6.2%) |
| $300 to $499 | 635 (11.6%) | 224 (9.8%) |
| $500 to $799 | 1,171 (21.4%) | 531 (23.2%) |
| $800 to $999 | 646 (11.8%) | 524 (22.9%) |
| $1,000 to $1,499 | 1,452 (26.5%) | 616 (26.9%) |
| $1,500 to $1,999 | 727 (13.3%) | 93 (4.1%) |
| $2,000 to $2,499 | 316 (5.8%) | 0 (0.0%) |
| $2,500 to $2,999 | 85 (1.5%) | 0 (0.0%) |
| $3,000 or more | 185 (3.4%) | 17 (0.7%) |
| Total | 5,472 (100.0%) | 2,289 (100.0%) |
Physical Housing Characteristics in Poweshiek County
Housing Structures in Poweshiek County
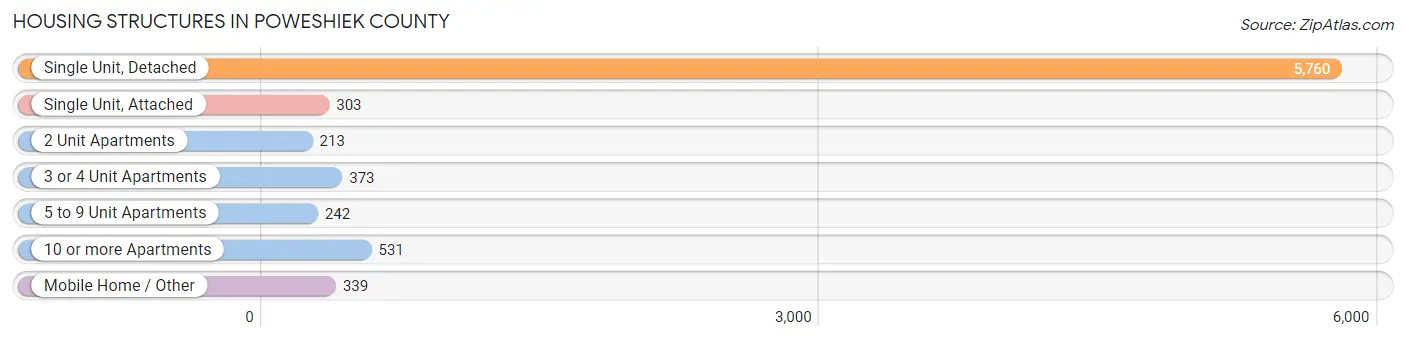
| Structure Type | # Housing Units | % Housing Units |
| Single Unit, Detached | 5,760 | 74.2% |
| Single Unit, Attached | 303 | 3.9% |
| 2 Unit Apartments | 213 | 2.7% |
| 3 or 4 Unit Apartments | 373 | 4.8% |
| 5 to 9 Unit Apartments | 242 | 3.1% |
| 10 or more Apartments | 531 | 6.8% |
| Mobile Home / Other | 339 | 4.4% |
| Total | 7,761 | 100.0% |
Housing Structures by Occupancy in Poweshiek County
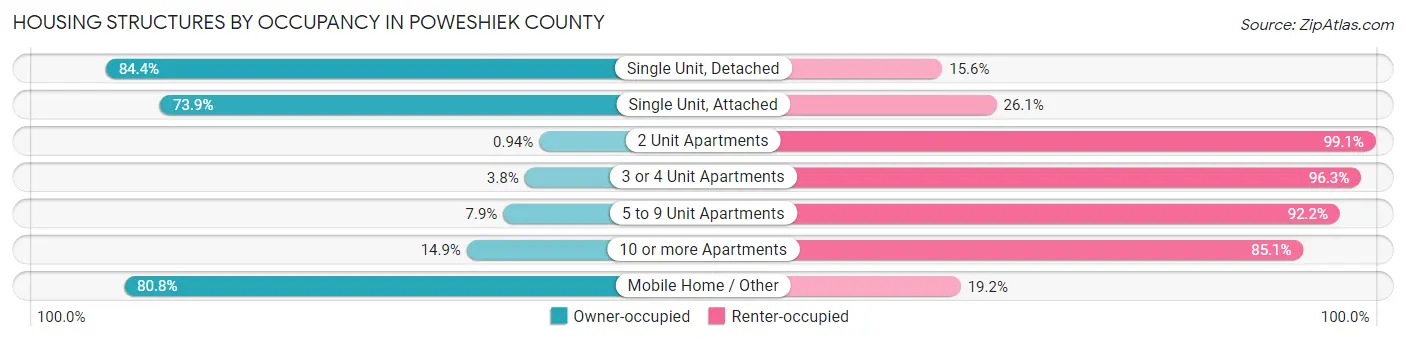
| Structure Type | Owner-occupied | Renter-occupied |
| Single Unit, Detached | 4,860 (84.4%) | 900 (15.6%) |
| Single Unit, Attached | 224 (73.9%) | 79 (26.1%) |
| 2 Unit Apartments | 2 (0.9%) | 211 (99.1%) |
| 3 or 4 Unit Apartments | 14 (3.7%) | 359 (96.3%) |
| 5 to 9 Unit Apartments | 19 (7.9%) | 223 (92.1%) |
| 10 or more Apartments | 79 (14.9%) | 452 (85.1%) |
| Mobile Home / Other | 274 (80.8%) | 65 (19.2%) |
| Total | 5,472 (70.5%) | 2,289 (29.5%) |
Housing Structures by Number of Rooms in Poweshiek County
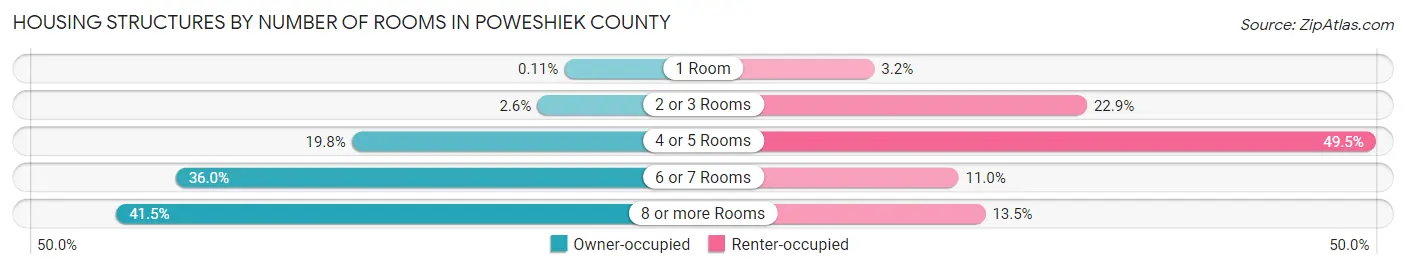
| Number of Rooms | Owner-occupied | Renter-occupied |
| 1 Room | 6 (0.1%) | 73 (3.2%) |
| 2 or 3 Rooms | 142 (2.6%) | 523 (22.9%) |
| 4 or 5 Rooms | 1,081 (19.8%) | 1,134 (49.5%) |
| 6 or 7 Rooms | 1,971 (36.0%) | 251 (11.0%) |
| 8 or more Rooms | 2,272 (41.5%) | 308 (13.5%) |
| Total | 5,472 (100.0%) | 2,289 (100.0%) |
Housing Structure by Heating Type in Poweshiek County
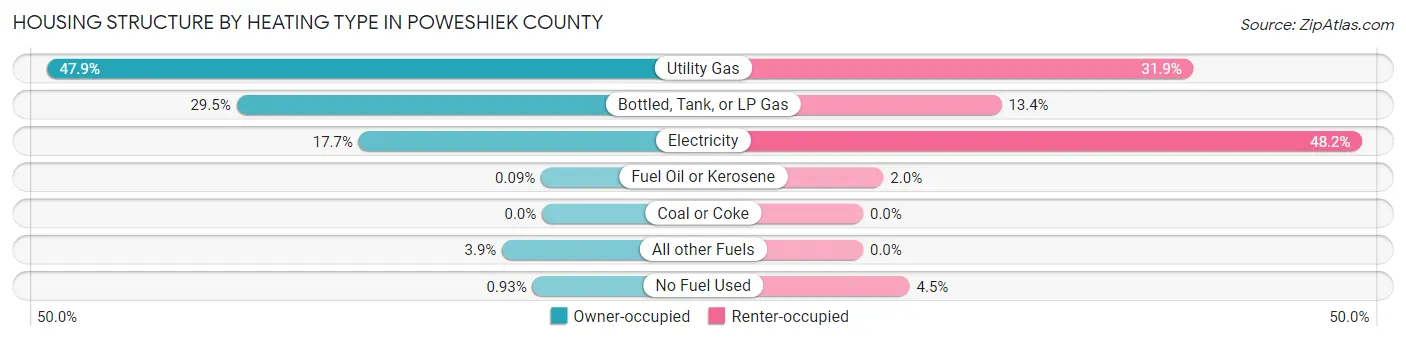
| Heating Type | Owner-occupied | Renter-occupied |
| Utility Gas | 2,620 (47.9%) | 731 (31.9%) |
| Bottled, Tank, or LP Gas | 1,616 (29.5%) | 306 (13.4%) |
| Electricity | 969 (17.7%) | 1,104 (48.2%) |
| Fuel Oil or Kerosene | 5 (0.1%) | 45 (2.0%) |
| Coal or Coke | 0 (0.0%) | 0 (0.0%) |
| All other Fuels | 211 (3.9%) | 0 (0.0%) |
| No Fuel Used | 51 (0.9%) | 103 (4.5%) |
| Total | 5,472 (100.0%) | 2,289 (100.0%) |
Household Vehicle Usage in Poweshiek County
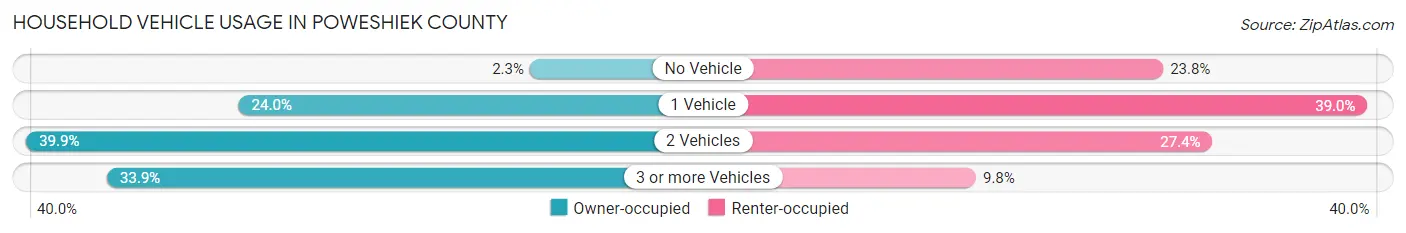
| Vehicles per Household | Owner-occupied | Renter-occupied |
| No Vehicle | 124 (2.3%) | 544 (23.8%) |
| 1 Vehicle | 1,314 (24.0%) | 893 (39.0%) |
| 2 Vehicles | 2,182 (39.9%) | 628 (27.4%) |
| 3 or more Vehicles | 1,852 (33.9%) | 224 (9.8%) |
| Total | 5,472 (100.0%) | 2,289 (100.0%) |
Real Estate & Mortgages in Poweshiek County
Real Estate and Mortgage Overview in Poweshiek County
| Characteristic | Without Mortgage | With Mortgage |
| Housing Units | 2,571 | 2,901 |
| Median Property Value | $170,800 | $176,100 |
| Median Household Income | $56,979 | $581 |
| Monthly Housing Costs | $575 | $185 |
| Real Estate Taxes | $2,397 | $41 |
Property Value by Mortgage Status in Poweshiek County
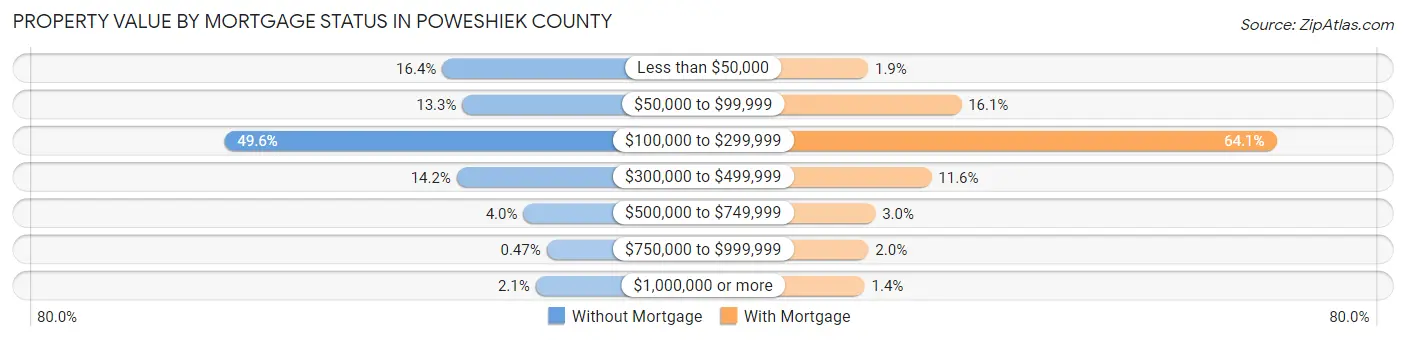
| Property Value | Without Mortgage | With Mortgage |
| Less than $50,000 | 421 (16.4%) | 55 (1.9%) |
| $50,000 to $99,999 | 342 (13.3%) | 467 (16.1%) |
| $100,000 to $299,999 | 1,274 (49.5%) | 1,860 (64.1%) |
| $300,000 to $499,999 | 364 (14.2%) | 335 (11.6%) |
| $500,000 to $749,999 | 103 (4.0%) | 87 (3.0%) |
| $750,000 to $999,999 | 12 (0.5%) | 57 (2.0%) |
| $1,000,000 or more | 55 (2.1%) | 40 (1.4%) |
| Total | 2,571 (100.0%) | 2,901 (100.0%) |
Household Income by Mortgage Status in Poweshiek County
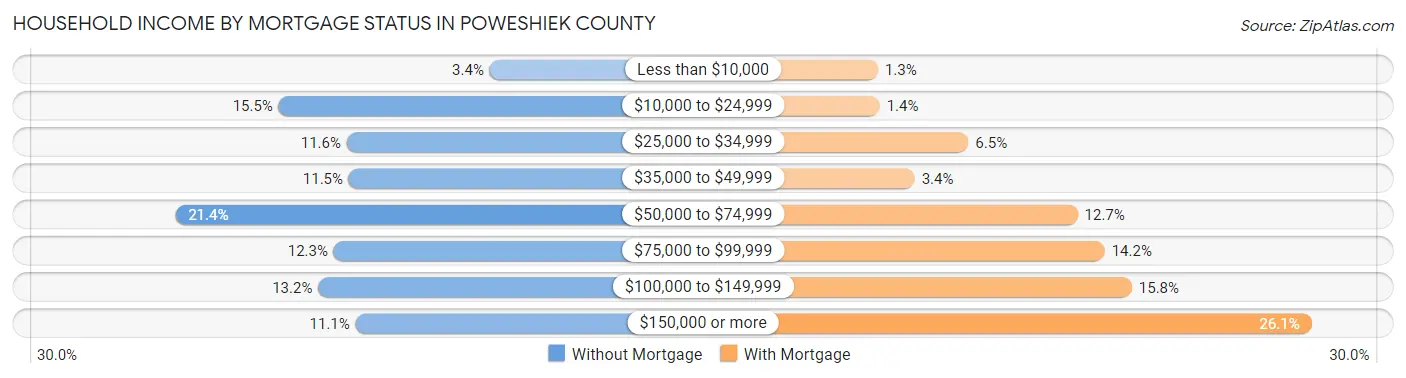
| Household Income | Without Mortgage | With Mortgage |
| Less than $10,000 | 88 (3.4%) | 37 (1.3%) |
| $10,000 to $24,999 | 398 (15.5%) | 40 (1.4%) |
| $25,000 to $34,999 | 298 (11.6%) | 187 (6.5%) |
| $35,000 to $49,999 | 295 (11.5%) | 98 (3.4%) |
| $50,000 to $74,999 | 550 (21.4%) | 368 (12.7%) |
| $75,000 to $99,999 | 317 (12.3%) | 413 (14.2%) |
| $100,000 to $149,999 | 340 (13.2%) | 458 (15.8%) |
| $150,000 or more | 285 (11.1%) | 756 (26.1%) |
| Total | 2,571 (100.0%) | 2,901 (100.0%) |
Property Value to Household Income Ratio in Poweshiek County
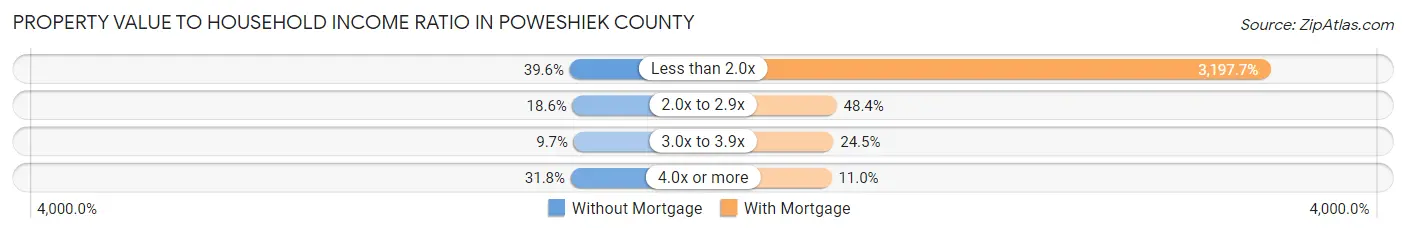
| Value-to-Income Ratio | Without Mortgage | With Mortgage |
| Less than 2.0x | 1,019 (39.6%) | 92,764 (3,197.7%) |
| 2.0x to 2.9x | 479 (18.6%) | 1,404 (48.4%) |
| 3.0x to 3.9x | 248 (9.7%) | 711 (24.5%) |
| 4.0x or more | 817 (31.8%) | 319 (11.0%) |
| Total | 2,571 (100.0%) | 2,901 (100.0%) |
Real Estate Taxes by Mortgage Status in Poweshiek County
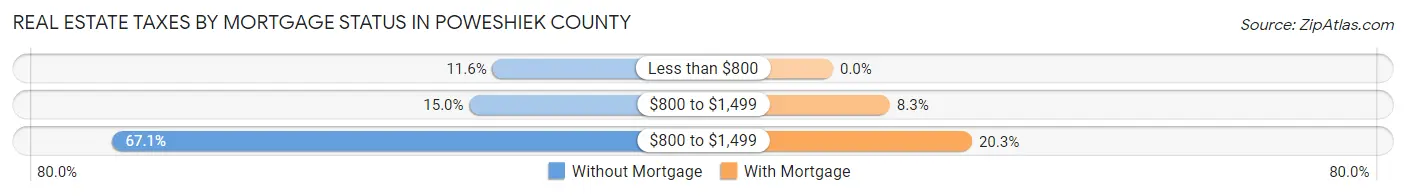
| Property Taxes | Without Mortgage | With Mortgage |
| Less than $800 | 299 (11.6%) | 0 (0.0%) |
| $800 to $1,499 | 386 (15.0%) | 241 (8.3%) |
| $800 to $1,499 | 1,726 (67.1%) | 589 (20.3%) |
| Total | 2,571 (100.0%) | 2,901 (100.0%) |
Health & Disability in Poweshiek County
Health Insurance Coverage by Age in Poweshiek County
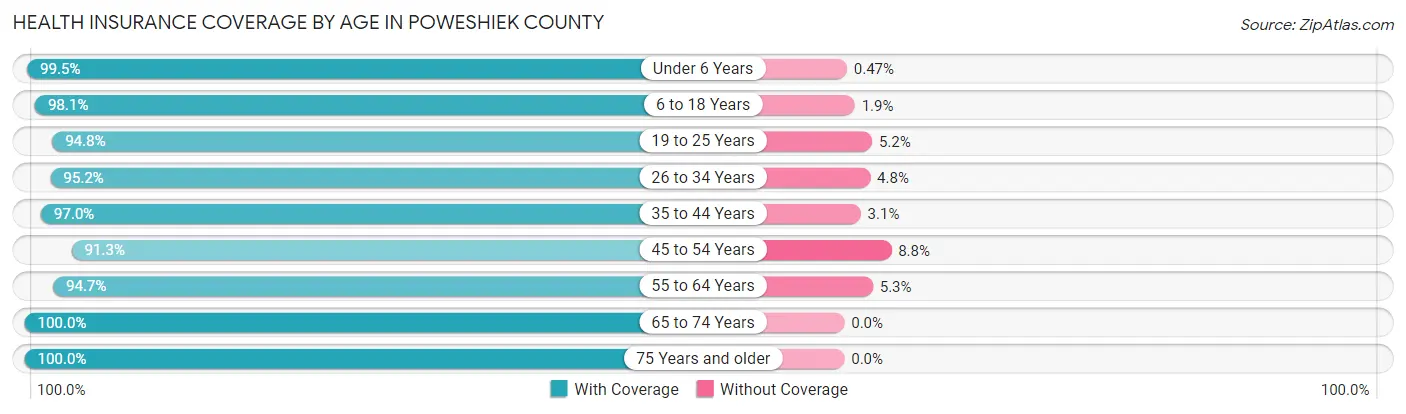
| Age Bracket | With Coverage | Without Coverage |
| Under 6 Years | 1,049 (99.5%) | 5 (0.5%) |
| 6 to 18 Years | 2,986 (98.1%) | 59 (1.9%) |
| 19 to 25 Years | 2,314 (94.8%) | 126 (5.2%) |
| 26 to 34 Years | 1,619 (95.2%) | 82 (4.8%) |
| 35 to 44 Years | 1,876 (97.0%) | 59 (3.0%) |
| 45 to 54 Years | 1,877 (91.2%) | 180 (8.7%) |
| 55 to 64 Years | 2,336 (94.7%) | 131 (5.3%) |
| 65 to 74 Years | 2,018 (100.0%) | 0 (0.0%) |
| 75 Years and older | 1,600 (100.0%) | 0 (0.0%) |
| Total | 17,675 (96.5%) | 642 (3.5%) |
Health Insurance Coverage by Citizenship Status in Poweshiek County
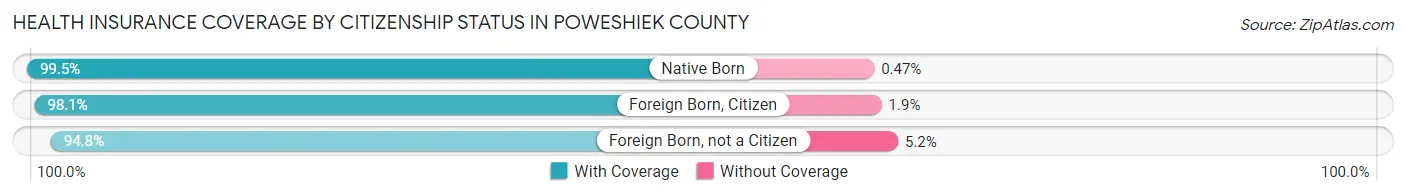
| Citizenship Status | With Coverage | Without Coverage |
| Native Born | 1,049 (99.5%) | 5 (0.5%) |
| Foreign Born, Citizen | 2,986 (98.1%) | 59 (1.9%) |
| Foreign Born, not a Citizen | 2,314 (94.8%) | 126 (5.2%) |
Health Insurance Coverage by Household Income in Poweshiek County
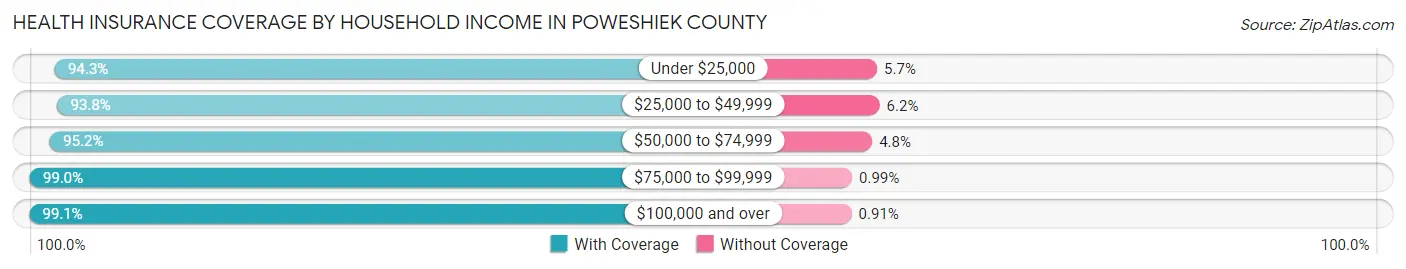
| Household Income | With Coverage | Without Coverage |
| Under $25,000 | 2,054 (94.3%) | 124 (5.7%) |
| $25,000 to $49,999 | 2,635 (93.8%) | 173 (6.2%) |
| $50,000 to $74,999 | 2,494 (95.2%) | 125 (4.8%) |
| $75,000 to $99,999 | 2,409 (99.0%) | 24 (1.0%) |
| $100,000 and over | 6,867 (99.1%) | 63 (0.9%) |
Public vs Private Health Insurance Coverage by Age in Poweshiek County
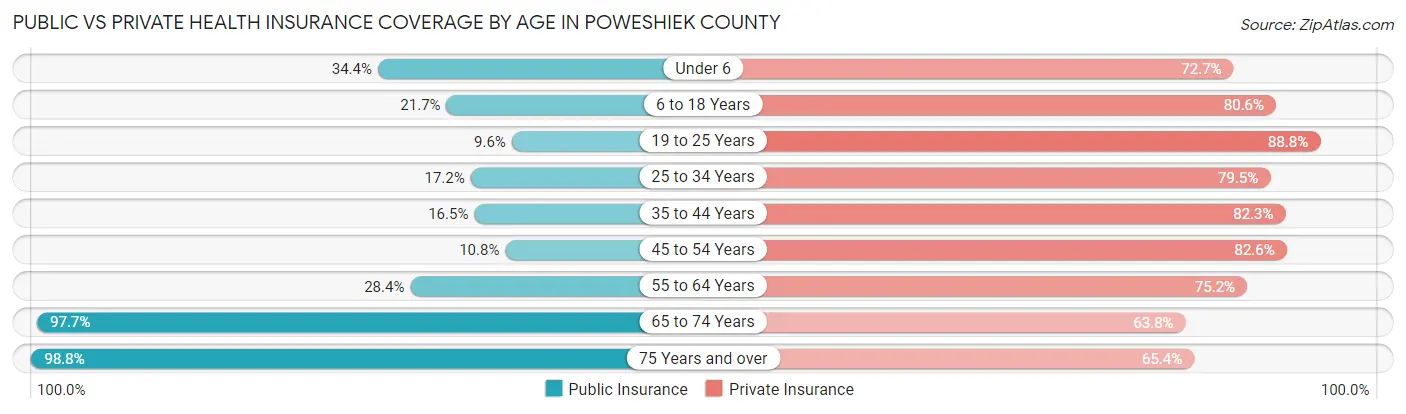
| Age Bracket | Public Insurance | Private Insurance |
| Under 6 | 363 (34.4%) | 766 (72.7%) |
| 6 to 18 Years | 661 (21.7%) | 2,453 (80.6%) |
| 19 to 25 Years | 234 (9.6%) | 2,166 (88.8%) |
| 25 to 34 Years | 293 (17.2%) | 1,352 (79.5%) |
| 35 to 44 Years | 320 (16.5%) | 1,593 (82.3%) |
| 45 to 54 Years | 222 (10.8%) | 1,698 (82.6%) |
| 55 to 64 Years | 701 (28.4%) | 1,855 (75.2%) |
| 65 to 74 Years | 1,971 (97.7%) | 1,287 (63.8%) |
| 75 Years and over | 1,580 (98.8%) | 1,046 (65.4%) |
| Total | 6,345 (34.6%) | 14,216 (77.6%) |
Disability Status by Sex by Age in Poweshiek County
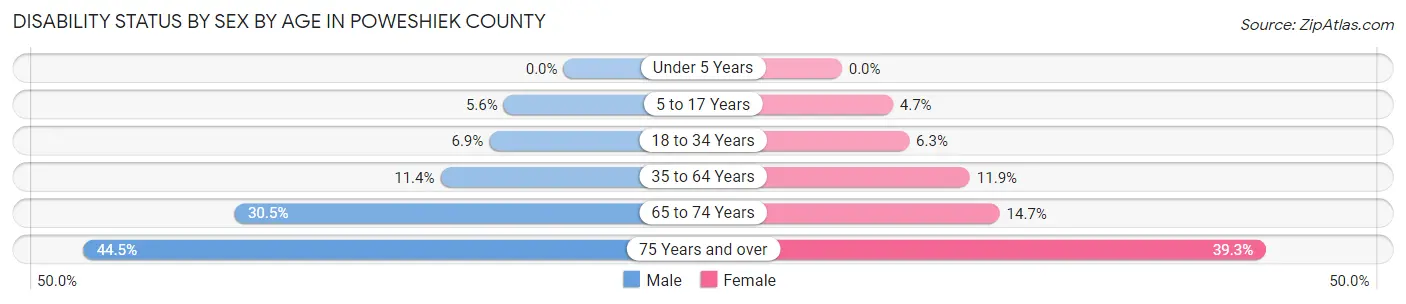
| Age Bracket | Male | Female |
| Under 5 Years | 0 (0.0%) | 0 (0.0%) |
| 5 to 17 Years | 78 (5.6%) | 68 (4.7%) |
| 18 to 34 Years | 160 (6.9%) | 139 (6.2%) |
| 35 to 64 Years | 363 (11.4%) | 390 (11.9%) |
| 65 to 74 Years | 305 (30.5%) | 149 (14.6%) |
| 75 Years and over | 312 (44.5%) | 353 (39.3%) |
Disability Class by Sex by Age in Poweshiek County
Disability Class: Hearing Difficulty
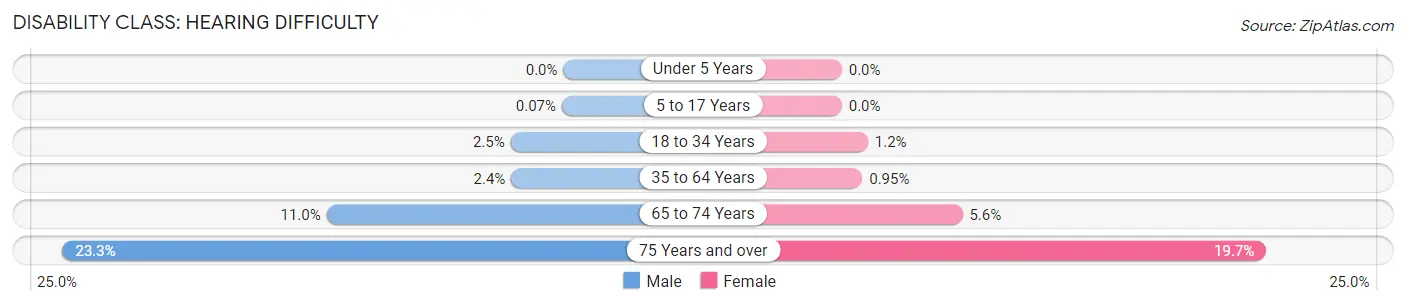
| Age Bracket | Male | Female |
| Under 5 Years | 0 (0.0%) | 0 (0.0%) |
| 5 to 17 Years | 1 (0.1%) | 0 (0.0%) |
| 18 to 34 Years | 57 (2.5%) | 27 (1.2%) |
| 35 to 64 Years | 77 (2.4%) | 31 (0.9%) |
| 65 to 74 Years | 110 (11.0%) | 57 (5.6%) |
| 75 Years and over | 163 (23.3%) | 177 (19.7%) |
Disability Class: Vision Difficulty
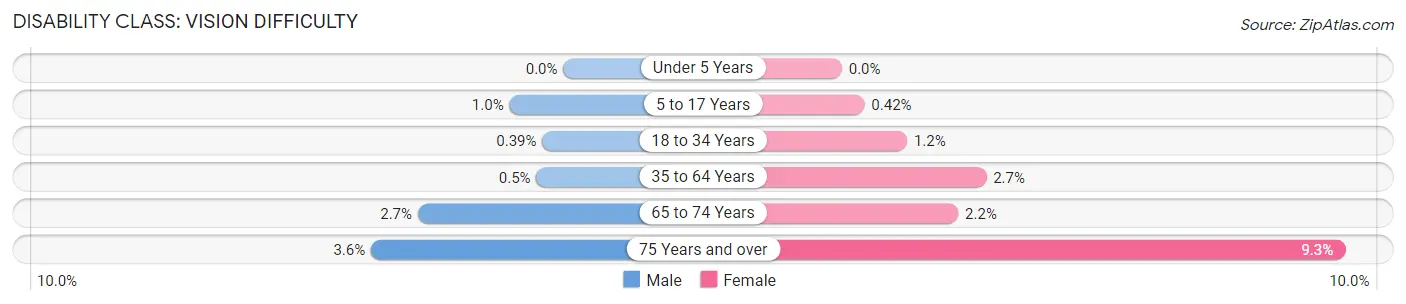
| Age Bracket | Male | Female |
| Under 5 Years | 0 (0.0%) | 0 (0.0%) |
| 5 to 17 Years | 14 (1.0%) | 6 (0.4%) |
| 18 to 34 Years | 9 (0.4%) | 27 (1.2%) |
| 35 to 64 Years | 16 (0.5%) | 88 (2.7%) |
| 65 to 74 Years | 27 (2.7%) | 22 (2.2%) |
| 75 Years and over | 25 (3.6%) | 84 (9.3%) |
Disability Class: Cognitive Difficulty
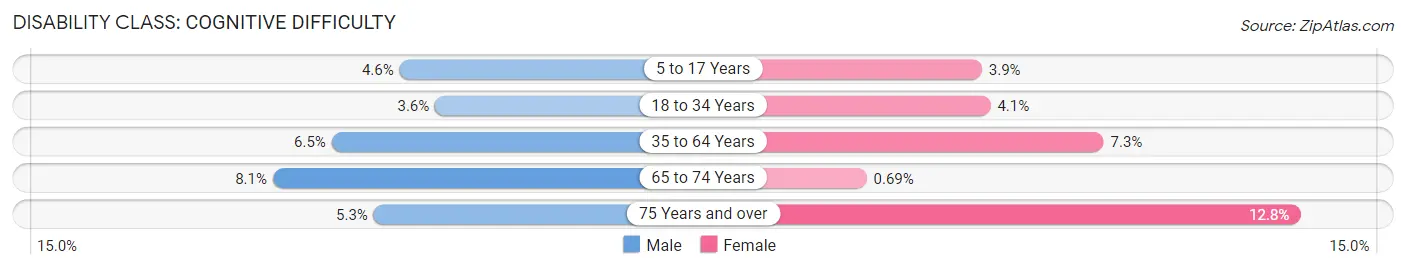
| Age Bracket | Male | Female |
| 5 to 17 Years | 64 (4.6%) | 56 (3.9%) |
| 18 to 34 Years | 83 (3.6%) | 92 (4.1%) |
| 35 to 64 Years | 205 (6.5%) | 239 (7.3%) |
| 65 to 74 Years | 81 (8.1%) | 7 (0.7%) |
| 75 Years and over | 37 (5.3%) | 115 (12.8%) |
Disability Class: Ambulatory Difficulty
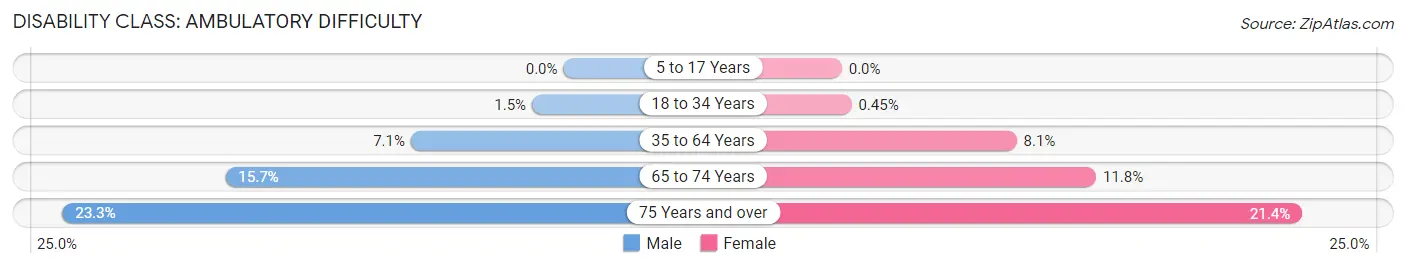
| Age Bracket | Male | Female |
| 5 to 17 Years | 0 (0.0%) | 0 (0.0%) |
| 18 to 34 Years | 34 (1.5%) | 10 (0.4%) |
| 35 to 64 Years | 225 (7.1%) | 266 (8.1%) |
| 65 to 74 Years | 157 (15.7%) | 120 (11.8%) |
| 75 Years and over | 163 (23.3%) | 192 (21.4%) |
Disability Class: Self-Care Difficulty
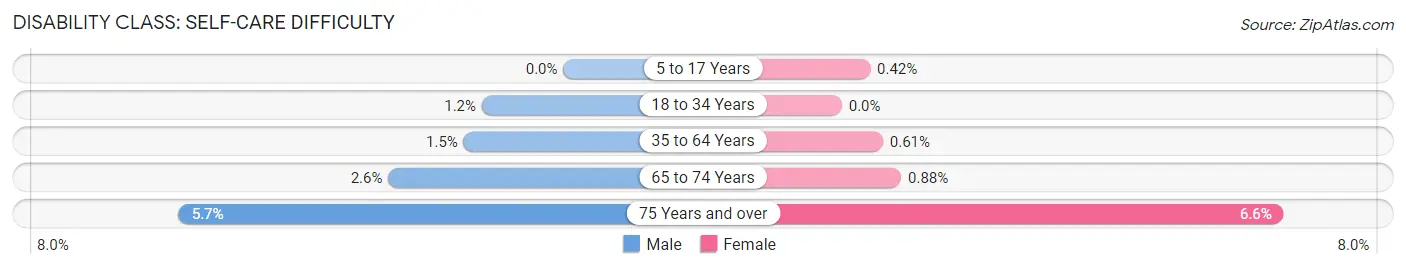
| Age Bracket | Male | Female |
| 5 to 17 Years | 0 (0.0%) | 6 (0.4%) |
| 18 to 34 Years | 28 (1.2%) | 0 (0.0%) |
| 35 to 64 Years | 47 (1.5%) | 20 (0.6%) |
| 65 to 74 Years | 26 (2.6%) | 9 (0.9%) |
| 75 Years and over | 40 (5.7%) | 59 (6.6%) |
Technology Access in Poweshiek County
Computing Device Access in Poweshiek County
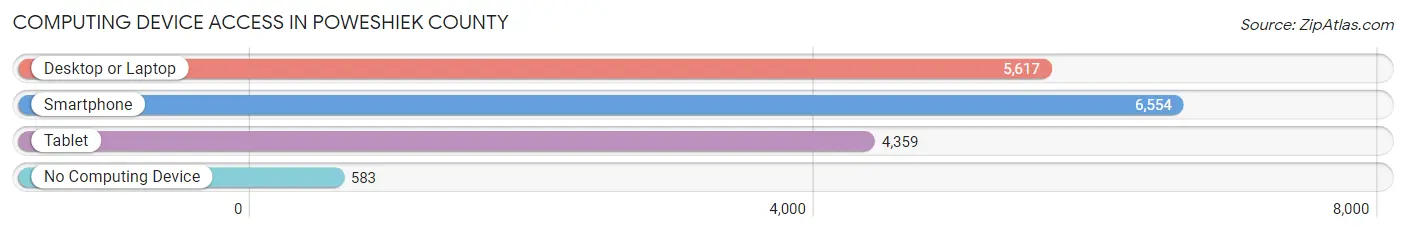
| Device Type | # Households | % Households |
| Desktop or Laptop | 5,617 | 72.4% |
| Smartphone | 6,554 | 84.5% |
| Tablet | 4,359 | 56.2% |
| No Computing Device | 583 | 7.5% |
| Total | 7,761 | 100.0% |
Internet Access in Poweshiek County
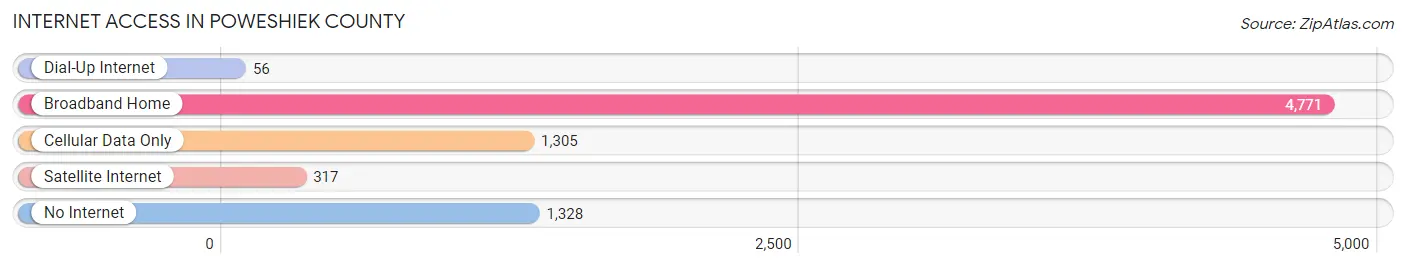
| Internet Type | # Households | % Households |
| Dial-Up Internet | 56 | 0.7% |
| Broadband Home | 4,771 | 61.5% |
| Cellular Data Only | 1,305 | 16.8% |
| Satellite Internet | 317 | 4.1% |
| No Internet | 1,328 | 17.1% |
| Total | 7,761 | 100.0% |
Poweshiek County Summary
Poweshiek County is located in the east-central part of the state of Iowa, in the United States. It is bordered by Jasper, Tama, Iowa, and Mahaska counties to the north, Keokuk and Washington counties to the east, Iowa and Johnson counties to the south, and Marshall and Story counties to the west. The county seat is Montezuma. The county was established in 1843 and named for Chief Poweshiek of the Fox tribe.
Geography
Poweshiek County covers an area of 576 square miles, of which 574 square miles is land and 2 square miles is water. The county is located in the rolling hills of the Iowa River Valley, with the Iowa River running through the county. The highest point in the county is located in the northwest corner, at 1,092 feet above sea level. The county is home to several state parks, including Lake Macbride State Park, Lake Sugema State Park, and Otter Creek State Park.
Demographics
As of the 2010 census, the population of Poweshiek County was 18,914, with a population density of 33 people per square mile. The racial makeup of the county was 97.2% White, 0.4% African American, 0.3% Native American, 0.5% Asian, 0.1% Pacific Islander, 0.6% from other races, and 0.9% from two or more races. Hispanic or Latino of any race were 2.2% of the population.
The median income for a household in the county was $48,945, and the median income for a family was $58,945. The per capita income for the county was $22,945. About 6.2% of families and 8.7% of the population were below the poverty line, including 10.2% of those under age 18 and 8.2% of those age 65 or over.
Economy
Poweshiek County is largely agricultural, with corn, soybeans, and hay being the primary crops. The county is also home to several manufacturing companies, including John Deere, Iowa Steel, and Iowa Machine Works. The county is also home to several small businesses, including restaurants, retail stores, and service providers.
The county is served by two airports, the Grinnell Regional Airport and the Montezuma Municipal Airport. The county is also served by several major highways, including Interstate 80, U.S. Route 6, and Iowa Highway 21.
History
Poweshiek County was established in 1843 and named for Chief Poweshiek of the Fox tribe. The county was originally home to several Native American tribes, including the Fox, Sauk, and Meskwaki. The first settlers arrived in the county in the 1840s, and the county was officially organized in 1844.
The county was largely agricultural from its founding, with corn, soybeans, and hay being the primary crops. The county was also home to several manufacturing companies, including John Deere, Iowa Steel, and Iowa Machine Works.
The county was also home to several notable figures, including John F. Kennedy, who was born in the county in 1917. The county was also home to several notable authors, including Pulitzer Prize-winning author Marilynne Robinson, who was born in the county in 1943.
Today, Poweshiek County is a largely agricultural county, with a strong manufacturing sector. The county is home to several state parks, including Lake Macbride State Park, Lake Sugema State Park, and Otter Creek State Park. The county is also home to several small businesses, including restaurants, retail stores, and service providers.
Common Questions
What is Per Capita Income in Poweshiek County?
Per Capita income in Poweshiek County is $37,527.
What is the Median Family Income in Poweshiek County?
Median Family Income in Poweshiek County is $90,108.
What is the Median Household income in Poweshiek County?
Median Household Income in Poweshiek County is $61,192.
What is Income or Wage Gap in Poweshiek County?
Income or Wage Gap in Poweshiek County is 46.9%.
Women in Poweshiek County earn 53.1 cents for every dollar earned by a man.
What is Family Income Deficit in Poweshiek County?
Family Income Deficit in Poweshiek County is $9,543.
Families that are below poverty line in Poweshiek County earn $9,543 less on average than the poverty threshold level.
What is Inequality or Gini Index in Poweshiek County?
Inequality or Gini Index in Poweshiek County is 0.48.
What is the Total Population of Poweshiek County?
Total Population of Poweshiek County is 18,608.
What is the Total Male Population of Poweshiek County?
Total Male Population of Poweshiek County is 9,129.
What is the Total Female Population of Poweshiek County?
Total Female Population of Poweshiek County is 9,479.
What is the Ratio of Males per 100 Females in Poweshiek County?
There are 96.31 Males per 100 Females in Poweshiek County.
What is the Ratio of Females per 100 Males in Poweshiek County?
There are 103.83 Females per 100 Males in Poweshiek County.
What is the Median Population Age in Poweshiek County?
Median Population Age in Poweshiek County is 40.7 Years.
What is the Average Family Size in Poweshiek County
Average Family Size in Poweshiek County is 2.9 People.
What is the Average Household Size in Poweshiek County
Average Household Size in Poweshiek County is 2.2 People.
How Large is the Labor Force in Poweshiek County?
There are 9,668 People in the Labor Forcein in Poweshiek County.
What is the Percentage of People in the Labor Force in Poweshiek County?
62.5% of People are in the Labor Force in Poweshiek County.
What is the Unemployment Rate in Poweshiek County?
Unemployment Rate in Poweshiek County is 4.6%.