Osceola County, IA Map & Demographics
Osceola County Map
Osceola County Overview
$35,657
PER CAPITA INCOME
$80,396
AVG FAMILY INCOME
$67,561
AVG HOUSEHOLD INCOME
41.5%
WAGE / INCOME GAP [ % ]
58.5¢/ $1
WAGE / INCOME GAP [ $ ]
$11,171
FAMILY INCOME DEFICIT
0.40
INEQUALITY / GINI INDEX
6,149
TOTAL POPULATION
3,195
MALE POPULATION
2,954
FEMALE POPULATION
108.16
MALES / 100 FEMALES
92.46
FEMALES / 100 MALES
44.0
MEDIAN AGE
2.9
AVG FAMILY SIZE
2.3
AVG HOUSEHOLD SIZE
3,252
LABOR FORCE [ PEOPLE ]
66.0%
PERCENT IN LABOR FORCE
4.5%
UNEMPLOYMENT RATE
Osceola County Area Codes
Income in Osceola County
Income Overview in Osceola County
Per Capita Income in Osceola County is $35,657, while median incomes of families and households are $80,396 and $67,561 respectively.
| Characteristic | Number | Measure |
| Per Capita Income | 6,149 | $35,657 |
| Median Family Income | 1,583 | $80,396 |
| Mean Family Income | 1,583 | $96,544 |
| Median Household Income | 2,631 | $67,561 |
| Mean Household Income | 2,631 | $81,183 |
| Income Deficit | 1,583 | $11,171 |
| Wage / Income Gap (%) | 6,149 | 41.52% |
| Wage / Income Gap ($) | 6,149 | 58.48¢ per $1 |
| Gini / Inequality Index | 6,149 | 0.40 |
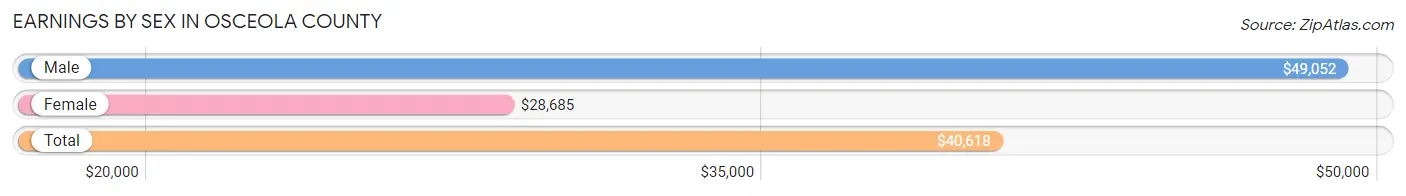
Earnings by Sex in Osceola County
Average Earnings in Osceola County are $40,618, $49,052 for men and $28,685 for women, a difference of 41.5%.
| Sex | Number | Average Earnings |
| Male | 1,999 (58.4%) | $49,052 |
| Female | 1,422 (41.6%) | $28,685 |
| Total | 3,421 (100.0%) | $40,618 |
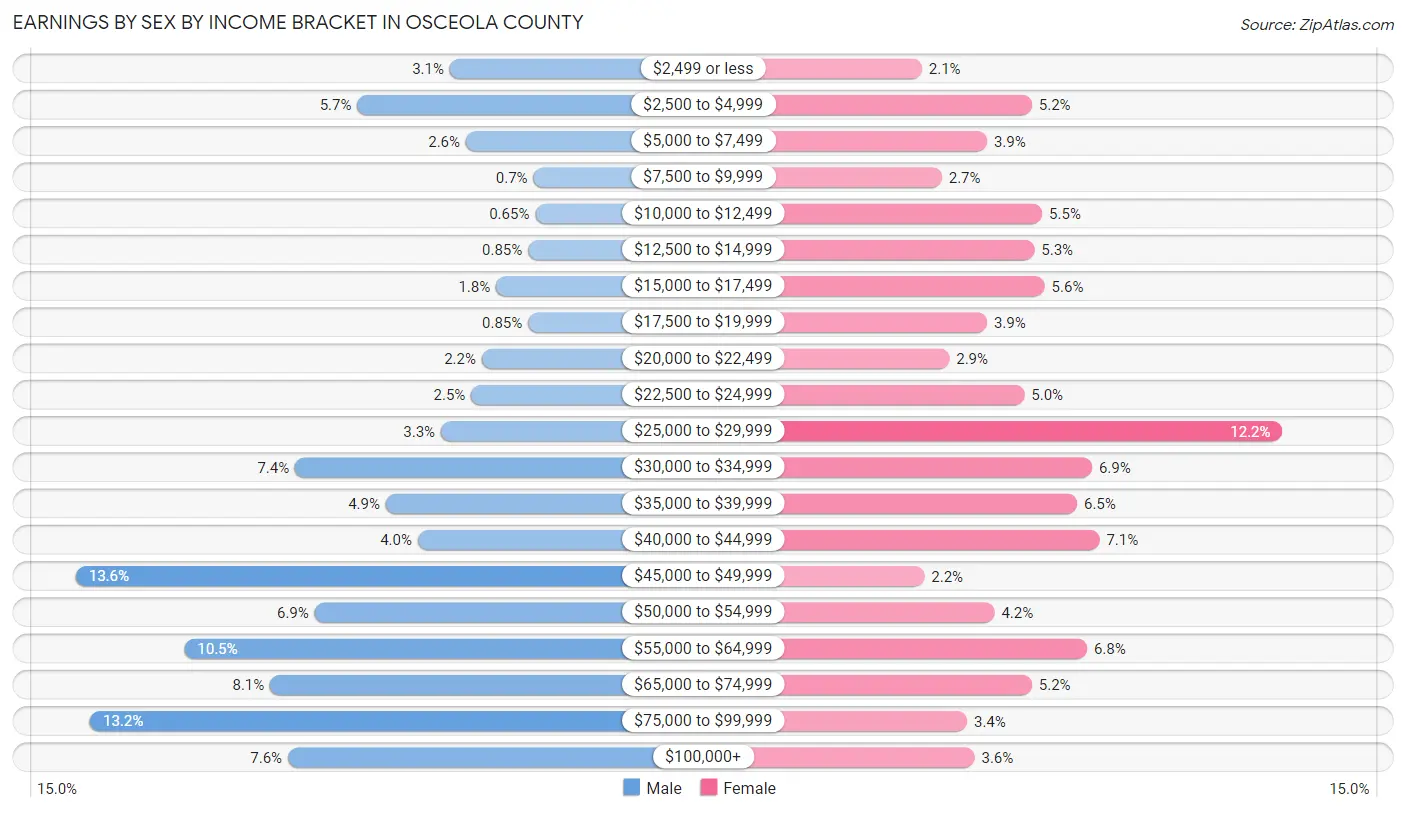
Earnings by Sex by Income Bracket in Osceola County
The most common earnings brackets in Osceola County are $45,000 to $49,999 for men (271 | 13.6%) and $25,000 to $29,999 for women (174 | 12.2%).
| Income | Male | Female |
| $2,499 or less | 61 (3.0%) | 30 (2.1%) |
| $2,500 to $4,999 | 113 (5.7%) | 74 (5.2%) |
| $5,000 to $7,499 | 52 (2.6%) | 56 (3.9%) |
| $7,500 to $9,999 | 14 (0.7%) | 38 (2.7%) |
| $10,000 to $12,499 | 13 (0.6%) | 78 (5.5%) |
| $12,500 to $14,999 | 17 (0.9%) | 75 (5.3%) |
| $15,000 to $17,499 | 35 (1.8%) | 79 (5.6%) |
| $17,500 to $19,999 | 17 (0.9%) | 56 (3.9%) |
| $20,000 to $22,499 | 43 (2.1%) | 41 (2.9%) |
| $22,500 to $24,999 | 49 (2.5%) | 71 (5.0%) |
| $25,000 to $29,999 | 66 (3.3%) | 174 (12.2%) |
| $30,000 to $34,999 | 148 (7.4%) | 98 (6.9%) |
| $35,000 to $39,999 | 97 (4.9%) | 92 (6.5%) |
| $40,000 to $44,999 | 79 (4.0%) | 101 (7.1%) |
| $45,000 to $49,999 | 271 (13.6%) | 31 (2.2%) |
| $50,000 to $54,999 | 137 (6.9%) | 59 (4.2%) |
| $55,000 to $64,999 | 210 (10.5%) | 96 (6.8%) |
| $65,000 to $74,999 | 162 (8.1%) | 74 (5.2%) |
| $75,000 to $99,999 | 263 (13.2%) | 48 (3.4%) |
| $100,000+ | 152 (7.6%) | 51 (3.6%) |
| Total | 1,999 (100.0%) | 1,422 (100.0%) |
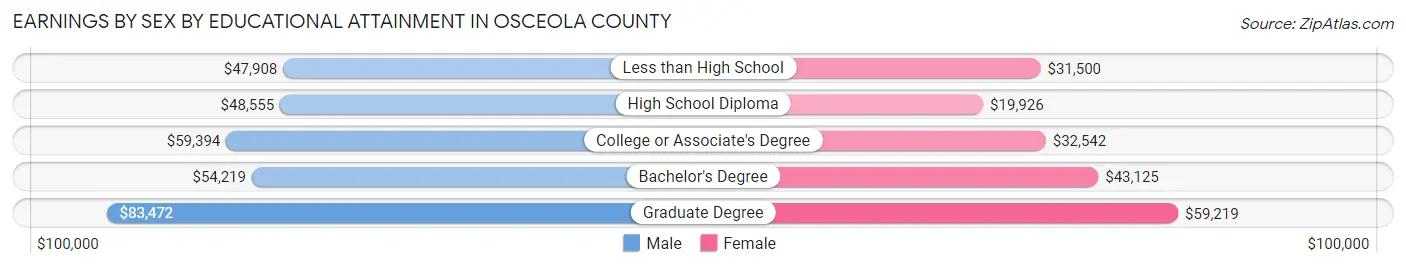
Earnings by Sex by Educational Attainment in Osceola County
Average earnings in Osceola County are $49,833 for men and $30,349 for women, a difference of 39.1%. Men with an educational attainment of graduate degree enjoy the highest average annual earnings of $83,472, while those with less than high school education earn the least with $47,908. Women with an educational attainment of graduate degree earn the most with the average annual earnings of $59,219, while those with high school diploma education have the smallest earnings of $19,926.
| Educational Attainment | Male Income | Female Income |
| Less than High School | $47,908 | $31,500 |
| High School Diploma | $48,555 | $19,926 |
| College or Associate's Degree | $59,394 | $32,542 |
| Bachelor's Degree | $54,219 | $43,125 |
| Graduate Degree | $83,472 | $59,219 |
| Total | $49,833 | $30,349 |
Family Income in Osceola County
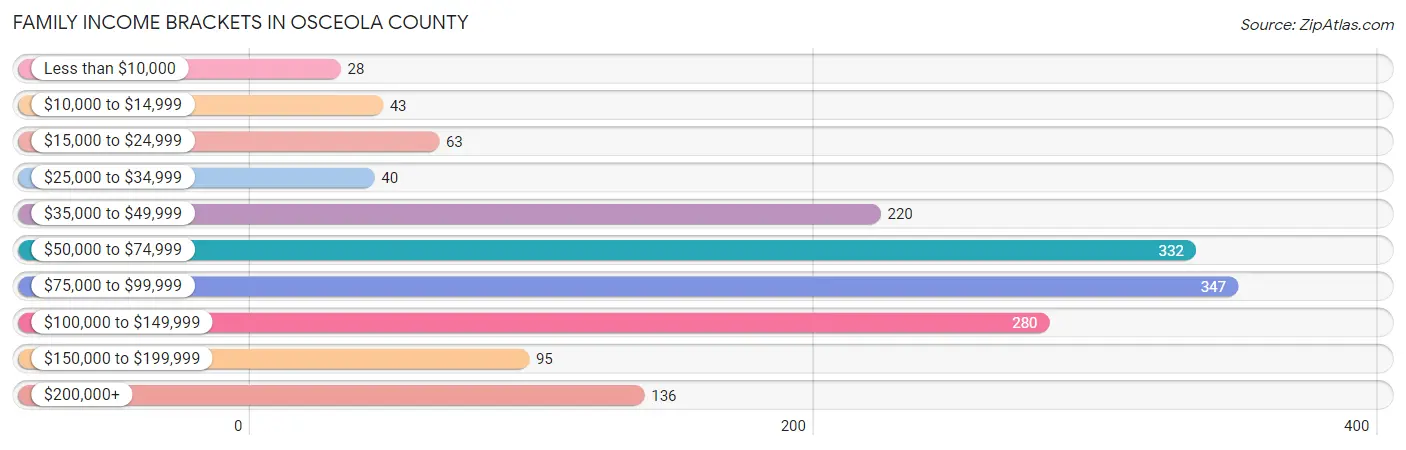
Family Income Brackets in Osceola County
According to the Osceola County family income data, there are 347 families falling into the $75,000 to $99,999 income range, which is the most common income bracket and makes up 21.9% of all families. Conversely, the less than $10,000 income bracket is the least frequent group with only 28 families (1.8%) belonging to this category.
| Income Bracket | # Families | % Families |
| Less than $10,000 | 28 | 1.8% |
| $10,000 to $14,999 | 43 | 2.7% |
| $15,000 to $24,999 | 63 | 4.0% |
| $25,000 to $34,999 | 40 | 2.5% |
| $35,000 to $49,999 | 220 | 13.9% |
| $50,000 to $74,999 | 332 | 21.0% |
| $75,000 to $99,999 | 347 | 21.9% |
| $100,000 to $149,999 | 280 | 17.7% |
| $150,000 to $199,999 | 95 | 6.0% |
| $200,000+ | 136 | 8.6% |
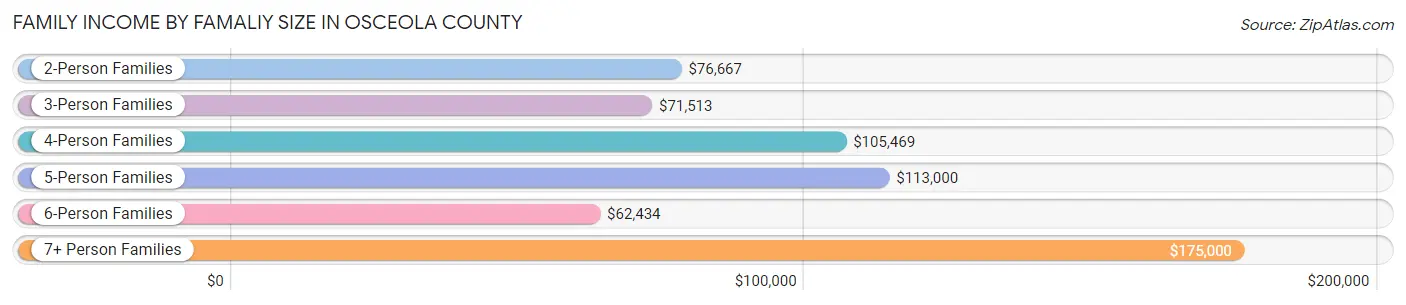
Family Income by Famaliy Size in Osceola County
7+ person families (28 | 1.8%) account for the highest median family income in Osceola County with $175,000 per family, while 2-person families (1,026 | 64.8%) have the highest median income of $38,334 per family member.
| Income Bracket | # Families | Median Income |
| 2-Person Families | 1,026 (64.8%) | $76,667 |
| 3-Person Families | 199 (12.6%) | $71,513 |
| 4-Person Families | 237 (15.0%) | $105,469 |
| 5-Person Families | 56 (3.5%) | $113,000 |
| 6-Person Families | 37 (2.3%) | $62,434 |
| 7+ Person Families | 28 (1.8%) | $175,000 |
| Total | 1,583 (100.0%) | $80,396 |
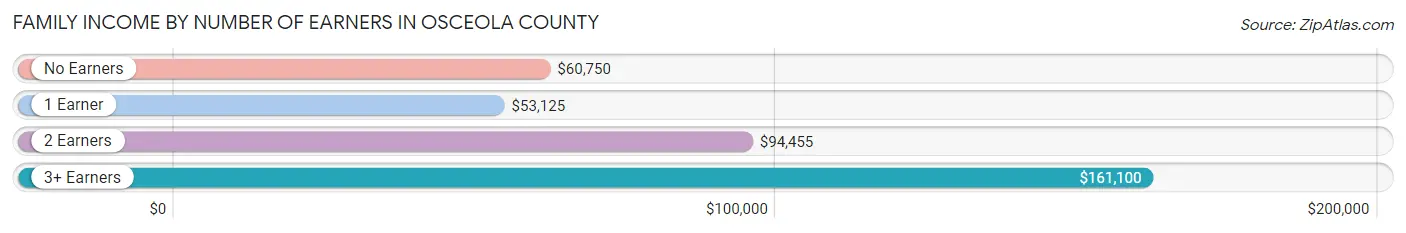
Family Income by Number of Earners in Osceola County
The median family income in Osceola County is $80,396, with families comprising 3+ earners (144) having the highest median family income of $161,100, while families with 1 earner (426) have the lowest median family income of $53,125, accounting for 9.1% and 26.9% of families, respectively.
| Number of Earners | # Families | Median Income |
| No Earners | 228 (14.4%) | $60,750 |
| 1 Earner | 426 (26.9%) | $53,125 |
| 2 Earners | 785 (49.6%) | $94,455 |
| 3+ Earners | 144 (9.1%) | $161,100 |
| Total | 1,583 (100.0%) | $80,396 |
Household Income in Osceola County
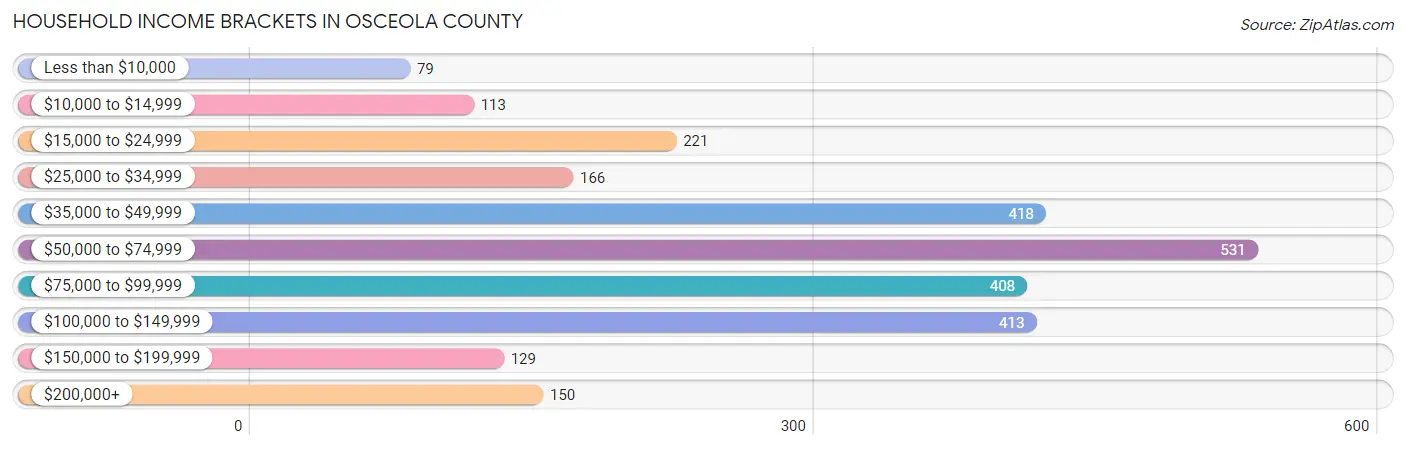
Household Income Brackets in Osceola County
With 531 households falling in the category, the $50,000 to $74,999 income range is the most frequent in Osceola County, accounting for 20.2% of all households. In contrast, only 79 households (3.0%) fall into the less than $10,000 income bracket, making it the least populous group.
| Income Bracket | # Households | % Households |
| Less than $10,000 | 79 | 3.0% |
| $10,000 to $14,999 | 113 | 4.3% |
| $15,000 to $24,999 | 221 | 8.4% |
| $25,000 to $34,999 | 166 | 6.3% |
| $35,000 to $49,999 | 418 | 15.9% |
| $50,000 to $74,999 | 531 | 20.2% |
| $75,000 to $99,999 | 408 | 15.5% |
| $100,000 to $149,999 | 413 | 15.7% |
| $150,000 to $199,999 | 129 | 4.9% |
| $200,000+ | 150 | 5.7% |
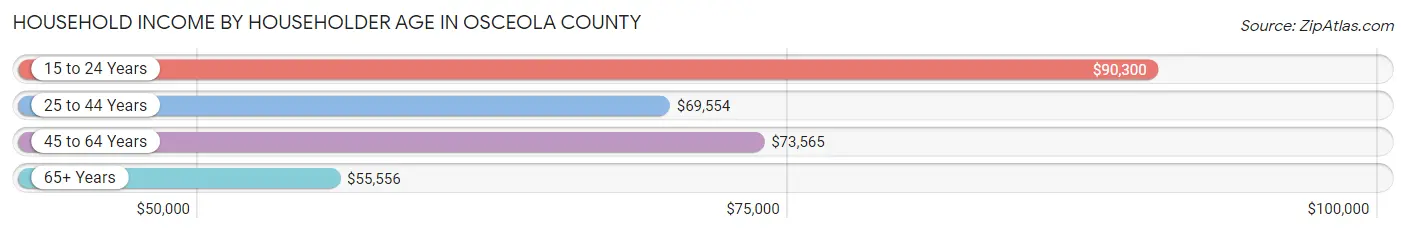
Household Income by Householder Age in Osceola County
The median household income in Osceola County is $67,561, with the highest median household income of $90,300 found in the 15 to 24 years age bracket for the primary householder. A total of 100 households (3.8%) fall into this category. Meanwhile, the 65+ years age bracket for the primary householder has the lowest median household income of $55,556, with 830 households (31.6%) in this group.
| Income Bracket | # Households | Median Income |
| 15 to 24 Years | 100 (3.8%) | $90,300 |
| 25 to 44 Years | 642 (24.4%) | $69,554 |
| 45 to 64 Years | 1,059 (40.3%) | $73,565 |
| 65+ Years | 830 (31.6%) | $55,556 |
| Total | 2,631 (100.0%) | $67,561 |
Poverty in Osceola County
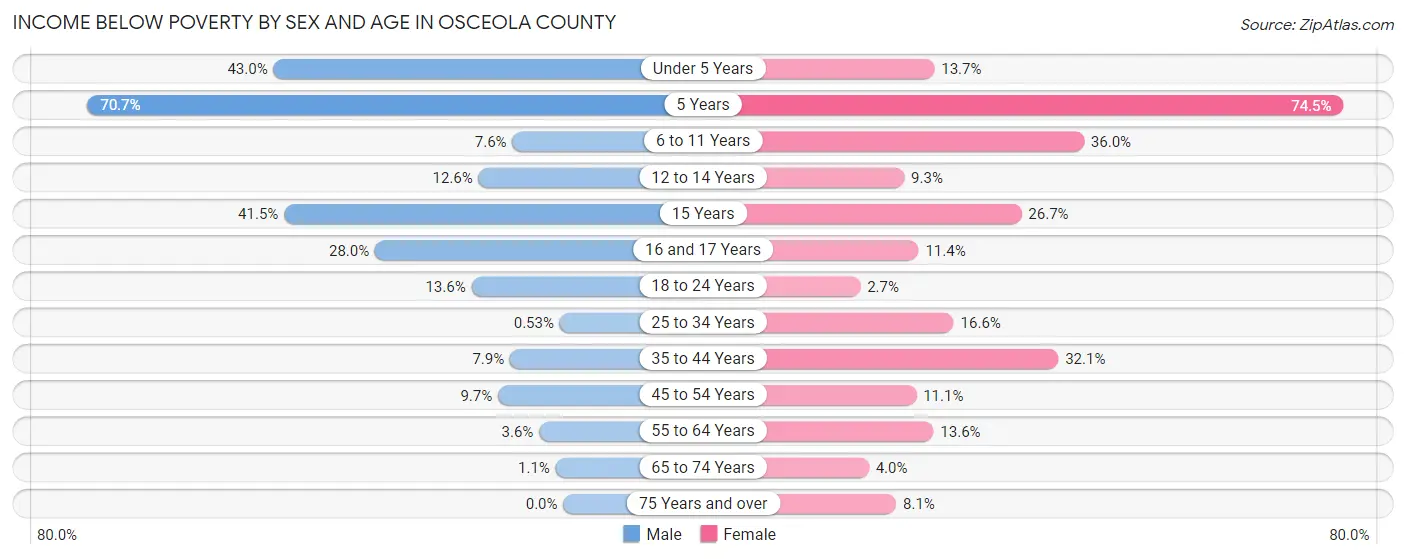
Income Below Poverty by Sex and Age in Osceola County
With 9.5% poverty level for males and 16.0% for females among the residents of Osceola County, 5 year old males and 5 year old females are the most vulnerable to poverty, with 41 males (70.7%) and 35 females (74.5%) in their respective age groups living below the poverty level.
| Age Bracket | Male | Female |
| Under 5 Years | 68 (43.0%) | 18 (13.7%) |
| 5 Years | 41 (70.7%) | 35 (74.5%) |
| 6 to 11 Years | 17 (7.6%) | 87 (35.9%) |
| 12 to 14 Years | 17 (12.6%) | 10 (9.3%) |
| 15 Years | 17 (41.5%) | 12 (26.7%) |
| 16 and 17 Years | 26 (28.0%) | 9 (11.4%) |
| 18 to 24 Years | 27 (13.6%) | 5 (2.7%) |
| 25 to 34 Years | 2 (0.5%) | 46 (16.6%) |
| 35 to 44 Years | 28 (7.9%) | 99 (32.1%) |
| 45 to 54 Years | 32 (9.7%) | 38 (11.1%) |
| 55 to 64 Years | 20 (3.6%) | 62 (13.6%) |
| 65 to 74 Years | 4 (1.1%) | 13 (4.0%) |
| 75 Years and over | 0 (0.0%) | 27 (8.1%) |
| Total | 299 (9.5%) | 461 (16.0%) |
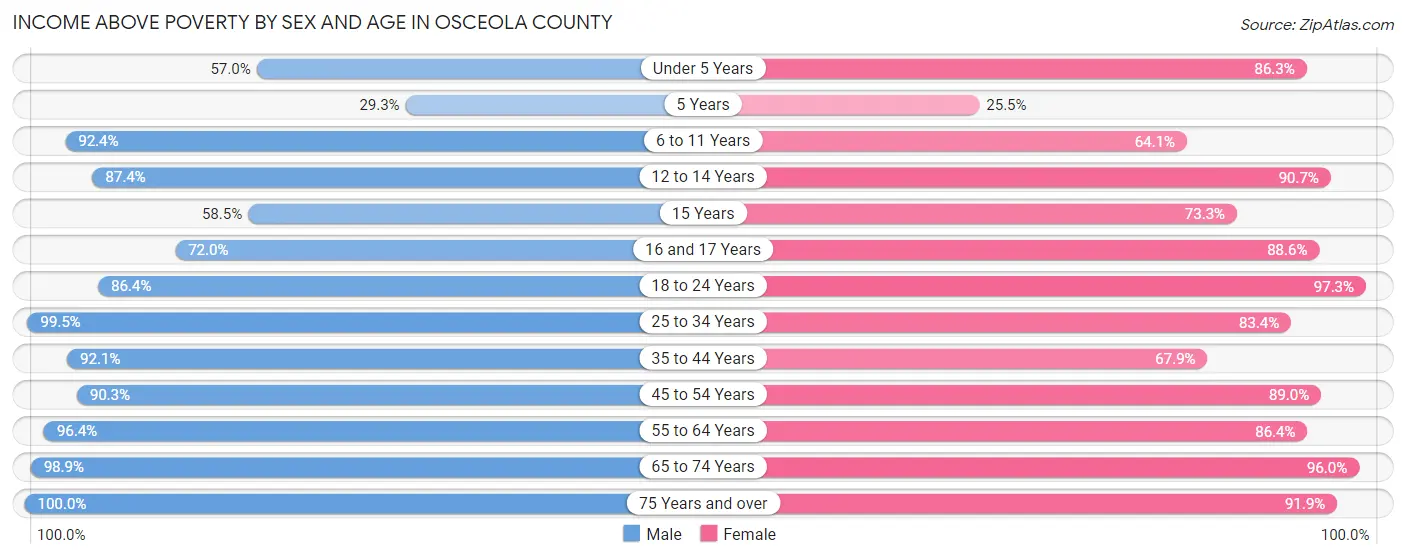
Income Above Poverty by Sex and Age in Osceola County
According to the poverty statistics in Osceola County, males aged 75 years and over and females aged 18 to 24 years are the age groups that are most secure financially, with 100.0% of males and 97.3% of females in these age groups living above the poverty line.
| Age Bracket | Male | Female |
| Under 5 Years | 90 (57.0%) | 113 (86.3%) |
| 5 Years | 17 (29.3%) | 12 (25.5%) |
| 6 to 11 Years | 208 (92.4%) | 155 (64.0%) |
| 12 to 14 Years | 118 (87.4%) | 98 (90.7%) |
| 15 Years | 24 (58.5%) | 33 (73.3%) |
| 16 and 17 Years | 67 (72.0%) | 70 (88.6%) |
| 18 to 24 Years | 171 (86.4%) | 178 (97.3%) |
| 25 to 34 Years | 372 (99.5%) | 231 (83.4%) |
| 35 to 44 Years | 326 (92.1%) | 209 (67.9%) |
| 45 to 54 Years | 298 (90.3%) | 306 (88.9%) |
| 55 to 64 Years | 537 (96.4%) | 394 (86.4%) |
| 65 to 74 Years | 347 (98.9%) | 312 (96.0%) |
| 75 Years and over | 259 (100.0%) | 308 (91.9%) |
| Total | 2,834 (90.5%) | 2,419 (84.0%) |
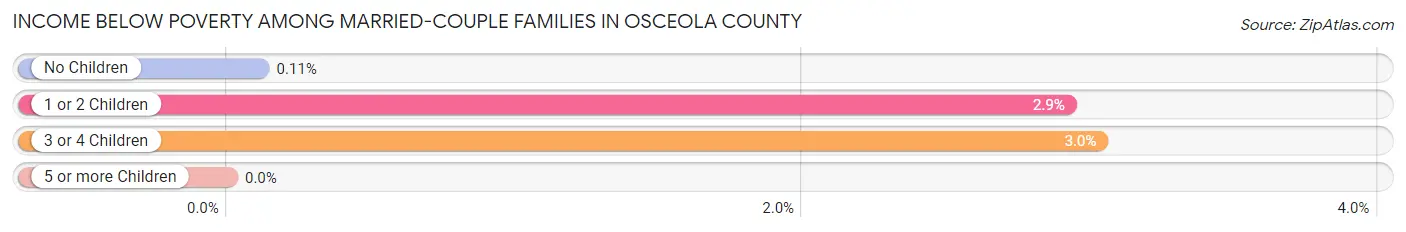
Income Below Poverty Among Married-Couple Families in Osceola County
The poverty statistics for married-couple families in Osceola County show that 0.9% or 11 of the total 1,281 families live below the poverty line. Families with 3 or 4 children have the highest poverty rate of 3.0%, comprising of 3 families. On the other hand, families with 5 or more children have the lowest poverty rate of 0.0%, which includes 0 families.
| Children | Above Poverty | Below Poverty |
| No Children | 937 (99.9%) | 1 (0.1%) |
| 1 or 2 Children | 233 (97.1%) | 7 (2.9%) |
| 3 or 4 Children | 96 (97.0%) | 3 (3.0%) |
| 5 or more Children | 4 (100.0%) | 0 (0.0%) |
| Total | 1,270 (99.1%) | 11 (0.9%) |
Income Below Poverty Among Single-Parent Households in Osceola County
According to the poverty data in Osceola County, 19.6% or 19 single-father households and 47.3% or 97 single-mother households are living below the poverty line. Among single-father households, those with 1 or 2 children have the highest poverty rate, with 19 households (38.8%) experiencing poverty. Likewise, among single-mother households, those with 5 or more children have the highest poverty rate, with 4 households (100.0%) falling below the poverty line.
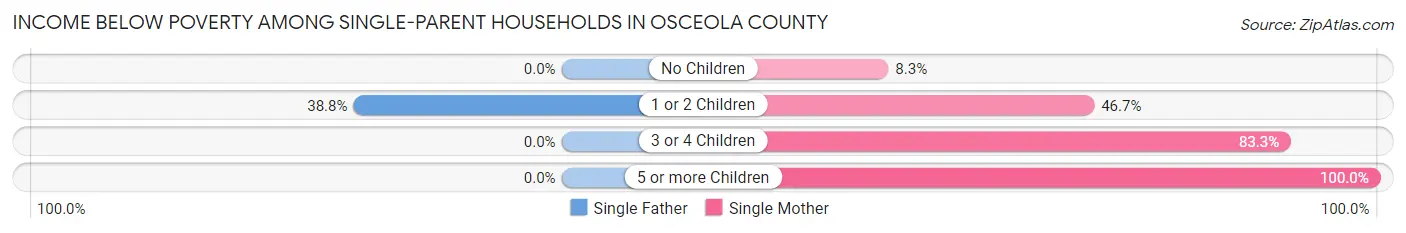
| Children | Single Father | Single Mother |
| No Children | 0 (0.0%) | 4 (8.3%) |
| 1 or 2 Children | 19 (38.8%) | 49 (46.7%) |
| 3 or 4 Children | 0 (0.0%) | 40 (83.3%) |
| 5 or more Children | 0 (0.0%) | 4 (100.0%) |
| Total | 19 (19.6%) | 97 (47.3%) |
Income Below Poverty Among Married-Couple vs Single-Parent Households in Osceola County
The poverty data for Osceola County shows that 11 of the married-couple family households (0.9%) and 116 of the single-parent households (38.4%) are living below the poverty level. Within the married-couple family households, those with 3 or 4 children have the highest poverty rate, with 3 households (3.0%) falling below the poverty line. Among the single-parent households, those with 5 or more children have the highest poverty rate, with 4 household (100.0%) living below poverty.
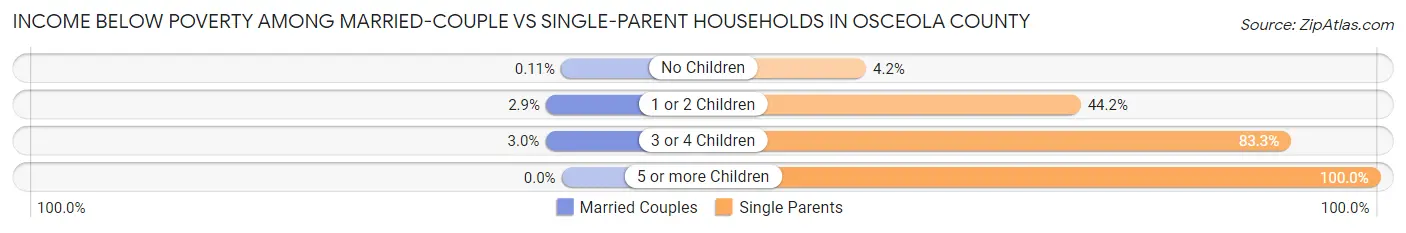
| Children | Married-Couple Families | Single-Parent Households |
| No Children | 1 (0.1%) | 4 (4.2%) |
| 1 or 2 Children | 7 (2.9%) | 68 (44.2%) |
| 3 or 4 Children | 3 (3.0%) | 40 (83.3%) |
| 5 or more Children | 0 (0.0%) | 4 (100.0%) |
| Total | 11 (0.9%) | 116 (38.4%) |
Race in Osceola County
The most populous races in Osceola County are White / Caucasian (5,651 | 91.9%), Hispanic or Latino (544 | 8.8%), and Two or more Races (233 | 3.8%).
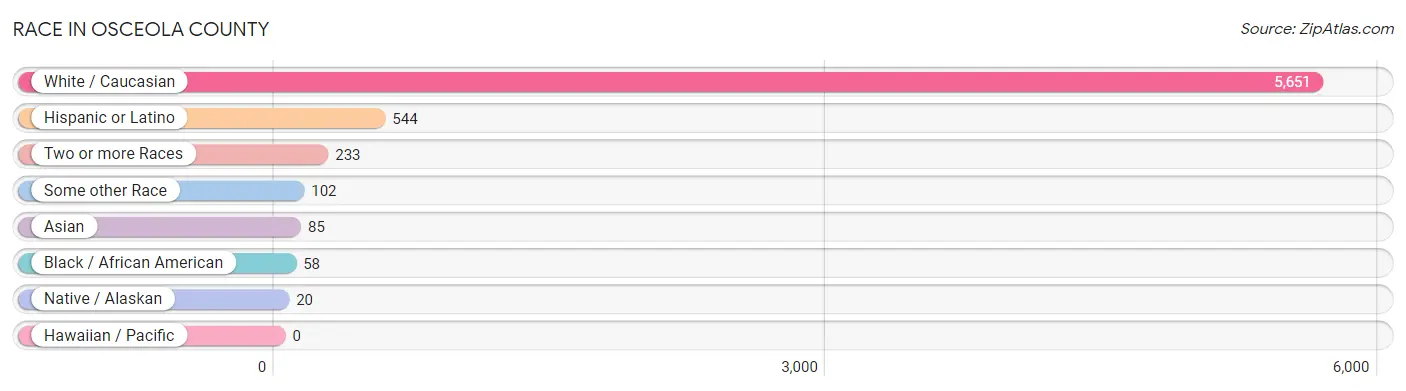
| Race | # Population | % Population |
| Asian | 85 | 1.4% |
| Black / African American | 58 | 0.9% |
| Hawaiian / Pacific | 0 | 0.0% |
| Hispanic or Latino | 544 | 8.8% |
| Native / Alaskan | 20 | 0.3% |
| White / Caucasian | 5,651 | 91.9% |
| Two or more Races | 233 | 3.8% |
| Some other Race | 102 | 1.7% |
| Total | 6,149 | 100.0% |
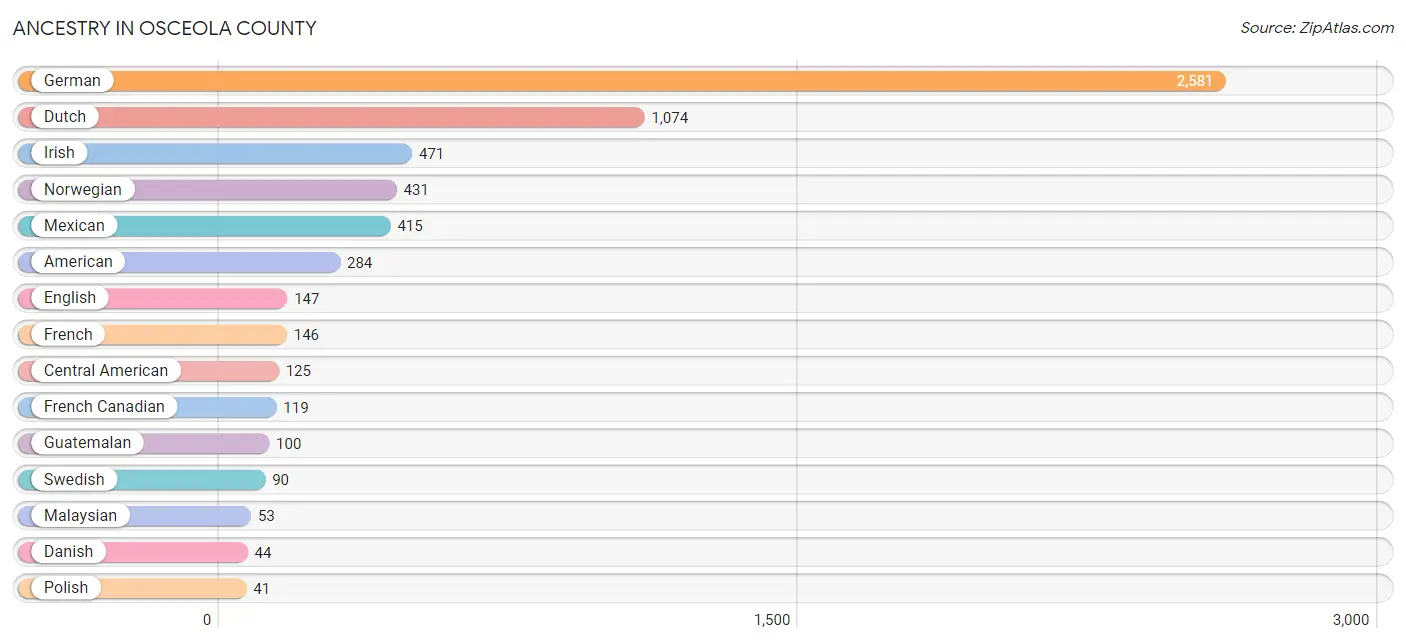
Ancestry in Osceola County
The most populous ancestries reported in Osceola County are German (2,581 | 42.0%), Dutch (1,074 | 17.5%), Irish (471 | 7.7%), Norwegian (431 | 7.0%), and Mexican (415 | 6.8%), together accounting for 80.9% of all Osceola County residents.
| Ancestry | # Population | % Population |
| American | 284 | 4.6% |
| Apache | 1 | 0.0% |
| Austrian | 5 | 0.1% |
| Bhutanese | 5 | 0.1% |
| Brazilian | 4 | 0.1% |
| British | 1 | 0.0% |
| Central American | 125 | 2.0% |
| Cherokee | 12 | 0.2% |
| Chippewa | 5 | 0.1% |
| Czech | 8 | 0.1% |
| Czechoslovakian | 13 | 0.2% |
| Danish | 44 | 0.7% |
| Dutch | 1,074 | 17.5% |
| English | 147 | 2.4% |
| European | 30 | 0.5% |
| Finnish | 3 | 0.1% |
| French | 146 | 2.4% |
| French Canadian | 119 | 1.9% |
| German | 2,581 | 42.0% |
| Greek | 6 | 0.1% |
| Guatemalan | 100 | 1.6% |
| Icelander | 5 | 0.1% |
| Irish | 471 | 7.7% |
| Italian | 25 | 0.4% |
| Latvian | 4 | 0.1% |
| Luxembourger | 11 | 0.2% |
| Malaysian | 53 | 0.9% |
| Mexican | 415 | 6.8% |
| Northern European | 14 | 0.2% |
| Norwegian | 431 | 7.0% |
| Polish | 41 | 0.7% |
| Russian | 4 | 0.1% |
| Salvadoran | 25 | 0.4% |
| Scandinavian | 21 | 0.3% |
| Scotch-Irish | 9 | 0.2% |
| Scottish | 20 | 0.3% |
| Sioux | 3 | 0.1% |
| Sri Lankan | 4 | 0.1% |
| Swedish | 90 | 1.5% |
| Swiss | 1 | 0.0% |
| Thai | 12 | 0.2% |
| Welsh | 9 | 0.2% | View All 42 Rows |
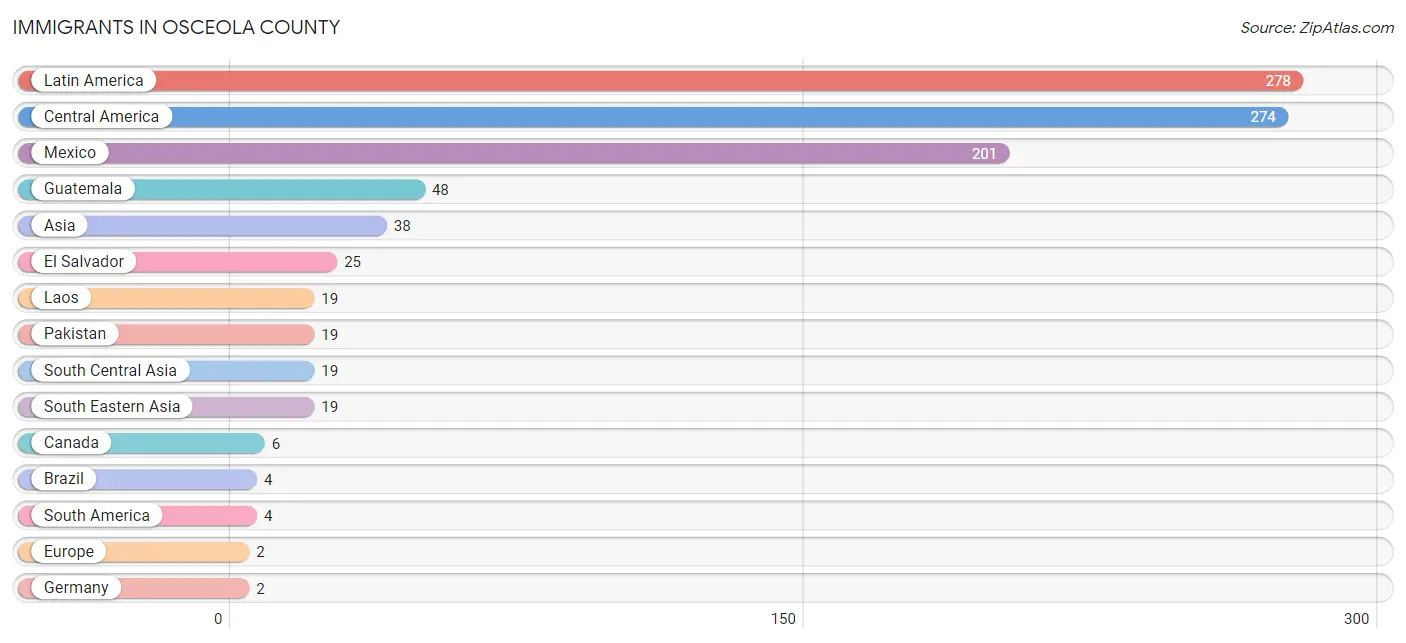
Immigrants in Osceola County
The most numerous immigrant groups reported in Osceola County came from Latin America (278 | 4.5%), Central America (274 | 4.5%), Mexico (201 | 3.3%), Guatemala (48 | 0.8%), and Asia (38 | 0.6%), together accounting for 13.7% of all Osceola County residents.
| Immigration Origin | # Population | % Population |
| Asia | 38 | 0.6% |
| Brazil | 4 | 0.1% |
| Canada | 6 | 0.1% |
| Central America | 274 | 4.5% |
| El Salvador | 25 | 0.4% |
| Europe | 2 | 0.0% |
| Germany | 2 | 0.0% |
| Guatemala | 48 | 0.8% |
| Laos | 19 | 0.3% |
| Latin America | 278 | 4.5% |
| Mexico | 201 | 3.3% |
| Pakistan | 19 | 0.3% |
| South America | 4 | 0.1% |
| South Central Asia | 19 | 0.3% |
| South Eastern Asia | 19 | 0.3% |
| Western Europe | 2 | 0.0% | View All 16 Rows |
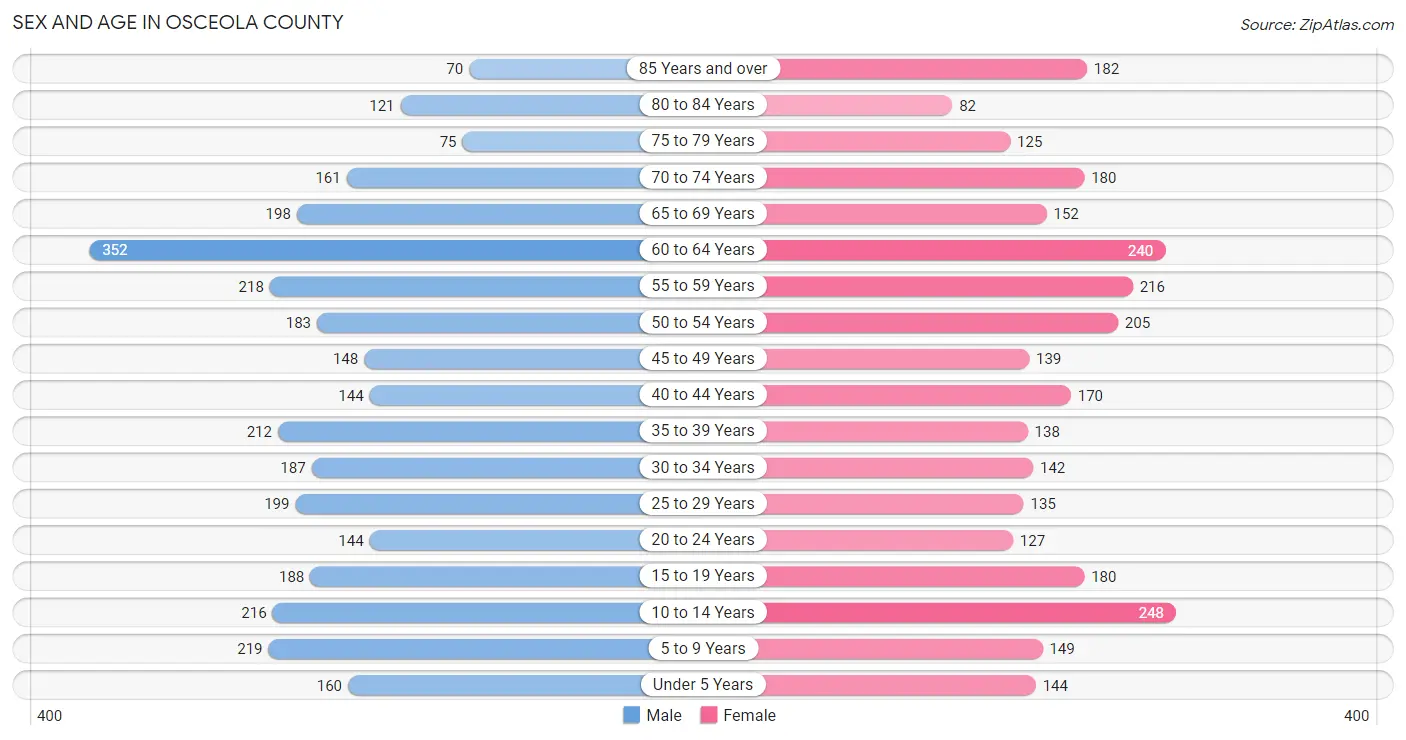
Sex and Age in Osceola County
Sex and Age in Osceola County
The most populous age groups in Osceola County are 60 to 64 Years (352 | 11.0%) for men and 10 to 14 Years (248 | 8.4%) for women.
| Age Bracket | Male | Female |
| Under 5 Years | 160 (5.0%) | 144 (4.9%) |
| 5 to 9 Years | 219 (6.9%) | 149 (5.0%) |
| 10 to 14 Years | 216 (6.8%) | 248 (8.4%) |
| 15 to 19 Years | 188 (5.9%) | 180 (6.1%) |
| 20 to 24 Years | 144 (4.5%) | 127 (4.3%) |
| 25 to 29 Years | 199 (6.2%) | 135 (4.6%) |
| 30 to 34 Years | 187 (5.9%) | 142 (4.8%) |
| 35 to 39 Years | 212 (6.6%) | 138 (4.7%) |
| 40 to 44 Years | 144 (4.5%) | 170 (5.8%) |
| 45 to 49 Years | 148 (4.6%) | 139 (4.7%) |
| 50 to 54 Years | 183 (5.7%) | 205 (6.9%) |
| 55 to 59 Years | 218 (6.8%) | 216 (7.3%) |
| 60 to 64 Years | 352 (11.0%) | 240 (8.1%) |
| 65 to 69 Years | 198 (6.2%) | 152 (5.1%) |
| 70 to 74 Years | 161 (5.0%) | 180 (6.1%) |
| 75 to 79 Years | 75 (2.4%) | 125 (4.2%) |
| 80 to 84 Years | 121 (3.8%) | 82 (2.8%) |
| 85 Years and over | 70 (2.2%) | 182 (6.2%) |
| Total | 3,195 (100.0%) | 2,954 (100.0%) |
Families and Households in Osceola County
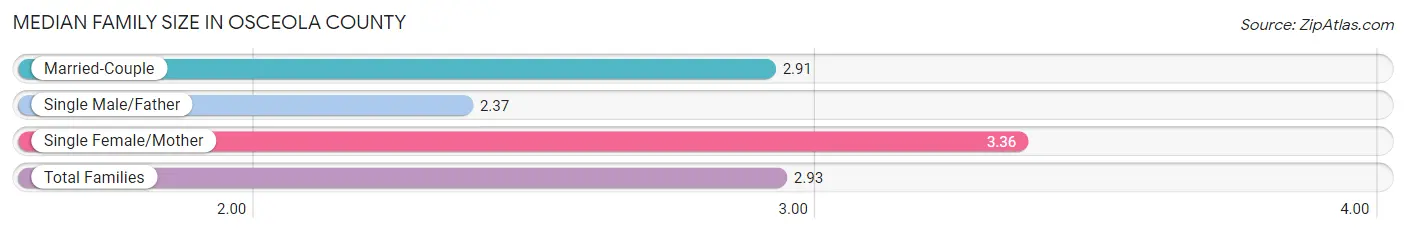
Median Family Size in Osceola County
The median family size in Osceola County is 2.93 persons per family, with single female/mother families (205 | 13.0%) accounting for the largest median family size of 3.36 persons per family. On the other hand, single male/father families (97 | 6.1%) represent the smallest median family size with 2.37 persons per family.
| Family Type | # Families | Family Size |
| Married-Couple | 1,281 (80.9%) | 2.91 |
| Single Male/Father | 97 (6.1%) | 2.37 |
| Single Female/Mother | 205 (13.0%) | 3.36 |
| Total Families | 1,583 (100.0%) | 2.93 |
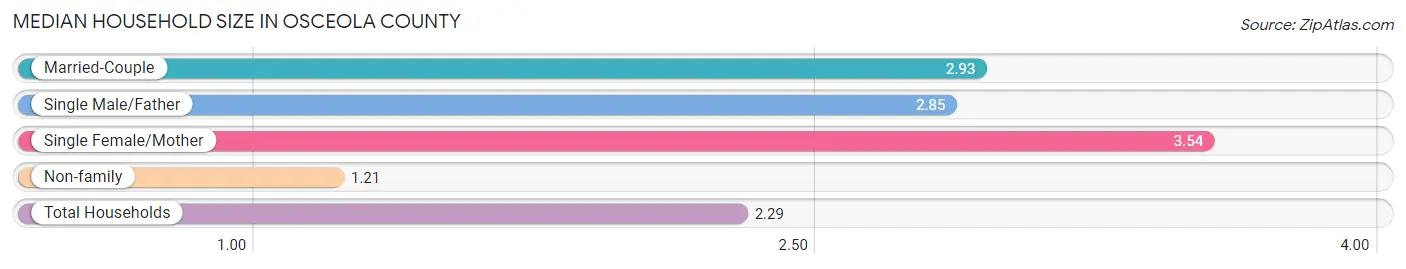
Median Household Size in Osceola County
The median household size in Osceola County is 2.29 persons per household, with single female/mother households (205 | 7.8%) accounting for the largest median household size of 3.54 persons per household. non-family households (1,048 | 39.8%) represent the smallest median household size with 1.21 persons per household.
| Household Type | # Households | Household Size |
| Married-Couple | 1,281 (48.7%) | 2.93 |
| Single Male/Father | 97 (3.7%) | 2.85 |
| Single Female/Mother | 205 (7.8%) | 3.54 |
| Non-family | 1,048 (39.8%) | 1.21 |
| Total Households | 2,631 (100.0%) | 2.29 |
Household Size by Marriage Status in Osceola County
Out of a total of 2,631 households in Osceola County, 1,583 (60.2%) are family households, while 1,048 (39.8%) are nonfamily households. The most numerous type of family households are 2-person households, comprising 969, and the most common type of nonfamily households are 1-person households, comprising 870.
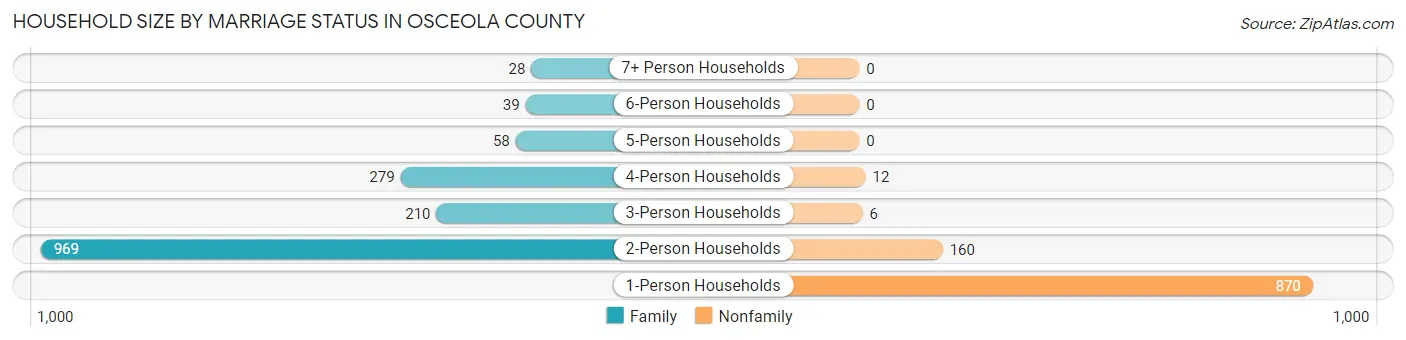
| Household Size | Family Households | Nonfamily Households |
| 1-Person Households | - | 870 (33.1%) |
| 2-Person Households | 969 (36.8%) | 160 (6.1%) |
| 3-Person Households | 210 (8.0%) | 6 (0.2%) |
| 4-Person Households | 279 (10.6%) | 12 (0.5%) |
| 5-Person Households | 58 (2.2%) | 0 (0.0%) |
| 6-Person Households | 39 (1.5%) | 0 (0.0%) |
| 7+ Person Households | 28 (1.1%) | 0 (0.0%) |
| Total | 1,583 (60.2%) | 1,048 (39.8%) |
Female Fertility in Osceola County
Fertility by Age in Osceola County
Average fertility rate in Osceola County is 43.0 births per 1,000 women. Women in the age bracket of 20 to 34 years have the highest fertility rate with 62.0 births per 1,000 women. Women in the age bracket of 20 to 34 years acount for 54.3% of all women with births.
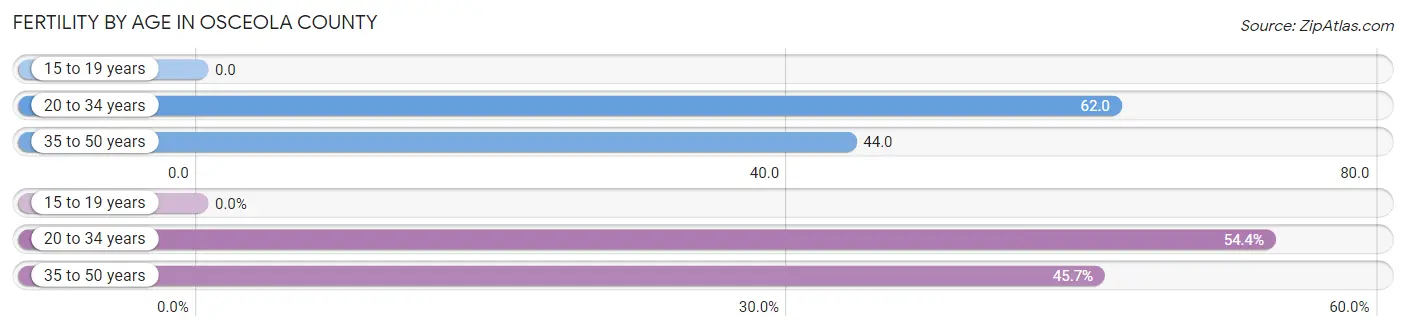
| Age Bracket | Women with Births | Births / 1,000 Women |
| 15 to 19 years | 0 (0.0%) | 0.0 |
| 20 to 34 years | 25 (54.3%) | 62.0 |
| 35 to 50 years | 21 (45.7%) | 44.0 |
| Total | 46 (100.0%) | 43.0 |
Fertility by Age by Marriage Status in Osceola County
95.7% of women with births (46) in Osceola County are married. The highest percentage of unmarried women with births falls into 20 to 34 years age bracket with 8.0% of them unmarried at the time of birth, while the lowest percentage of unmarried women with births belong to 35 to 50 years age bracket with 0.0% of them unmarried.
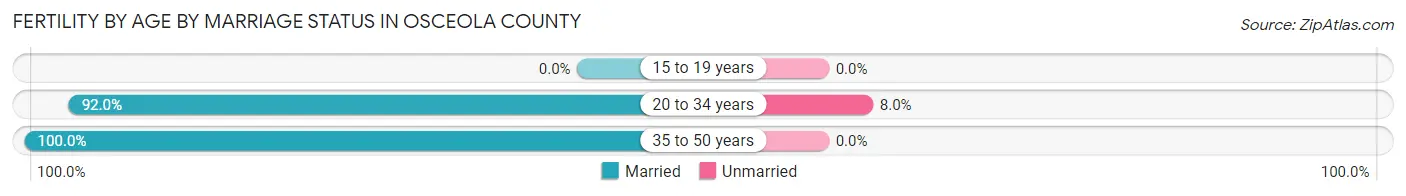
| Age Bracket | Married | Unmarried |
| 15 to 19 years | 0 (0.0%) | 0 (0.0%) |
| 20 to 34 years | 23 (92.0%) | 2 (8.0%) |
| 35 to 50 years | 21 (100.0%) | 0 (0.0%) |
| Total | 44 (95.7%) | 2 (4.3%) |
Fertility by Education in Osceola County
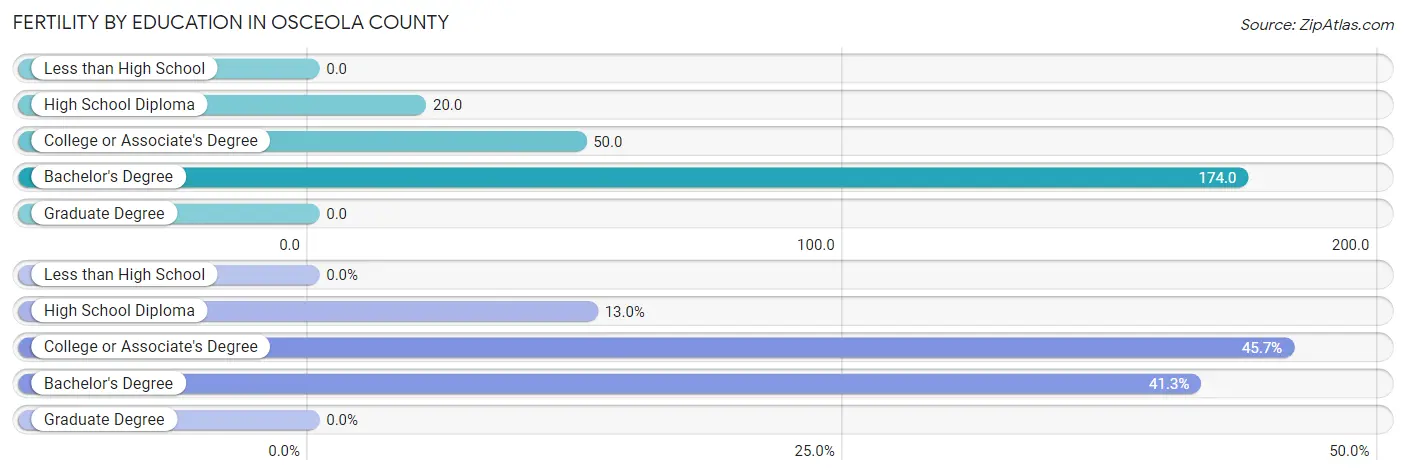
| Educational Attainment | Women with Births | Births / 1,000 Women |
| Less than High School | 0 (0.0%) | 0.0 |
| High School Diploma | 6 (13.0%) | 20.0 |
| College or Associate's Degree | 21 (45.7%) | 50.0 |
| Bachelor's Degree | 19 (41.3%) | 174.0 |
| Graduate Degree | 0 (0.0%) | 0.0 |
| Total | 46 (100.0%) | 43.0 |
Fertility by Education by Marriage Status in Osceola County
4.3% of women with births in Osceola County are unmarried. Women with the educational attainment of college or associate's degree are most likely to be married with 100.0% of them married at childbirth, while women with the educational attainment of high school diploma are least likely to be married with 33.3% of them unmarried at childbirth.
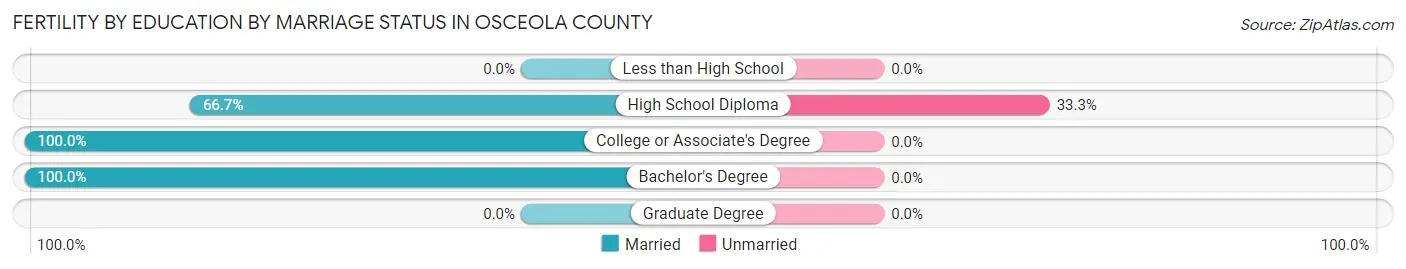
| Educational Attainment | Married | Unmarried |
| Less than High School | 0 (0.0%) | 0 (0.0%) |
| High School Diploma | 4 (66.7%) | 2 (33.3%) |
| College or Associate's Degree | 21 (100.0%) | 0 (0.0%) |
| Bachelor's Degree | 19 (100.0%) | 0 (0.0%) |
| Graduate Degree | 0 (0.0%) | 0 (0.0%) |
| Total | 44 (95.7%) | 2 (4.3%) |
Employment Characteristics in Osceola County
Employment by Class of Employer in Osceola County
Among the 3,035 employed individuals in Osceola County, private company employees (1,927 | 63.5%), self-employed (not incorporated) (390 | 12.9%), and self-employed (incorporated) (259 | 8.5%) make up the most common classes of employment.
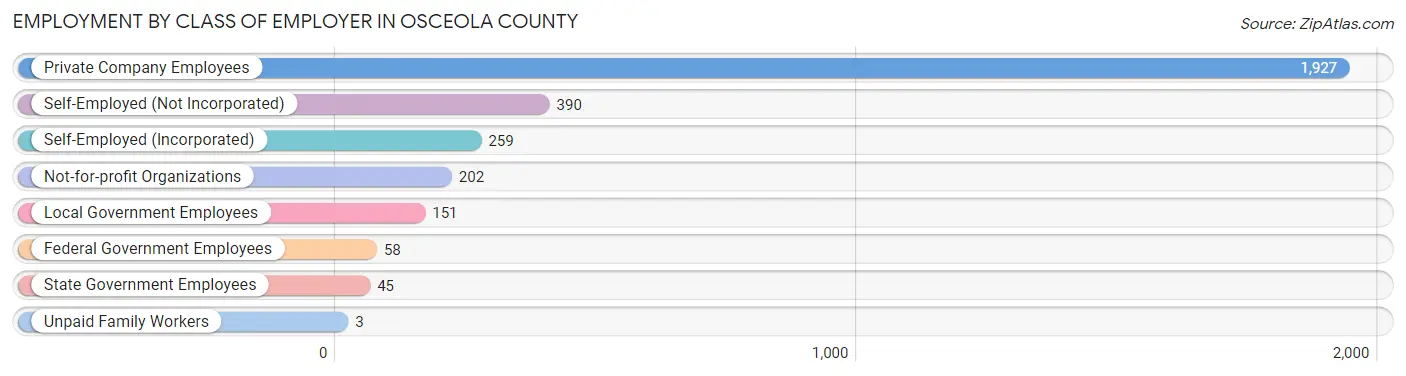
| Employer Class | # Employees | % Employees |
| Private Company Employees | 1,927 | 63.5% |
| Self-Employed (Incorporated) | 259 | 8.5% |
| Self-Employed (Not Incorporated) | 390 | 12.9% |
| Not-for-profit Organizations | 202 | 6.7% |
| Local Government Employees | 151 | 5.0% |
| State Government Employees | 45 | 1.5% |
| Federal Government Employees | 58 | 1.9% |
| Unpaid Family Workers | 3 | 0.1% |
| Total | 3,035 | 100.0% |
Employment Status by Age in Osceola County
According to the labor force statistics for Osceola County, out of the total population over 16 years of age (4,927), 66.0% or 3,252 individuals are in the labor force, with 4.5% or 146 of them unemployed. The age group with the highest labor force participation rate is 20 to 24 years, with 94.8% or 257 individuals in the labor force. Within the labor force, the 35 to 44 years age range has the highest percentage of unemployed individuals, with 12.2% or 72 of them being unemployed.
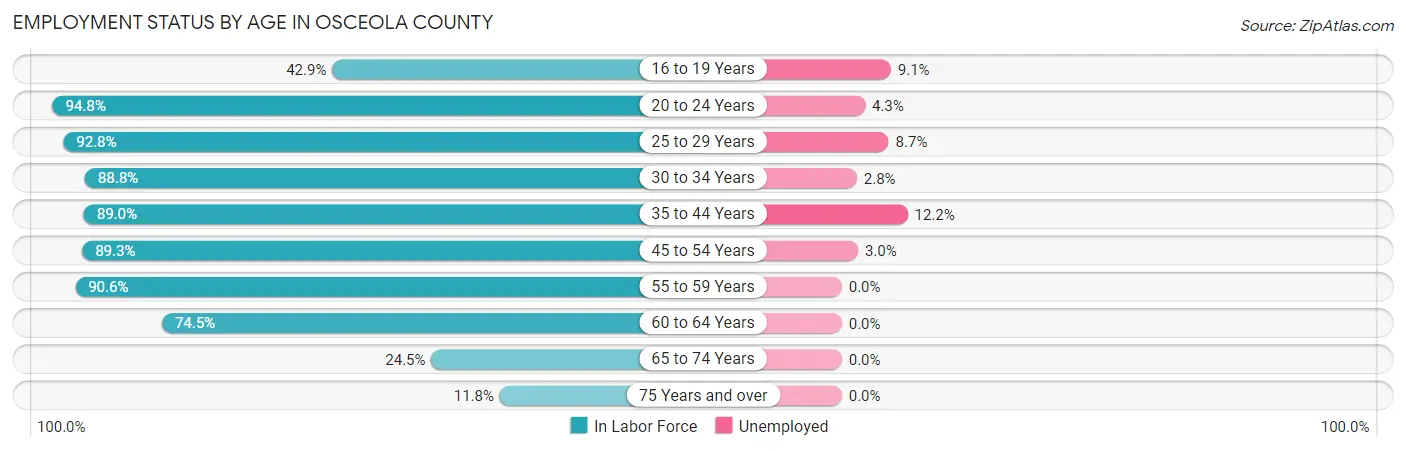
| Age Bracket | In Labor Force | Unemployed |
| 16 to 19 Years | 121 (42.9%) | 11 (9.1%) |
| 20 to 24 Years | 257 (94.8%) | 11 (4.3%) |
| 25 to 29 Years | 310 (92.8%) | 27 (8.7%) |
| 30 to 34 Years | 292 (88.8%) | 8 (2.8%) |
| 35 to 44 Years | 591 (89.0%) | 72 (12.2%) |
| 45 to 54 Years | 603 (89.3%) | 18 (3.0%) |
| 55 to 59 Years | 393 (90.6%) | 0 (0.0%) |
| 60 to 64 Years | 441 (74.5%) | 0 (0.0%) |
| 65 to 74 Years | 169 (24.5%) | 0 (0.0%) |
| 75 Years and over | 77 (11.8%) | 0 (0.0%) |
| Total | 3,252 (66.0%) | 146 (4.5%) |
Employment Status by Educational Attainment in Osceola County
According to labor force statistics for Osceola County, 86.9% of individuals (2,631) out of the total population between 25 and 64 years of age (3,028) are in the labor force, with 4.8% or 126 of them being unemployed. The group with the highest labor force participation rate are those with the educational attainment of bachelor's degree or higher, with 92.6% or 428 individuals in the labor force. Within the labor force, individuals with college / associate degree education have the highest percentage of unemployment, with 7.5% or 78 of them being unemployed.
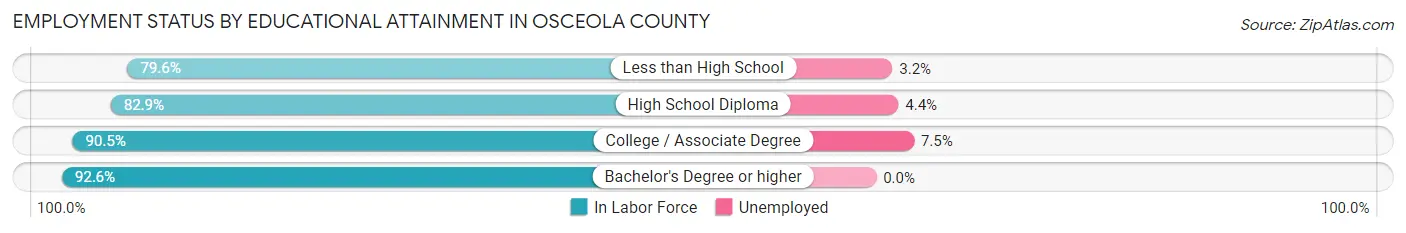
| Educational Attainment | In Labor Force | Unemployed |
| Less than High School | 312 (79.6%) | 13 (3.2%) |
| High School Diploma | 856 (82.9%) | 45 (4.4%) |
| College / Associate Degree | 1,034 (90.5%) | 86 (7.5%) |
| Bachelor's Degree or higher | 428 (92.6%) | 0 (0.0%) |
| Total | 2,631 (86.9%) | 145 (4.8%) |
Employment Occupations by Sex in Osceola County
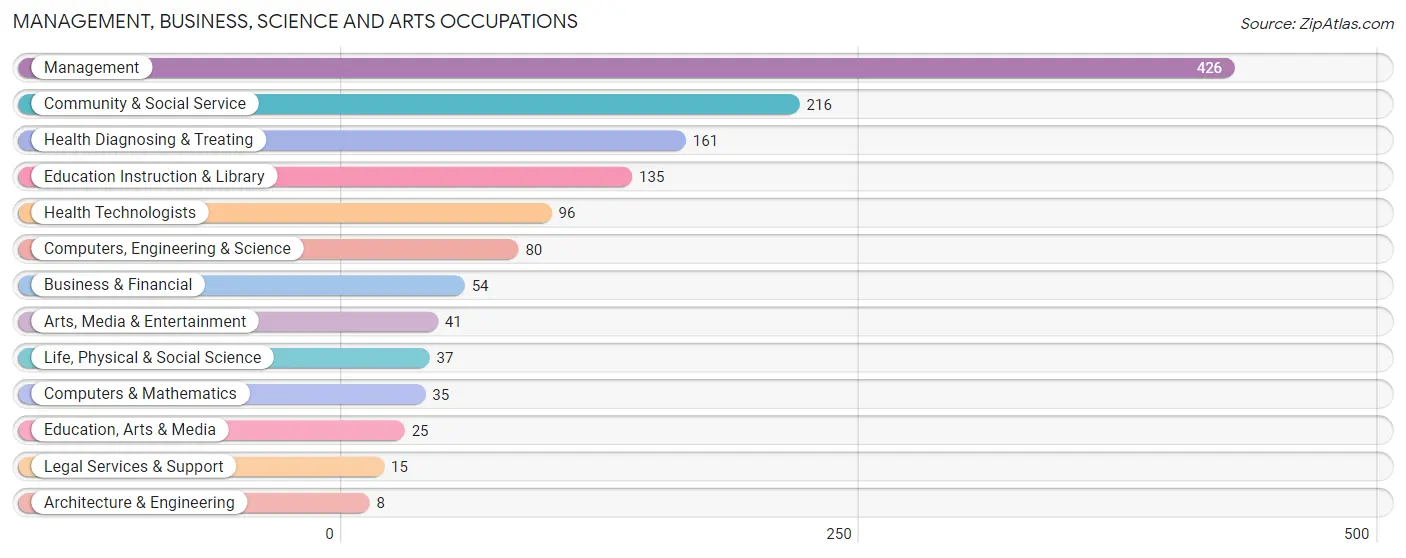
Management, Business, Science and Arts Occupations
The most common Management, Business, Science and Arts occupations in Osceola County are Management (426 | 13.8%), Community & Social Service (216 | 7.0%), Health Diagnosing & Treating (161 | 5.2%), Education Instruction & Library (135 | 4.4%), and Health Technologists (96 | 3.1%).
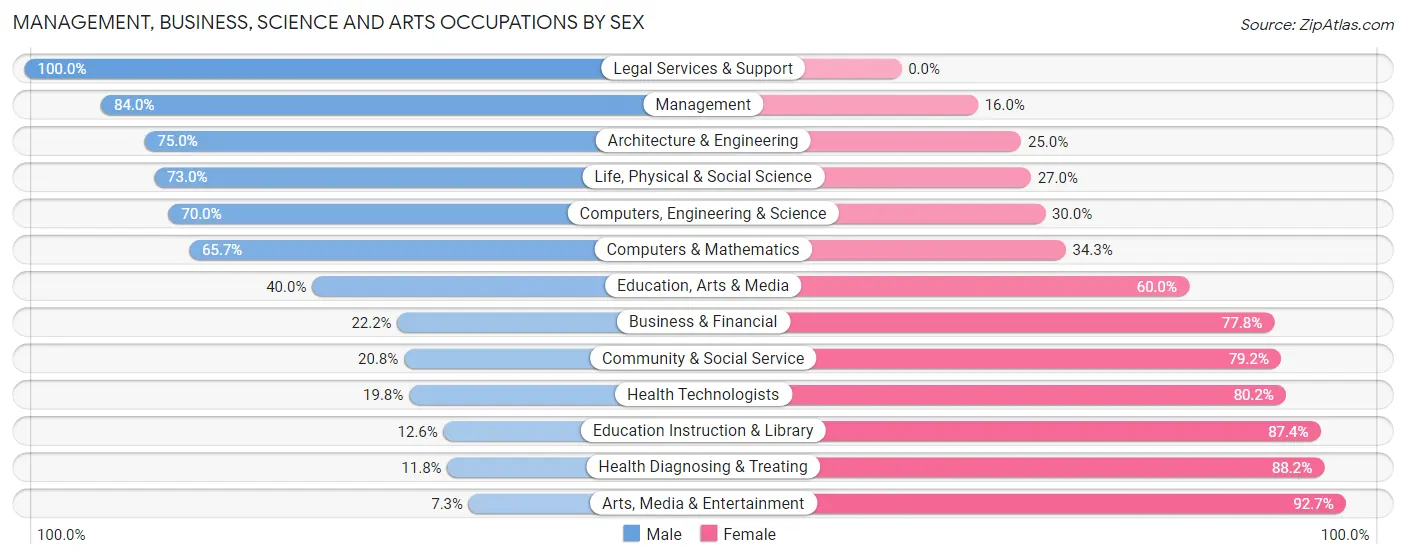
Management, Business, Science and Arts Occupations by Sex
Within the Management, Business, Science and Arts occupations in Osceola County, the most male-oriented occupations are Legal Services & Support (100.0%), Management (84.0%), and Architecture & Engineering (75.0%), while the most female-oriented occupations are Arts, Media & Entertainment (92.7%), Health Diagnosing & Treating (88.2%), and Education Instruction & Library (87.4%).
| Occupation | Male | Female |
| Management | 358 (84.0%) | 68 (16.0%) |
| Business & Financial | 12 (22.2%) | 42 (77.8%) |
| Computers, Engineering & Science | 56 (70.0%) | 24 (30.0%) |
| Computers & Mathematics | 23 (65.7%) | 12 (34.3%) |
| Architecture & Engineering | 6 (75.0%) | 2 (25.0%) |
| Life, Physical & Social Science | 27 (73.0%) | 10 (27.0%) |
| Community & Social Service | 45 (20.8%) | 171 (79.2%) |
| Education, Arts & Media | 10 (40.0%) | 15 (60.0%) |
| Legal Services & Support | 15 (100.0%) | 0 (0.0%) |
| Education Instruction & Library | 17 (12.6%) | 118 (87.4%) |
| Arts, Media & Entertainment | 3 (7.3%) | 38 (92.7%) |
| Health Diagnosing & Treating | 19 (11.8%) | 142 (88.2%) |
| Health Technologists | 19 (19.8%) | 77 (80.2%) |
| Total (Category) | 490 (52.3%) | 447 (47.7%) |
| Total (Overall) | 1,765 (57.0%) | 1,334 (43.0%) |
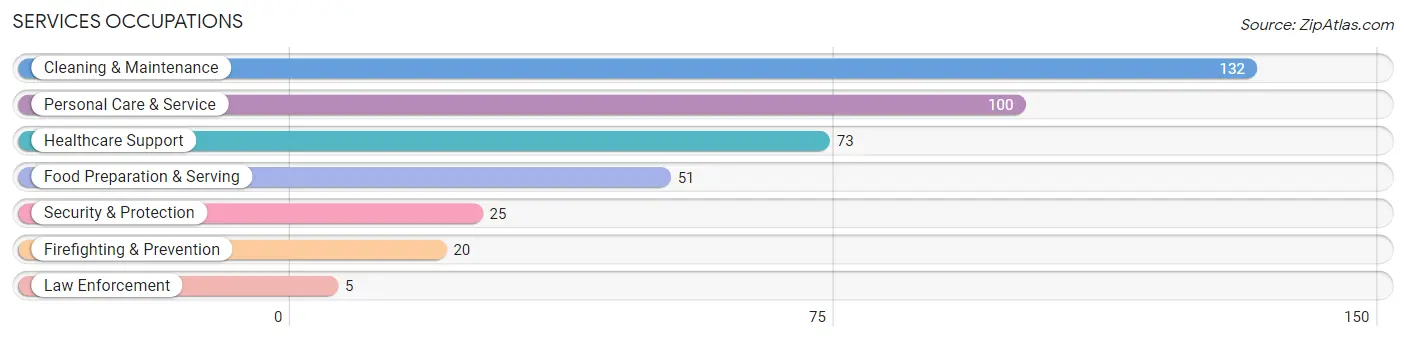
Services Occupations
The most common Services occupations in Osceola County are Cleaning & Maintenance (132 | 4.3%), Personal Care & Service (100 | 3.2%), Healthcare Support (73 | 2.4%), Food Preparation & Serving (51 | 1.7%), and Security & Protection (25 | 0.8%).
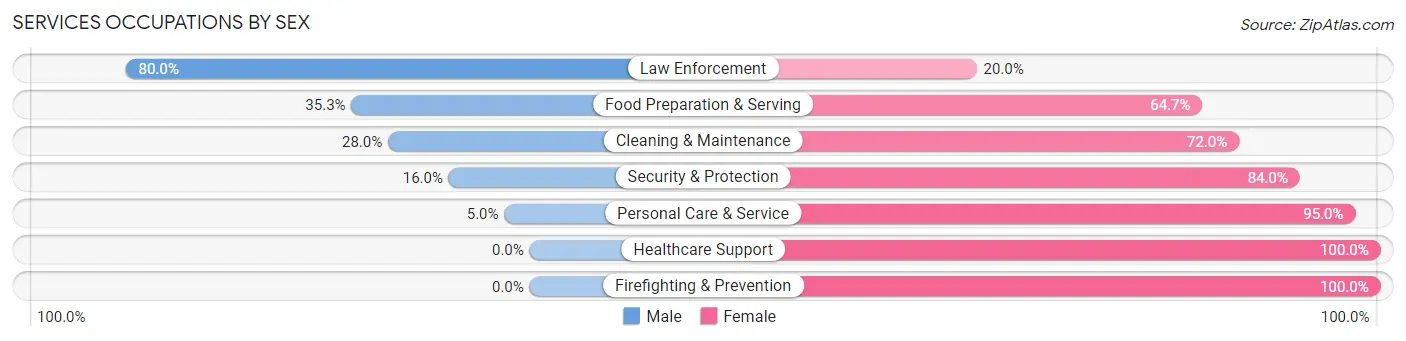
Services Occupations by Sex
Within the Services occupations in Osceola County, the most male-oriented occupations are Law Enforcement (80.0%), Food Preparation & Serving (35.3%), and Cleaning & Maintenance (28.0%), while the most female-oriented occupations are Healthcare Support (100.0%), Firefighting & Prevention (100.0%), and Personal Care & Service (95.0%).
| Occupation | Male | Female |
| Healthcare Support | 0 (0.0%) | 73 (100.0%) |
| Security & Protection | 4 (16.0%) | 21 (84.0%) |
| Firefighting & Prevention | 0 (0.0%) | 20 (100.0%) |
| Law Enforcement | 4 (80.0%) | 1 (20.0%) |
| Food Preparation & Serving | 18 (35.3%) | 33 (64.7%) |
| Cleaning & Maintenance | 37 (28.0%) | 95 (72.0%) |
| Personal Care & Service | 5 (5.0%) | 95 (95.0%) |
| Total (Category) | 64 (16.8%) | 317 (83.2%) |
| Total (Overall) | 1,765 (57.0%) | 1,334 (43.0%) |
Sales and Office Occupations
The most common Sales and Office occupations in Osceola County are Office & Administration (315 | 10.2%), and Sales & Related (170 | 5.5%).

Sales and Office Occupations by Sex

| Occupation | Male | Female |
| Sales & Related | 64 (37.7%) | 106 (62.4%) |
| Office & Administration | 47 (14.9%) | 268 (85.1%) |
| Total (Category) | 111 (22.9%) | 374 (77.1%) |
| Total (Overall) | 1,765 (57.0%) | 1,334 (43.0%) |
Natural Resources, Construction and Maintenance Occupations
The most common Natural Resources, Construction and Maintenance occupations in Osceola County are Construction & Extraction (205 | 6.6%), Farming, Fishing & Forestry (177 | 5.7%), and Installation, Maintenance & Repair (153 | 4.9%).

Natural Resources, Construction and Maintenance Occupations by Sex
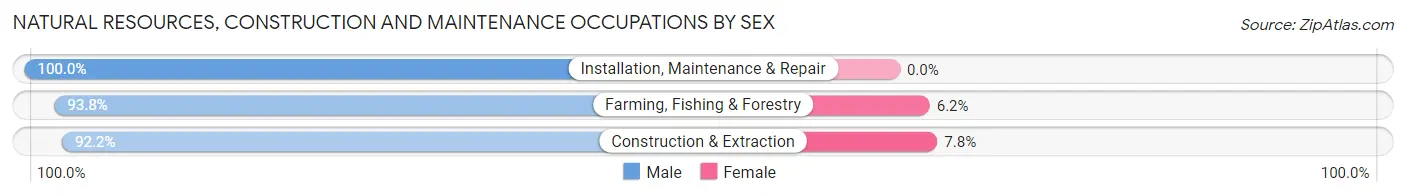
| Occupation | Male | Female |
| Farming, Fishing & Forestry | 166 (93.8%) | 11 (6.2%) |
| Construction & Extraction | 189 (92.2%) | 16 (7.8%) |
| Installation, Maintenance & Repair | 153 (100.0%) | 0 (0.0%) |
| Total (Category) | 508 (95.0%) | 27 (5.1%) |
| Total (Overall) | 1,765 (57.0%) | 1,334 (43.0%) |
Production, Transportation and Moving Occupations
The most common Production, Transportation and Moving occupations in Osceola County are Production (388 | 12.5%), Transportation (257 | 8.3%), and Material Moving (116 | 3.7%).

Production, Transportation and Moving Occupations by Sex
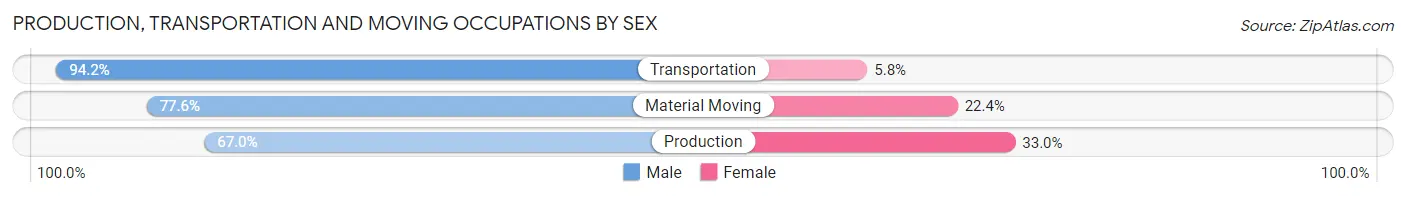
| Occupation | Male | Female |
| Production | 260 (67.0%) | 128 (33.0%) |
| Transportation | 242 (94.2%) | 15 (5.8%) |
| Material Moving | 90 (77.6%) | 26 (22.4%) |
| Total (Category) | 592 (77.8%) | 169 (22.2%) |
| Total (Overall) | 1,765 (57.0%) | 1,334 (43.0%) |
Employment Industries by Sex in Osceola County
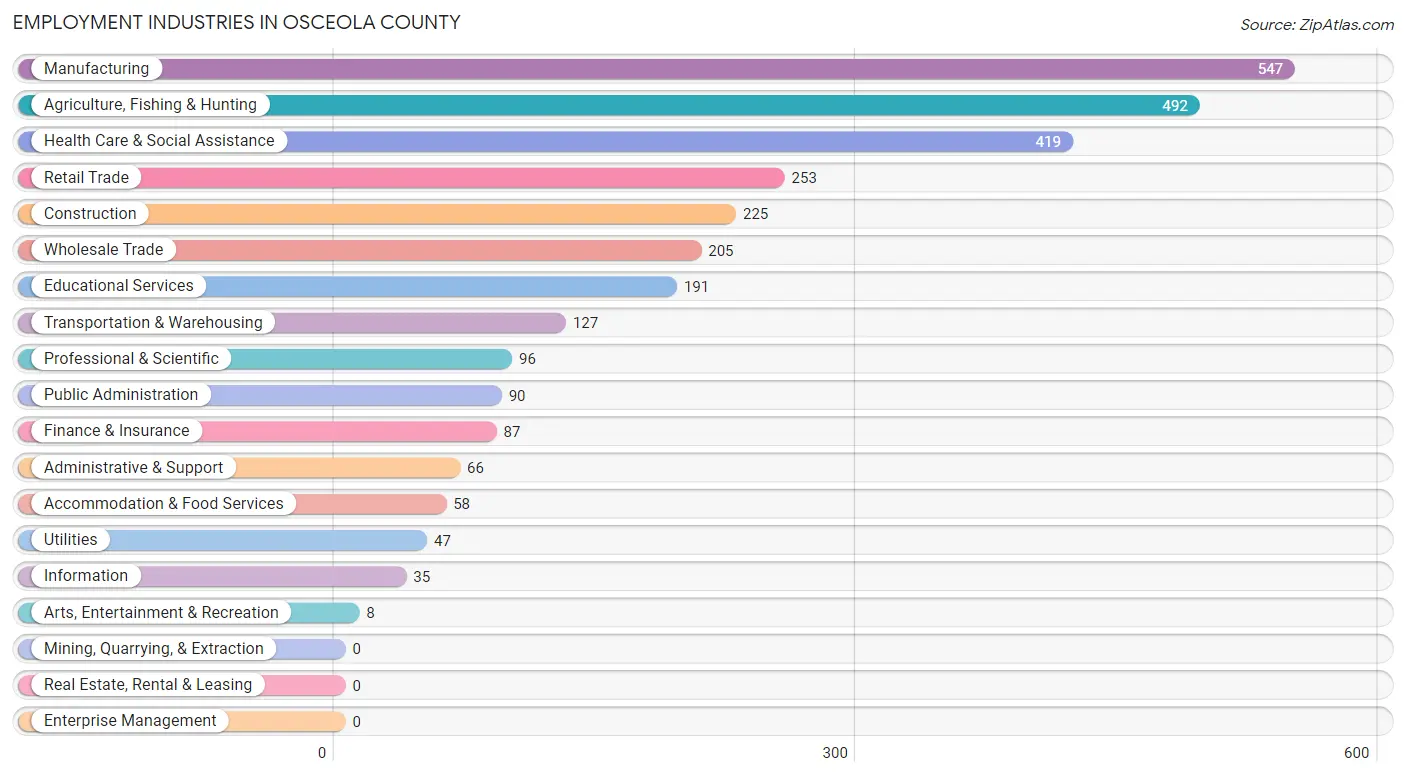
Employment Industries in Osceola County
The major employment industries in Osceola County include Manufacturing (547 | 17.6%), Agriculture, Fishing & Hunting (492 | 15.9%), Health Care & Social Assistance (419 | 13.5%), Retail Trade (253 | 8.2%), and Construction (225 | 7.3%).
Employment Industries by Sex in Osceola County
The Osceola County industries that see more men than women are Agriculture, Fishing & Hunting (93.9%), Wholesale Trade (90.2%), and Transportation & Warehousing (89.8%), whereas the industries that tend to have a higher number of women are Finance & Insurance (91.9%), Health Care & Social Assistance (90.7%), and Educational Services (75.4%).
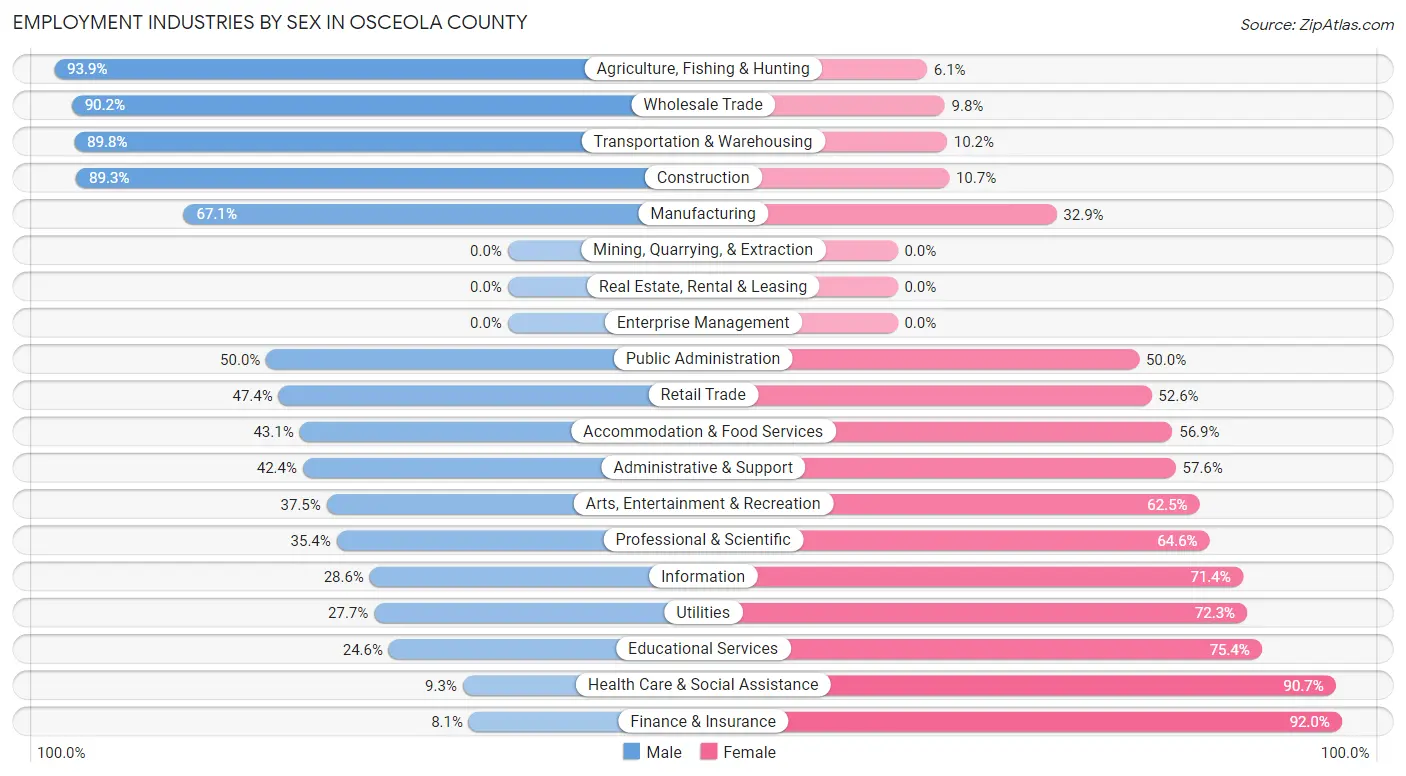
| Industry | Male | Female |
| Agriculture, Fishing & Hunting | 462 (93.9%) | 30 (6.1%) |
| Mining, Quarrying, & Extraction | 0 (0.0%) | 0 (0.0%) |
| Construction | 201 (89.3%) | 24 (10.7%) |
| Manufacturing | 367 (67.1%) | 180 (32.9%) |
| Wholesale Trade | 185 (90.2%) | 20 (9.8%) |
| Retail Trade | 120 (47.4%) | 133 (52.6%) |
| Transportation & Warehousing | 114 (89.8%) | 13 (10.2%) |
| Utilities | 13 (27.7%) | 34 (72.3%) |
| Information | 10 (28.6%) | 25 (71.4%) |
| Finance & Insurance | 7 (8.1%) | 80 (91.9%) |
| Real Estate, Rental & Leasing | 0 (0.0%) | 0 (0.0%) |
| Professional & Scientific | 34 (35.4%) | 62 (64.6%) |
| Enterprise Management | 0 (0.0%) | 0 (0.0%) |
| Administrative & Support | 28 (42.4%) | 38 (57.6%) |
| Educational Services | 47 (24.6%) | 144 (75.4%) |
| Health Care & Social Assistance | 39 (9.3%) | 380 (90.7%) |
| Arts, Entertainment & Recreation | 3 (37.5%) | 5 (62.5%) |
| Accommodation & Food Services | 25 (43.1%) | 33 (56.9%) |
| Public Administration | 45 (50.0%) | 45 (50.0%) |
| Total | 1,765 (57.0%) | 1,334 (43.0%) |
Education in Osceola County
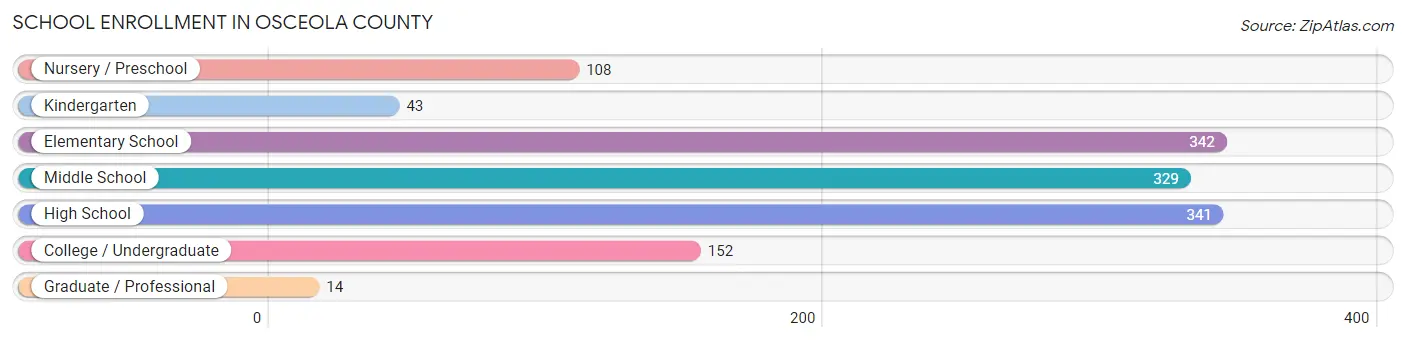
School Enrollment in Osceola County
The most common levels of schooling among the 1,329 students in Osceola County are elementary school (342 | 25.7%), high school (341 | 25.7%), and middle school (329 | 24.8%).
| School Level | # Students | % Students |
| Nursery / Preschool | 108 | 8.1% |
| Kindergarten | 43 | 3.2% |
| Elementary School | 342 | 25.7% |
| Middle School | 329 | 24.8% |
| High School | 341 | 25.7% |
| College / Undergraduate | 152 | 11.4% |
| Graduate / Professional | 14 | 1.1% |
| Total | 1,329 | 100.0% |
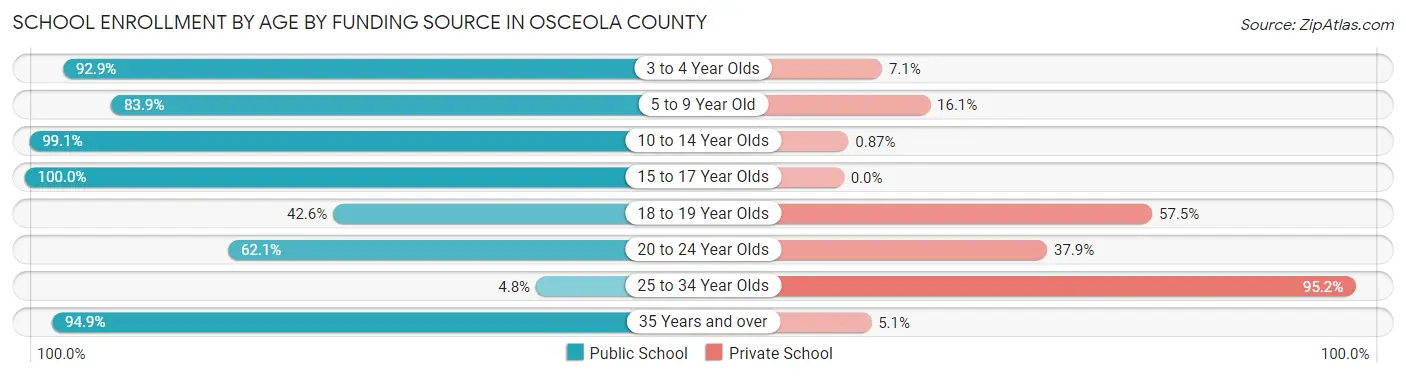
School Enrollment by Age by Funding Source in Osceola County
Out of a total of 1,329 students who are enrolled in schools in Osceola County, 162 (12.2%) attend a private institution, while the remaining 1,167 (87.8%) are enrolled in public schools. The age group of 25 to 34 year olds has the highest likelihood of being enrolled in private schools, with 20 (95.2% in the age bracket) enrolled. Conversely, the age group of 15 to 17 year olds has the lowest likelihood of being enrolled in a private school, with 256 (100.0% in the age bracket) attending a public institution.
| Age Bracket | Public School | Private School |
| 3 to 4 Year Olds | 65 (92.9%) | 5 (7.1%) |
| 5 to 9 Year Old | 271 (83.9%) | 52 (16.1%) |
| 10 to 14 Year Olds | 456 (99.1%) | 4 (0.9%) |
| 15 to 17 Year Olds | 256 (100.0%) | 0 (0.0%) |
| 18 to 19 Year Olds | 40 (42.5%) | 54 (57.5%) |
| 20 to 24 Year Olds | 41 (62.1%) | 25 (37.9%) |
| 25 to 34 Year Olds | 1 (4.8%) | 20 (95.2%) |
| 35 Years and over | 37 (94.9%) | 2 (5.1%) |
| Total | 1,167 (87.8%) | 162 (12.2%) |
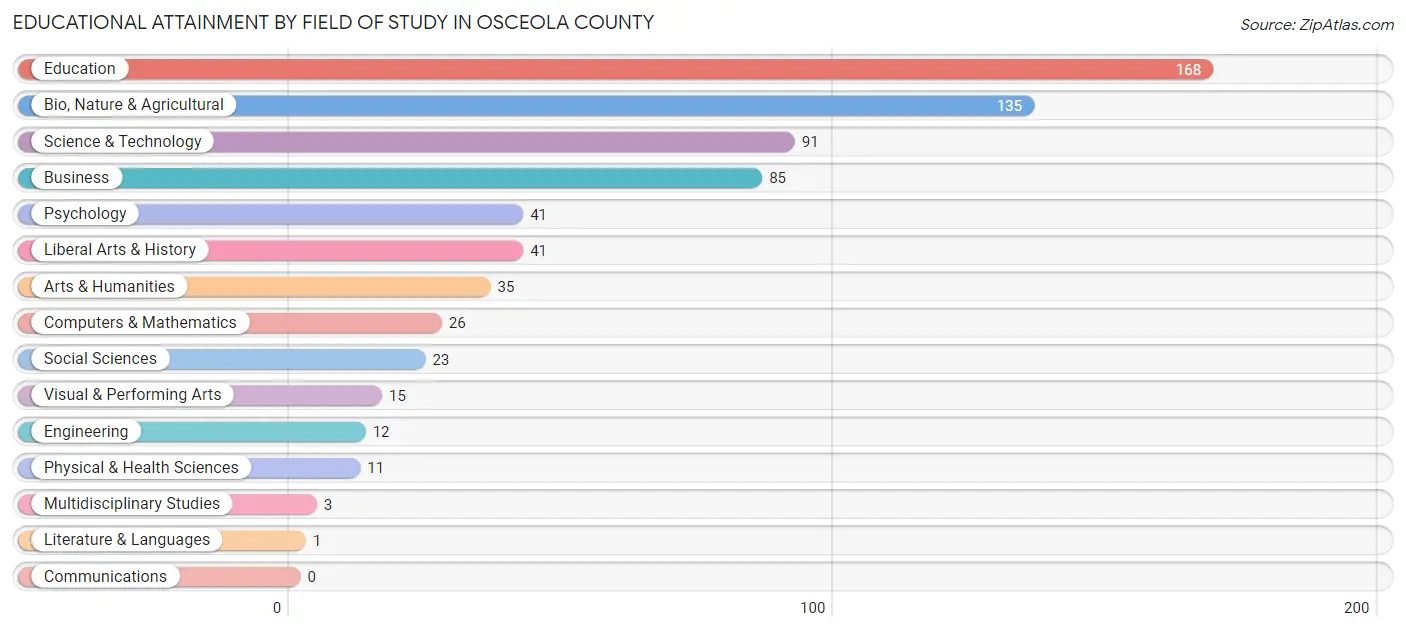
Educational Attainment by Field of Study in Osceola County
Education (168 | 24.4%), bio, nature & agricultural (135 | 19.7%), science & technology (91 | 13.3%), business (85 | 12.4%), and psychology (41 | 6.0%) are the most common fields of study among 687 individuals in Osceola County who have obtained a bachelor's degree or higher.
| Field of Study | # Graduates | % Graduates |
| Computers & Mathematics | 26 | 3.8% |
| Bio, Nature & Agricultural | 135 | 19.7% |
| Physical & Health Sciences | 11 | 1.6% |
| Psychology | 41 | 6.0% |
| Social Sciences | 23 | 3.4% |
| Engineering | 12 | 1.8% |
| Multidisciplinary Studies | 3 | 0.4% |
| Science & Technology | 91 | 13.3% |
| Business | 85 | 12.4% |
| Education | 168 | 24.4% |
| Literature & Languages | 1 | 0.2% |
| Liberal Arts & History | 41 | 6.0% |
| Visual & Performing Arts | 15 | 2.2% |
| Communications | 0 | 0.0% |
| Arts & Humanities | 35 | 5.1% |
| Total | 687 | 100.0% |
Transportation & Commute in Osceola County
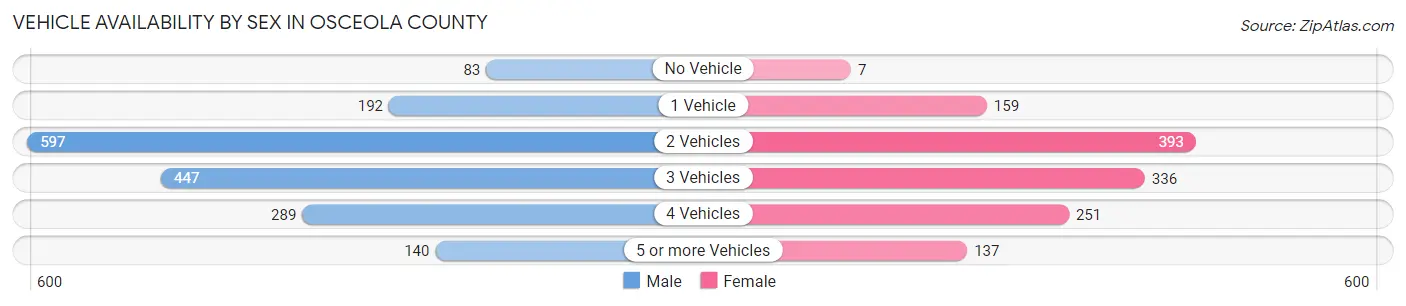
Vehicle Availability by Sex in Osceola County
The most prevalent vehicle ownership categories in Osceola County are males with 2 vehicles (597, accounting for 34.2%) and females with 2 vehicles (393, making up 46.5%).
| Vehicles Available | Male | Female |
| No Vehicle | 83 (4.8%) | 7 (0.5%) |
| 1 Vehicle | 192 (11.0%) | 159 (12.4%) |
| 2 Vehicles | 597 (34.2%) | 393 (30.6%) |
| 3 Vehicles | 447 (25.6%) | 336 (26.2%) |
| 4 Vehicles | 289 (16.5%) | 251 (19.6%) |
| 5 or more Vehicles | 140 (8.0%) | 137 (10.7%) |
| Total | 1,748 (100.0%) | 1,283 (100.0%) |
Commute Time in Osceola County
The most frequently occuring commute durations in Osceola County are less than 5 minutes (570 commuters, 20.0%), 5 to 9 minutes (525 commuters, 18.4%), and 30 to 34 minutes (400 commuters, 14.1%).
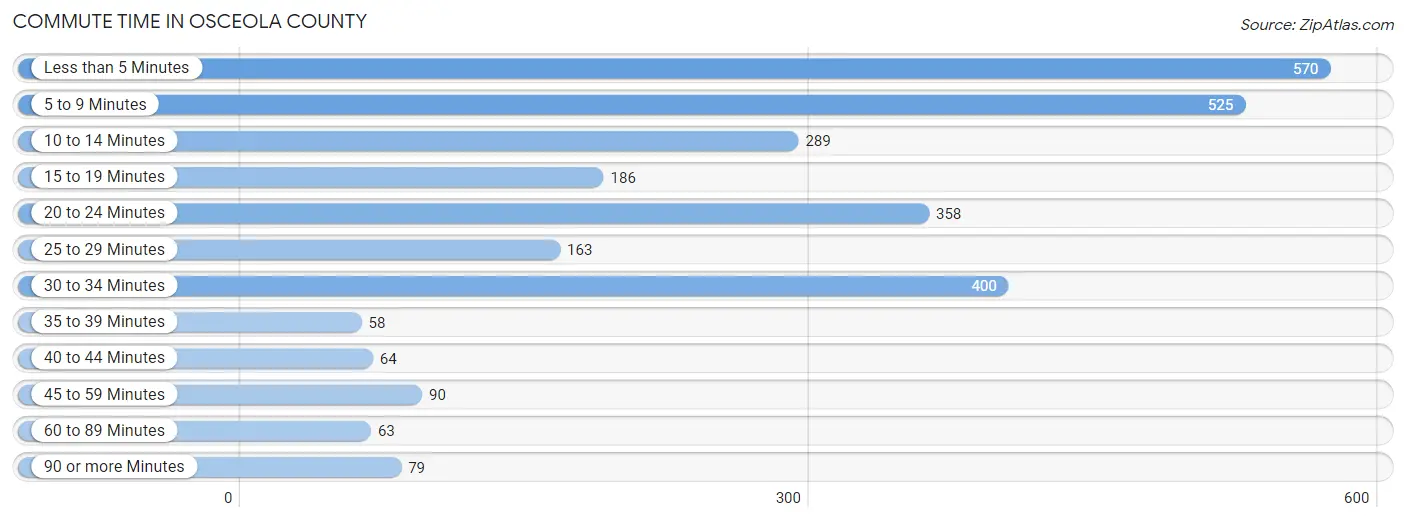
| Commute Time | # Commuters | % Commuters |
| Less than 5 Minutes | 570 | 20.0% |
| 5 to 9 Minutes | 525 | 18.4% |
| 10 to 14 Minutes | 289 | 10.2% |
| 15 to 19 Minutes | 186 | 6.5% |
| 20 to 24 Minutes | 358 | 12.6% |
| 25 to 29 Minutes | 163 | 5.7% |
| 30 to 34 Minutes | 400 | 14.1% |
| 35 to 39 Minutes | 58 | 2.0% |
| 40 to 44 Minutes | 64 | 2.2% |
| 45 to 59 Minutes | 90 | 3.2% |
| 60 to 89 Minutes | 63 | 2.2% |
| 90 or more Minutes | 79 | 2.8% |
Commute Time by Sex in Osceola County
The most common commute times in Osceola County are less than 5 minutes (346 commuters, 21.5%) for males and 5 to 9 minutes (235 commuters, 19.0%) for females.
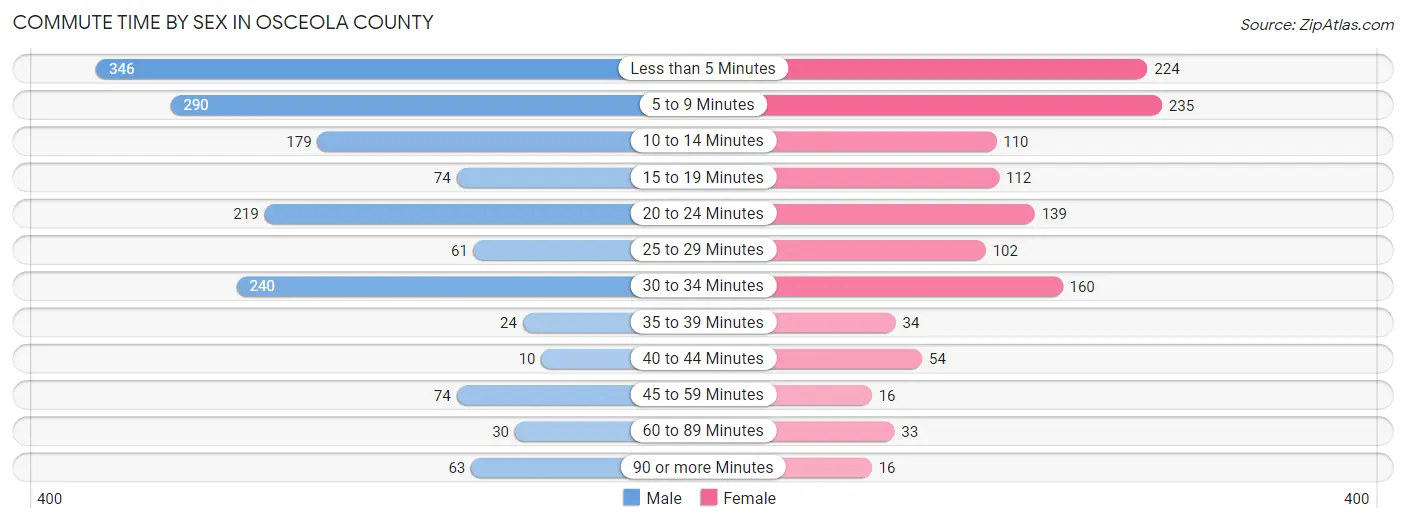
| Commute Time | Male | Female |
| Less than 5 Minutes | 346 (21.5%) | 224 (18.1%) |
| 5 to 9 Minutes | 290 (18.0%) | 235 (19.0%) |
| 10 to 14 Minutes | 179 (11.1%) | 110 (8.9%) |
| 15 to 19 Minutes | 74 (4.6%) | 112 (9.1%) |
| 20 to 24 Minutes | 219 (13.6%) | 139 (11.3%) |
| 25 to 29 Minutes | 61 (3.8%) | 102 (8.3%) |
| 30 to 34 Minutes | 240 (14.9%) | 160 (13.0%) |
| 35 to 39 Minutes | 24 (1.5%) | 34 (2.8%) |
| 40 to 44 Minutes | 10 (0.6%) | 54 (4.4%) |
| 45 to 59 Minutes | 74 (4.6%) | 16 (1.3%) |
| 60 to 89 Minutes | 30 (1.9%) | 33 (2.7%) |
| 90 or more Minutes | 63 (3.9%) | 16 (1.3%) |
Time of Departure to Work by Sex in Osceola County
The most frequent times of departure to work in Osceola County are 7:00 AM to 7:29 AM (311, 19.3%) for males and 7:30 AM to 7:59 AM (263, 21.3%) for females.
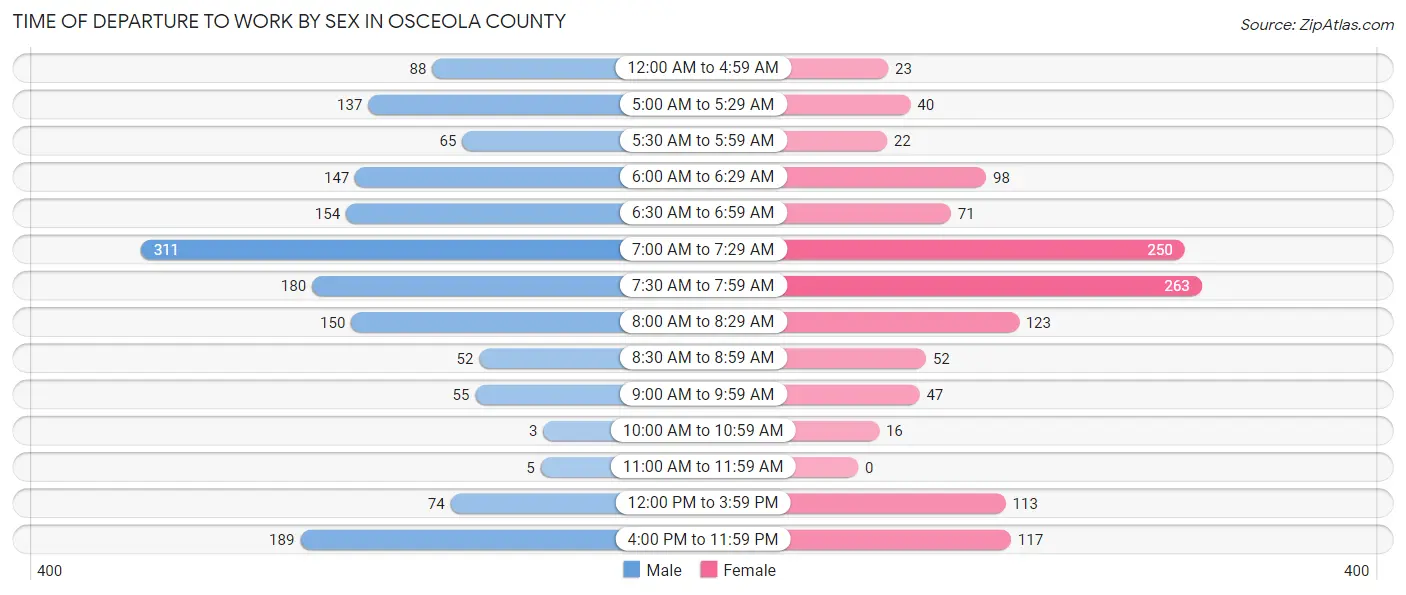
| Time of Departure | Male | Female |
| 12:00 AM to 4:59 AM | 88 (5.5%) | 23 (1.9%) |
| 5:00 AM to 5:29 AM | 137 (8.5%) | 40 (3.2%) |
| 5:30 AM to 5:59 AM | 65 (4.0%) | 22 (1.8%) |
| 6:00 AM to 6:29 AM | 147 (9.1%) | 98 (7.9%) |
| 6:30 AM to 6:59 AM | 154 (9.6%) | 71 (5.8%) |
| 7:00 AM to 7:29 AM | 311 (19.3%) | 250 (20.2%) |
| 7:30 AM to 7:59 AM | 180 (11.2%) | 263 (21.3%) |
| 8:00 AM to 8:29 AM | 150 (9.3%) | 123 (10.0%) |
| 8:30 AM to 8:59 AM | 52 (3.2%) | 52 (4.2%) |
| 9:00 AM to 9:59 AM | 55 (3.4%) | 47 (3.8%) |
| 10:00 AM to 10:59 AM | 3 (0.2%) | 16 (1.3%) |
| 11:00 AM to 11:59 AM | 5 (0.3%) | 0 (0.0%) |
| 12:00 PM to 3:59 PM | 74 (4.6%) | 113 (9.1%) |
| 4:00 PM to 11:59 PM | 189 (11.7%) | 117 (9.5%) |
| Total | 1,610 (100.0%) | 1,235 (100.0%) |
Housing Occupancy in Osceola County
Occupancy by Ownership in Osceola County
Of the total 2,631 dwellings in Osceola County, owner-occupied units account for 1,996 (75.9%), while renter-occupied units make up 635 (24.1%).
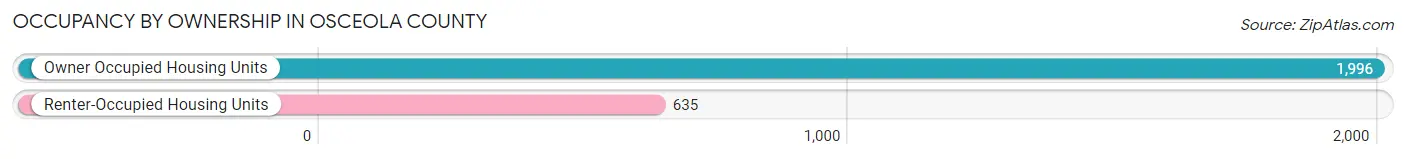
| Occupancy | # Housing Units | % Housing Units |
| Owner Occupied Housing Units | 1,996 | 75.9% |
| Renter-Occupied Housing Units | 635 | 24.1% |
| Total Occupied Housing Units | 2,631 | 100.0% |
Occupancy by Household Size in Osceola County
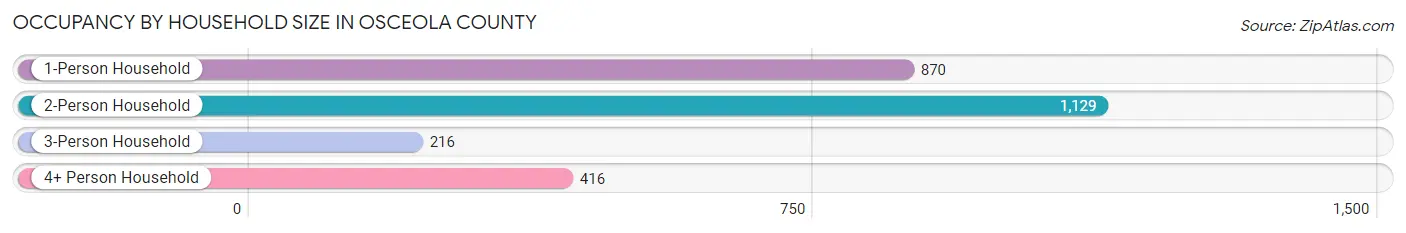
| Household Size | # Housing Units | % Housing Units |
| 1-Person Household | 870 | 33.1% |
| 2-Person Household | 1,129 | 42.9% |
| 3-Person Household | 216 | 8.2% |
| 4+ Person Household | 416 | 15.8% |
| Total Housing Units | 2,631 | 100.0% |
Occupancy by Ownership by Household Size in Osceola County
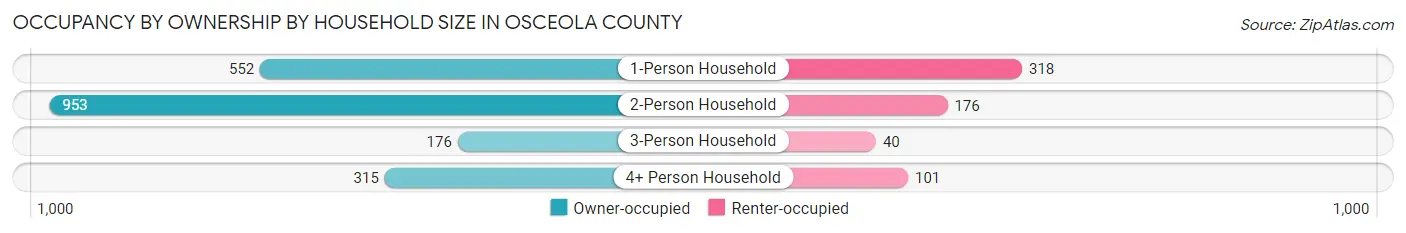
| Household Size | Owner-occupied | Renter-occupied |
| 1-Person Household | 552 (63.4%) | 318 (36.5%) |
| 2-Person Household | 953 (84.4%) | 176 (15.6%) |
| 3-Person Household | 176 (81.5%) | 40 (18.5%) |
| 4+ Person Household | 315 (75.7%) | 101 (24.3%) |
| Total Housing Units | 1,996 (75.9%) | 635 (24.1%) |
Occupancy by Educational Attainment in Osceola County
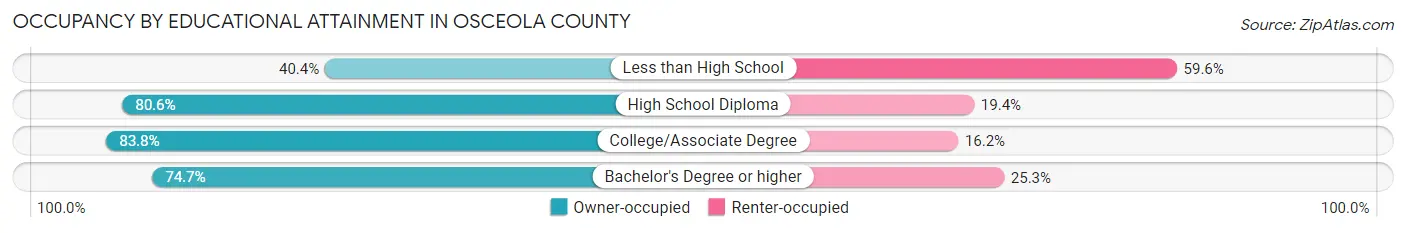
| Household Size | Owner-occupied | Renter-occupied |
| Less than High School | 133 (40.4%) | 196 (59.6%) |
| High School Diploma | 778 (80.6%) | 187 (19.4%) |
| College/Associate Degree | 796 (83.8%) | 154 (16.2%) |
| Bachelor's Degree or higher | 289 (74.7%) | 98 (25.3%) |
Occupancy by Age of Householder in Osceola County
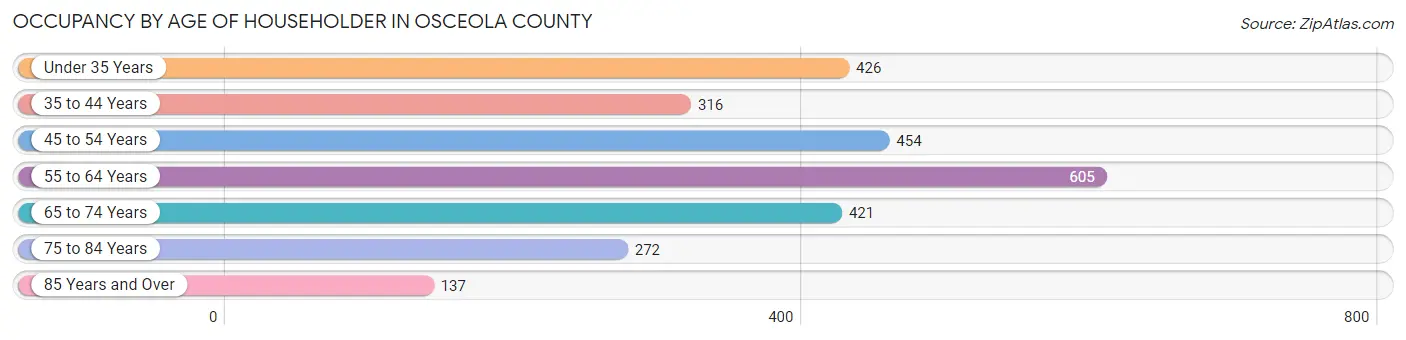
| Age Bracket | # Households | % Households |
| Under 35 Years | 426 | 16.2% |
| 35 to 44 Years | 316 | 12.0% |
| 45 to 54 Years | 454 | 17.3% |
| 55 to 64 Years | 605 | 23.0% |
| 65 to 74 Years | 421 | 16.0% |
| 75 to 84 Years | 272 | 10.3% |
| 85 Years and Over | 137 | 5.2% |
| Total | 2,631 | 100.0% |
Housing Finances in Osceola County
Median Income by Occupancy in Osceola County
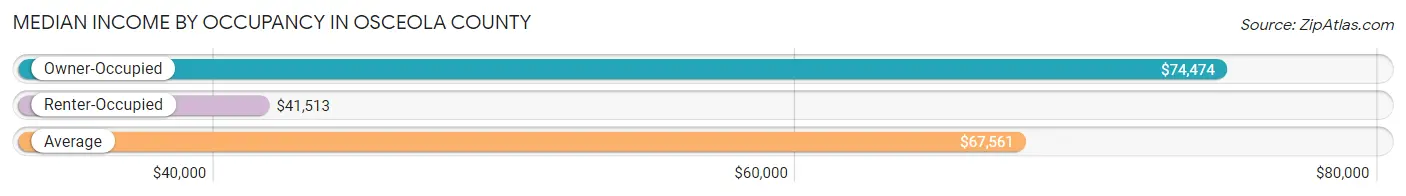
| Occupancy Type | # Households | Median Income |
| Owner-Occupied | 1,996 (75.9%) | $74,474 |
| Renter-Occupied | 635 (24.1%) | $41,513 |
| Average | 2,631 (100.0%) | $67,561 |
Occupancy by Householder Income Bracket in Osceola County
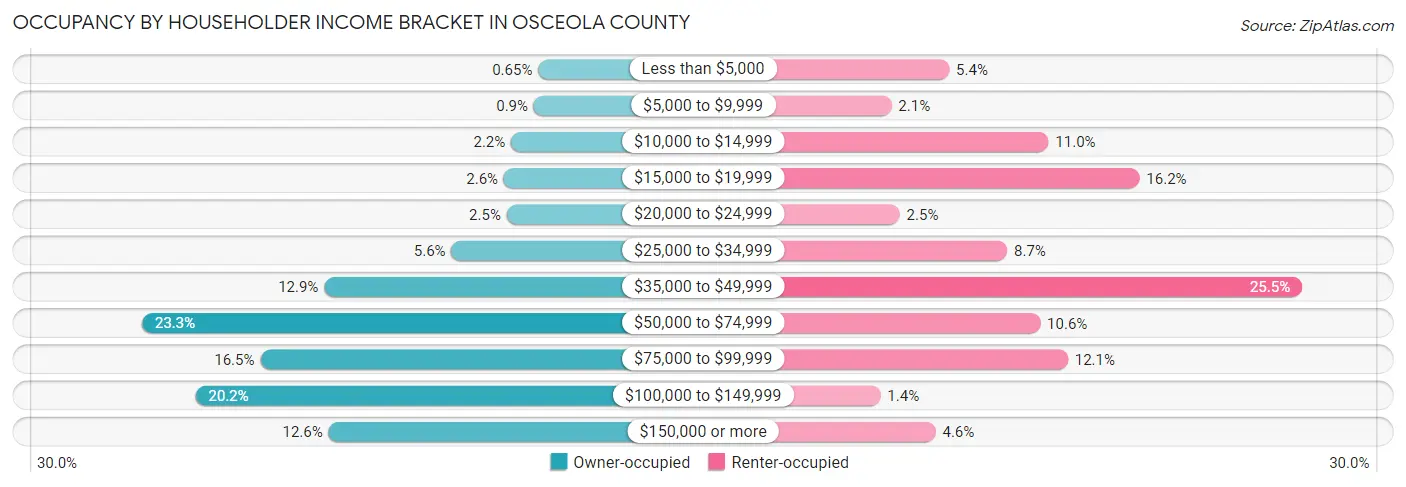
| Income Bracket | Owner-occupied | Renter-occupied |
| Less than $5,000 | 13 (0.6%) | 34 (5.3%) |
| $5,000 to $9,999 | 18 (0.9%) | 13 (2.1%) |
| $10,000 to $14,999 | 44 (2.2%) | 70 (11.0%) |
| $15,000 to $19,999 | 52 (2.6%) | 103 (16.2%) |
| $20,000 to $24,999 | 49 (2.5%) | 16 (2.5%) |
| $25,000 to $34,999 | 112 (5.6%) | 55 (8.7%) |
| $35,000 to $49,999 | 257 (12.9%) | 162 (25.5%) |
| $50,000 to $74,999 | 465 (23.3%) | 67 (10.5%) |
| $75,000 to $99,999 | 330 (16.5%) | 77 (12.1%) |
| $100,000 to $149,999 | 404 (20.2%) | 9 (1.4%) |
| $150,000 or more | 252 (12.6%) | 29 (4.6%) |
| Total | 1,996 (100.0%) | 635 (100.0%) |
Monthly Housing Cost Tiers in Osceola County
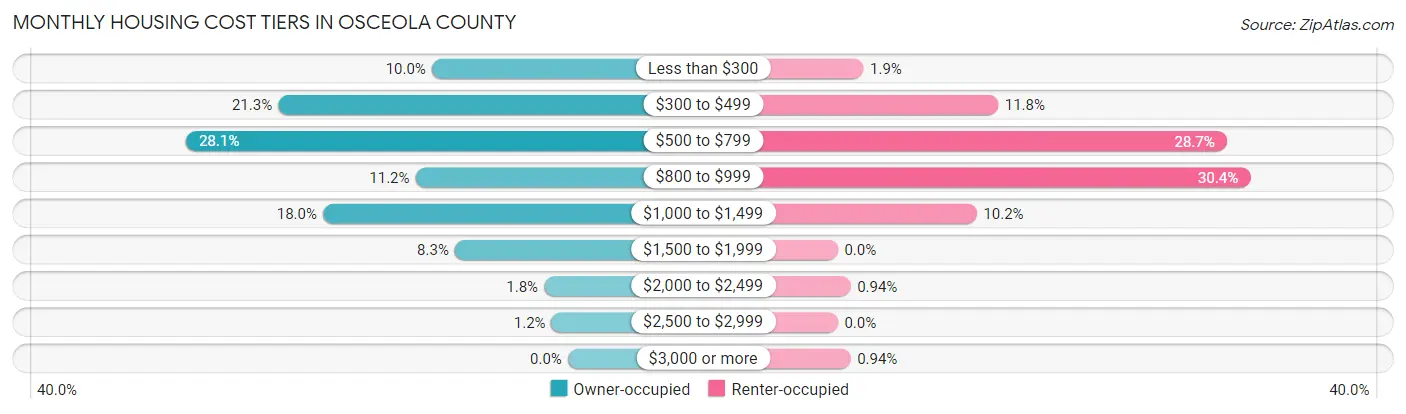
| Monthly Cost | Owner-occupied | Renter-occupied |
| Less than $300 | 200 (10.0%) | 12 (1.9%) |
| $300 to $499 | 426 (21.3%) | 75 (11.8%) |
| $500 to $799 | 561 (28.1%) | 182 (28.7%) |
| $800 to $999 | 224 (11.2%) | 193 (30.4%) |
| $1,000 to $1,499 | 360 (18.0%) | 65 (10.2%) |
| $1,500 to $1,999 | 166 (8.3%) | 0 (0.0%) |
| $2,000 to $2,499 | 35 (1.8%) | 6 (0.9%) |
| $2,500 to $2,999 | 24 (1.2%) | 0 (0.0%) |
| $3,000 or more | 0 (0.0%) | 6 (0.9%) |
| Total | 1,996 (100.0%) | 635 (100.0%) |
Physical Housing Characteristics in Osceola County
Housing Structures in Osceola County
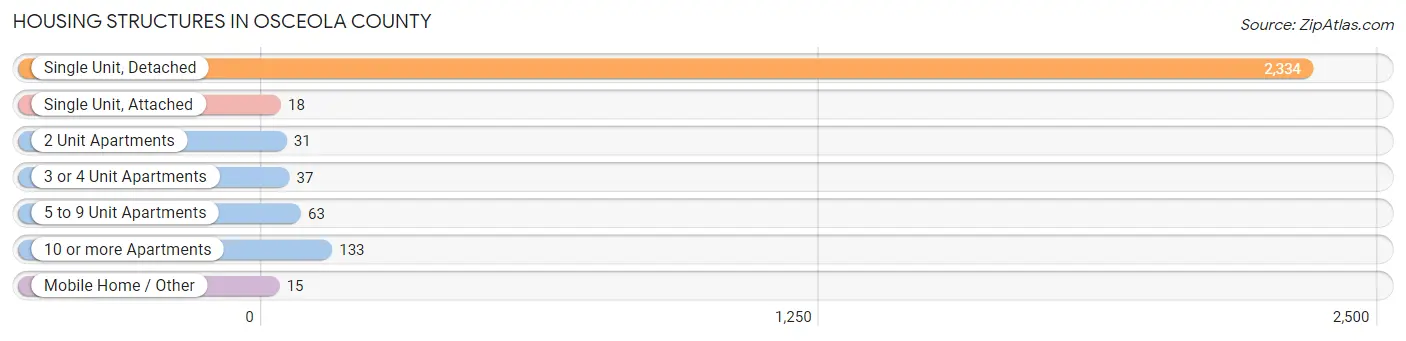
| Structure Type | # Housing Units | % Housing Units |
| Single Unit, Detached | 2,334 | 88.7% |
| Single Unit, Attached | 18 | 0.7% |
| 2 Unit Apartments | 31 | 1.2% |
| 3 or 4 Unit Apartments | 37 | 1.4% |
| 5 to 9 Unit Apartments | 63 | 2.4% |
| 10 or more Apartments | 133 | 5.1% |
| Mobile Home / Other | 15 | 0.6% |
| Total | 2,631 | 100.0% |
Housing Structures by Occupancy in Osceola County
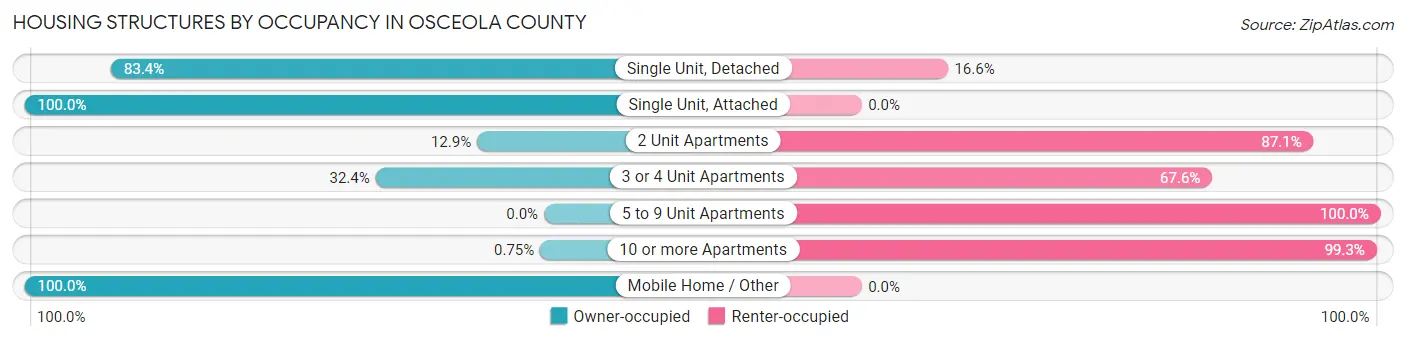
| Structure Type | Owner-occupied | Renter-occupied |
| Single Unit, Detached | 1,946 (83.4%) | 388 (16.6%) |
| Single Unit, Attached | 18 (100.0%) | 0 (0.0%) |
| 2 Unit Apartments | 4 (12.9%) | 27 (87.1%) |
| 3 or 4 Unit Apartments | 12 (32.4%) | 25 (67.6%) |
| 5 to 9 Unit Apartments | 0 (0.0%) | 63 (100.0%) |
| 10 or more Apartments | 1 (0.7%) | 132 (99.3%) |
| Mobile Home / Other | 15 (100.0%) | 0 (0.0%) |
| Total | 1,996 (75.9%) | 635 (24.1%) |
Housing Structures by Number of Rooms in Osceola County
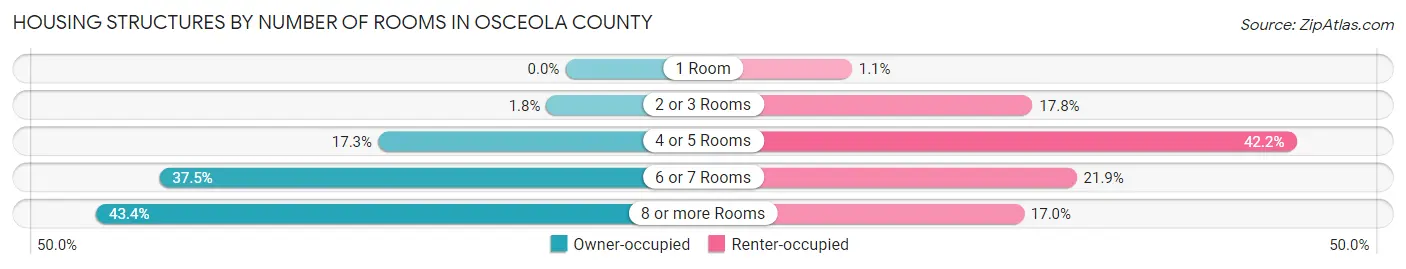
| Number of Rooms | Owner-occupied | Renter-occupied |
| 1 Room | 0 (0.0%) | 7 (1.1%) |
| 2 or 3 Rooms | 35 (1.8%) | 113 (17.8%) |
| 4 or 5 Rooms | 346 (17.3%) | 268 (42.2%) |
| 6 or 7 Rooms | 749 (37.5%) | 139 (21.9%) |
| 8 or more Rooms | 866 (43.4%) | 108 (17.0%) |
| Total | 1,996 (100.0%) | 635 (100.0%) |
Housing Structure by Heating Type in Osceola County
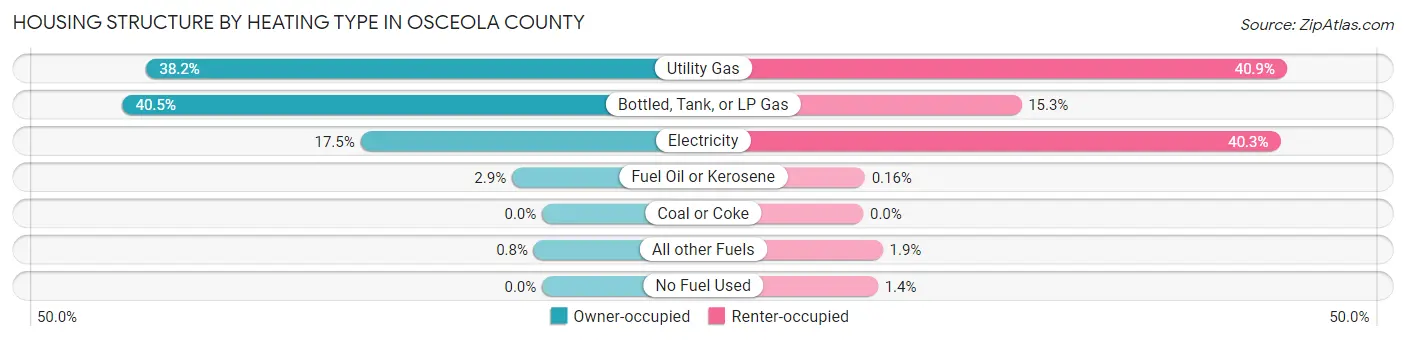
| Heating Type | Owner-occupied | Renter-occupied |
| Utility Gas | 763 (38.2%) | 260 (40.9%) |
| Bottled, Tank, or LP Gas | 809 (40.5%) | 97 (15.3%) |
| Electricity | 350 (17.5%) | 256 (40.3%) |
| Fuel Oil or Kerosene | 58 (2.9%) | 1 (0.2%) |
| Coal or Coke | 0 (0.0%) | 0 (0.0%) |
| All other Fuels | 16 (0.8%) | 12 (1.9%) |
| No Fuel Used | 0 (0.0%) | 9 (1.4%) |
| Total | 1,996 (100.0%) | 635 (100.0%) |
Household Vehicle Usage in Osceola County
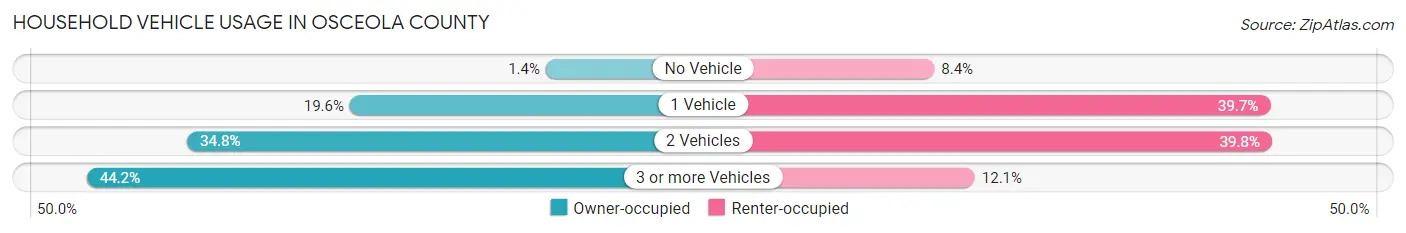
| Vehicles per Household | Owner-occupied | Renter-occupied |
| No Vehicle | 27 (1.3%) | 53 (8.4%) |
| 1 Vehicle | 392 (19.6%) | 252 (39.7%) |
| 2 Vehicles | 695 (34.8%) | 253 (39.8%) |
| 3 or more Vehicles | 882 (44.2%) | 77 (12.1%) |
| Total | 1,996 (100.0%) | 635 (100.0%) |
Real Estate & Mortgages in Osceola County
Real Estate and Mortgage Overview in Osceola County
| Characteristic | Without Mortgage | With Mortgage |
| Housing Units | 1,161 | 835 |
| Median Property Value | $107,200 | $125,300 |
| Median Household Income | $66,587 | $134 |
| Monthly Housing Costs | $483 | $0 |
| Real Estate Taxes | $1,131 | $2 |
Property Value by Mortgage Status in Osceola County
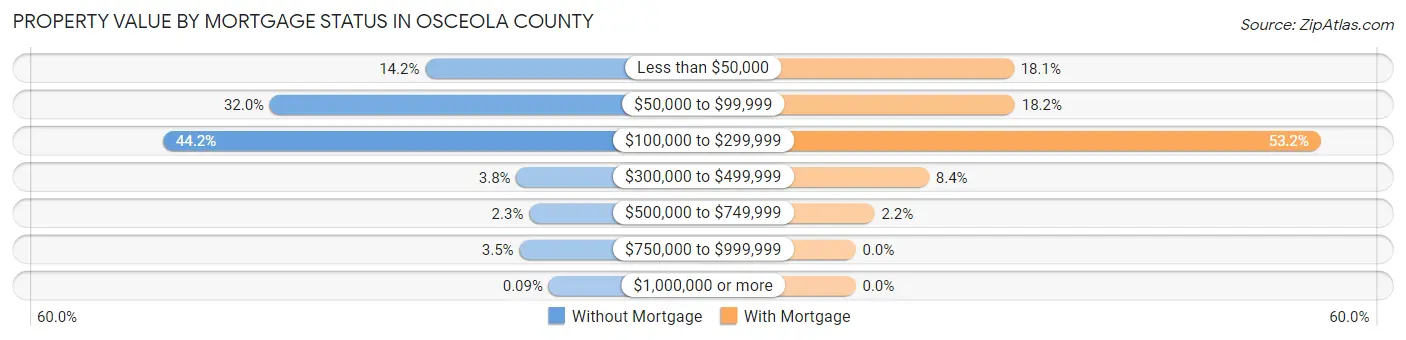
| Property Value | Without Mortgage | With Mortgage |
| Less than $50,000 | 165 (14.2%) | 151 (18.1%) |
| $50,000 to $99,999 | 371 (32.0%) | 152 (18.2%) |
| $100,000 to $299,999 | 513 (44.2%) | 444 (53.2%) |
| $300,000 to $499,999 | 44 (3.8%) | 70 (8.4%) |
| $500,000 to $749,999 | 27 (2.3%) | 18 (2.2%) |
| $750,000 to $999,999 | 40 (3.5%) | 0 (0.0%) |
| $1,000,000 or more | 1 (0.1%) | 0 (0.0%) |
| Total | 1,161 (100.0%) | 835 (100.0%) |
Household Income by Mortgage Status in Osceola County
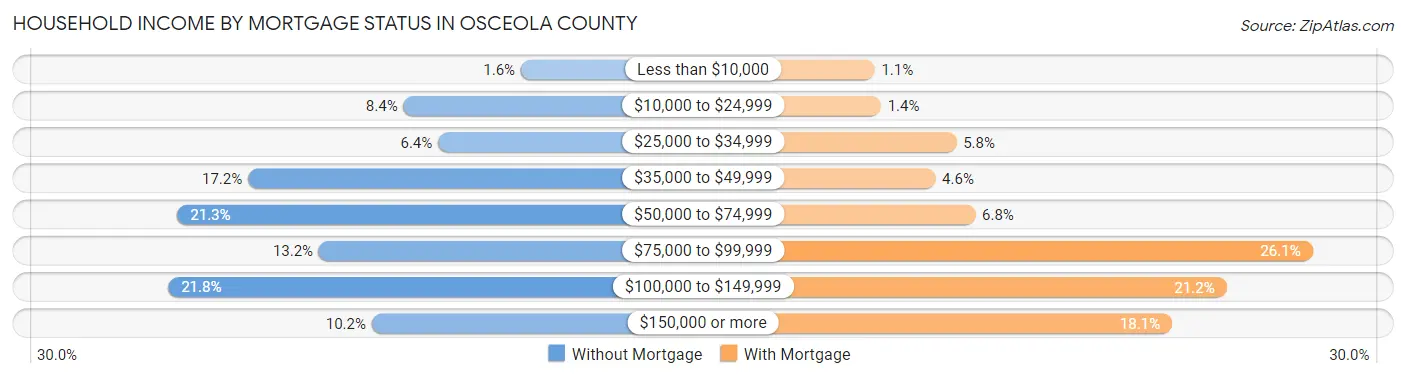
| Household Income | Without Mortgage | With Mortgage |
| Less than $10,000 | 19 (1.6%) | 9 (1.1%) |
| $10,000 to $24,999 | 97 (8.4%) | 12 (1.4%) |
| $25,000 to $34,999 | 74 (6.4%) | 48 (5.8%) |
| $35,000 to $49,999 | 200 (17.2%) | 38 (4.5%) |
| $50,000 to $74,999 | 247 (21.3%) | 57 (6.8%) |
| $75,000 to $99,999 | 153 (13.2%) | 218 (26.1%) |
| $100,000 to $149,999 | 253 (21.8%) | 177 (21.2%) |
| $150,000 or more | 118 (10.2%) | 151 (18.1%) |
| Total | 1,161 (100.0%) | 835 (100.0%) |
Property Value to Household Income Ratio in Osceola County
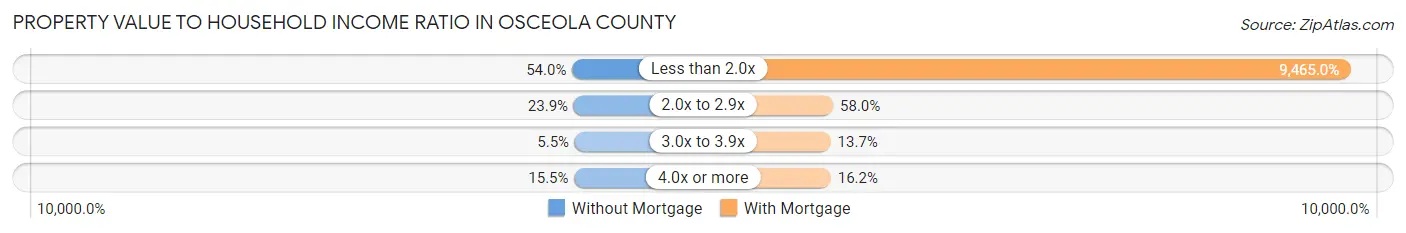
| Value-to-Income Ratio | Without Mortgage | With Mortgage |
| Less than 2.0x | 627 (54.0%) | 79,033 (9,465.0%) |
| 2.0x to 2.9x | 278 (23.9%) | 484 (58.0%) |
| 3.0x to 3.9x | 64 (5.5%) | 114 (13.7%) |
| 4.0x or more | 180 (15.5%) | 135 (16.2%) |
| Total | 1,161 (100.0%) | 835 (100.0%) |
Real Estate Taxes by Mortgage Status in Osceola County
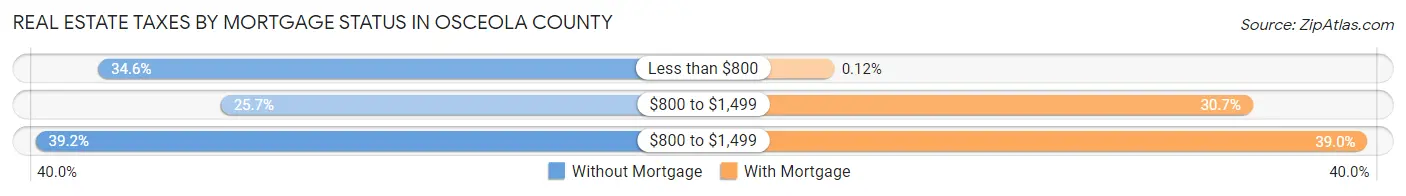
| Property Taxes | Without Mortgage | With Mortgage |
| Less than $800 | 402 (34.6%) | 1 (0.1%) |
| $800 to $1,499 | 298 (25.7%) | 256 (30.7%) |
| $800 to $1,499 | 455 (39.2%) | 326 (39.0%) |
| Total | 1,161 (100.0%) | 835 (100.0%) |
Health & Disability in Osceola County
Health Insurance Coverage by Age in Osceola County
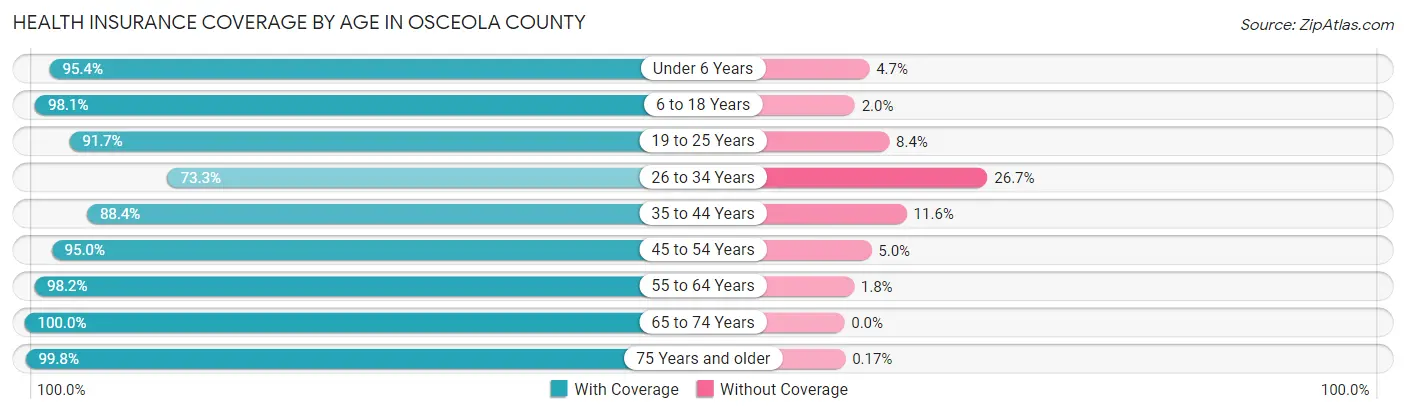
| Age Bracket | With Coverage | Without Coverage |
| Under 6 Years | 390 (95.4%) | 19 (4.6%) |
| 6 to 18 Years | 1,004 (98.1%) | 20 (1.9%) |
| 19 to 25 Years | 384 (91.6%) | 35 (8.4%) |
| 26 to 34 Years | 415 (73.3%) | 151 (26.7%) |
| 35 to 44 Years | 585 (88.4%) | 77 (11.6%) |
| 45 to 54 Years | 640 (95.0%) | 34 (5.0%) |
| 55 to 64 Years | 995 (98.2%) | 18 (1.8%) |
| 65 to 74 Years | 676 (100.0%) | 0 (0.0%) |
| 75 Years and older | 593 (99.8%) | 1 (0.2%) |
| Total | 5,682 (94.1%) | 355 (5.9%) |
Health Insurance Coverage by Citizenship Status in Osceola County
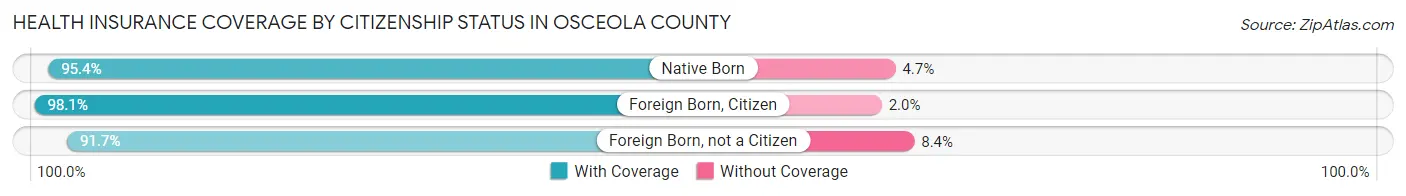
| Citizenship Status | With Coverage | Without Coverage |
| Native Born | 390 (95.4%) | 19 (4.6%) |
| Foreign Born, Citizen | 1,004 (98.1%) | 20 (1.9%) |
| Foreign Born, not a Citizen | 384 (91.6%) | 35 (8.4%) |
Health Insurance Coverage by Household Income in Osceola County
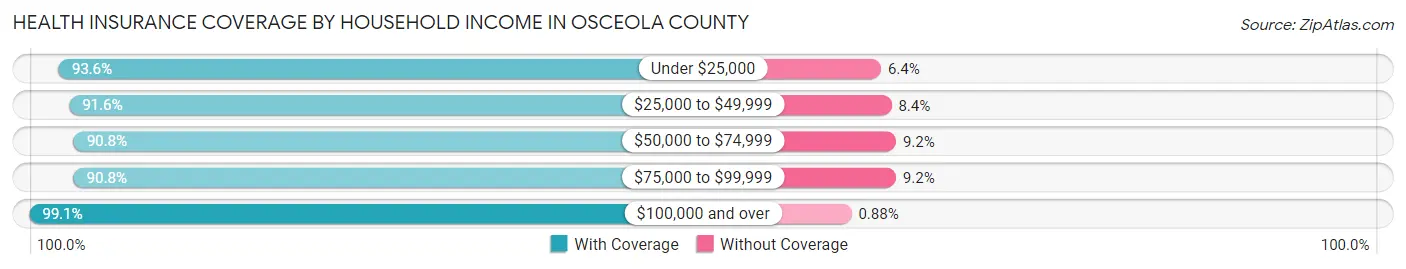
| Household Income | With Coverage | Without Coverage |
| Under $25,000 | 715 (93.6%) | 49 (6.4%) |
| $25,000 to $49,999 | 974 (91.6%) | 89 (8.4%) |
| $50,000 to $74,999 | 1,074 (90.8%) | 109 (9.2%) |
| $75,000 to $99,999 | 888 (90.8%) | 90 (9.2%) |
| $100,000 and over | 2,019 (99.1%) | 18 (0.9%) |
Public vs Private Health Insurance Coverage by Age in Osceola County
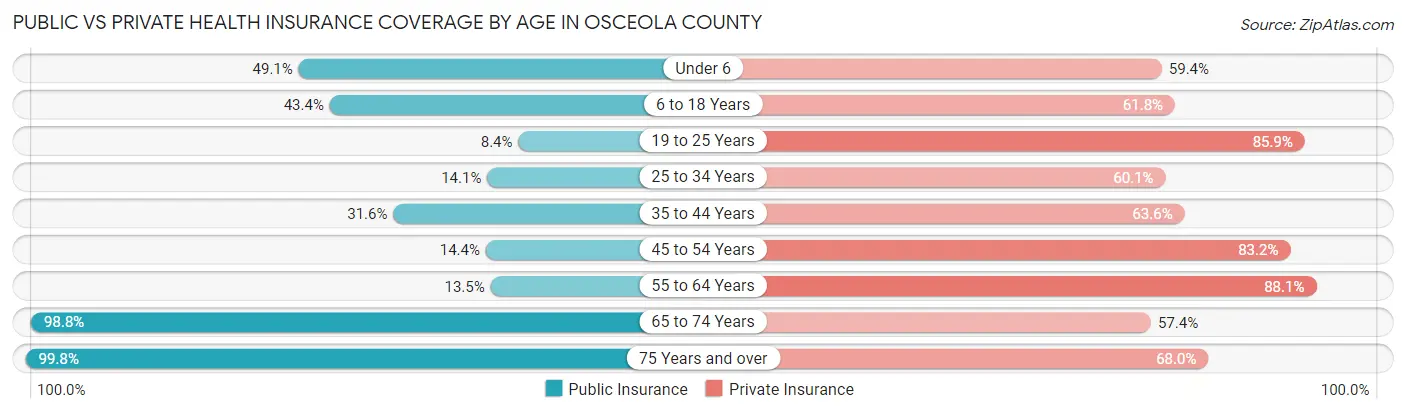
| Age Bracket | Public Insurance | Private Insurance |
| Under 6 | 201 (49.1%) | 243 (59.4%) |
| 6 to 18 Years | 444 (43.4%) | 633 (61.8%) |
| 19 to 25 Years | 35 (8.4%) | 360 (85.9%) |
| 25 to 34 Years | 80 (14.1%) | 340 (60.1%) |
| 35 to 44 Years | 209 (31.6%) | 421 (63.6%) |
| 45 to 54 Years | 97 (14.4%) | 561 (83.2%) |
| 55 to 64 Years | 137 (13.5%) | 892 (88.1%) |
| 65 to 74 Years | 668 (98.8%) | 388 (57.4%) |
| 75 Years and over | 593 (99.8%) | 404 (68.0%) |
| Total | 2,464 (40.8%) | 4,242 (70.3%) |
Disability Status by Sex by Age in Osceola County
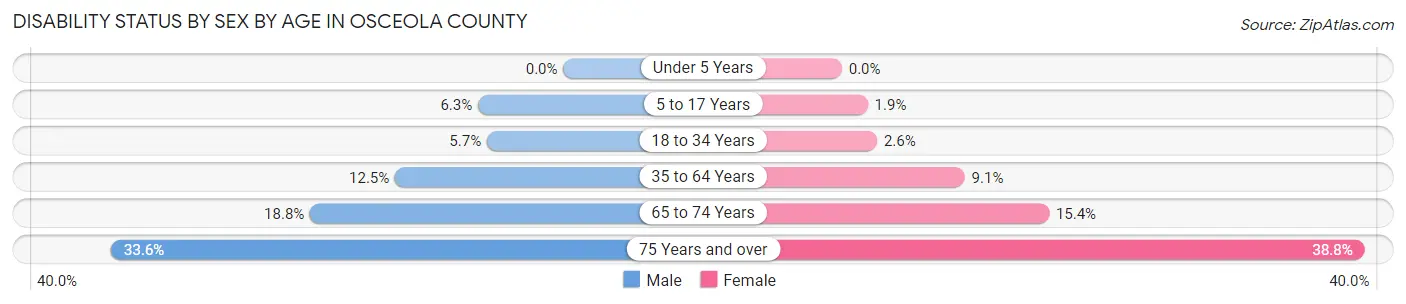
| Age Bracket | Male | Female |
| Under 5 Years | 0 (0.0%) | 0 (0.0%) |
| 5 to 17 Years | 36 (6.3%) | 10 (1.9%) |
| 18 to 34 Years | 32 (5.7%) | 12 (2.6%) |
| 35 to 64 Years | 155 (12.5%) | 101 (9.1%) |
| 65 to 74 Years | 66 (18.8%) | 50 (15.4%) |
| 75 Years and over | 87 (33.6%) | 130 (38.8%) |
Disability Class by Sex by Age in Osceola County
Disability Class: Hearing Difficulty
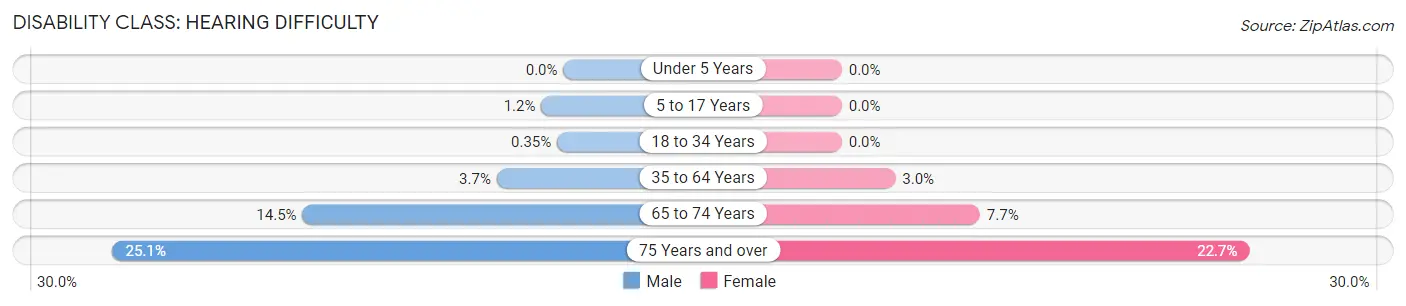
| Age Bracket | Male | Female |
| Under 5 Years | 0 (0.0%) | 0 (0.0%) |
| 5 to 17 Years | 7 (1.2%) | 0 (0.0%) |
| 18 to 34 Years | 2 (0.4%) | 0 (0.0%) |
| 35 to 64 Years | 46 (3.7%) | 33 (3.0%) |
| 65 to 74 Years | 51 (14.5%) | 25 (7.7%) |
| 75 Years and over | 65 (25.1%) | 76 (22.7%) |
Disability Class: Vision Difficulty
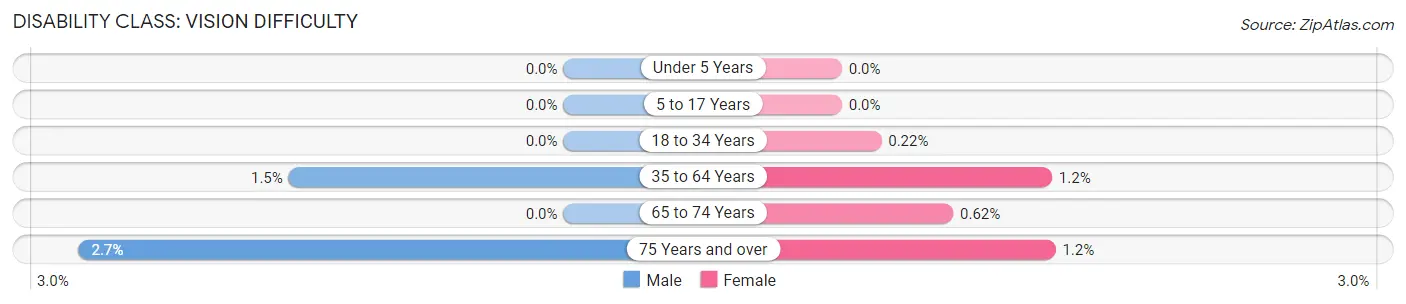
| Age Bracket | Male | Female |
| Under 5 Years | 0 (0.0%) | 0 (0.0%) |
| 5 to 17 Years | 0 (0.0%) | 0 (0.0%) |
| 18 to 34 Years | 0 (0.0%) | 1 (0.2%) |
| 35 to 64 Years | 19 (1.5%) | 13 (1.2%) |
| 65 to 74 Years | 0 (0.0%) | 2 (0.6%) |
| 75 Years and over | 7 (2.7%) | 4 (1.2%) |
Disability Class: Cognitive Difficulty
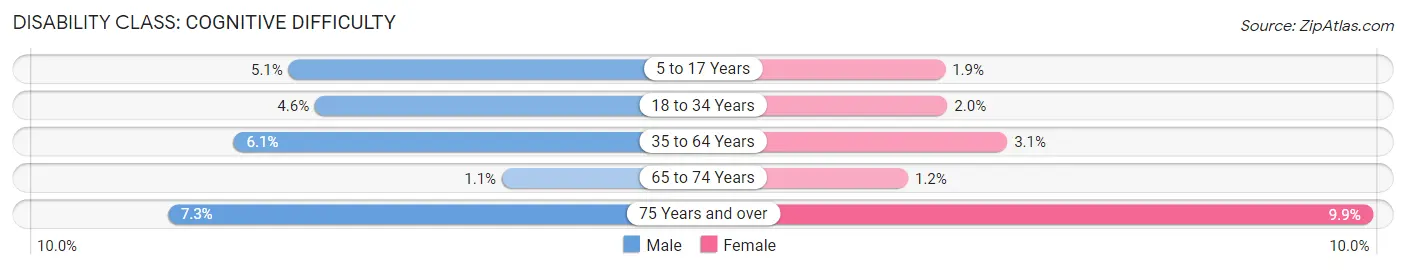
| Age Bracket | Male | Female |
| 5 to 17 Years | 29 (5.1%) | 10 (1.9%) |
| 18 to 34 Years | 26 (4.6%) | 9 (2.0%) |
| 35 to 64 Years | 76 (6.1%) | 34 (3.1%) |
| 65 to 74 Years | 4 (1.1%) | 4 (1.2%) |
| 75 Years and over | 19 (7.3%) | 33 (9.9%) |
Disability Class: Ambulatory Difficulty
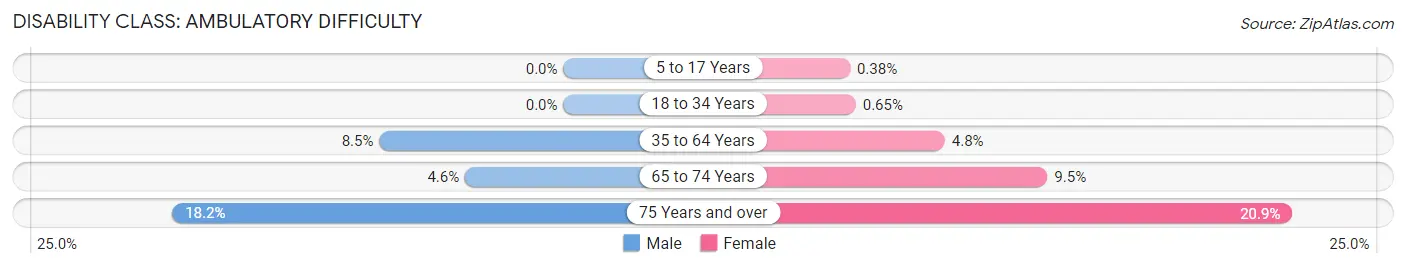
| Age Bracket | Male | Female |
| 5 to 17 Years | 0 (0.0%) | 2 (0.4%) |
| 18 to 34 Years | 0 (0.0%) | 3 (0.6%) |
| 35 to 64 Years | 106 (8.5%) | 53 (4.8%) |
| 65 to 74 Years | 16 (4.6%) | 31 (9.5%) |
| 75 Years and over | 47 (18.1%) | 70 (20.9%) |
Disability Class: Self-Care Difficulty
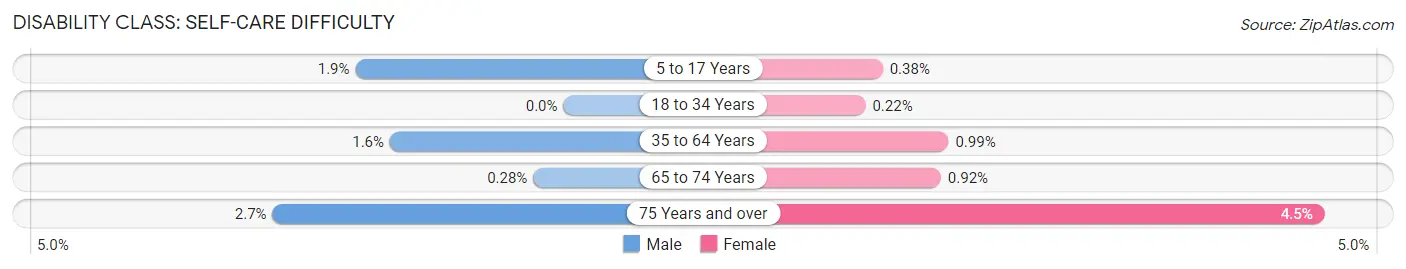
| Age Bracket | Male | Female |
| 5 to 17 Years | 11 (1.9%) | 2 (0.4%) |
| 18 to 34 Years | 0 (0.0%) | 1 (0.2%) |
| 35 to 64 Years | 20 (1.6%) | 11 (1.0%) |
| 65 to 74 Years | 1 (0.3%) | 3 (0.9%) |
| 75 Years and over | 7 (2.7%) | 15 (4.5%) |
Technology Access in Osceola County
Computing Device Access in Osceola County
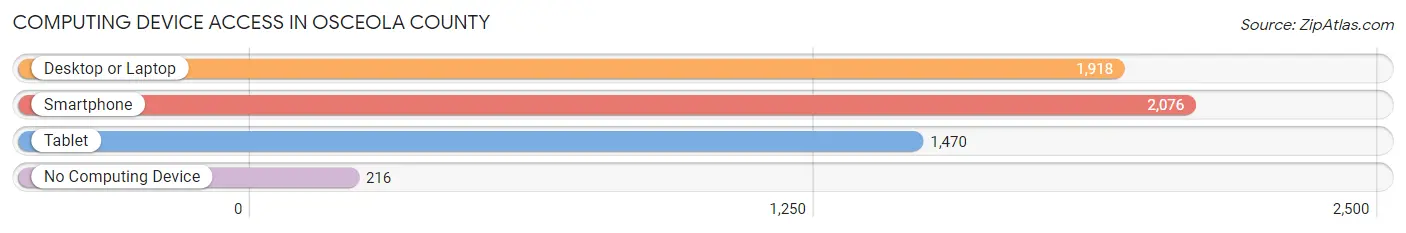
| Device Type | # Households | % Households |
| Desktop or Laptop | 1,918 | 72.9% |
| Smartphone | 2,076 | 78.9% |
| Tablet | 1,470 | 55.9% |
| No Computing Device | 216 | 8.2% |
| Total | 2,631 | 100.0% |
Internet Access in Osceola County
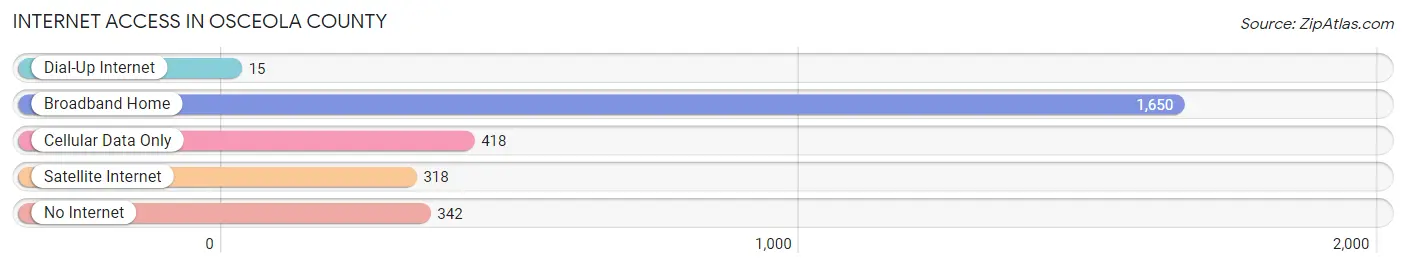
| Internet Type | # Households | % Households |
| Dial-Up Internet | 15 | 0.6% |
| Broadband Home | 1,650 | 62.7% |
| Cellular Data Only | 418 | 15.9% |
| Satellite Internet | 318 | 12.1% |
| No Internet | 342 | 13.0% |
| Total | 2,631 | 100.0% |
Osceola County Summary
Osceola County is located in the northwest corner of Iowa, and is bordered by Dickinson, Clay, Palo Alto, and Emmet counties. It is part of the Sioux City, IA-NE-SD Metropolitan Statistical Area. The county seat is Sibley, and the largest city is Sheldon. As of the 2010 census, the population was 6,462.
History
Osceola County was established in 1871, and was named after the Seminole leader Osceola. The county was originally part of the Sioux City Land District, and was organized in 1872. The first settlers arrived in the area in 1871, and the county was officially organized in 1872.
The first county seat was located in Sibley, and the first courthouse was built in 1873. The county seat was moved to Ocheyedan in 1876, and the courthouse was moved there in 1877. The county seat was moved back to Sibley in 1882, and the courthouse was moved back there in 1883.
Geography
Osceola County is located in the northwest corner of Iowa, and is bordered by Dickinson, Clay, Palo Alto, and Emmet counties. It is part of the Sioux City, IA-NE-SD Metropolitan Statistical Area. The county has a total area of 576 square miles, of which 575 square miles is land and 1 square mile is water.
The county is mostly flat, with some rolling hills in the northern part of the county. The highest point in the county is located in the northwest corner, at an elevation of 1,541 feet. The county is drained by the Little Sioux River, which flows through the center of the county.
Economy
The economy of Osceola County is largely based on agriculture. The county is home to a variety of crops, including corn, soybeans, oats, and hay. Livestock production is also important to the county’s economy, with beef cattle, dairy cattle, and hogs being the most common.
The county is also home to several manufacturing companies, including a furniture manufacturer, a plastics manufacturer, and a metal fabrication company. The county is also home to several retail businesses, including grocery stores, hardware stores, and clothing stores.
Demographics
As of the 2010 census, there were 6,462 people, 2,541 households, and 1,717 families living in the county. The population density was 11.2 people per square mile. The racial makeup of the county was 97.3% White, 0.3% African American, 0.3% Native American, 0.3% Asian, 0.1% Pacific Islander, 0.7% from other races, and 0.9% from two or more races. Hispanic or Latino of any race were 2.2% of the population.
The median income for a household in the county was $45,945, and the median income for a family was $54,813. The per capita income for the county was $21,945. About 8.2% of families and 11.2% of the population were below the poverty line, including 14.2% of those under age 18 and 8.2% of those age 65 or over.
Common Questions
What is Per Capita Income in Osceola County?
Per Capita income in Osceola County is $35,657.
What is the Median Family Income in Osceola County?
Median Family Income in Osceola County is $80,396.
What is the Median Household income in Osceola County?
Median Household Income in Osceola County is $67,561.
What is Income or Wage Gap in Osceola County?
Income or Wage Gap in Osceola County is 41.5%.
Women in Osceola County earn 58.5 cents for every dollar earned by a man.
What is Family Income Deficit in Osceola County?
Family Income Deficit in Osceola County is $11,171.
Families that are below poverty line in Osceola County earn $11,171 less on average than the poverty threshold level.
What is Inequality or Gini Index in Osceola County?
Inequality or Gini Index in Osceola County is 0.40.
What is the Total Population of Osceola County?
Total Population of Osceola County is 6,149.
What is the Total Male Population of Osceola County?
Total Male Population of Osceola County is 3,195.
What is the Total Female Population of Osceola County?
Total Female Population of Osceola County is 2,954.
What is the Ratio of Males per 100 Females in Osceola County?
There are 108.16 Males per 100 Females in Osceola County.
What is the Ratio of Females per 100 Males in Osceola County?
There are 92.46 Females per 100 Males in Osceola County.
What is the Median Population Age in Osceola County?
Median Population Age in Osceola County is 44.0 Years.
What is the Average Family Size in Osceola County
Average Family Size in Osceola County is 2.9 People.
What is the Average Household Size in Osceola County
Average Household Size in Osceola County is 2.3 People.
How Large is the Labor Force in Osceola County?
There are 3,252 People in the Labor Forcein in Osceola County.
What is the Percentage of People in the Labor Force in Osceola County?
66.0% of People are in the Labor Force in Osceola County.
What is the Unemployment Rate in Osceola County?
Unemployment Rate in Osceola County is 4.5%.