Clayton County, IA Map & Demographics
Clayton County Map
Clayton County Overview
$34,394
PER CAPITA INCOME
$79,698
AVG FAMILY INCOME
$60,441
AVG HOUSEHOLD INCOME
36.4%
WAGE / INCOME GAP [ % ]
63.6¢/ $1
WAGE / INCOME GAP [ $ ]
$8,293
FAMILY INCOME DEFICIT
0.43
INEQUALITY / GINI INDEX
17,123
TOTAL POPULATION
8,663
MALE POPULATION
8,460
FEMALE POPULATION
102.40
MALES / 100 FEMALES
97.66
FEMALES / 100 MALES
46.9
MEDIAN AGE
2.9
AVG FAMILY SIZE
2.3
AVG HOUSEHOLD SIZE
8,846
LABOR FORCE [ PEOPLE ]
63.5%
PERCENT IN LABOR FORCE
2.6%
UNEMPLOYMENT RATE
Clayton County Area Codes
Income in Clayton County
Income Overview in Clayton County
Per Capita Income in Clayton County is $34,394, while median incomes of families and households are $79,698 and $60,441 respectively.
| Characteristic | Number | Measure |
| Per Capita Income | 17,123 | $34,394 |
| Median Family Income | 4,486 | $79,698 |
| Mean Family Income | 4,486 | $95,108 |
| Median Household Income | 7,286 | $60,441 |
| Mean Household Income | 7,286 | $79,375 |
| Income Deficit | 4,486 | $8,293 |
| Wage / Income Gap (%) | 17,123 | 36.42% |
| Wage / Income Gap ($) | 17,123 | 63.58¢ per $1 |
| Gini / Inequality Index | 17,123 | 0.43 |
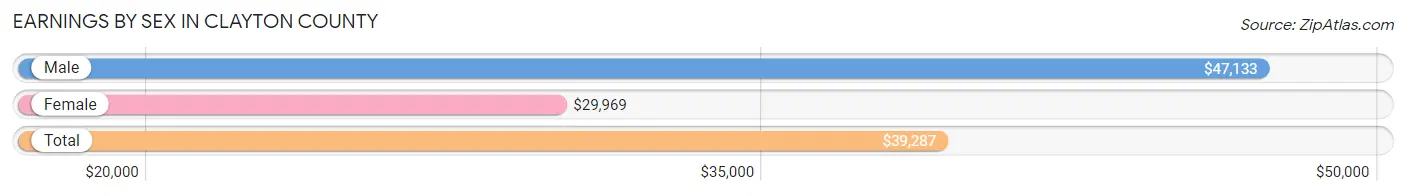
Earnings by Sex in Clayton County
Average Earnings in Clayton County are $39,287, $47,133 for men and $29,969 for women, a difference of 36.4%.
| Sex | Number | Average Earnings |
| Male | 4,986 (54.0%) | $47,133 |
| Female | 4,254 (46.0%) | $29,969 |
| Total | 9,240 (100.0%) | $39,287 |
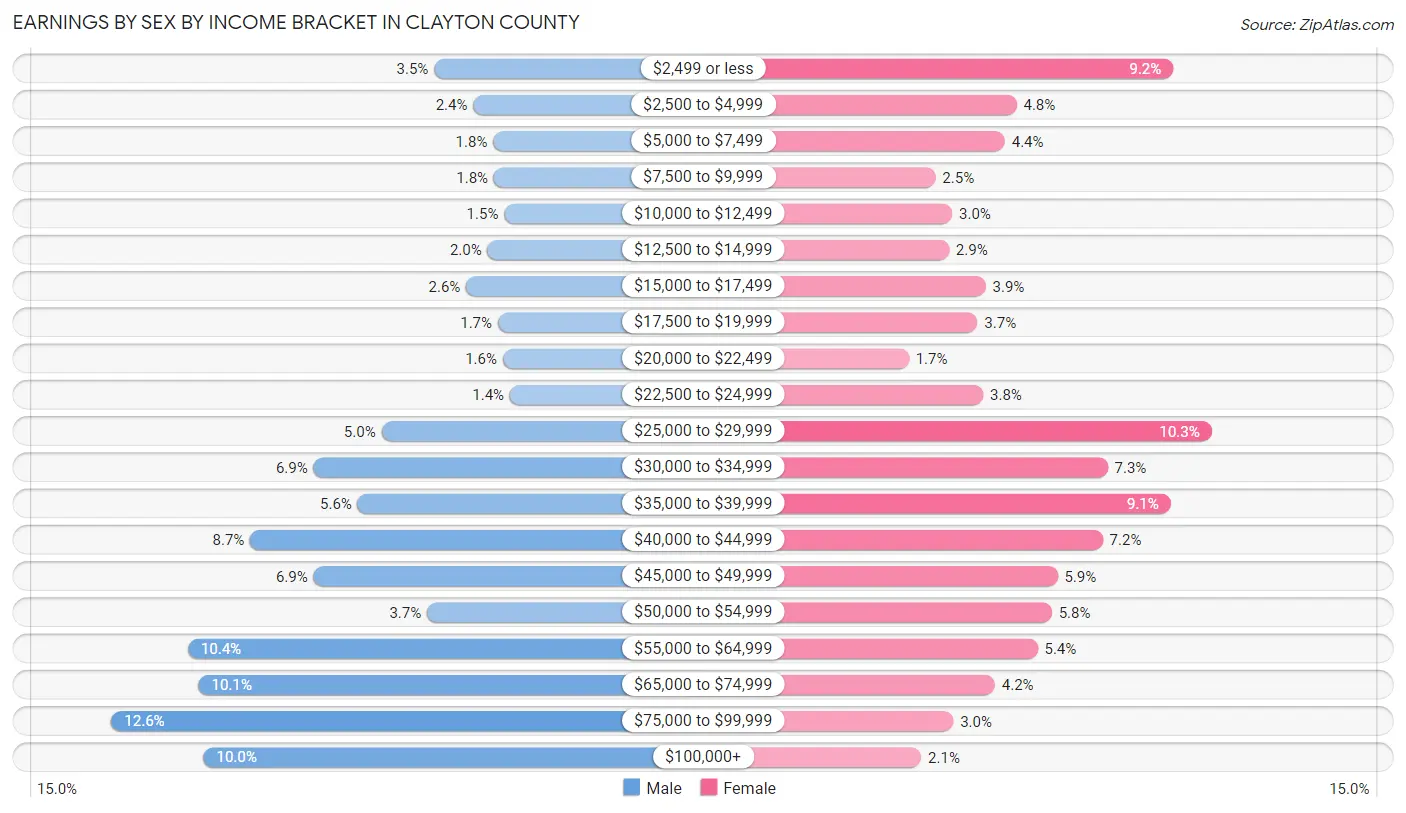
Earnings by Sex by Income Bracket in Clayton County
The most common earnings brackets in Clayton County are $75,000 to $99,999 for men (626 | 12.6%) and $25,000 to $29,999 for women (436 | 10.2%).
| Income | Male | Female |
| $2,499 or less | 174 (3.5%) | 390 (9.2%) |
| $2,500 to $4,999 | 119 (2.4%) | 203 (4.8%) |
| $5,000 to $7,499 | 91 (1.8%) | 189 (4.4%) |
| $7,500 to $9,999 | 90 (1.8%) | 106 (2.5%) |
| $10,000 to $12,499 | 76 (1.5%) | 126 (3.0%) |
| $12,500 to $14,999 | 99 (2.0%) | 122 (2.9%) |
| $15,000 to $17,499 | 129 (2.6%) | 166 (3.9%) |
| $17,500 to $19,999 | 85 (1.7%) | 156 (3.7%) |
| $20,000 to $22,499 | 78 (1.6%) | 74 (1.7%) |
| $22,500 to $24,999 | 68 (1.4%) | 163 (3.8%) |
| $25,000 to $29,999 | 248 (5.0%) | 436 (10.2%) |
| $30,000 to $34,999 | 343 (6.9%) | 312 (7.3%) |
| $35,000 to $39,999 | 281 (5.6%) | 387 (9.1%) |
| $40,000 to $44,999 | 432 (8.7%) | 306 (7.2%) |
| $45,000 to $49,999 | 343 (6.9%) | 252 (5.9%) |
| $50,000 to $54,999 | 184 (3.7%) | 245 (5.8%) |
| $55,000 to $64,999 | 519 (10.4%) | 228 (5.4%) |
| $65,000 to $74,999 | 504 (10.1%) | 177 (4.2%) |
| $75,000 to $99,999 | 626 (12.6%) | 127 (3.0%) |
| $100,000+ | 497 (10.0%) | 89 (2.1%) |
| Total | 4,986 (100.0%) | 4,254 (100.0%) |
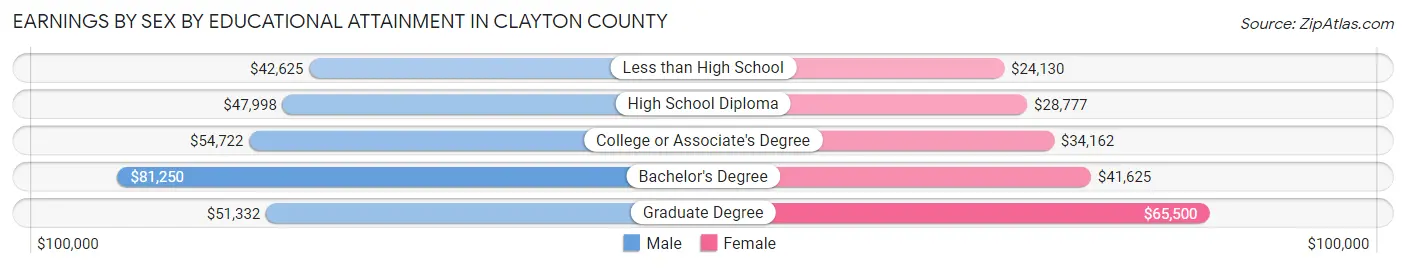
Earnings by Sex by Educational Attainment in Clayton County
Average earnings in Clayton County are $52,064 for men and $33,616 for women, a difference of 35.4%. Men with an educational attainment of bachelor's degree enjoy the highest average annual earnings of $81,250, while those with less than high school education earn the least with $42,625. Women with an educational attainment of graduate degree earn the most with the average annual earnings of $65,500, while those with less than high school education have the smallest earnings of $24,130.
| Educational Attainment | Male Income | Female Income |
| Less than High School | $42,625 | $24,130 |
| High School Diploma | $47,998 | $28,777 |
| College or Associate's Degree | $54,722 | $34,162 |
| Bachelor's Degree | $81,250 | $41,625 |
| Graduate Degree | $51,332 | $65,500 |
| Total | $52,064 | $33,616 |
Family Income in Clayton County
Family Income Brackets in Clayton County
According to the Clayton County family income data, there are 1,086 families falling into the $100,000 to $149,999 income range, which is the most common income bracket and makes up 24.2% of all families. Conversely, the $10,000 to $14,999 income bracket is the least frequent group with only 58 families (1.3%) belonging to this category.
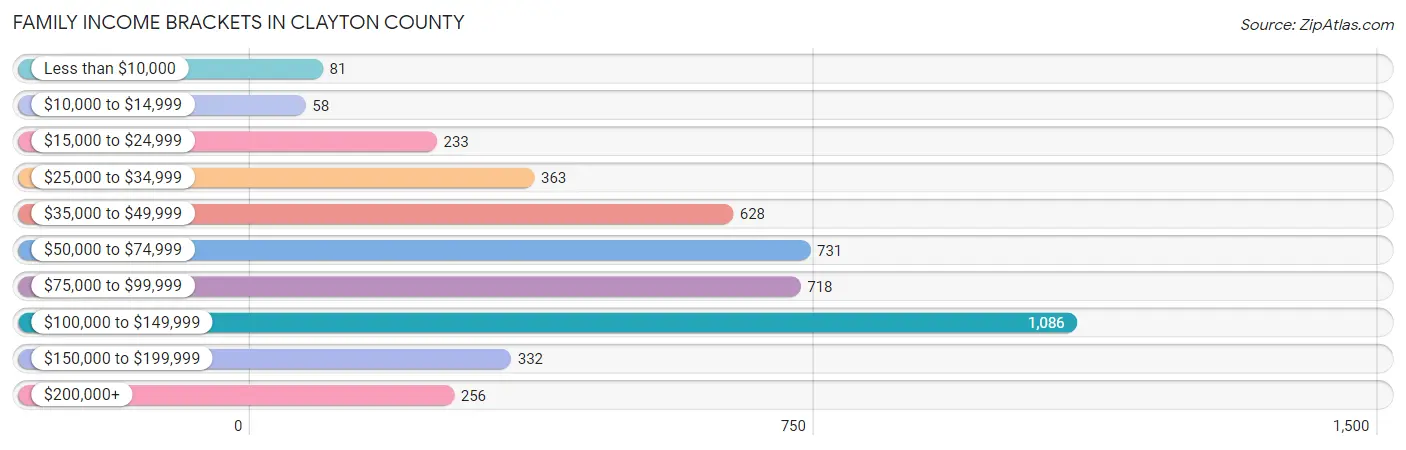
| Income Bracket | # Families | % Families |
| Less than $10,000 | 81 | 1.8% |
| $10,000 to $14,999 | 58 | 1.3% |
| $15,000 to $24,999 | 233 | 5.2% |
| $25,000 to $34,999 | 363 | 8.1% |
| $35,000 to $49,999 | 628 | 14.0% |
| $50,000 to $74,999 | 731 | 16.3% |
| $75,000 to $99,999 | 718 | 16.0% |
| $100,000 to $149,999 | 1,086 | 24.2% |
| $150,000 to $199,999 | 332 | 7.4% |
| $200,000+ | 256 | 5.7% |
Family Income by Famaliy Size in Clayton County
7+ person families (110 | 2.5%) account for the highest median family income in Clayton County with $138,173 per family, while 2-person families (2,613 | 58.3%) have the highest median income of $33,642 per family member.
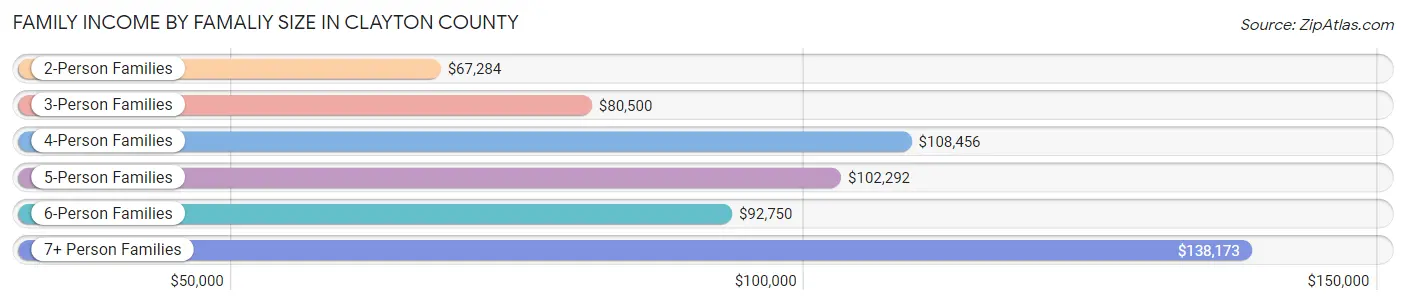
| Income Bracket | # Families | Median Income |
| 2-Person Families | 2,613 (58.3%) | $67,284 |
| 3-Person Families | 732 (16.3%) | $80,500 |
| 4-Person Families | 573 (12.8%) | $108,456 |
| 5-Person Families | 391 (8.7%) | $102,292 |
| 6-Person Families | 67 (1.5%) | $92,750 |
| 7+ Person Families | 110 (2.5%) | $138,173 |
| Total | 4,486 (100.0%) | $79,698 |
Family Income by Number of Earners in Clayton County
The median family income in Clayton County is $79,698, with families comprising 3+ earners (491) having the highest median family income of $139,196, while families with no earners (860) have the lowest median family income of $40,086, accounting for 11.0% and 19.2% of families, respectively.
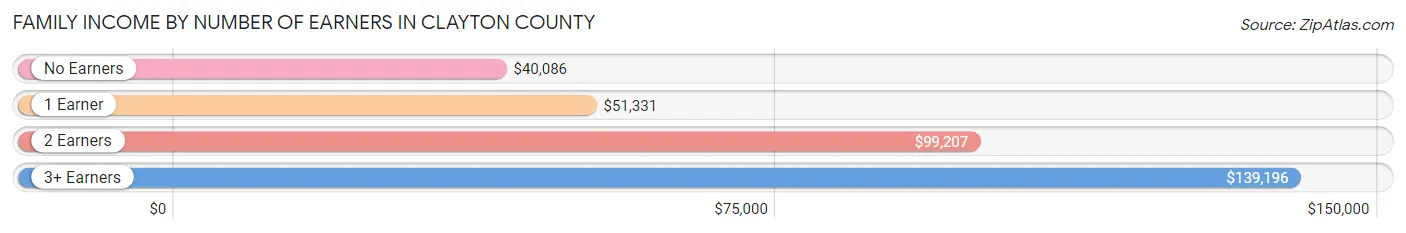
| Number of Earners | # Families | Median Income |
| No Earners | 860 (19.2%) | $40,086 |
| 1 Earner | 1,159 (25.8%) | $51,331 |
| 2 Earners | 1,976 (44.1%) | $99,207 |
| 3+ Earners | 491 (11.0%) | $139,196 |
| Total | 4,486 (100.0%) | $79,698 |
Household Income in Clayton County
Household Income Brackets in Clayton County
With 1,275 households falling in the category, the $100,000 to $149,999 income range is the most frequent in Clayton County, accounting for 17.5% of all households. In contrast, only 299 households (4.1%) fall into the $200,000+ income bracket, making it the least populous group.
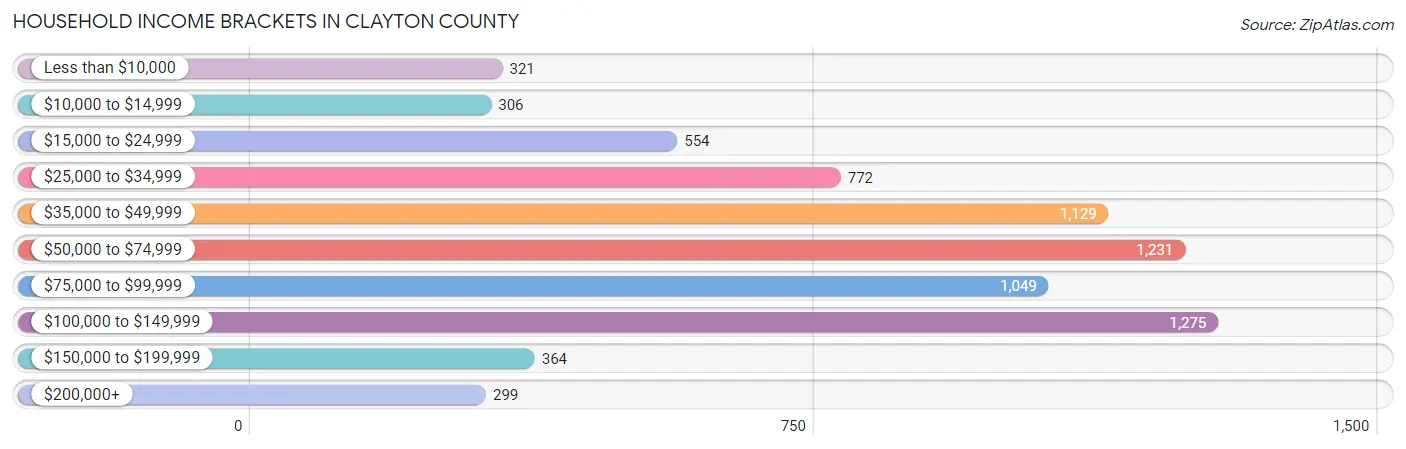
| Income Bracket | # Households | % Households |
| Less than $10,000 | 321 | 4.4% |
| $10,000 to $14,999 | 306 | 4.2% |
| $15,000 to $24,999 | 554 | 7.6% |
| $25,000 to $34,999 | 772 | 10.6% |
| $35,000 to $49,999 | 1,129 | 15.5% |
| $50,000 to $74,999 | 1,231 | 16.9% |
| $75,000 to $99,999 | 1,049 | 14.4% |
| $100,000 to $149,999 | 1,275 | 17.5% |
| $150,000 to $199,999 | 364 | 5.0% |
| $200,000+ | 299 | 4.1% |
Household Income by Householder Age in Clayton County
The median household income in Clayton County is $60,441, with the highest median household income of $88,603 found in the 25 to 44 years age bracket for the primary householder. A total of 1,874 households (25.7%) fall into this category. Meanwhile, the 65+ years age bracket for the primary householder has the lowest median household income of $44,563, with 2,462 households (33.8%) in this group.
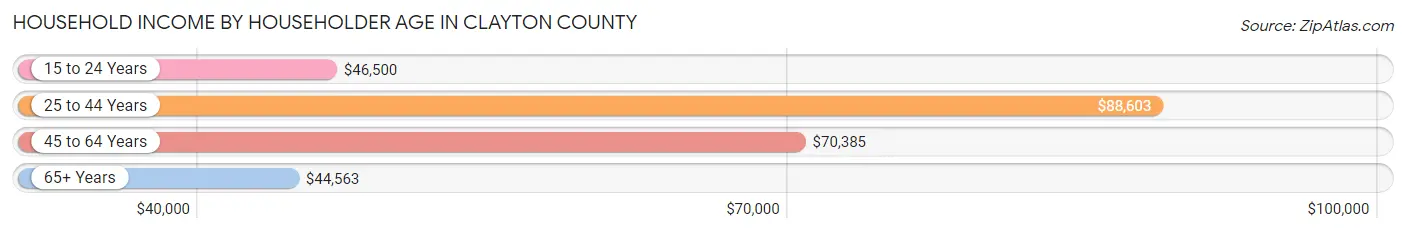
| Income Bracket | # Households | Median Income |
| 15 to 24 Years | 340 (4.7%) | $46,500 |
| 25 to 44 Years | 1,874 (25.7%) | $88,603 |
| 45 to 64 Years | 2,610 (35.8%) | $70,385 |
| 65+ Years | 2,462 (33.8%) | $44,563 |
| Total | 7,286 (100.0%) | $60,441 |
Poverty in Clayton County
Income Below Poverty by Sex and Age in Clayton County
With 12.4% poverty level for males and 13.7% for females among the residents of Clayton County, 12 to 14 year old males and 12 to 14 year old females are the most vulnerable to poverty, with 114 males (30.2%) and 91 females (29.3%) in their respective age groups living below the poverty level.
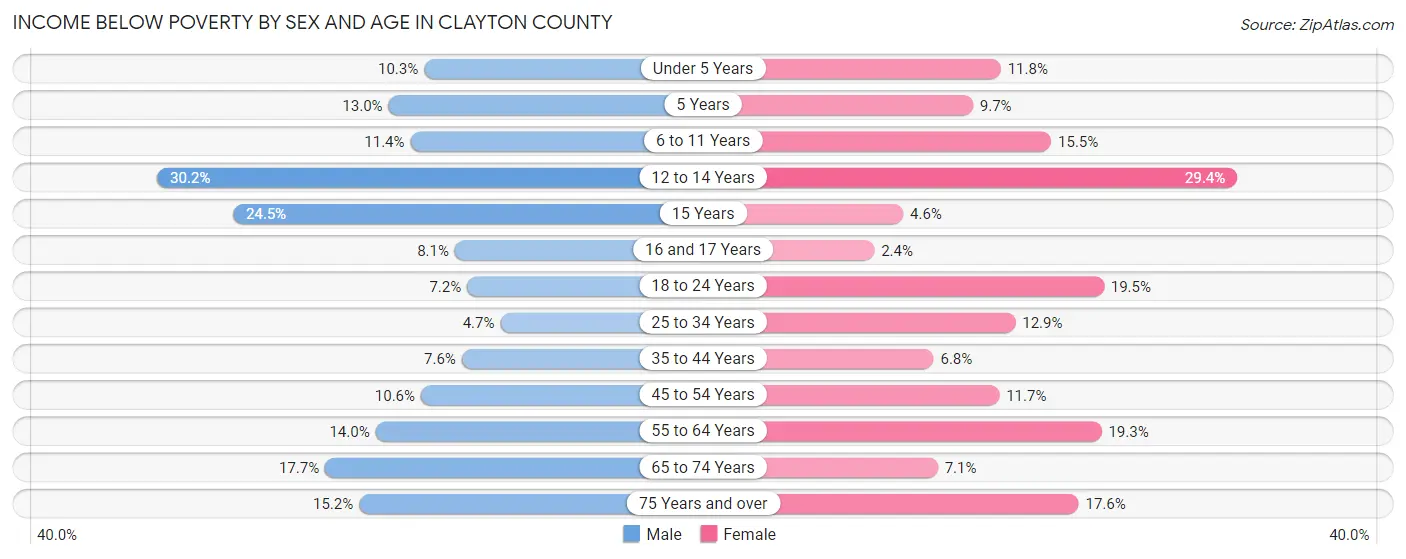
| Age Bracket | Male | Female |
| Under 5 Years | 49 (10.3%) | 57 (11.8%) |
| 5 Years | 20 (13.0%) | 11 (9.7%) |
| 6 to 11 Years | 56 (11.4%) | 83 (15.5%) |
| 12 to 14 Years | 114 (30.2%) | 91 (29.3%) |
| 15 Years | 26 (24.5%) | 3 (4.5%) |
| 16 and 17 Years | 17 (8.1%) | 6 (2.4%) |
| 18 to 24 Years | 44 (7.1%) | 106 (19.5%) |
| 25 to 34 Years | 41 (4.7%) | 111 (12.9%) |
| 35 to 44 Years | 67 (7.5%) | 58 (6.8%) |
| 45 to 54 Years | 107 (10.6%) | 104 (11.7%) |
| 55 to 64 Years | 197 (14.0%) | 261 (19.3%) |
| 65 to 74 Years | 205 (17.7%) | 79 (7.1%) |
| 75 Years and over | 115 (15.2%) | 166 (17.6%) |
| Total | 1,058 (12.4%) | 1,136 (13.7%) |
Income Above Poverty by Sex and Age in Clayton County
According to the poverty statistics in Clayton County, males aged 25 to 34 years and females aged 16 and 17 years are the age groups that are most secure financially, with 95.3% of males and 97.6% of females in these age groups living above the poverty line.
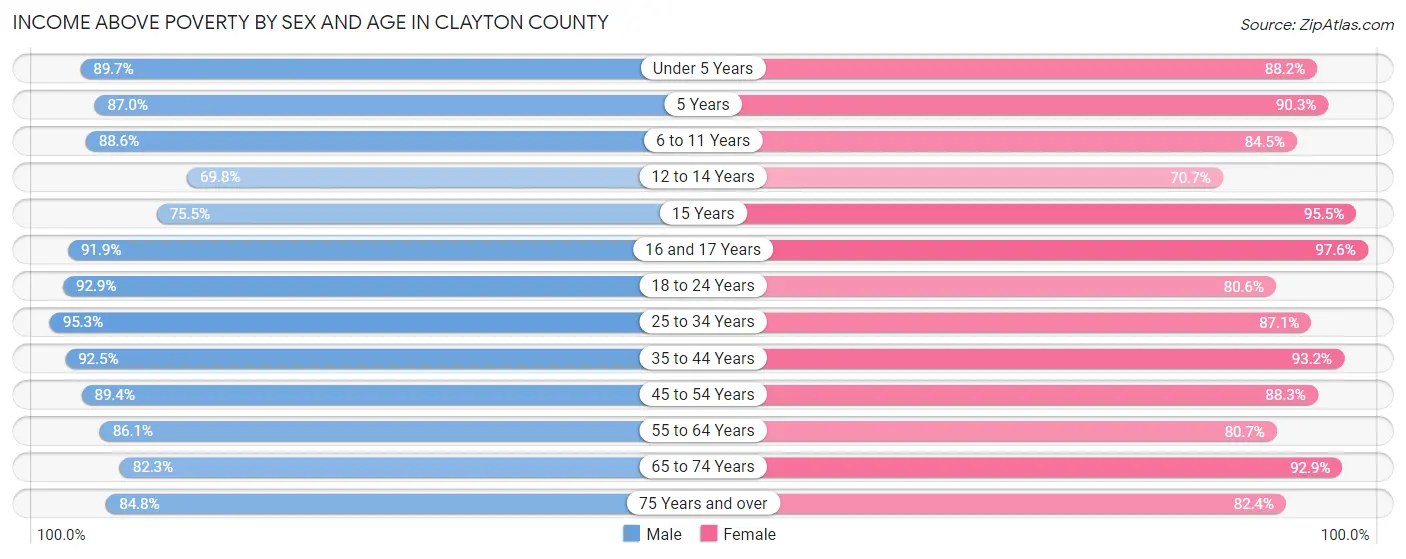
| Age Bracket | Male | Female |
| Under 5 Years | 425 (89.7%) | 426 (88.2%) |
| 5 Years | 134 (87.0%) | 102 (90.3%) |
| 6 to 11 Years | 437 (88.6%) | 451 (84.5%) |
| 12 to 14 Years | 264 (69.8%) | 219 (70.7%) |
| 15 Years | 80 (75.5%) | 63 (95.5%) |
| 16 and 17 Years | 194 (91.9%) | 243 (97.6%) |
| 18 to 24 Years | 571 (92.8%) | 439 (80.5%) |
| 25 to 34 Years | 836 (95.3%) | 751 (87.1%) |
| 35 to 44 Years | 820 (92.4%) | 794 (93.2%) |
| 45 to 54 Years | 904 (89.4%) | 786 (88.3%) |
| 55 to 64 Years | 1,215 (86.1%) | 1,093 (80.7%) |
| 65 to 74 Years | 954 (82.3%) | 1,031 (92.9%) |
| 75 Years and over | 643 (84.8%) | 778 (82.4%) |
| Total | 7,477 (87.6%) | 7,176 (86.3%) |
Income Below Poverty Among Married-Couple Families in Clayton County
The poverty statistics for married-couple families in Clayton County show that 4.2% or 155 of the total 3,698 families live below the poverty line. Families with 5 or more children have the highest poverty rate of 89.5%, comprising of 17 families. On the other hand, families with 3 or 4 children have the lowest poverty rate of 0.7%, which includes 3 families.
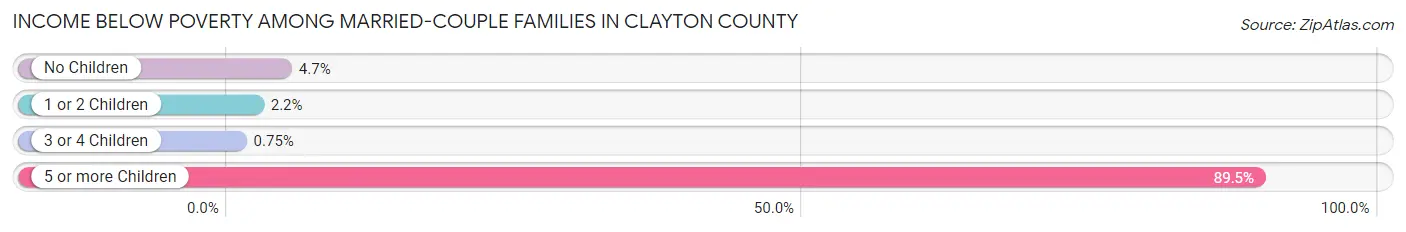
| Children | Above Poverty | Below Poverty |
| No Children | 2,399 (95.3%) | 118 (4.7%) |
| 1 or 2 Children | 743 (97.8%) | 17 (2.2%) |
| 3 or 4 Children | 399 (99.3%) | 3 (0.7%) |
| 5 or more Children | 2 (10.5%) | 17 (89.5%) |
| Total | 3,543 (95.8%) | 155 (4.2%) |
Income Below Poverty Among Single-Parent Households in Clayton County
According to the poverty data in Clayton County, 13.3% or 42 single-father households and 30.4% or 144 single-mother households are living below the poverty line. Among single-father households, those with 1 or 2 children have the highest poverty rate, with 39 households (18.8%) experiencing poverty. Likewise, among single-mother households, those with 5 or more children have the highest poverty rate, with 17 households (100.0%) falling below the poverty line.
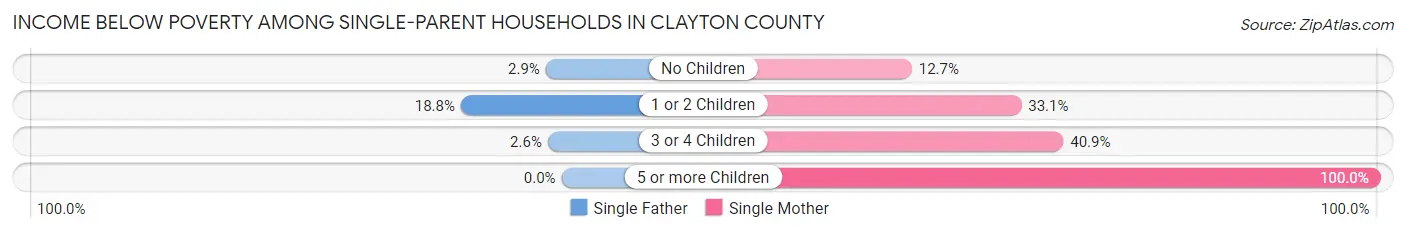
| Children | Single Father | Single Mother |
| No Children | 2 (2.9%) | 17 (12.7%) |
| 1 or 2 Children | 39 (18.8%) | 92 (33.1%) |
| 3 or 4 Children | 1 (2.6%) | 18 (40.9%) |
| 5 or more Children | 0 (0.0%) | 17 (100.0%) |
| Total | 42 (13.3%) | 144 (30.4%) |
Income Below Poverty Among Married-Couple vs Single-Parent Households in Clayton County
The poverty data for Clayton County shows that 155 of the married-couple family households (4.2%) and 186 of the single-parent households (23.6%) are living below the poverty level. Within the married-couple family households, those with 5 or more children have the highest poverty rate, with 17 households (89.5%) falling below the poverty line. Among the single-parent households, those with 5 or more children have the highest poverty rate, with 17 household (100.0%) living below poverty.
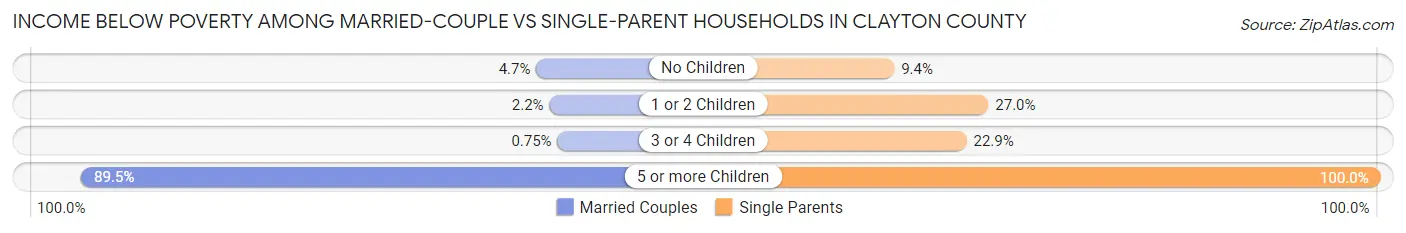
| Children | Married-Couple Families | Single-Parent Households |
| No Children | 118 (4.7%) | 19 (9.4%) |
| 1 or 2 Children | 17 (2.2%) | 131 (27.0%) |
| 3 or 4 Children | 3 (0.7%) | 19 (22.9%) |
| 5 or more Children | 17 (89.5%) | 17 (100.0%) |
| Total | 155 (4.2%) | 186 (23.6%) |
Race in Clayton County
The most populous races in Clayton County are White / Caucasian (16,455 | 96.1%), Two or more Races (450 | 2.6%), and Hispanic or Latino (376 | 2.2%).
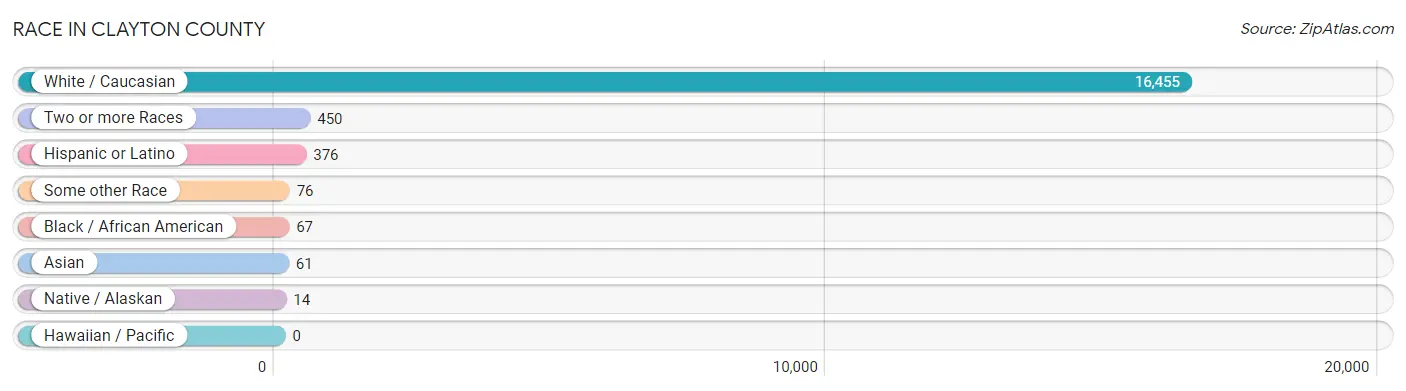
| Race | # Population | % Population |
| Asian | 61 | 0.4% |
| Black / African American | 67 | 0.4% |
| Hawaiian / Pacific | 0 | 0.0% |
| Hispanic or Latino | 376 | 2.2% |
| Native / Alaskan | 14 | 0.1% |
| White / Caucasian | 16,455 | 96.1% |
| Two or more Races | 450 | 2.6% |
| Some other Race | 76 | 0.4% |
| Total | 17,123 | 100.0% |
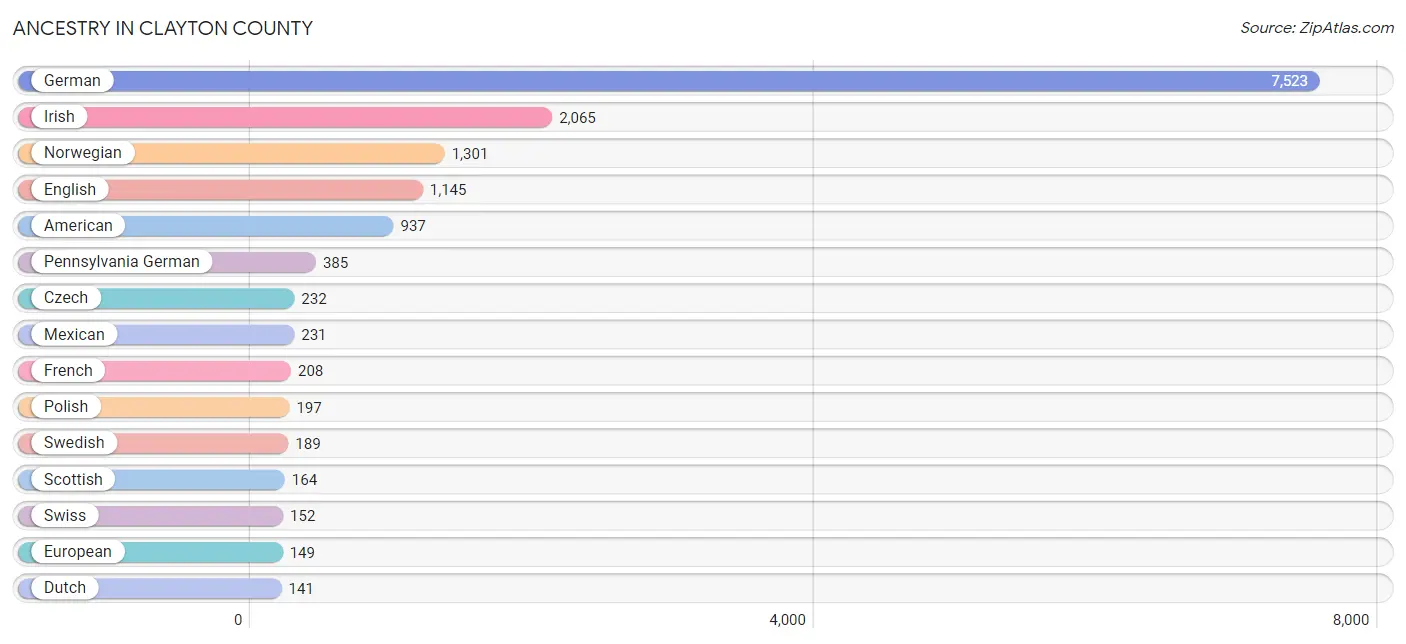
Ancestry in Clayton County
The most populous ancestries reported in Clayton County are German (7,523 | 43.9%), Irish (2,065 | 12.1%), Norwegian (1,301 | 7.6%), English (1,145 | 6.7%), and American (937 | 5.5%), together accounting for 75.8% of all Clayton County residents.
| Ancestry | # Population | % Population |
| African | 10 | 0.1% |
| Alaskan Athabascan | 19 | 0.1% |
| Albanian | 1 | 0.0% |
| American | 937 | 5.5% |
| Arab | 5 | 0.0% |
| Assyrian / Chaldean / Syriac | 3 | 0.0% |
| Austrian | 35 | 0.2% |
| Belgian | 6 | 0.0% |
| Bhutanese | 29 | 0.2% |
| Blackfeet | 4 | 0.0% |
| British | 60 | 0.4% |
| Bulgarian | 5 | 0.0% |
| Canadian | 23 | 0.1% |
| Celtic | 3 | 0.0% |
| Central American | 107 | 0.6% |
| Cherokee | 9 | 0.1% |
| Chippewa | 2 | 0.0% |
| Creek | 5 | 0.0% |
| Croatian | 14 | 0.1% |
| Czech | 232 | 1.3% |
| Czechoslovakian | 22 | 0.1% |
| Danish | 67 | 0.4% |
| Dutch | 141 | 0.8% |
| Dutch West Indian | 3 | 0.0% |
| Eastern European | 6 | 0.0% |
| English | 1,145 | 6.7% |
| European | 149 | 0.9% |
| French | 208 | 1.2% |
| French Canadian | 42 | 0.3% |
| German | 7,523 | 43.9% |
| Greek | 37 | 0.2% |
| Guatemalan | 11 | 0.1% |
| Honduran | 34 | 0.2% |
| Hungarian | 20 | 0.1% |
| Indonesian | 4 | 0.0% |
| Irish | 2,065 | 12.1% |
| Israeli | 68 | 0.4% |
| Italian | 102 | 0.6% |
| Korean | 61 | 0.4% |
| Lebanese | 5 | 0.0% |
| Lithuanian | 15 | 0.1% |
| Luxembourger | 26 | 0.2% |
| Menominee | 5 | 0.0% |
| Mexican | 231 | 1.3% |
| Mexican American Indian | 3 | 0.0% |
| Nicaraguan | 49 | 0.3% |
| Northern European | 21 | 0.1% |
| Norwegian | 1,301 | 7.6% |
| Pennsylvania German | 385 | 2.2% |
| Peruvian | 7 | 0.0% |
| Polish | 197 | 1.1% |
| Portuguese | 4 | 0.0% |
| Russian | 12 | 0.1% |
| Salvadoran | 13 | 0.1% |
| Scandinavian | 37 | 0.2% |
| Scotch-Irish | 80 | 0.5% |
| Scottish | 164 | 1.0% |
| Sioux | 1 | 0.0% |
| South American | 7 | 0.0% |
| Spanish American Indian | 3 | 0.0% |
| Subsaharan African | 10 | 0.1% |
| Swedish | 189 | 1.1% |
| Swiss | 152 | 0.9% |
| Thai | 1 | 0.0% |
| Ukrainian | 17 | 0.1% |
| Welsh | 56 | 0.3% |
| Yugoslavian | 2 | 0.0% | View All 67 Rows |
Immigrants in Clayton County
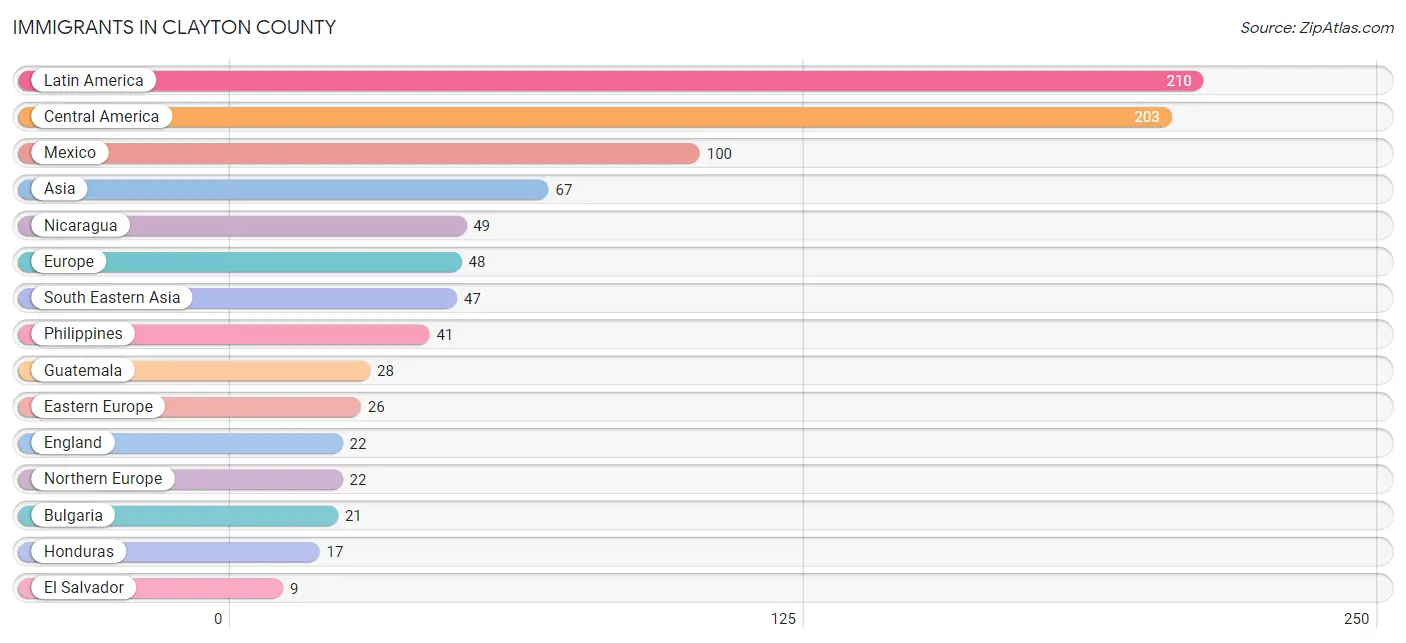
The most numerous immigrant groups reported in Clayton County came from Latin America (210 | 1.2%), Central America (203 | 1.2%), Mexico (100 | 0.6%), Asia (67 | 0.4%), and Nicaragua (49 | 0.3%), together accounting for 3.7% of all Clayton County residents.
| Immigration Origin | # Population | % Population |
| Africa | 3 | 0.0% |
| Asia | 67 | 0.4% |
| Bulgaria | 21 | 0.1% |
| Central America | 203 | 1.2% |
| Croatia | 5 | 0.0% |
| Eastern Asia | 7 | 0.0% |
| Eastern Europe | 26 | 0.2% |
| El Salvador | 9 | 0.1% |
| England | 22 | 0.1% |
| Europe | 48 | 0.3% |
| Guatemala | 28 | 0.2% |
| Honduras | 17 | 0.1% |
| India | 1 | 0.0% |
| Iran | 3 | 0.0% |
| Israel | 9 | 0.1% |
| Japan | 7 | 0.0% |
| Latin America | 210 | 1.2% |
| Mexico | 100 | 0.6% |
| Nicaragua | 49 | 0.3% |
| Northern Europe | 22 | 0.1% |
| Peru | 7 | 0.0% |
| Philippines | 41 | 0.2% |
| South Africa | 3 | 0.0% |
| South America | 7 | 0.0% |
| South Central Asia | 4 | 0.0% |
| South Eastern Asia | 47 | 0.3% |
| Thailand | 2 | 0.0% |
| Western Asia | 9 | 0.1% | View All 28 Rows |
Sex and Age in Clayton County
Sex and Age in Clayton County
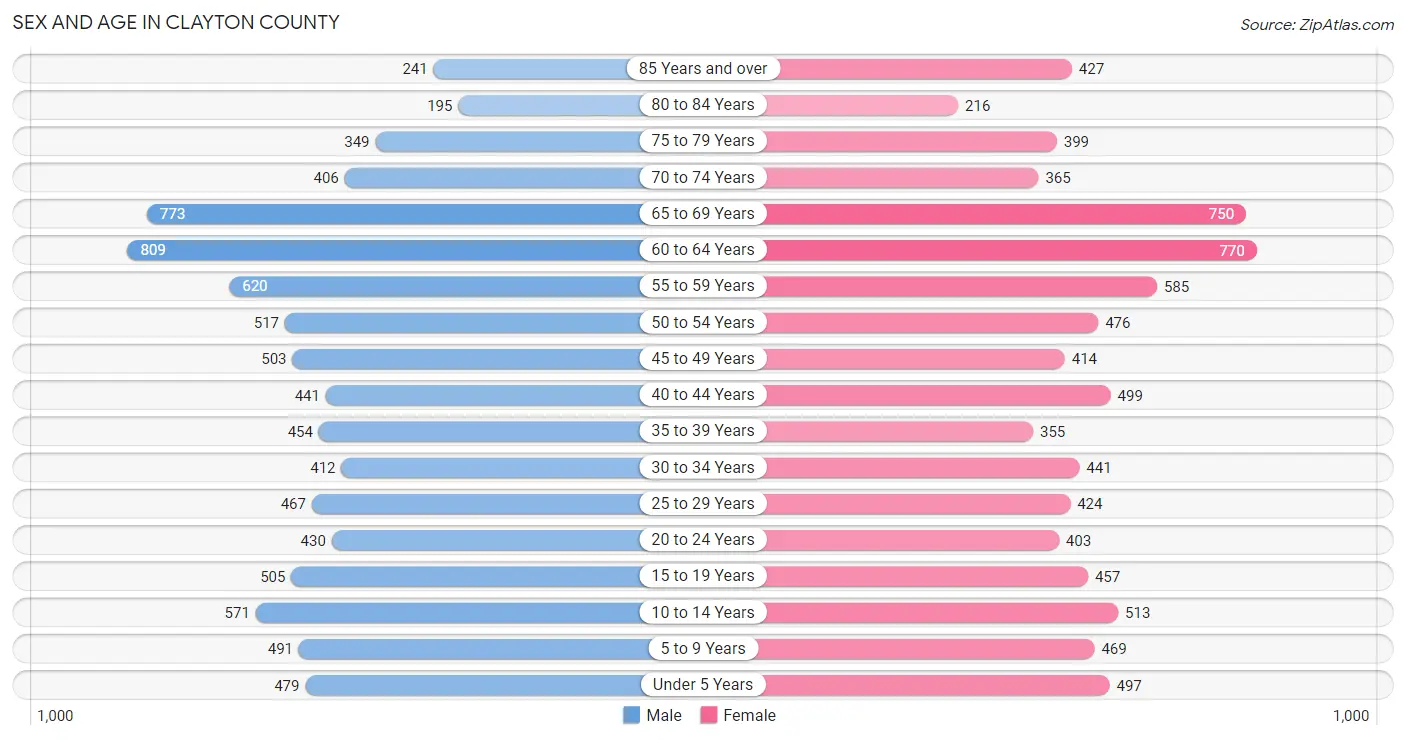
The most populous age groups in Clayton County are 60 to 64 Years (809 | 9.3%) for men and 60 to 64 Years (770 | 9.1%) for women.
| Age Bracket | Male | Female |
| Under 5 Years | 479 (5.5%) | 497 (5.9%) |
| 5 to 9 Years | 491 (5.7%) | 469 (5.5%) |
| 10 to 14 Years | 571 (6.6%) | 513 (6.1%) |
| 15 to 19 Years | 505 (5.8%) | 457 (5.4%) |
| 20 to 24 Years | 430 (5.0%) | 403 (4.8%) |
| 25 to 29 Years | 467 (5.4%) | 424 (5.0%) |
| 30 to 34 Years | 412 (4.8%) | 441 (5.2%) |
| 35 to 39 Years | 454 (5.2%) | 355 (4.2%) |
| 40 to 44 Years | 441 (5.1%) | 499 (5.9%) |
| 45 to 49 Years | 503 (5.8%) | 414 (4.9%) |
| 50 to 54 Years | 517 (6.0%) | 476 (5.6%) |
| 55 to 59 Years | 620 (7.2%) | 585 (6.9%) |
| 60 to 64 Years | 809 (9.3%) | 770 (9.1%) |
| 65 to 69 Years | 773 (8.9%) | 750 (8.9%) |
| 70 to 74 Years | 406 (4.7%) | 365 (4.3%) |
| 75 to 79 Years | 349 (4.0%) | 399 (4.7%) |
| 80 to 84 Years | 195 (2.2%) | 216 (2.5%) |
| 85 Years and over | 241 (2.8%) | 427 (5.1%) |
| Total | 8,663 (100.0%) | 8,460 (100.0%) |
Families and Households in Clayton County
Median Family Size in Clayton County
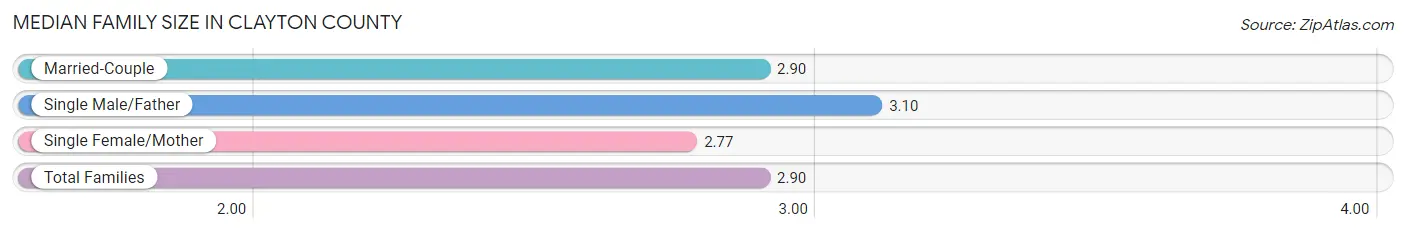
The median family size in Clayton County is 2.90 persons per family, with single male/father families (315 | 7.0%) accounting for the largest median family size of 3.1 persons per family. On the other hand, single female/mother families (473 | 10.5%) represent the smallest median family size with 2.77 persons per family.
| Family Type | # Families | Family Size |
| Married-Couple | 3,698 (82.4%) | 2.90 |
| Single Male/Father | 315 (7.0%) | 3.10 |
| Single Female/Mother | 473 (10.5%) | 2.77 |
| Total Families | 4,486 (100.0%) | 2.90 |
Median Household Size in Clayton County
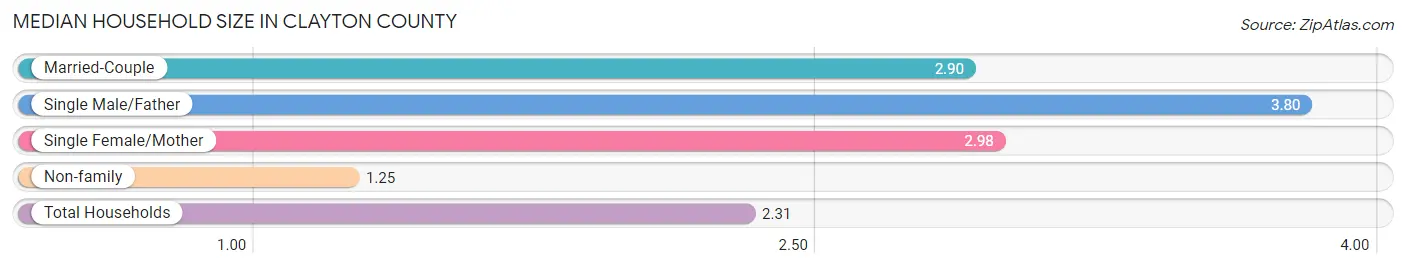
The median household size in Clayton County is 2.31 persons per household, with single male/father households (315 | 4.3%) accounting for the largest median household size of 3.8 persons per household. non-family households (2,800 | 38.4%) represent the smallest median household size with 1.25 persons per household.
| Household Type | # Households | Household Size |
| Married-Couple | 3,698 (50.7%) | 2.90 |
| Single Male/Father | 315 (4.3%) | 3.80 |
| Single Female/Mother | 473 (6.5%) | 2.98 |
| Non-family | 2,800 (38.4%) | 1.25 |
| Total Households | 7,286 (100.0%) | 2.31 |
Household Size by Marriage Status in Clayton County
Out of a total of 7,286 households in Clayton County, 4,486 (61.6%) are family households, while 2,800 (38.4%) are nonfamily households. The most numerous type of family households are 2-person households, comprising 2,509, and the most common type of nonfamily households are 1-person households, comprising 2,445.
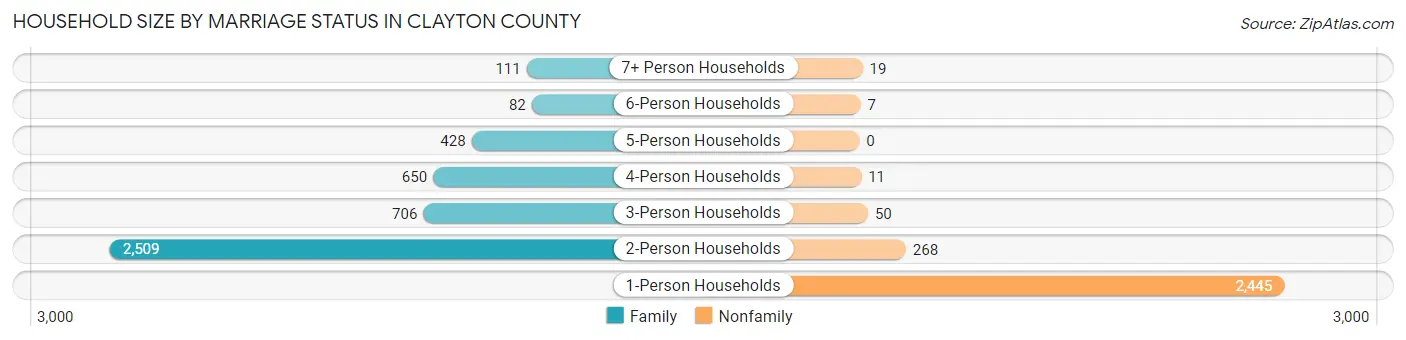
| Household Size | Family Households | Nonfamily Households |
| 1-Person Households | - | 2,445 (33.6%) |
| 2-Person Households | 2,509 (34.4%) | 268 (3.7%) |
| 3-Person Households | 706 (9.7%) | 50 (0.7%) |
| 4-Person Households | 650 (8.9%) | 11 (0.2%) |
| 5-Person Households | 428 (5.9%) | 0 (0.0%) |
| 6-Person Households | 82 (1.1%) | 7 (0.1%) |
| 7+ Person Households | 111 (1.5%) | 19 (0.3%) |
| Total | 4,486 (61.6%) | 2,800 (38.4%) |
Female Fertility in Clayton County
Fertility by Age in Clayton County
Average fertility rate in Clayton County is 72.0 births per 1,000 women. Women in the age bracket of 20 to 34 years have the highest fertility rate with 147.0 births per 1,000 women. Women in the age bracket of 20 to 34 years acount for 83.0% of all women with births.
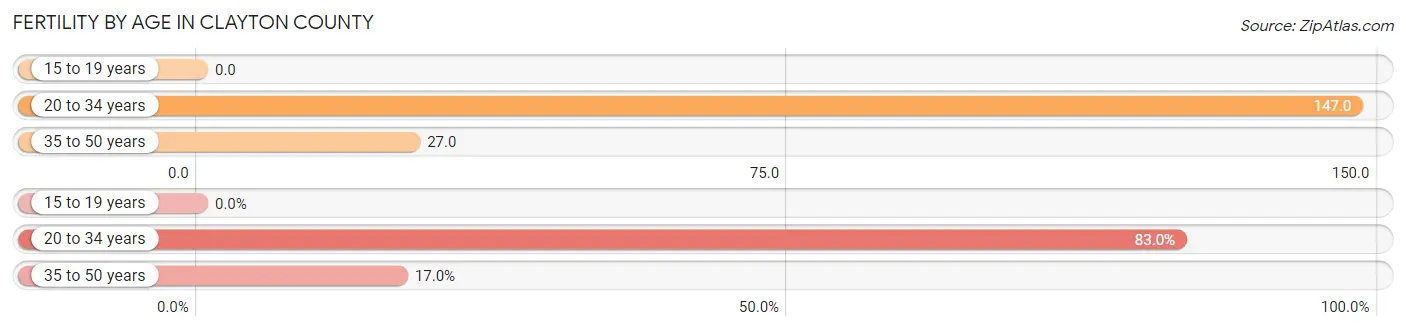
| Age Bracket | Women with Births | Births / 1,000 Women |
| 15 to 19 years | 0 (0.0%) | 0.0 |
| 20 to 34 years | 186 (83.0%) | 147.0 |
| 35 to 50 years | 38 (17.0%) | 27.0 |
| Total | 224 (100.0%) | 72.0 |
Fertility by Age by Marriage Status in Clayton County
69.6% of women with births (224) in Clayton County are married. The highest percentage of unmarried women with births falls into 20 to 34 years age bracket with 36.6% of them unmarried at the time of birth, while the lowest percentage of unmarried women with births belong to 35 to 50 years age bracket with 0.0% of them unmarried.
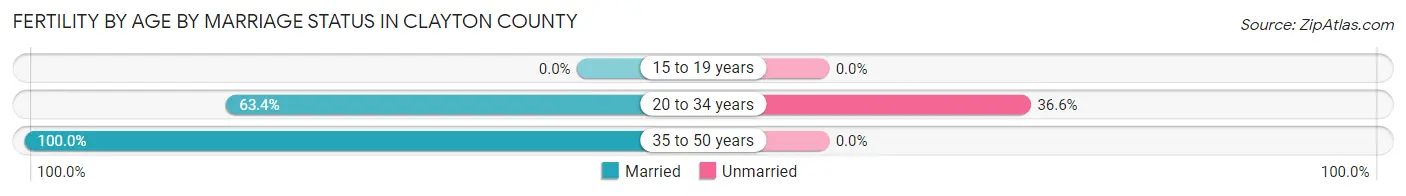
| Age Bracket | Married | Unmarried |
| 15 to 19 years | 0 (0.0%) | 0 (0.0%) |
| 20 to 34 years | 118 (63.4%) | 68 (36.6%) |
| 35 to 50 years | 38 (100.0%) | 0 (0.0%) |
| Total | 156 (69.6%) | 68 (30.4%) |
Fertility by Education in Clayton County
Average fertility rate in Clayton County is 72.0 births per 1,000 women. Women with the education attainment of bachelor's degree have the highest fertility rate of 133.0 births per 1,000 women, while women with the education attainment of less than high school have the lowest fertility at 29.0 births per 1,000 women. Women with the education attainment of college or associate's degree represent 33.5% of all women with births.
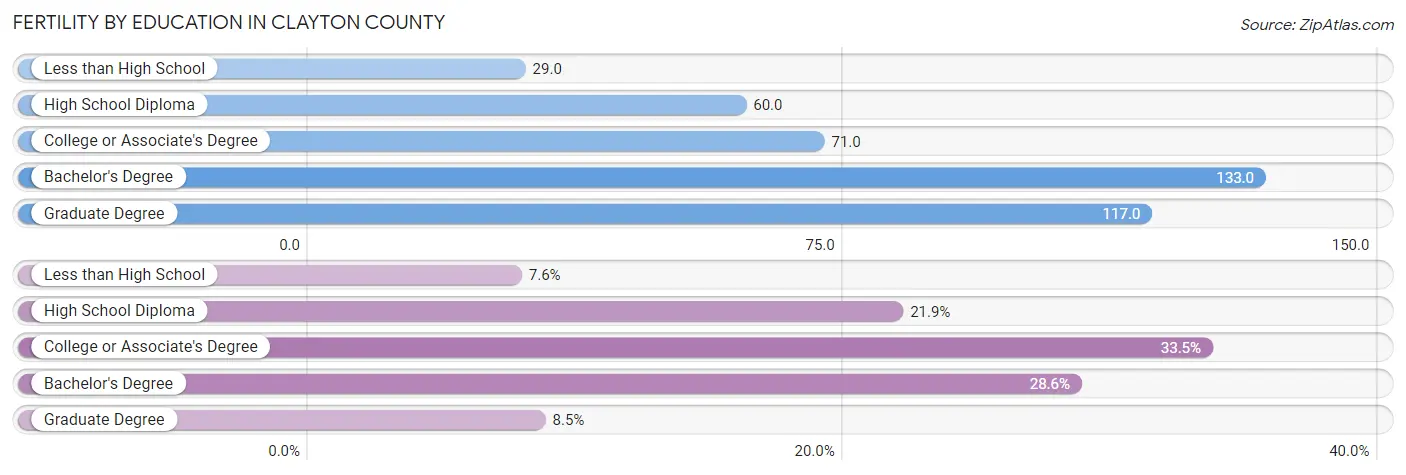
| Educational Attainment | Women with Births | Births / 1,000 Women |
| Less than High School | 17 (7.6%) | 29.0 |
| High School Diploma | 49 (21.9%) | 60.0 |
| College or Associate's Degree | 75 (33.5%) | 71.0 |
| Bachelor's Degree | 64 (28.6%) | 133.0 |
| Graduate Degree | 19 (8.5%) | 117.0 |
| Total | 224 (100.0%) | 72.0 |
Fertility by Education by Marriage Status in Clayton County
30.4% of women with births in Clayton County are unmarried. Women with the educational attainment of less than high school are most likely to be married with 100.0% of them married at childbirth, while women with the educational attainment of college or associate's degree are least likely to be married with 53.3% of them unmarried at childbirth.
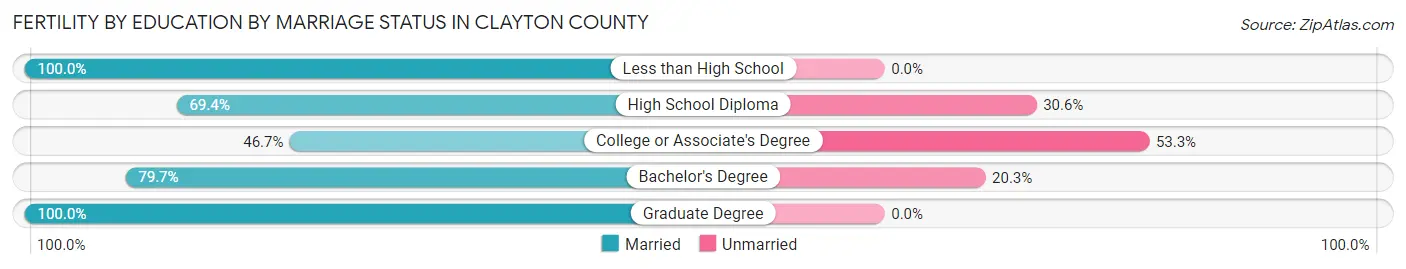
| Educational Attainment | Married | Unmarried |
| Less than High School | 17 (100.0%) | 0 (0.0%) |
| High School Diploma | 34 (69.4%) | 15 (30.6%) |
| College or Associate's Degree | 35 (46.7%) | 40 (53.3%) |
| Bachelor's Degree | 51 (79.7%) | 13 (20.3%) |
| Graduate Degree | 19 (100.0%) | 0 (0.0%) |
| Total | 156 (69.6%) | 68 (30.4%) |
Employment Characteristics in Clayton County
Employment by Class of Employer in Clayton County
Among the 8,523 employed individuals in Clayton County, private company employees (5,769 | 67.7%), self-employed (not incorporated) (822 | 9.6%), and not-for-profit organizations (674 | 7.9%) make up the most common classes of employment.
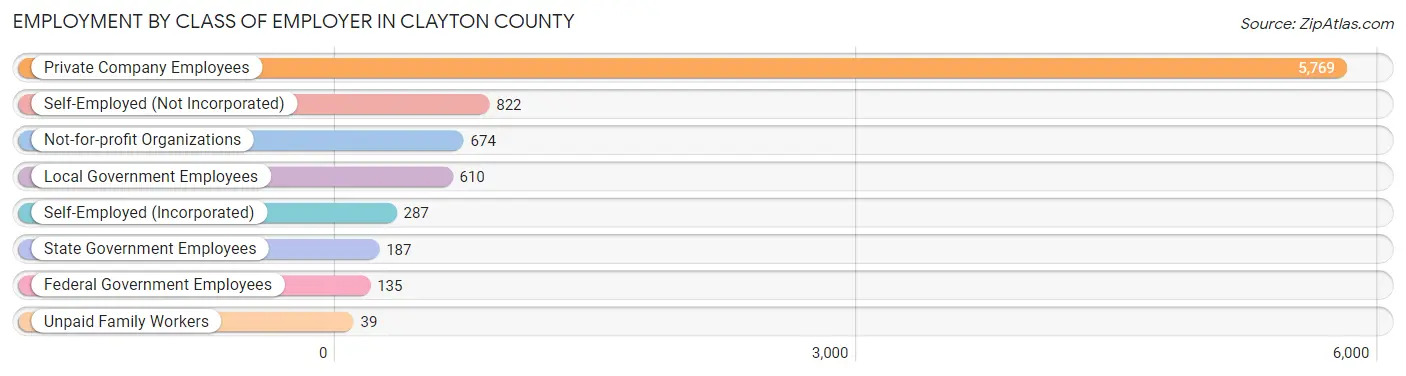
| Employer Class | # Employees | % Employees |
| Private Company Employees | 5,769 | 67.7% |
| Self-Employed (Incorporated) | 287 | 3.4% |
| Self-Employed (Not Incorporated) | 822 | 9.6% |
| Not-for-profit Organizations | 674 | 7.9% |
| Local Government Employees | 610 | 7.2% |
| State Government Employees | 187 | 2.2% |
| Federal Government Employees | 135 | 1.6% |
| Unpaid Family Workers | 39 | 0.5% |
| Total | 8,523 | 100.0% |
Employment Status by Age in Clayton County
According to the labor force statistics for Clayton County, out of the total population over 16 years of age (13,931), 63.5% or 8,846 individuals are in the labor force, with 2.6% or 230 of them unemployed. The age group with the highest labor force participation rate is 35 to 44 years, with 92.0% or 1,609 individuals in the labor force. Within the labor force, the 16 to 19 years age range has the highest percentage of unemployed individuals, with 6.0% or 30 of them being unemployed.
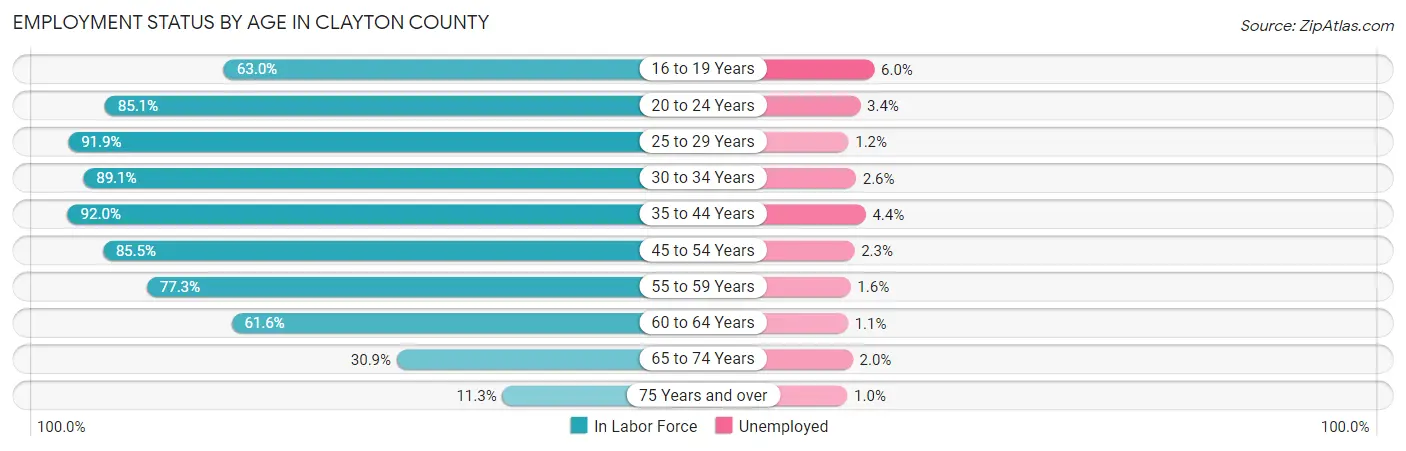
| Age Bracket | In Labor Force | Unemployed |
| 16 to 19 Years | 498 (63.0%) | 30 (6.0%) |
| 20 to 24 Years | 709 (85.1%) | 24 (3.4%) |
| 25 to 29 Years | 819 (91.9%) | 10 (1.2%) |
| 30 to 34 Years | 760 (89.1%) | 20 (2.6%) |
| 35 to 44 Years | 1,609 (92.0%) | 71 (4.4%) |
| 45 to 54 Years | 1,633 (85.5%) | 38 (2.3%) |
| 55 to 59 Years | 931 (77.3%) | 15 (1.6%) |
| 60 to 64 Years | 973 (61.6%) | 11 (1.1%) |
| 65 to 74 Years | 709 (30.9%) | 14 (2.0%) |
| 75 Years and over | 206 (11.3%) | 2 (1.0%) |
| Total | 8,846 (63.5%) | 230 (2.6%) |
Employment Status by Educational Attainment in Clayton County
According to labor force statistics for Clayton County, 82.2% of individuals (6,730) out of the total population between 25 and 64 years of age (8,187) are in the labor force, with 2.4% or 162 of them being unemployed. The group with the highest labor force participation rate are those with the educational attainment of bachelor's degree or higher, with 91.9% or 1,344 individuals in the labor force. Within the labor force, individuals with college / associate degree education have the highest percentage of unemployment, with 3.3% or 78 of them being unemployed.
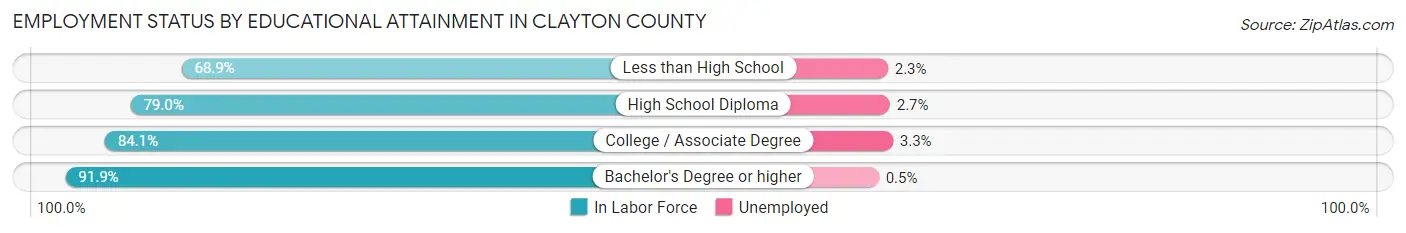
| Educational Attainment | In Labor Force | Unemployed |
| Less than High School | 516 (68.9%) | 17 (2.3%) |
| High School Diploma | 2,489 (79.0%) | 85 (2.7%) |
| College / Associate Degree | 2,376 (84.1%) | 93 (3.3%) |
| Bachelor's Degree or higher | 1,344 (91.9%) | 7 (0.5%) |
| Total | 6,730 (82.2%) | 196 (2.4%) |
Employment Occupations by Sex in Clayton County
Management, Business, Science and Arts Occupations
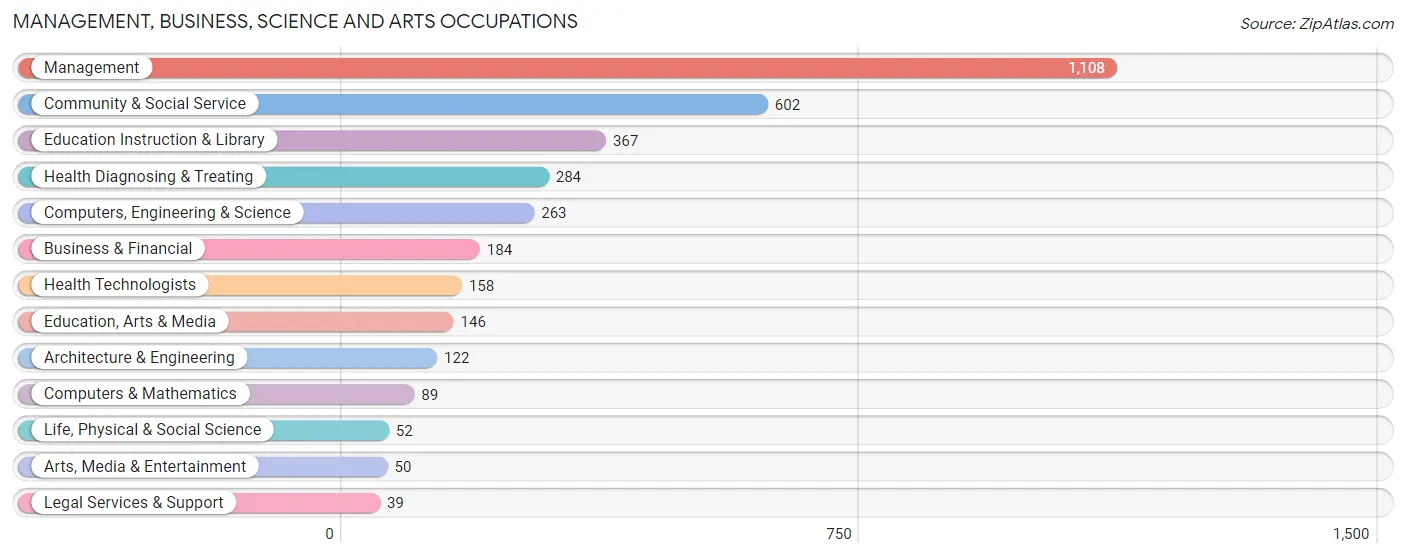
The most common Management, Business, Science and Arts occupations in Clayton County are Management (1,108 | 12.9%), Community & Social Service (602 | 7.0%), Education Instruction & Library (367 | 4.3%), Health Diagnosing & Treating (284 | 3.3%), and Computers, Engineering & Science (263 | 3.0%).
Management, Business, Science and Arts Occupations by Sex
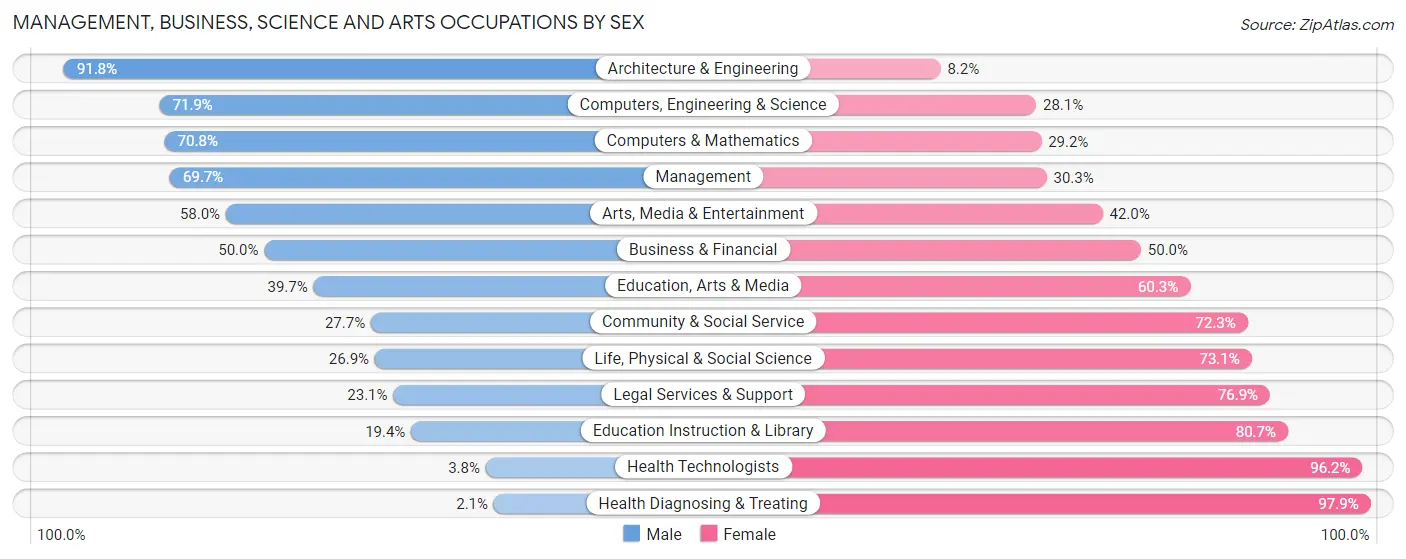
Within the Management, Business, Science and Arts occupations in Clayton County, the most male-oriented occupations are Architecture & Engineering (91.8%), Computers, Engineering & Science (71.9%), and Computers & Mathematics (70.8%), while the most female-oriented occupations are Health Diagnosing & Treating (97.9%), Health Technologists (96.2%), and Education Instruction & Library (80.6%).
| Occupation | Male | Female |
| Management | 772 (69.7%) | 336 (30.3%) |
| Business & Financial | 92 (50.0%) | 92 (50.0%) |
| Computers, Engineering & Science | 189 (71.9%) | 74 (28.1%) |
| Computers & Mathematics | 63 (70.8%) | 26 (29.2%) |
| Architecture & Engineering | 112 (91.8%) | 10 (8.2%) |
| Life, Physical & Social Science | 14 (26.9%) | 38 (73.1%) |
| Community & Social Service | 167 (27.7%) | 435 (72.3%) |
| Education, Arts & Media | 58 (39.7%) | 88 (60.3%) |
| Legal Services & Support | 9 (23.1%) | 30 (76.9%) |
| Education Instruction & Library | 71 (19.4%) | 296 (80.6%) |
| Arts, Media & Entertainment | 29 (58.0%) | 21 (42.0%) |
| Health Diagnosing & Treating | 6 (2.1%) | 278 (97.9%) |
| Health Technologists | 6 (3.8%) | 152 (96.2%) |
| Total (Category) | 1,226 (50.2%) | 1,215 (49.8%) |
| Total (Overall) | 4,711 (54.7%) | 3,900 (45.3%) |
Services Occupations
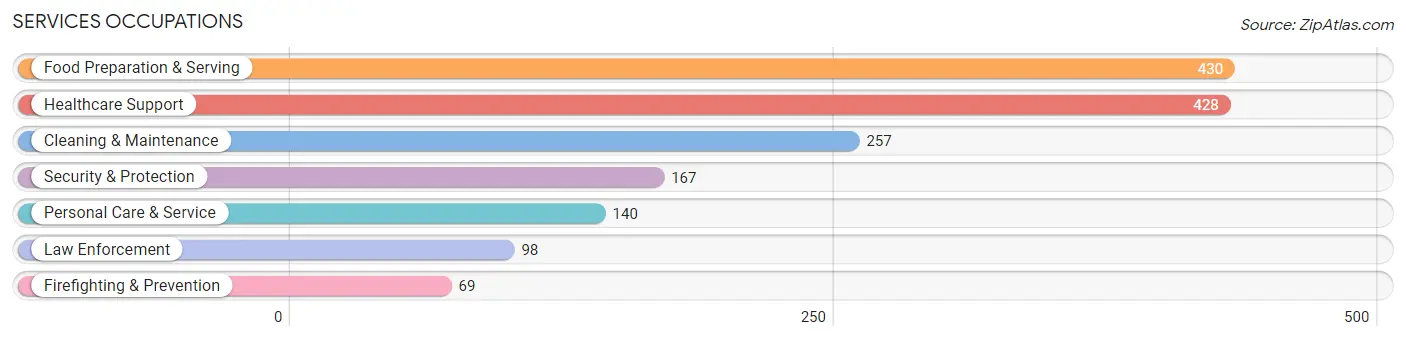
The most common Services occupations in Clayton County are Food Preparation & Serving (430 | 5.0%), Healthcare Support (428 | 5.0%), Cleaning & Maintenance (257 | 3.0%), Security & Protection (167 | 1.9%), and Personal Care & Service (140 | 1.6%).
Services Occupations by Sex
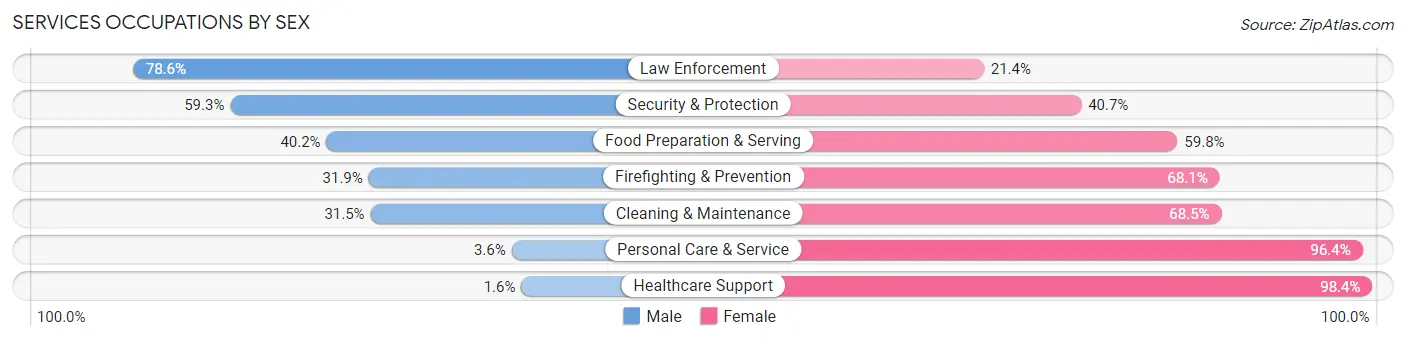
Within the Services occupations in Clayton County, the most male-oriented occupations are Law Enforcement (78.6%), Security & Protection (59.3%), and Food Preparation & Serving (40.2%), while the most female-oriented occupations are Healthcare Support (98.4%), Personal Care & Service (96.4%), and Cleaning & Maintenance (68.5%).
| Occupation | Male | Female |
| Healthcare Support | 7 (1.6%) | 421 (98.4%) |
| Security & Protection | 99 (59.3%) | 68 (40.7%) |
| Firefighting & Prevention | 22 (31.9%) | 47 (68.1%) |
| Law Enforcement | 77 (78.6%) | 21 (21.4%) |
| Food Preparation & Serving | 173 (40.2%) | 257 (59.8%) |
| Cleaning & Maintenance | 81 (31.5%) | 176 (68.5%) |
| Personal Care & Service | 5 (3.6%) | 135 (96.4%) |
| Total (Category) | 365 (25.7%) | 1,057 (74.3%) |
| Total (Overall) | 4,711 (54.7%) | 3,900 (45.3%) |
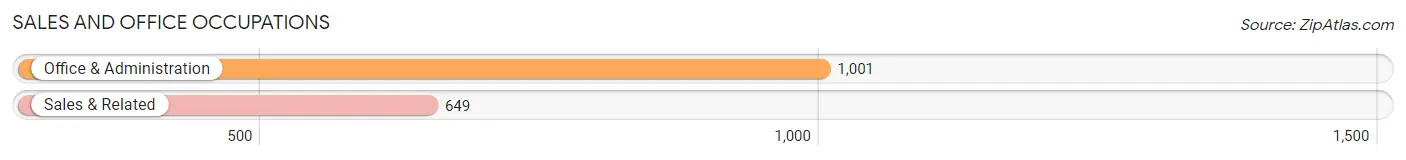
Sales and Office Occupations
The most common Sales and Office occupations in Clayton County are Office & Administration (1,001 | 11.6%), and Sales & Related (649 | 7.5%).
Sales and Office Occupations by Sex
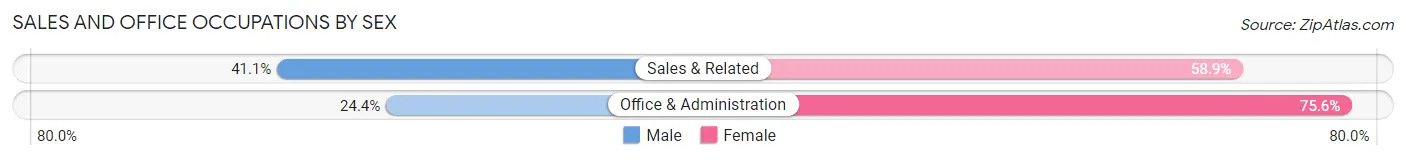
| Occupation | Male | Female |
| Sales & Related | 267 (41.1%) | 382 (58.9%) |
| Office & Administration | 244 (24.4%) | 757 (75.6%) |
| Total (Category) | 511 (31.0%) | 1,139 (69.0%) |
| Total (Overall) | 4,711 (54.7%) | 3,900 (45.3%) |
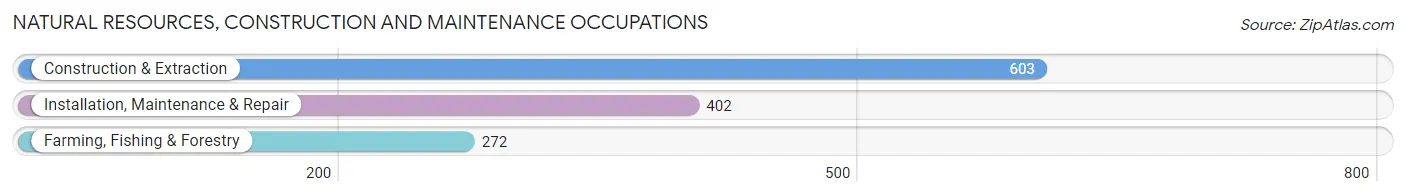
Natural Resources, Construction and Maintenance Occupations
The most common Natural Resources, Construction and Maintenance occupations in Clayton County are Construction & Extraction (603 | 7.0%), Installation, Maintenance & Repair (402 | 4.7%), and Farming, Fishing & Forestry (272 | 3.2%).
Natural Resources, Construction and Maintenance Occupations by Sex
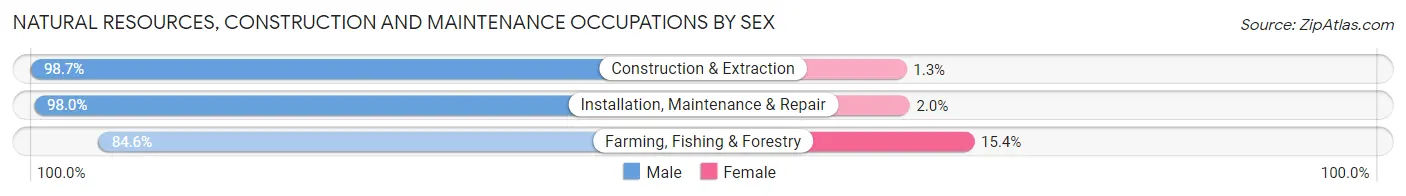
| Occupation | Male | Female |
| Farming, Fishing & Forestry | 230 (84.6%) | 42 (15.4%) |
| Construction & Extraction | 595 (98.7%) | 8 (1.3%) |
| Installation, Maintenance & Repair | 394 (98.0%) | 8 (2.0%) |
| Total (Category) | 1,219 (95.5%) | 58 (4.5%) |
| Total (Overall) | 4,711 (54.7%) | 3,900 (45.3%) |
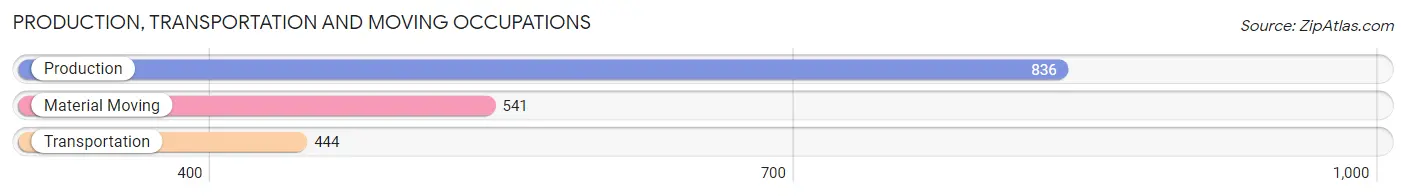
Production, Transportation and Moving Occupations
The most common Production, Transportation and Moving occupations in Clayton County are Production (836 | 9.7%), Material Moving (541 | 6.3%), and Transportation (444 | 5.2%).
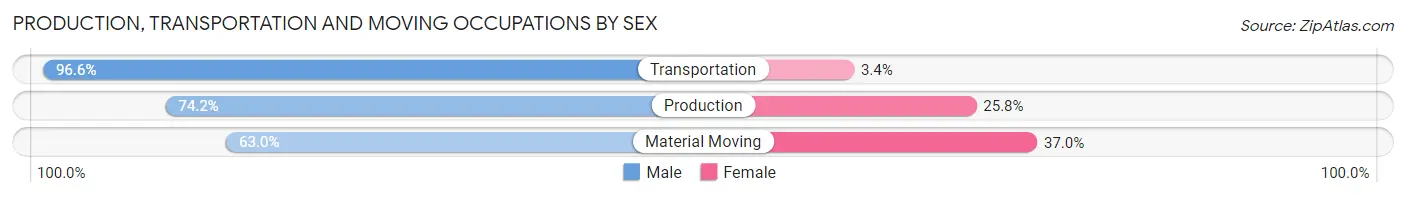
Production, Transportation and Moving Occupations by Sex
| Occupation | Male | Female |
| Production | 620 (74.2%) | 216 (25.8%) |
| Transportation | 429 (96.6%) | 15 (3.4%) |
| Material Moving | 341 (63.0%) | 200 (37.0%) |
| Total (Category) | 1,390 (76.3%) | 431 (23.7%) |
| Total (Overall) | 4,711 (54.7%) | 3,900 (45.3%) |
Employment Industries by Sex in Clayton County
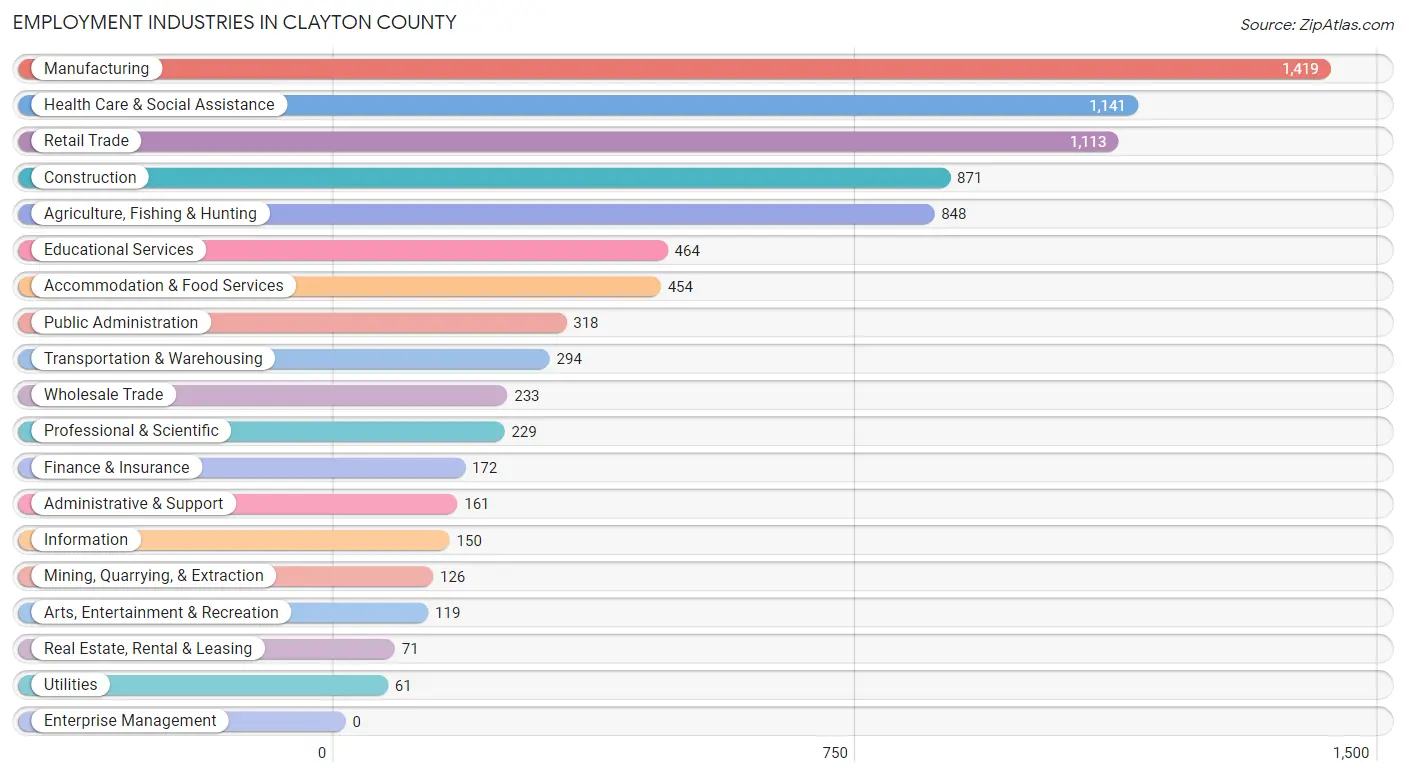
Employment Industries in Clayton County
The major employment industries in Clayton County include Manufacturing (1,419 | 16.5%), Health Care & Social Assistance (1,141 | 13.3%), Retail Trade (1,113 | 12.9%), Construction (871 | 10.1%), and Agriculture, Fishing & Hunting (848 | 9.9%).
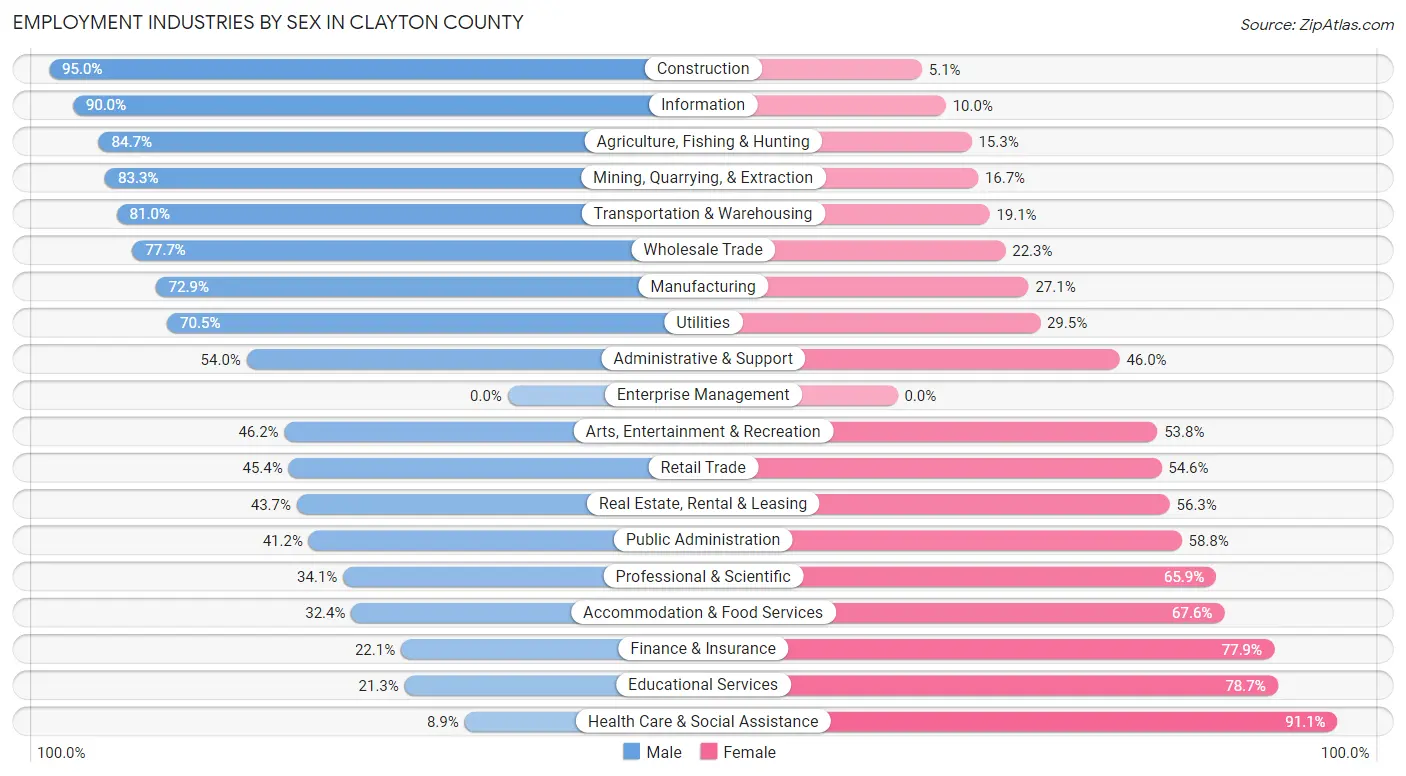
Employment Industries by Sex in Clayton County
The Clayton County industries that see more men than women are Construction (95.0%), Information (90.0%), and Agriculture, Fishing & Hunting (84.7%), whereas the industries that tend to have a higher number of women are Health Care & Social Assistance (91.1%), Educational Services (78.7%), and Finance & Insurance (77.9%).
| Industry | Male | Female |
| Agriculture, Fishing & Hunting | 718 (84.7%) | 130 (15.3%) |
| Mining, Quarrying, & Extraction | 105 (83.3%) | 21 (16.7%) |
| Construction | 827 (95.0%) | 44 (5.1%) |
| Manufacturing | 1,034 (72.9%) | 385 (27.1%) |
| Wholesale Trade | 181 (77.7%) | 52 (22.3%) |
| Retail Trade | 505 (45.4%) | 608 (54.6%) |
| Transportation & Warehousing | 238 (80.9%) | 56 (19.1%) |
| Utilities | 43 (70.5%) | 18 (29.5%) |
| Information | 135 (90.0%) | 15 (10.0%) |
| Finance & Insurance | 38 (22.1%) | 134 (77.9%) |
| Real Estate, Rental & Leasing | 31 (43.7%) | 40 (56.3%) |
| Professional & Scientific | 78 (34.1%) | 151 (65.9%) |
| Enterprise Management | 0 (0.0%) | 0 (0.0%) |
| Administrative & Support | 87 (54.0%) | 74 (46.0%) |
| Educational Services | 99 (21.3%) | 365 (78.7%) |
| Health Care & Social Assistance | 102 (8.9%) | 1,039 (91.1%) |
| Arts, Entertainment & Recreation | 55 (46.2%) | 64 (53.8%) |
| Accommodation & Food Services | 147 (32.4%) | 307 (67.6%) |
| Public Administration | 131 (41.2%) | 187 (58.8%) |
| Total | 4,711 (54.7%) | 3,900 (45.3%) |
Education in Clayton County
School Enrollment in Clayton County
The most common levels of schooling among the 3,155 students in Clayton County are middle school (798 | 25.3%), elementary school (741 | 23.5%), and high school (688 | 21.8%).
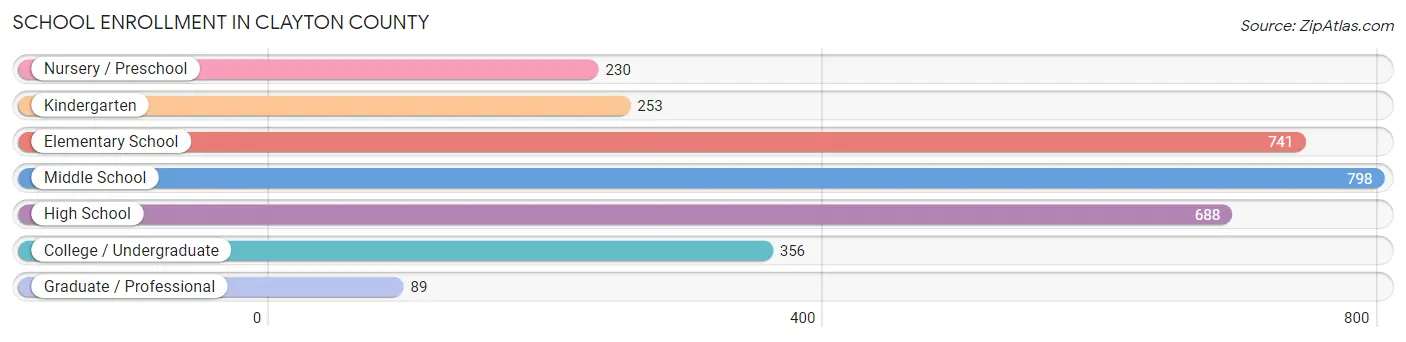
| School Level | # Students | % Students |
| Nursery / Preschool | 230 | 7.3% |
| Kindergarten | 253 | 8.0% |
| Elementary School | 741 | 23.5% |
| Middle School | 798 | 25.3% |
| High School | 688 | 21.8% |
| College / Undergraduate | 356 | 11.3% |
| Graduate / Professional | 89 | 2.8% |
| Total | 3,155 | 100.0% |
School Enrollment by Age by Funding Source in Clayton County
Out of a total of 3,155 students who are enrolled in schools in Clayton County, 476 (15.1%) attend a private institution, while the remaining 2,679 (84.9%) are enrolled in public schools. The age group of 25 to 34 year olds has the highest likelihood of being enrolled in private schools, with 60 (58.3% in the age bracket) enrolled. Conversely, the age group of 20 to 24 year olds has the lowest likelihood of being enrolled in a private school, with 168 (92.3% in the age bracket) attending a public institution.
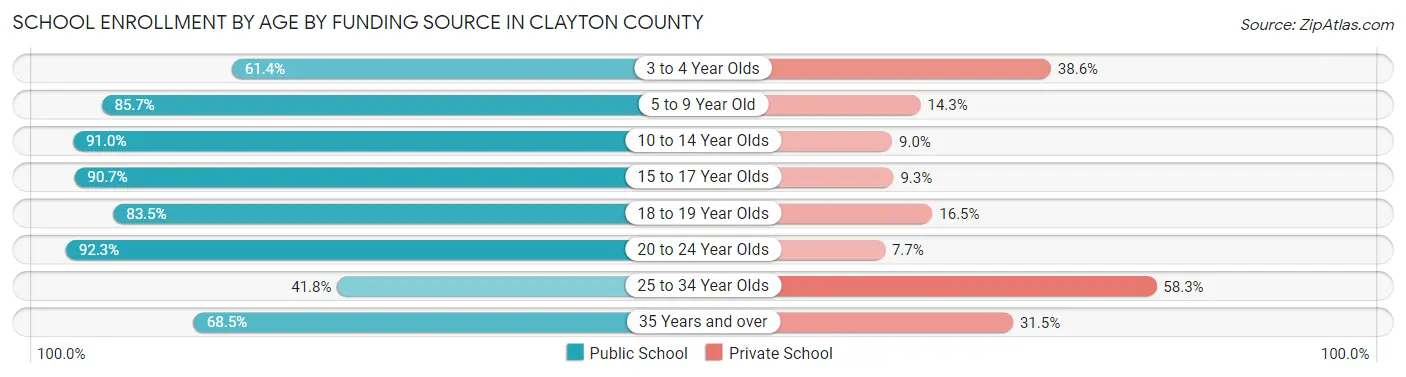
| Age Bracket | Public School | Private School |
| 3 to 4 Year Olds | 105 (61.4%) | 66 (38.6%) |
| 5 to 9 Year Old | 778 (85.7%) | 130 (14.3%) |
| 10 to 14 Year Olds | 948 (91.0%) | 94 (9.0%) |
| 15 to 17 Year Olds | 440 (90.7%) | 45 (9.3%) |
| 18 to 19 Year Olds | 96 (83.5%) | 19 (16.5%) |
| 20 to 24 Year Olds | 168 (92.3%) | 14 (7.7%) |
| 25 to 34 Year Olds | 43 (41.7%) | 60 (58.3%) |
| 35 Years and over | 102 (68.5%) | 47 (31.5%) |
| Total | 2,679 (84.9%) | 476 (15.1%) |
Educational Attainment by Field of Study in Clayton County
Education (639 | 27.3%), business (304 | 13.0%), science & technology (296 | 12.7%), bio, nature & agricultural (277 | 11.8%), and arts & humanities (198 | 8.5%) are the most common fields of study among 2,338 individuals in Clayton County who have obtained a bachelor's degree or higher.
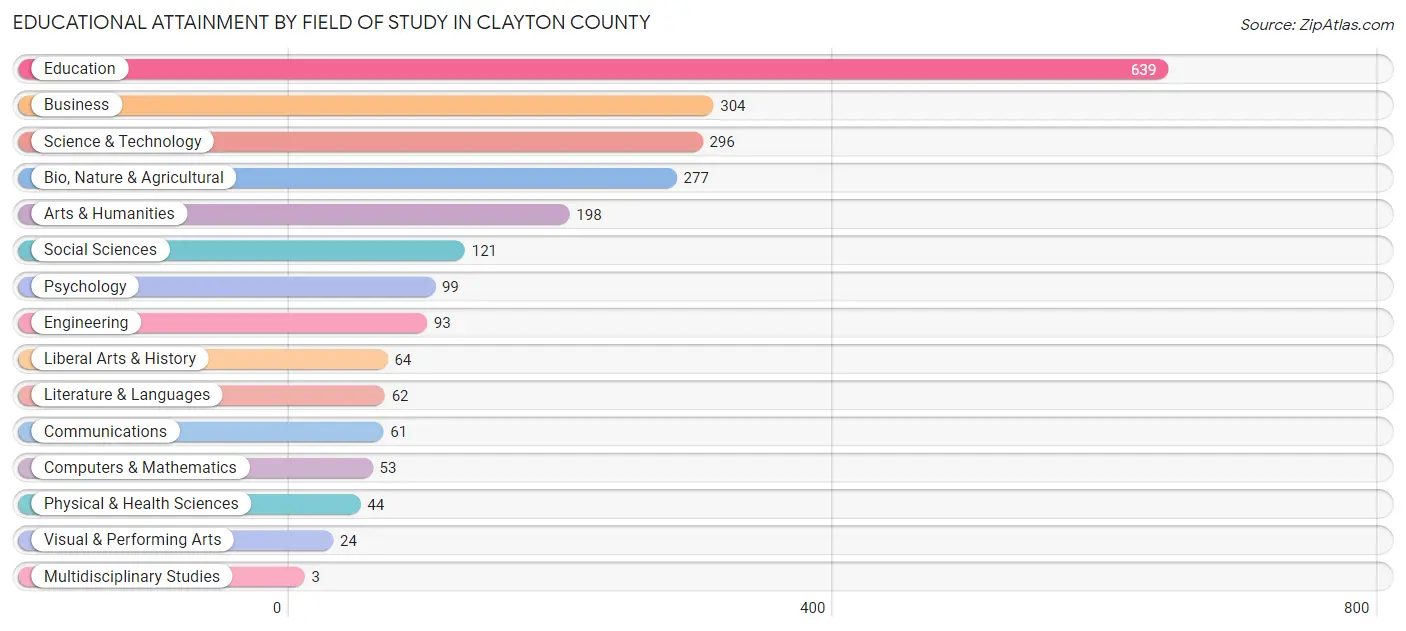
| Field of Study | # Graduates | % Graduates |
| Computers & Mathematics | 53 | 2.3% |
| Bio, Nature & Agricultural | 277 | 11.8% |
| Physical & Health Sciences | 44 | 1.9% |
| Psychology | 99 | 4.2% |
| Social Sciences | 121 | 5.2% |
| Engineering | 93 | 4.0% |
| Multidisciplinary Studies | 3 | 0.1% |
| Science & Technology | 296 | 12.7% |
| Business | 304 | 13.0% |
| Education | 639 | 27.3% |
| Literature & Languages | 62 | 2.6% |
| Liberal Arts & History | 64 | 2.7% |
| Visual & Performing Arts | 24 | 1.0% |
| Communications | 61 | 2.6% |
| Arts & Humanities | 198 | 8.5% |
| Total | 2,338 | 100.0% |
Transportation & Commute in Clayton County
Vehicle Availability by Sex in Clayton County
The most prevalent vehicle ownership categories in Clayton County are males with 2 vehicles (1,806, accounting for 38.6%) and females with 2 vehicles (1,337, making up 47.0%).
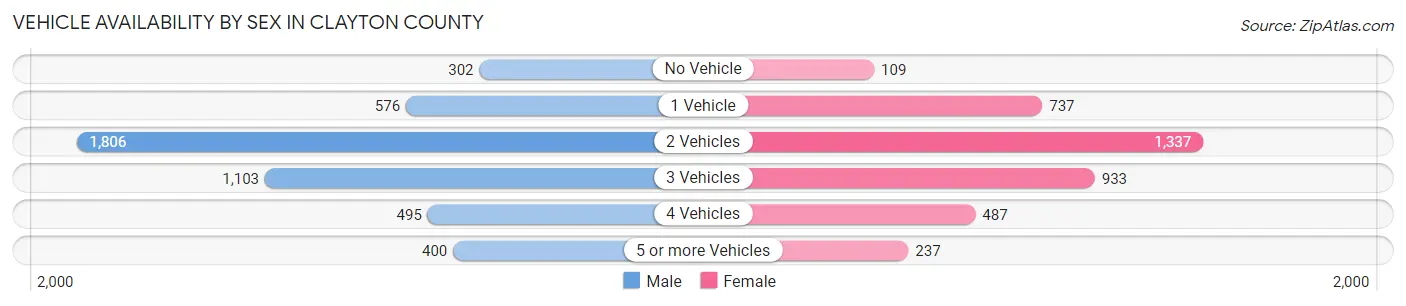
| Vehicles Available | Male | Female |
| No Vehicle | 302 (6.5%) | 109 (2.8%) |
| 1 Vehicle | 576 (12.3%) | 737 (19.2%) |
| 2 Vehicles | 1,806 (38.6%) | 1,337 (34.8%) |
| 3 Vehicles | 1,103 (23.6%) | 933 (24.3%) |
| 4 Vehicles | 495 (10.6%) | 487 (12.7%) |
| 5 or more Vehicles | 400 (8.5%) | 237 (6.2%) |
| Total | 4,682 (100.0%) | 3,840 (100.0%) |
Commute Time in Clayton County
The most frequently occuring commute durations in Clayton County are 5 to 9 minutes (1,459 commuters, 18.7%), 10 to 14 minutes (1,060 commuters, 13.6%), and 15 to 19 minutes (944 commuters, 12.1%).
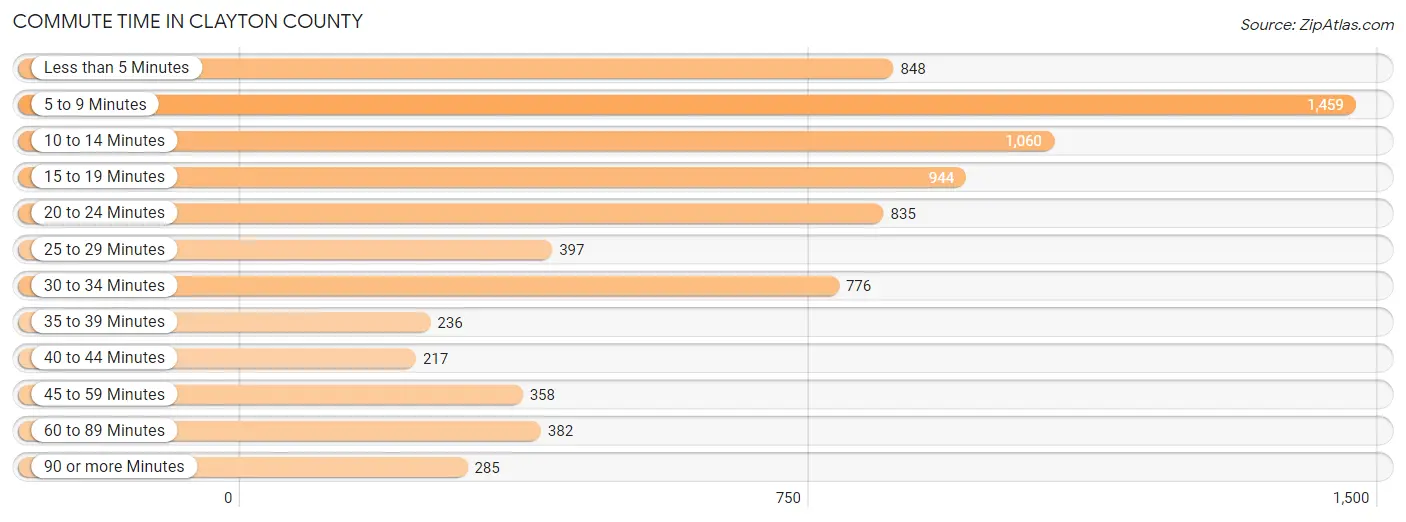
| Commute Time | # Commuters | % Commuters |
| Less than 5 Minutes | 848 | 10.9% |
| 5 to 9 Minutes | 1,459 | 18.7% |
| 10 to 14 Minutes | 1,060 | 13.6% |
| 15 to 19 Minutes | 944 | 12.1% |
| 20 to 24 Minutes | 835 | 10.7% |
| 25 to 29 Minutes | 397 | 5.1% |
| 30 to 34 Minutes | 776 | 10.0% |
| 35 to 39 Minutes | 236 | 3.0% |
| 40 to 44 Minutes | 217 | 2.8% |
| 45 to 59 Minutes | 358 | 4.6% |
| 60 to 89 Minutes | 382 | 4.9% |
| 90 or more Minutes | 285 | 3.7% |
Commute Time by Sex in Clayton County
The most common commute times in Clayton County are 5 to 9 minutes (870 commuters, 20.2%) for males and 10 to 14 minutes (594 commuters, 17.0%) for females.
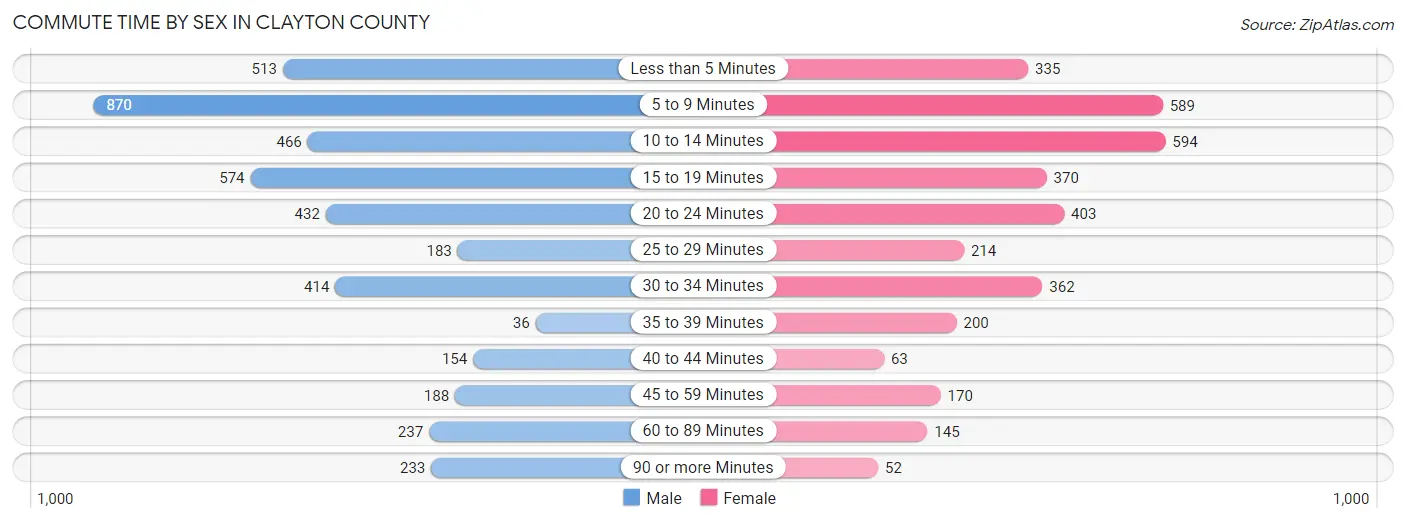
| Commute Time | Male | Female |
| Less than 5 Minutes | 513 (11.9%) | 335 (9.6%) |
| 5 to 9 Minutes | 870 (20.2%) | 589 (16.8%) |
| 10 to 14 Minutes | 466 (10.8%) | 594 (17.0%) |
| 15 to 19 Minutes | 574 (13.4%) | 370 (10.6%) |
| 20 to 24 Minutes | 432 (10.1%) | 403 (11.5%) |
| 25 to 29 Minutes | 183 (4.3%) | 214 (6.1%) |
| 30 to 34 Minutes | 414 (9.6%) | 362 (10.3%) |
| 35 to 39 Minutes | 36 (0.8%) | 200 (5.7%) |
| 40 to 44 Minutes | 154 (3.6%) | 63 (1.8%) |
| 45 to 59 Minutes | 188 (4.4%) | 170 (4.9%) |
| 60 to 89 Minutes | 237 (5.5%) | 145 (4.2%) |
| 90 or more Minutes | 233 (5.4%) | 52 (1.5%) |
Time of Departure to Work by Sex in Clayton County
The most frequent times of departure to work in Clayton County are 7:00 AM to 7:29 AM (564, 13.1%) for males and 7:00 AM to 7:29 AM (634, 18.1%) for females.
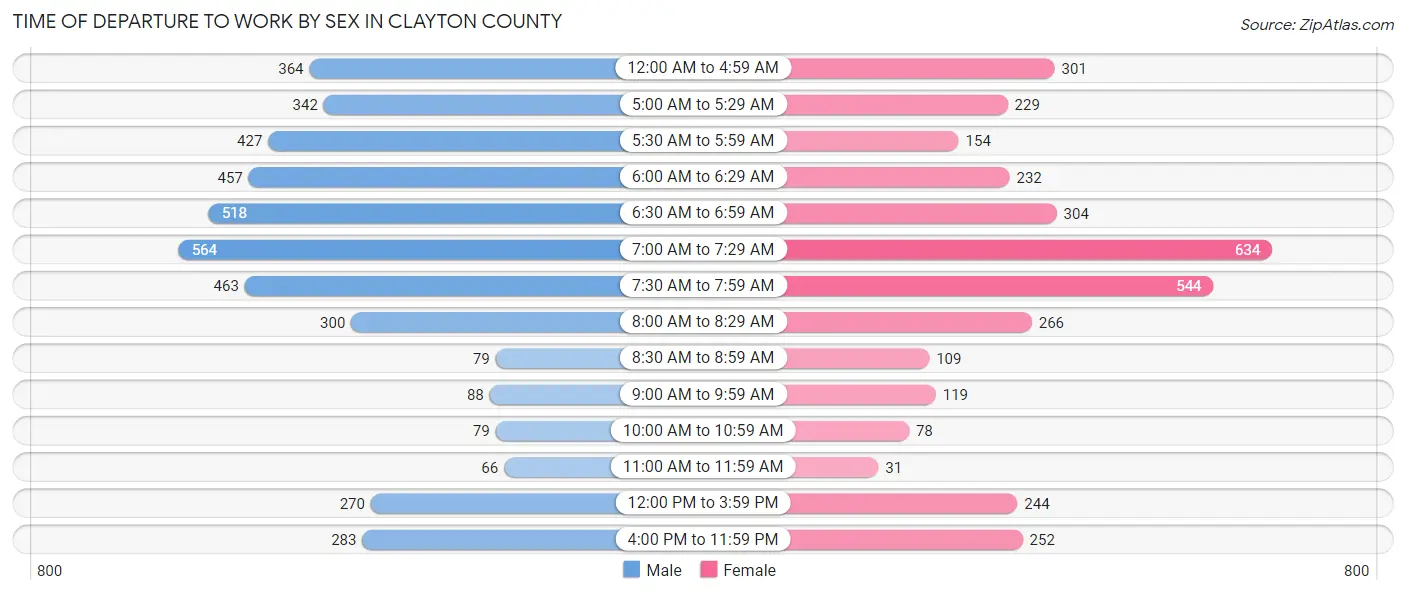
| Time of Departure | Male | Female |
| 12:00 AM to 4:59 AM | 364 (8.5%) | 301 (8.6%) |
| 5:00 AM to 5:29 AM | 342 (8.0%) | 229 (6.6%) |
| 5:30 AM to 5:59 AM | 427 (9.9%) | 154 (4.4%) |
| 6:00 AM to 6:29 AM | 457 (10.6%) | 232 (6.6%) |
| 6:30 AM to 6:59 AM | 518 (12.0%) | 304 (8.7%) |
| 7:00 AM to 7:29 AM | 564 (13.1%) | 634 (18.1%) |
| 7:30 AM to 7:59 AM | 463 (10.8%) | 544 (15.6%) |
| 8:00 AM to 8:29 AM | 300 (7.0%) | 266 (7.6%) |
| 8:30 AM to 8:59 AM | 79 (1.8%) | 109 (3.1%) |
| 9:00 AM to 9:59 AM | 88 (2.1%) | 119 (3.4%) |
| 10:00 AM to 10:59 AM | 79 (1.8%) | 78 (2.2%) |
| 11:00 AM to 11:59 AM | 66 (1.5%) | 31 (0.9%) |
| 12:00 PM to 3:59 PM | 270 (6.3%) | 244 (7.0%) |
| 4:00 PM to 11:59 PM | 283 (6.6%) | 252 (7.2%) |
| Total | 4,300 (100.0%) | 3,497 (100.0%) |
Housing Occupancy in Clayton County
Occupancy by Ownership in Clayton County
Of the total 7,286 dwellings in Clayton County, owner-occupied units account for 5,486 (75.3%), while renter-occupied units make up 1,800 (24.7%).
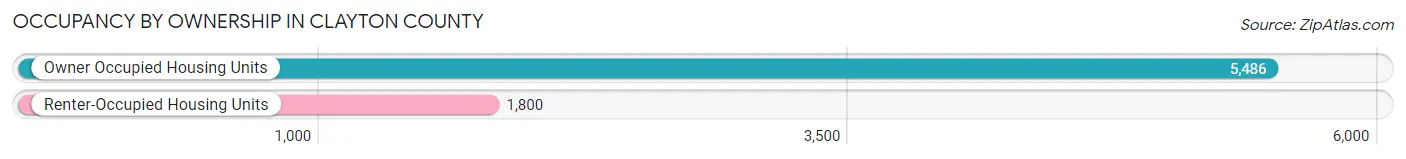
| Occupancy | # Housing Units | % Housing Units |
| Owner Occupied Housing Units | 5,486 | 75.3% |
| Renter-Occupied Housing Units | 1,800 | 24.7% |
| Total Occupied Housing Units | 7,286 | 100.0% |
Occupancy by Household Size in Clayton County
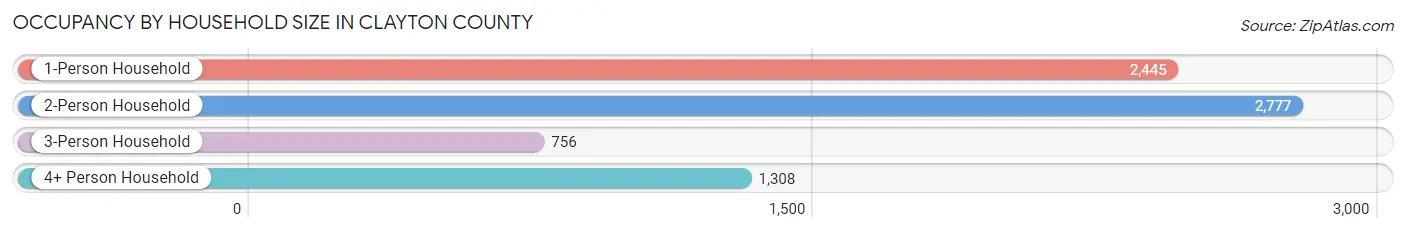
| Household Size | # Housing Units | % Housing Units |
| 1-Person Household | 2,445 | 33.6% |
| 2-Person Household | 2,777 | 38.1% |
| 3-Person Household | 756 | 10.4% |
| 4+ Person Household | 1,308 | 17.9% |
| Total Housing Units | 7,286 | 100.0% |
Occupancy by Ownership by Household Size in Clayton County
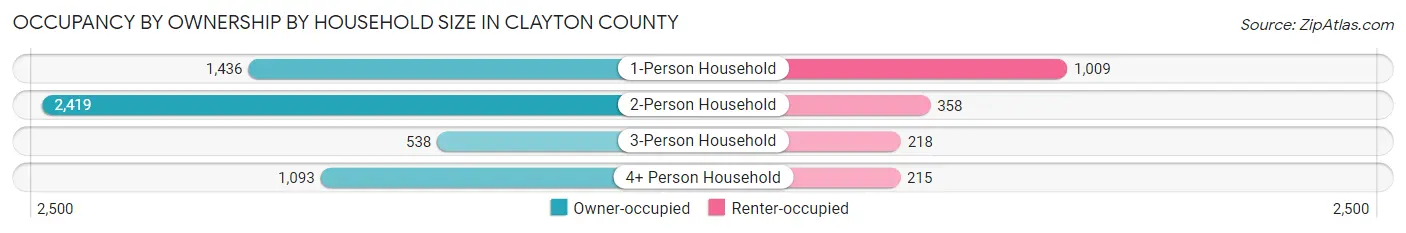
| Household Size | Owner-occupied | Renter-occupied |
| 1-Person Household | 1,436 (58.7%) | 1,009 (41.3%) |
| 2-Person Household | 2,419 (87.1%) | 358 (12.9%) |
| 3-Person Household | 538 (71.2%) | 218 (28.8%) |
| 4+ Person Household | 1,093 (83.6%) | 215 (16.4%) |
| Total Housing Units | 5,486 (75.3%) | 1,800 (24.7%) |
Occupancy by Educational Attainment in Clayton County
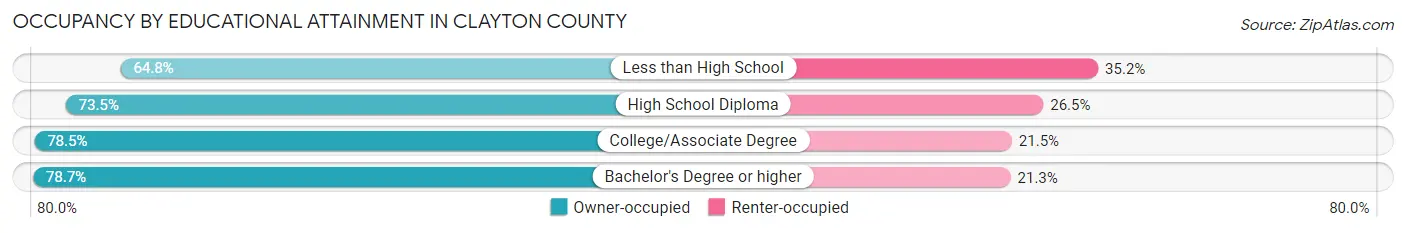
| Household Size | Owner-occupied | Renter-occupied |
| Less than High School | 379 (64.8%) | 206 (35.2%) |
| High School Diploma | 2,273 (73.5%) | 820 (26.5%) |
| College/Associate Degree | 1,749 (78.5%) | 480 (21.5%) |
| Bachelor's Degree or higher | 1,085 (78.7%) | 294 (21.3%) |
Occupancy by Age of Householder in Clayton County
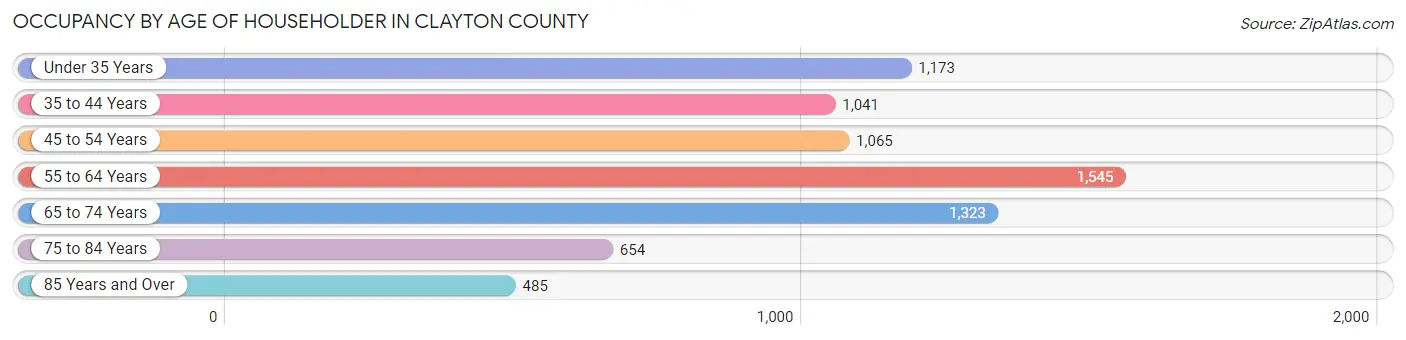
| Age Bracket | # Households | % Households |
| Under 35 Years | 1,173 | 16.1% |
| 35 to 44 Years | 1,041 | 14.3% |
| 45 to 54 Years | 1,065 | 14.6% |
| 55 to 64 Years | 1,545 | 21.2% |
| 65 to 74 Years | 1,323 | 18.2% |
| 75 to 84 Years | 654 | 9.0% |
| 85 Years and Over | 485 | 6.7% |
| Total | 7,286 | 100.0% |
Housing Finances in Clayton County
Median Income by Occupancy in Clayton County
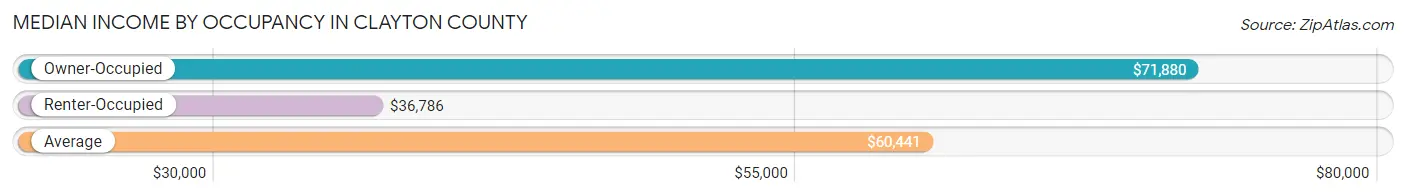
| Occupancy Type | # Households | Median Income |
| Owner-Occupied | 5,486 (75.3%) | $71,880 |
| Renter-Occupied | 1,800 (24.7%) | $36,786 |
| Average | 7,286 (100.0%) | $60,441 |
Occupancy by Householder Income Bracket in Clayton County
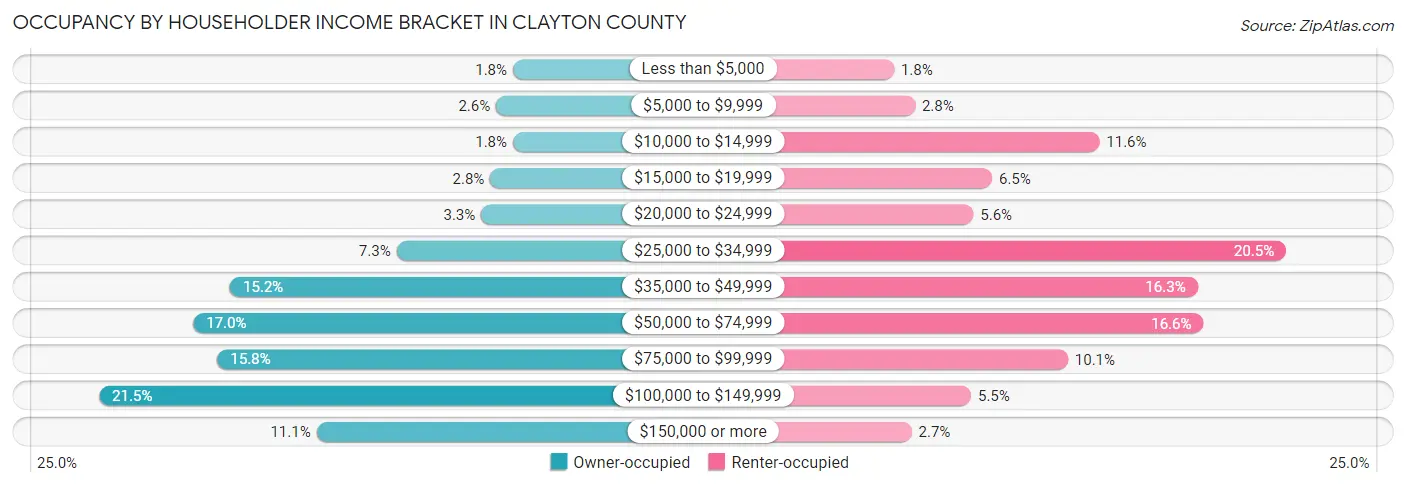
| Income Bracket | Owner-occupied | Renter-occupied |
| Less than $5,000 | 96 (1.8%) | 33 (1.8%) |
| $5,000 to $9,999 | 140 (2.5%) | 51 (2.8%) |
| $10,000 to $14,999 | 96 (1.8%) | 209 (11.6%) |
| $15,000 to $19,999 | 155 (2.8%) | 117 (6.5%) |
| $20,000 to $24,999 | 179 (3.3%) | 101 (5.6%) |
| $25,000 to $34,999 | 400 (7.3%) | 369 (20.5%) |
| $35,000 to $49,999 | 835 (15.2%) | 293 (16.3%) |
| $50,000 to $74,999 | 931 (17.0%) | 298 (16.6%) |
| $75,000 to $99,999 | 868 (15.8%) | 182 (10.1%) |
| $100,000 to $149,999 | 1,177 (21.4%) | 99 (5.5%) |
| $150,000 or more | 609 (11.1%) | 48 (2.7%) |
| Total | 5,486 (100.0%) | 1,800 (100.0%) |
Monthly Housing Cost Tiers in Clayton County
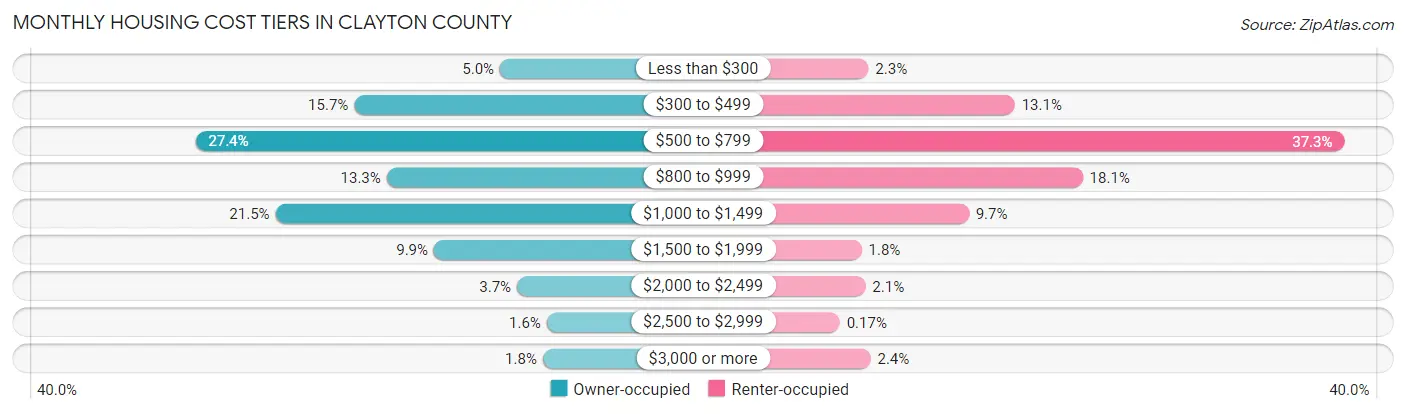
| Monthly Cost | Owner-occupied | Renter-occupied |
| Less than $300 | 274 (5.0%) | 41 (2.3%) |
| $300 to $499 | 863 (15.7%) | 235 (13.1%) |
| $500 to $799 | 1,504 (27.4%) | 672 (37.3%) |
| $800 to $999 | 732 (13.3%) | 325 (18.1%) |
| $1,000 to $1,499 | 1,181 (21.5%) | 174 (9.7%) |
| $1,500 to $1,999 | 541 (9.9%) | 32 (1.8%) |
| $2,000 to $2,499 | 205 (3.7%) | 37 (2.1%) |
| $2,500 to $2,999 | 85 (1.5%) | 3 (0.2%) |
| $3,000 or more | 101 (1.8%) | 44 (2.4%) |
| Total | 5,486 (100.0%) | 1,800 (100.0%) |
Physical Housing Characteristics in Clayton County
Housing Structures in Clayton County
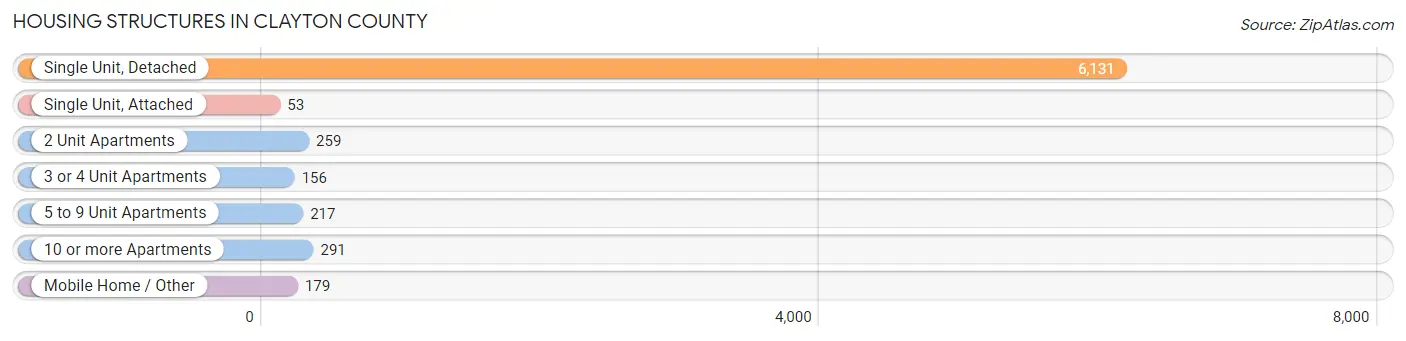
| Structure Type | # Housing Units | % Housing Units |
| Single Unit, Detached | 6,131 | 84.2% |
| Single Unit, Attached | 53 | 0.7% |
| 2 Unit Apartments | 259 | 3.5% |
| 3 or 4 Unit Apartments | 156 | 2.1% |
| 5 to 9 Unit Apartments | 217 | 3.0% |
| 10 or more Apartments | 291 | 4.0% |
| Mobile Home / Other | 179 | 2.5% |
| Total | 7,286 | 100.0% |
Housing Structures by Occupancy in Clayton County
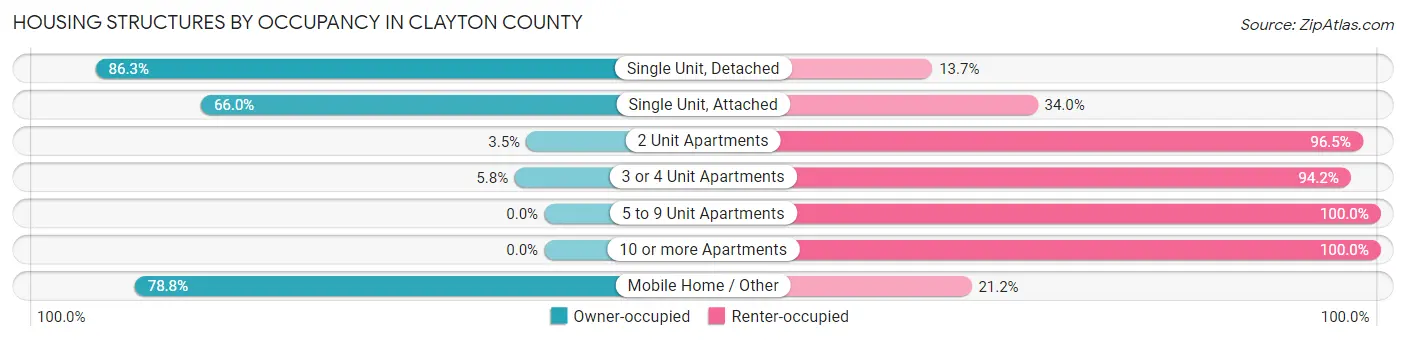
| Structure Type | Owner-occupied | Renter-occupied |
| Single Unit, Detached | 5,292 (86.3%) | 839 (13.7%) |
| Single Unit, Attached | 35 (66.0%) | 18 (34.0%) |
| 2 Unit Apartments | 9 (3.5%) | 250 (96.5%) |
| 3 or 4 Unit Apartments | 9 (5.8%) | 147 (94.2%) |
| 5 to 9 Unit Apartments | 0 (0.0%) | 217 (100.0%) |
| 10 or more Apartments | 0 (0.0%) | 291 (100.0%) |
| Mobile Home / Other | 141 (78.8%) | 38 (21.2%) |
| Total | 5,486 (75.3%) | 1,800 (24.7%) |
Housing Structures by Number of Rooms in Clayton County
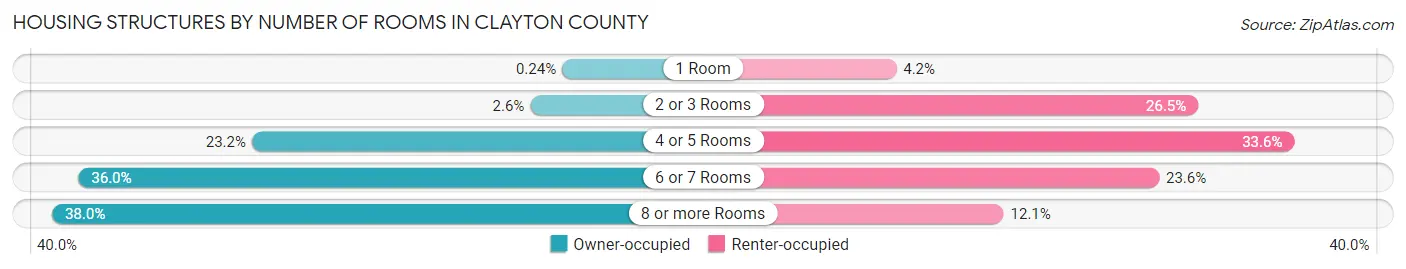
| Number of Rooms | Owner-occupied | Renter-occupied |
| 1 Room | 13 (0.2%) | 75 (4.2%) |
| 2 or 3 Rooms | 142 (2.6%) | 477 (26.5%) |
| 4 or 5 Rooms | 1,272 (23.2%) | 605 (33.6%) |
| 6 or 7 Rooms | 1,976 (36.0%) | 425 (23.6%) |
| 8 or more Rooms | 2,083 (38.0%) | 218 (12.1%) |
| Total | 5,486 (100.0%) | 1,800 (100.0%) |
Housing Structure by Heating Type in Clayton County
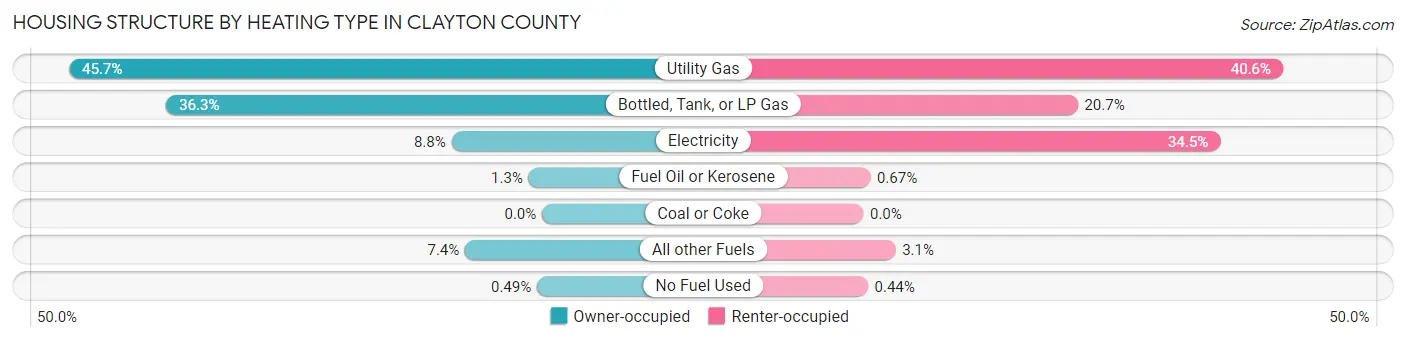
| Heating Type | Owner-occupied | Renter-occupied |
| Utility Gas | 2,507 (45.7%) | 730 (40.6%) |
| Bottled, Tank, or LP Gas | 1,993 (36.3%) | 373 (20.7%) |
| Electricity | 480 (8.7%) | 621 (34.5%) |
| Fuel Oil or Kerosene | 71 (1.3%) | 12 (0.7%) |
| Coal or Coke | 0 (0.0%) | 0 (0.0%) |
| All other Fuels | 408 (7.4%) | 56 (3.1%) |
| No Fuel Used | 27 (0.5%) | 8 (0.4%) |
| Total | 5,486 (100.0%) | 1,800 (100.0%) |
Household Vehicle Usage in Clayton County
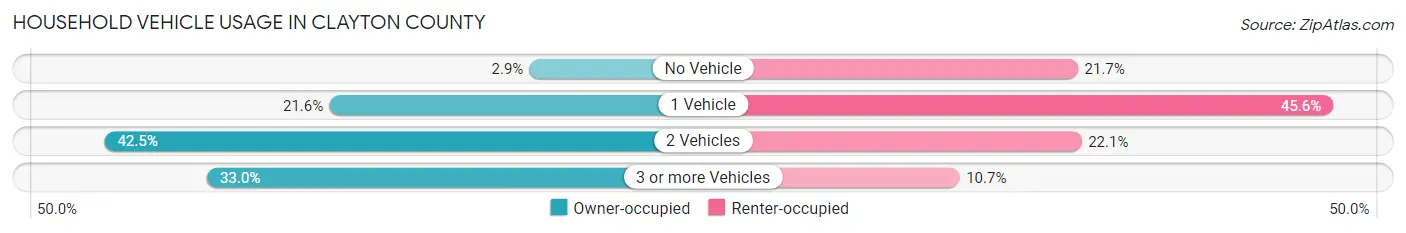
| Vehicles per Household | Owner-occupied | Renter-occupied |
| No Vehicle | 159 (2.9%) | 391 (21.7%) |
| 1 Vehicle | 1,184 (21.6%) | 820 (45.6%) |
| 2 Vehicles | 2,334 (42.5%) | 397 (22.1%) |
| 3 or more Vehicles | 1,809 (33.0%) | 192 (10.7%) |
| Total | 5,486 (100.0%) | 1,800 (100.0%) |
Real Estate & Mortgages in Clayton County
Real Estate and Mortgage Overview in Clayton County
| Characteristic | Without Mortgage | With Mortgage |
| Housing Units | 2,682 | 2,804 |
| Median Property Value | $144,100 | $155,200 |
| Median Household Income | $50,188 | $390 |
| Monthly Housing Costs | $545 | $101 |
| Real Estate Taxes | $2,014 | $51 |
Property Value by Mortgage Status in Clayton County
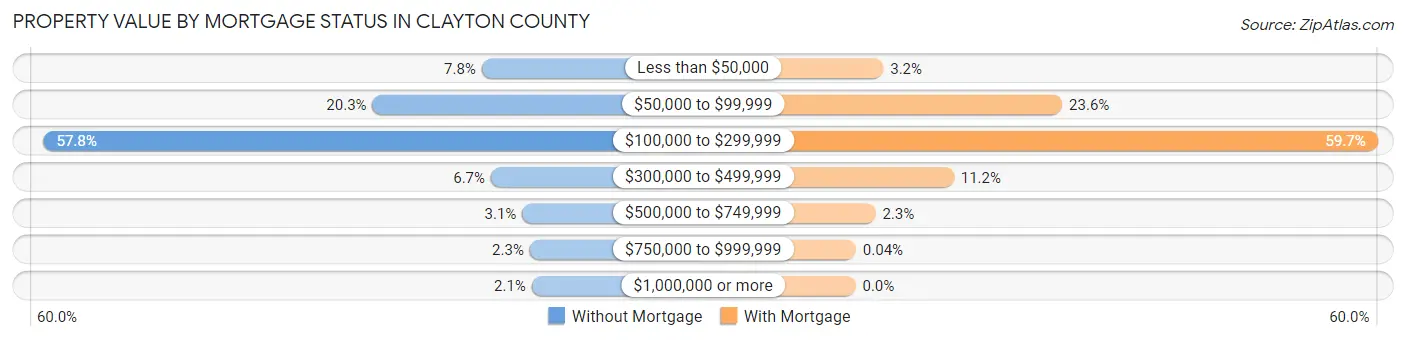
| Property Value | Without Mortgage | With Mortgage |
| Less than $50,000 | 208 (7.8%) | 89 (3.2%) |
| $50,000 to $99,999 | 543 (20.3%) | 662 (23.6%) |
| $100,000 to $299,999 | 1,551 (57.8%) | 1,673 (59.7%) |
| $300,000 to $499,999 | 180 (6.7%) | 315 (11.2%) |
| $500,000 to $749,999 | 84 (3.1%) | 64 (2.3%) |
| $750,000 to $999,999 | 61 (2.3%) | 1 (0.0%) |
| $1,000,000 or more | 55 (2.1%) | 0 (0.0%) |
| Total | 2,682 (100.0%) | 2,804 (100.0%) |
Household Income by Mortgage Status in Clayton County
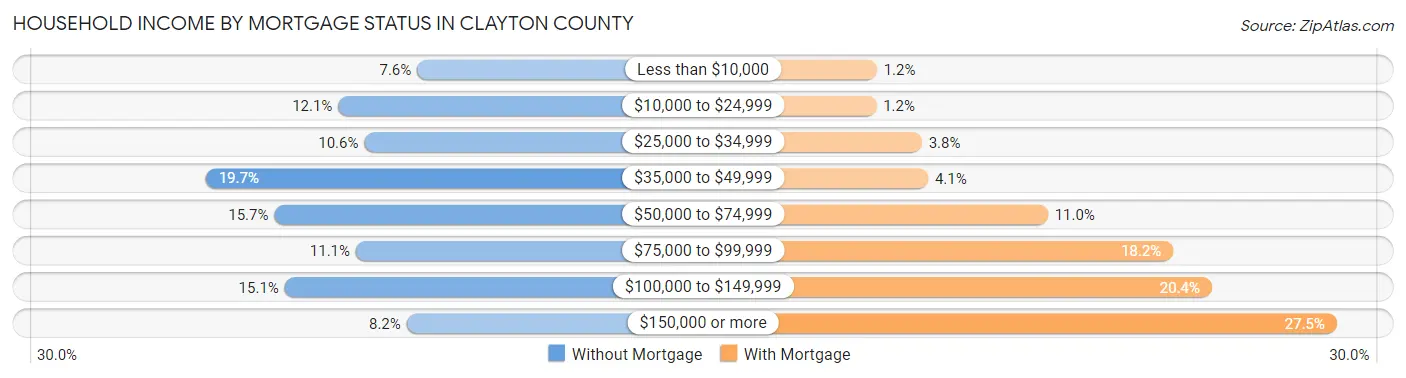
| Household Income | Without Mortgage | With Mortgage |
| Less than $10,000 | 203 (7.6%) | 34 (1.2%) |
| $10,000 to $24,999 | 324 (12.1%) | 33 (1.2%) |
| $25,000 to $34,999 | 284 (10.6%) | 106 (3.8%) |
| $35,000 to $49,999 | 527 (19.7%) | 116 (4.1%) |
| $50,000 to $74,999 | 422 (15.7%) | 308 (11.0%) |
| $75,000 to $99,999 | 297 (11.1%) | 509 (18.1%) |
| $100,000 to $149,999 | 406 (15.1%) | 571 (20.4%) |
| $150,000 or more | 219 (8.2%) | 771 (27.5%) |
| Total | 2,682 (100.0%) | 2,804 (100.0%) |
Property Value to Household Income Ratio in Clayton County
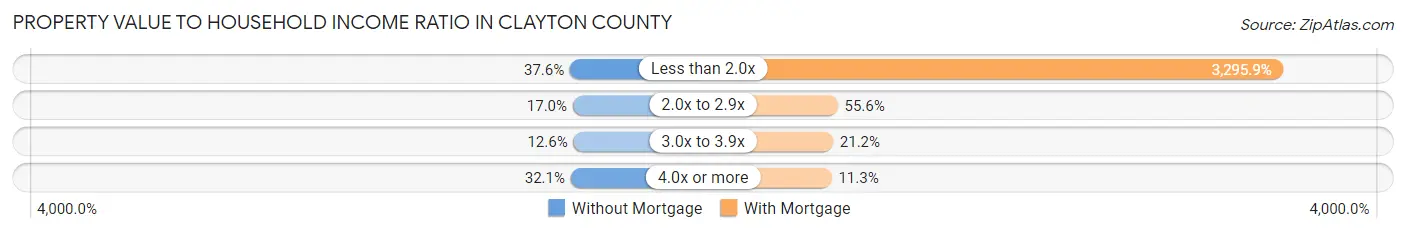
| Value-to-Income Ratio | Without Mortgage | With Mortgage |
| Less than 2.0x | 1,008 (37.6%) | 92,418 (3,295.9%) |
| 2.0x to 2.9x | 457 (17.0%) | 1,558 (55.6%) |
| 3.0x to 3.9x | 339 (12.6%) | 594 (21.2%) |
| 4.0x or more | 860 (32.1%) | 317 (11.3%) |
| Total | 2,682 (100.0%) | 2,804 (100.0%) |
Real Estate Taxes by Mortgage Status in Clayton County
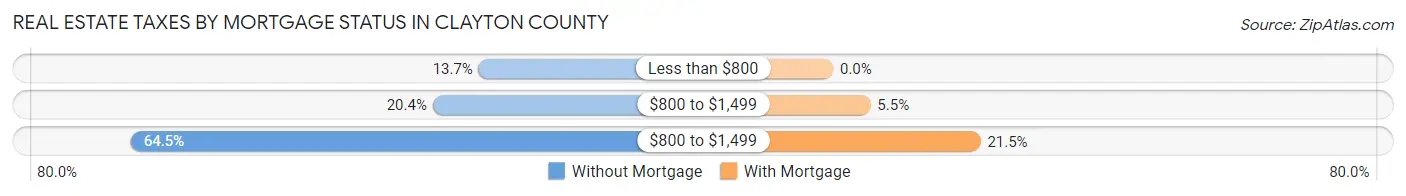
| Property Taxes | Without Mortgage | With Mortgage |
| Less than $800 | 366 (13.7%) | 0 (0.0%) |
| $800 to $1,499 | 546 (20.4%) | 153 (5.5%) |
| $800 to $1,499 | 1,729 (64.5%) | 604 (21.5%) |
| Total | 2,682 (100.0%) | 2,804 (100.0%) |
Health & Disability in Clayton County
Health Insurance Coverage by Age in Clayton County
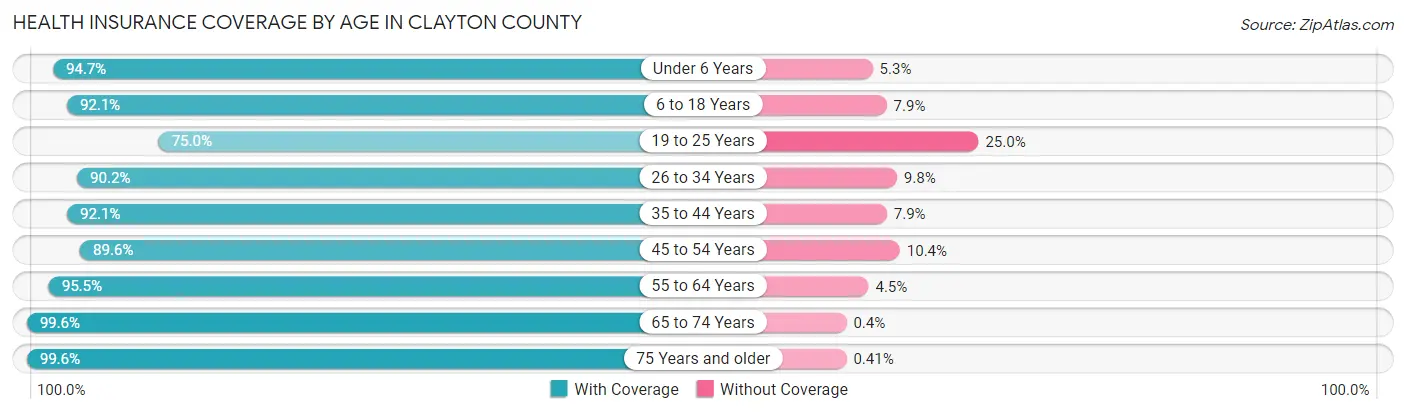
| Age Bracket | With Coverage | Without Coverage |
| Under 6 Years | 1,182 (94.7%) | 66 (5.3%) |
| 6 to 18 Years | 2,319 (92.1%) | 199 (7.9%) |
| 19 to 25 Years | 932 (75.0%) | 311 (25.0%) |
| 26 to 34 Years | 1,388 (90.2%) | 151 (9.8%) |
| 35 to 44 Years | 1,601 (92.1%) | 138 (7.9%) |
| 45 to 54 Years | 1,704 (89.6%) | 197 (10.4%) |
| 55 to 64 Years | 2,641 (95.5%) | 125 (4.5%) |
| 65 to 74 Years | 2,260 (99.6%) | 9 (0.4%) |
| 75 Years and older | 1,695 (99.6%) | 7 (0.4%) |
| Total | 15,722 (92.9%) | 1,203 (7.1%) |
Health Insurance Coverage by Citizenship Status in Clayton County
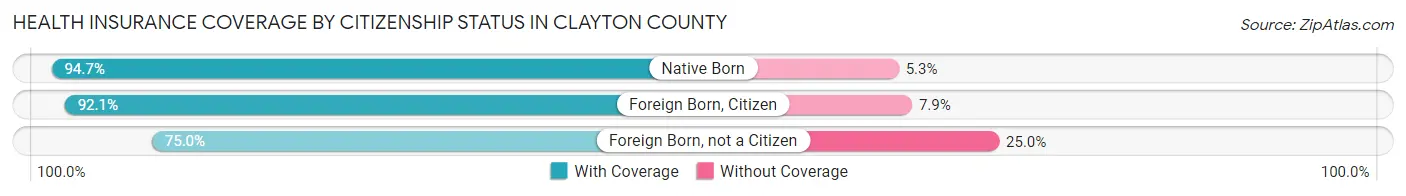
| Citizenship Status | With Coverage | Without Coverage |
| Native Born | 1,182 (94.7%) | 66 (5.3%) |
| Foreign Born, Citizen | 2,319 (92.1%) | 199 (7.9%) |
| Foreign Born, not a Citizen | 932 (75.0%) | 311 (25.0%) |
Health Insurance Coverage by Household Income in Clayton County
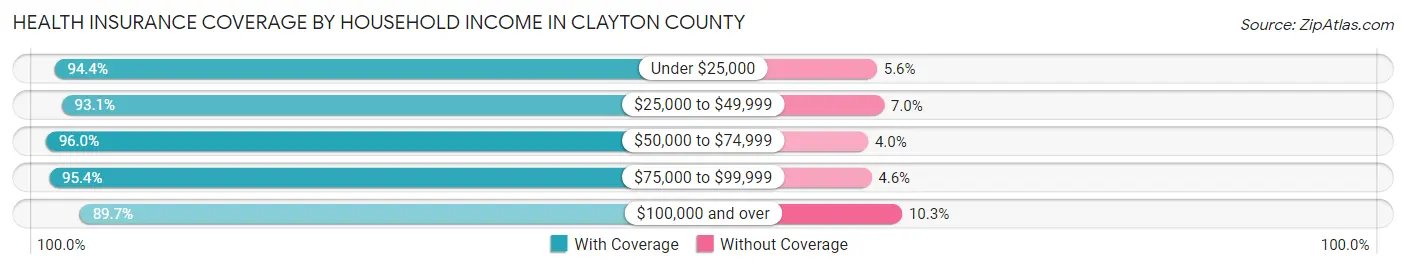
| Household Income | With Coverage | Without Coverage |
| Under $25,000 | 1,563 (94.4%) | 93 (5.6%) |
| $25,000 to $49,999 | 3,309 (93.0%) | 247 (7.0%) |
| $50,000 to $74,999 | 2,563 (96.0%) | 106 (4.0%) |
| $75,000 to $99,999 | 2,802 (95.4%) | 135 (4.6%) |
| $100,000 and over | 5,392 (89.7%) | 622 (10.3%) |
Public vs Private Health Insurance Coverage by Age in Clayton County
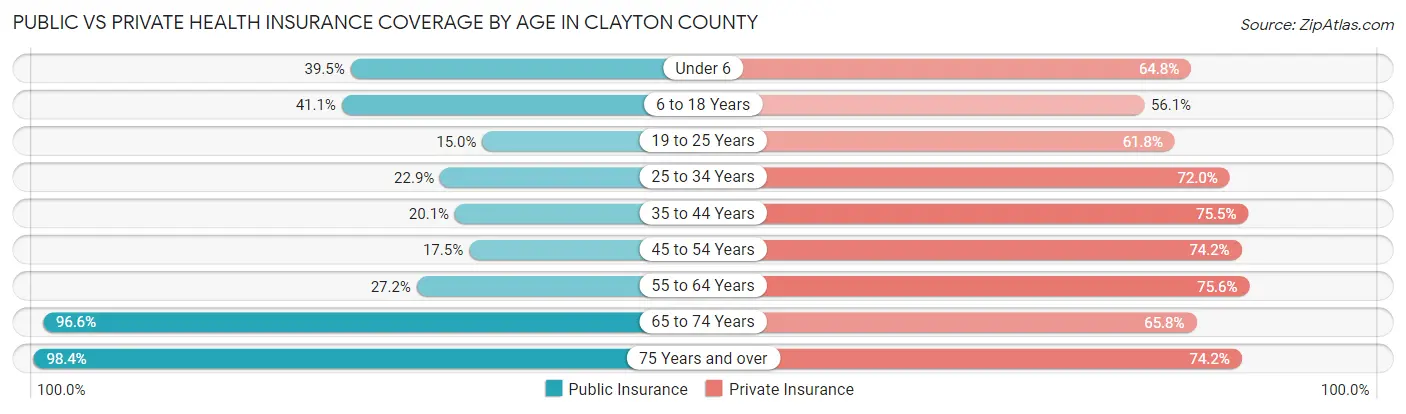
| Age Bracket | Public Insurance | Private Insurance |
| Under 6 | 493 (39.5%) | 809 (64.8%) |
| 6 to 18 Years | 1,036 (41.1%) | 1,412 (56.1%) |
| 19 to 25 Years | 187 (15.0%) | 768 (61.8%) |
| 25 to 34 Years | 352 (22.9%) | 1,108 (72.0%) |
| 35 to 44 Years | 350 (20.1%) | 1,312 (75.4%) |
| 45 to 54 Years | 333 (17.5%) | 1,410 (74.2%) |
| 55 to 64 Years | 753 (27.2%) | 2,092 (75.6%) |
| 65 to 74 Years | 2,192 (96.6%) | 1,493 (65.8%) |
| 75 Years and over | 1,674 (98.4%) | 1,263 (74.2%) |
| Total | 7,370 (43.5%) | 11,667 (68.9%) |
Disability Status by Sex by Age in Clayton County
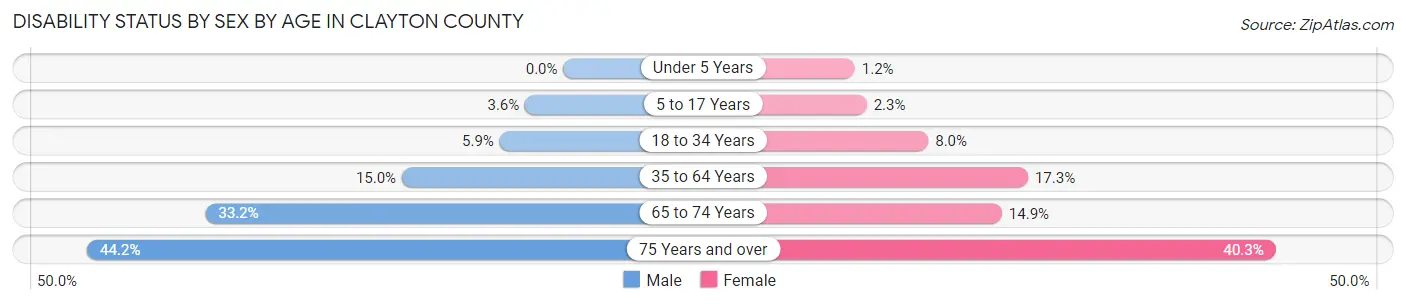
| Age Bracket | Male | Female |
| Under 5 Years | 0 (0.0%) | 6 (1.2%) |
| 5 to 17 Years | 49 (3.5%) | 30 (2.3%) |
| 18 to 34 Years | 88 (5.9%) | 113 (8.0%) |
| 35 to 64 Years | 496 (15.0%) | 535 (17.3%) |
| 65 to 74 Years | 385 (33.2%) | 165 (14.9%) |
| 75 Years and over | 335 (44.2%) | 380 (40.3%) |
Disability Class by Sex by Age in Clayton County
Disability Class: Hearing Difficulty
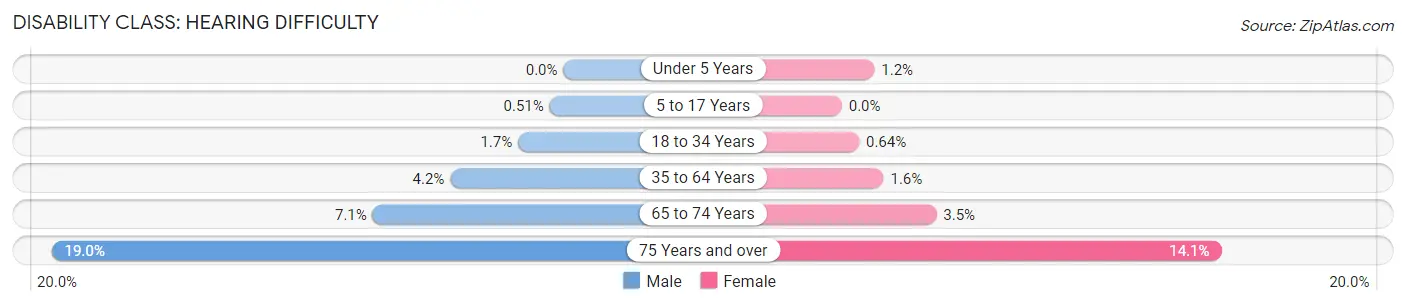
| Age Bracket | Male | Female |
| Under 5 Years | 0 (0.0%) | 6 (1.2%) |
| 5 to 17 Years | 7 (0.5%) | 0 (0.0%) |
| 18 to 34 Years | 25 (1.7%) | 9 (0.6%) |
| 35 to 64 Years | 139 (4.2%) | 48 (1.5%) |
| 65 to 74 Years | 82 (7.1%) | 39 (3.5%) |
| 75 Years and over | 144 (19.0%) | 133 (14.1%) |
Disability Class: Vision Difficulty
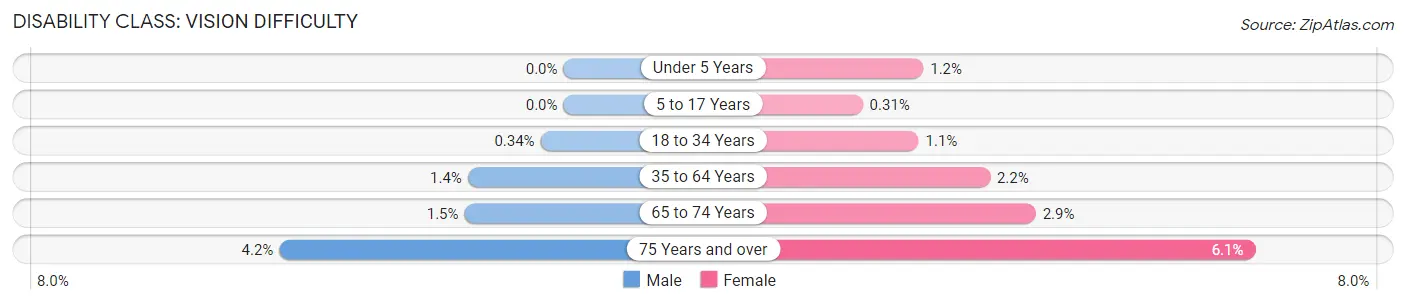
| Age Bracket | Male | Female |
| Under 5 Years | 0 (0.0%) | 6 (1.2%) |
| 5 to 17 Years | 0 (0.0%) | 4 (0.3%) |
| 18 to 34 Years | 5 (0.3%) | 16 (1.1%) |
| 35 to 64 Years | 47 (1.4%) | 68 (2.2%) |
| 65 to 74 Years | 17 (1.5%) | 32 (2.9%) |
| 75 Years and over | 32 (4.2%) | 58 (6.1%) |
Disability Class: Cognitive Difficulty
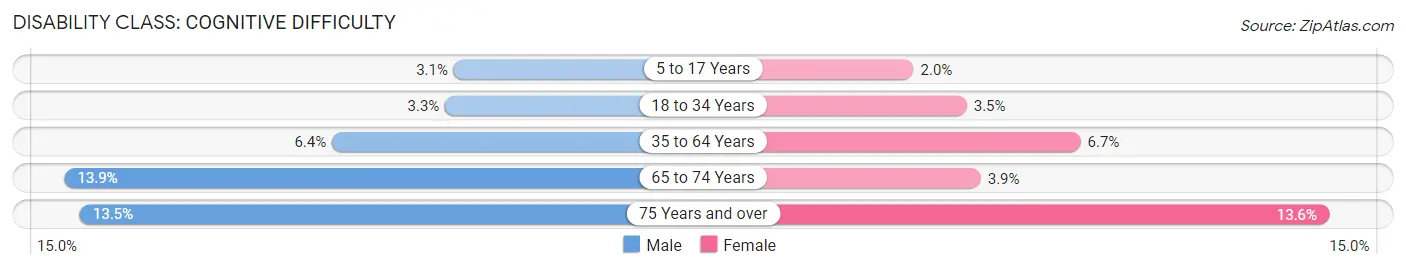
| Age Bracket | Male | Female |
| 5 to 17 Years | 42 (3.0%) | 26 (2.0%) |
| 18 to 34 Years | 49 (3.3%) | 49 (3.5%) |
| 35 to 64 Years | 213 (6.4%) | 206 (6.7%) |
| 65 to 74 Years | 161 (13.9%) | 43 (3.9%) |
| 75 Years and over | 102 (13.5%) | 128 (13.6%) |
Disability Class: Ambulatory Difficulty
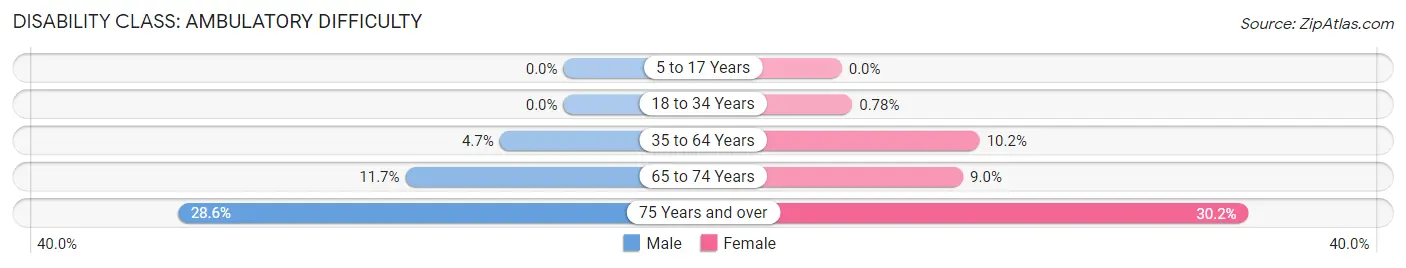
| Age Bracket | Male | Female |
| 5 to 17 Years | 0 (0.0%) | 0 (0.0%) |
| 18 to 34 Years | 0 (0.0%) | 11 (0.8%) |
| 35 to 64 Years | 157 (4.7%) | 317 (10.2%) |
| 65 to 74 Years | 136 (11.7%) | 100 (9.0%) |
| 75 Years and over | 217 (28.6%) | 285 (30.2%) |
Disability Class: Self-Care Difficulty
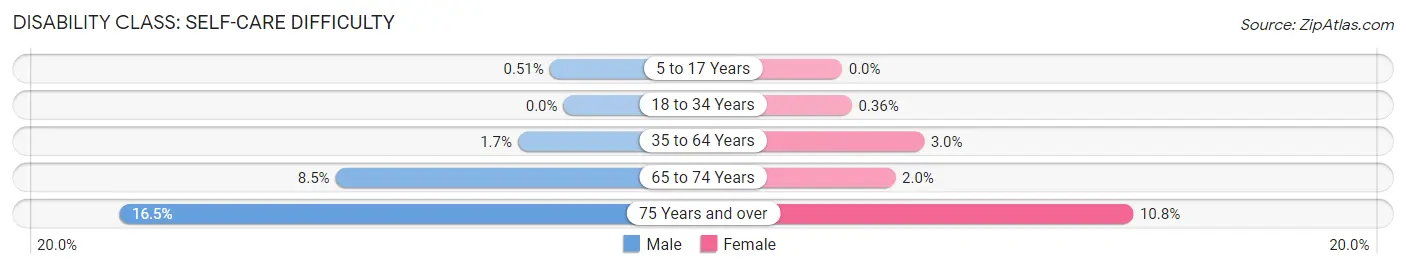
| Age Bracket | Male | Female |
| 5 to 17 Years | 7 (0.5%) | 0 (0.0%) |
| 18 to 34 Years | 0 (0.0%) | 5 (0.4%) |
| 35 to 64 Years | 56 (1.7%) | 94 (3.0%) |
| 65 to 74 Years | 98 (8.5%) | 22 (2.0%) |
| 75 Years and over | 125 (16.5%) | 102 (10.8%) |
Technology Access in Clayton County
Computing Device Access in Clayton County
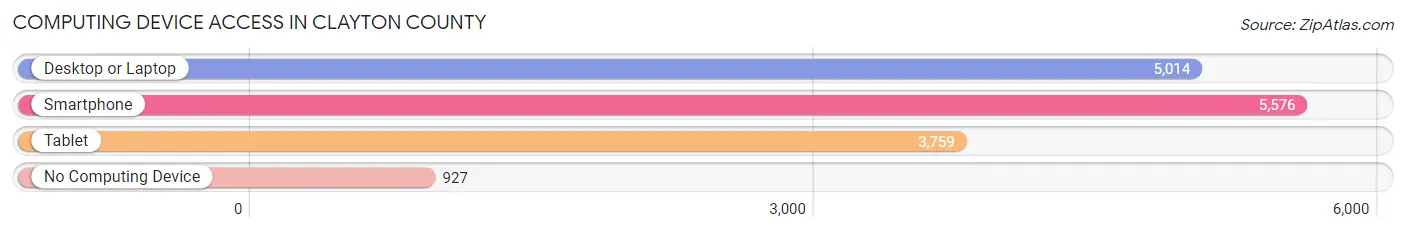
| Device Type | # Households | % Households |
| Desktop or Laptop | 5,014 | 68.8% |
| Smartphone | 5,576 | 76.5% |
| Tablet | 3,759 | 51.6% |
| No Computing Device | 927 | 12.7% |
| Total | 7,286 | 100.0% |
Internet Access in Clayton County
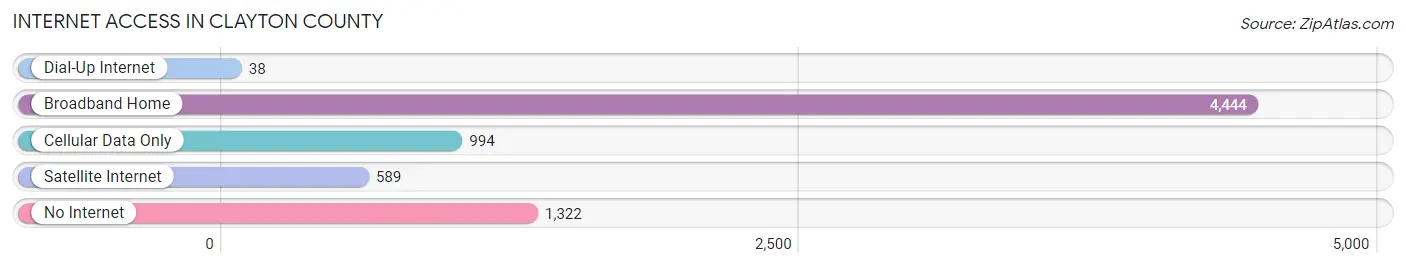
| Internet Type | # Households | % Households |
| Dial-Up Internet | 38 | 0.5% |
| Broadband Home | 4,444 | 61.0% |
| Cellular Data Only | 994 | 13.6% |
| Satellite Internet | 589 | 8.1% |
| No Internet | 1,322 | 18.1% |
| Total | 7,286 | 100.0% |
Clayton County Summary
Clayton County, Iowa is located in the northeastern corner of the state, bordered by Minnesota to the north and Wisconsin to the east. It is part of the Dubuque, Iowa Metropolitan Statistical Area and is the smallest county in the state by area. The county seat is Elkader, and the largest city is Guttenberg.
History
Clayton County was established in 1837 and was named after John M. Clayton, a prominent lawyer and politician from Delaware. The county was originally part of Dubuque County, but was split off in 1837. The first settlers arrived in the area in the early 1830s, and the county was officially organized in 1837.
The county was largely agricultural in its early years, with the main crops being wheat, corn, oats, and hay. The county also had a thriving lumber industry, with several sawmills located in the area.
Geography
Clayton County is located in the northeastern corner of Iowa, bordered by Minnesota to the north and Wisconsin to the east. It is the smallest county in the state by area, with a total area of 437 square miles. The county is mostly rural, with rolling hills and valleys. The Turkey River runs through the county, and there are several small lakes and ponds scattered throughout the area.
The county is part of the Driftless Area, a region of the Midwest that was not glaciated during the last ice age. This has resulted in a unique landscape, with steep hills and deep valleys.
Economy
Clayton County has a diverse economy, with a mix of agriculture, manufacturing, and tourism. The county is home to several large employers, including John Deere, Tyson Foods, and Hormel Foods. Agriculture is still a major part of the economy, with corn, soybeans, and hay being the main crops.
The county also has a thriving tourism industry, with several popular attractions, including the National Mississippi River Museum and Aquarium, the Effigy Mounds National Monument, and the Elkader Opera House.
Demographics
As of the 2010 census, Clayton County had a population of 18,129. The population is mostly white (96.2%), with small percentages of African American (1.2%), Native American (0.5%), Asian (0.4%), and Hispanic (1.7%) residents. The median household income is $50,945, and the median home value is $128,400.
The county is largely rural, with most of the population living in small towns and villages. The largest city is Guttenberg, with a population of 2,717. Other notable towns include Elkader (population 1,273), Monona (population 1,093), and Strawberry Point (population 890).
Conclusion
Clayton County, Iowa is a small, rural county located in the northeastern corner of the state. It has a diverse economy, with a mix of agriculture, manufacturing, and tourism. The population is mostly white, with a median household income of $50,945 and a median home value of $128,400. The county is home to several popular attractions, including the National Mississippi River Museum and Aquarium, the Effigy Mounds National Monument, and the Elkader Opera House.
Common Questions
What is Per Capita Income in Clayton County?
Per Capita income in Clayton County is $34,394.
What is the Median Family Income in Clayton County?
Median Family Income in Clayton County is $79,698.
What is the Median Household income in Clayton County?
Median Household Income in Clayton County is $60,441.
What is Income or Wage Gap in Clayton County?
Income or Wage Gap in Clayton County is 36.4%.
Women in Clayton County earn 63.6 cents for every dollar earned by a man.
What is Family Income Deficit in Clayton County?
Family Income Deficit in Clayton County is $8,293.
Families that are below poverty line in Clayton County earn $8,293 less on average than the poverty threshold level.
What is Inequality or Gini Index in Clayton County?
Inequality or Gini Index in Clayton County is 0.43.
What is the Total Population of Clayton County?
Total Population of Clayton County is 17,123.
What is the Total Male Population of Clayton County?
Total Male Population of Clayton County is 8,663.
What is the Total Female Population of Clayton County?
Total Female Population of Clayton County is 8,460.
What is the Ratio of Males per 100 Females in Clayton County?
There are 102.40 Males per 100 Females in Clayton County.
What is the Ratio of Females per 100 Males in Clayton County?
There are 97.66 Females per 100 Males in Clayton County.
What is the Median Population Age in Clayton County?
Median Population Age in Clayton County is 46.9 Years.
What is the Average Family Size in Clayton County
Average Family Size in Clayton County is 2.9 People.
What is the Average Household Size in Clayton County
Average Household Size in Clayton County is 2.3 People.
How Large is the Labor Force in Clayton County?
There are 8,846 People in the Labor Forcein in Clayton County.
What is the Percentage of People in the Labor Force in Clayton County?
63.5% of People are in the Labor Force in Clayton County.
What is the Unemployment Rate in Clayton County?
Unemployment Rate in Clayton County is 2.6%.