Italian vs Immigrants from Sudan Self-Care Disability
COMPARE
Italian
Immigrants from Sudan
Self-Care Disability
Self-Care Disability Comparison
Italians
Immigrants from Sudan
2.4%
SELF-CARE DISABILITY
72.2/ 100
METRIC RATING
154th/ 347
METRIC RANK
2.3%
SELF-CARE DISABILITY
99.8/ 100
METRIC RATING
41st/ 347
METRIC RANK
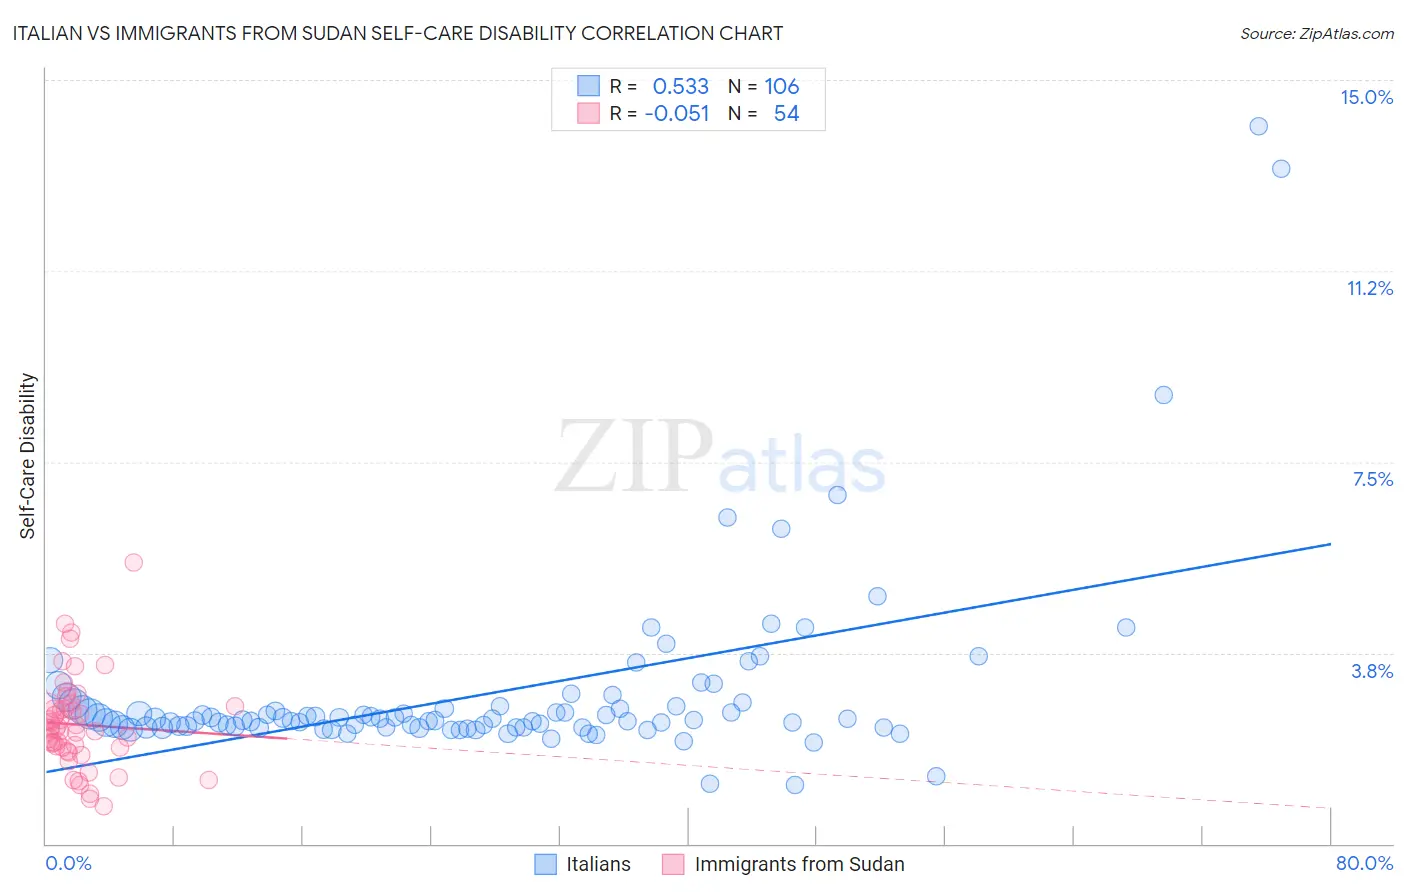
Italian vs Immigrants from Sudan Self-Care Disability Correlation Chart
The statistical analysis conducted on geographies consisting of 572,484,313 people shows a substantial positive correlation between the proportion of Italians and percentage of population with self-care disability in the United States with a correlation coefficient (R) of 0.533 and weighted average of 2.4%. Similarly, the statistical analysis conducted on geographies consisting of 118,937,078 people shows a slight negative correlation between the proportion of Immigrants from Sudan and percentage of population with self-care disability in the United States with a correlation coefficient (R) of -0.051 and weighted average of 2.3%, a difference of 7.0%.
Self-Care Disability Correlation Summary
| Measurement | Italian | Immigrants from Sudan |
| Minimum | 1.2% | 0.73% |
| Maximum | 14.1% | 5.5% |
| Range | 12.9% | 4.8% |
| Mean | 3.0% | 2.3% |
| Median | 2.4% | 2.2% |
| Interquartile 25% (IQ1) | 2.3% | 1.9% |
| Interquartile 75% (IQ3) | 2.7% | 2.6% |
| Interquartile Range (IQR) | 0.40% | 0.77% |
| Standard Deviation (Sample) | 1.8% | 0.91% |
| Standard Deviation (Population) | 1.8% | 0.90% |
Similar Demographics by Self-Care Disability
Demographics Similar to Italians by Self-Care Disability
In terms of self-care disability, the demographic groups most similar to Italians are Pakistani (2.4%, a difference of 0.050%), Tlingit-Haida (2.4%, a difference of 0.080%), Immigrants from England (2.4%, a difference of 0.080%), Nigerian (2.4%, a difference of 0.090%), and Basque (2.4%, a difference of 0.11%).
| Demographics | Rating | Rank | Self-Care Disability |
| Dutch | 77.5 /100 | #147 | Good 2.4% |
| Romanians | 75.8 /100 | #148 | Good 2.4% |
| Arabs | 75.7 /100 | #149 | Good 2.4% |
| Immigrants | Costa Rica | 75.1 /100 | #150 | Good 2.4% |
| Basques | 74.0 /100 | #151 | Good 2.4% |
| Tlingit-Haida | 73.5 /100 | #152 | Good 2.4% |
| Immigrants | England | 73.5 /100 | #153 | Good 2.4% |
| Italians | 72.2 /100 | #154 | Good 2.4% |
| Pakistanis | 71.4 /100 | #155 | Good 2.4% |
| Nigerians | 70.6 /100 | #156 | Good 2.4% |
| Immigrants | Europe | 69.6 /100 | #157 | Good 2.4% |
| Immigrants | Western Europe | 68.6 /100 | #158 | Good 2.4% |
| Immigrants | Italy | 68.5 /100 | #159 | Good 2.4% |
| Finns | 67.0 /100 | #160 | Good 2.4% |
| Lebanese | 66.5 /100 | #161 | Good 2.4% |
Demographics Similar to Immigrants from Sudan by Self-Care Disability
In terms of self-care disability, the demographic groups most similar to Immigrants from Sudan are Iranian (2.3%, a difference of 0.070%), Immigrants from Uganda (2.3%, a difference of 0.10%), Immigrants from Bulgaria (2.3%, a difference of 0.11%), Immigrants from Pakistan (2.3%, a difference of 0.14%), and Immigrants from South Africa (2.3%, a difference of 0.19%).
| Demographics | Rating | Rank | Self-Care Disability |
| Immigrants | Turkey | 99.9 /100 | #34 | Exceptional 2.3% |
| Immigrants | Australia | 99.9 /100 | #35 | Exceptional 2.3% |
| Immigrants | Lithuania | 99.9 /100 | #36 | Exceptional 2.3% |
| Immigrants | Sweden | 99.9 /100 | #37 | Exceptional 2.3% |
| Immigrants | Eastern Africa | 99.9 /100 | #38 | Exceptional 2.3% |
| Immigrants | Bulgaria | 99.8 /100 | #39 | Exceptional 2.3% |
| Iranians | 99.8 /100 | #40 | Exceptional 2.3% |
| Immigrants | Sudan | 99.8 /100 | #41 | Exceptional 2.3% |
| Immigrants | Uganda | 99.8 /100 | #42 | Exceptional 2.3% |
| Immigrants | Pakistan | 99.8 /100 | #43 | Exceptional 2.3% |
| Immigrants | South Africa | 99.8 /100 | #44 | Exceptional 2.3% |
| Norwegians | 99.8 /100 | #45 | Exceptional 2.3% |
| Czechs | 99.8 /100 | #46 | Exceptional 2.3% |
| Jordanians | 99.7 /100 | #47 | Exceptional 2.3% |
| Immigrants | Malaysia | 99.7 /100 | #48 | Exceptional 2.3% |