Italian vs Bermudan Self-Care Disability
COMPARE
Italian
Bermudan
Self-Care Disability
Self-Care Disability Comparison
Italians
Bermudans
2.4%
SELF-CARE DISABILITY
72.2/ 100
METRIC RATING
154th/ 347
METRIC RANK
2.6%
SELF-CARE DISABILITY
1.9/ 100
METRIC RATING
236th/ 347
METRIC RANK
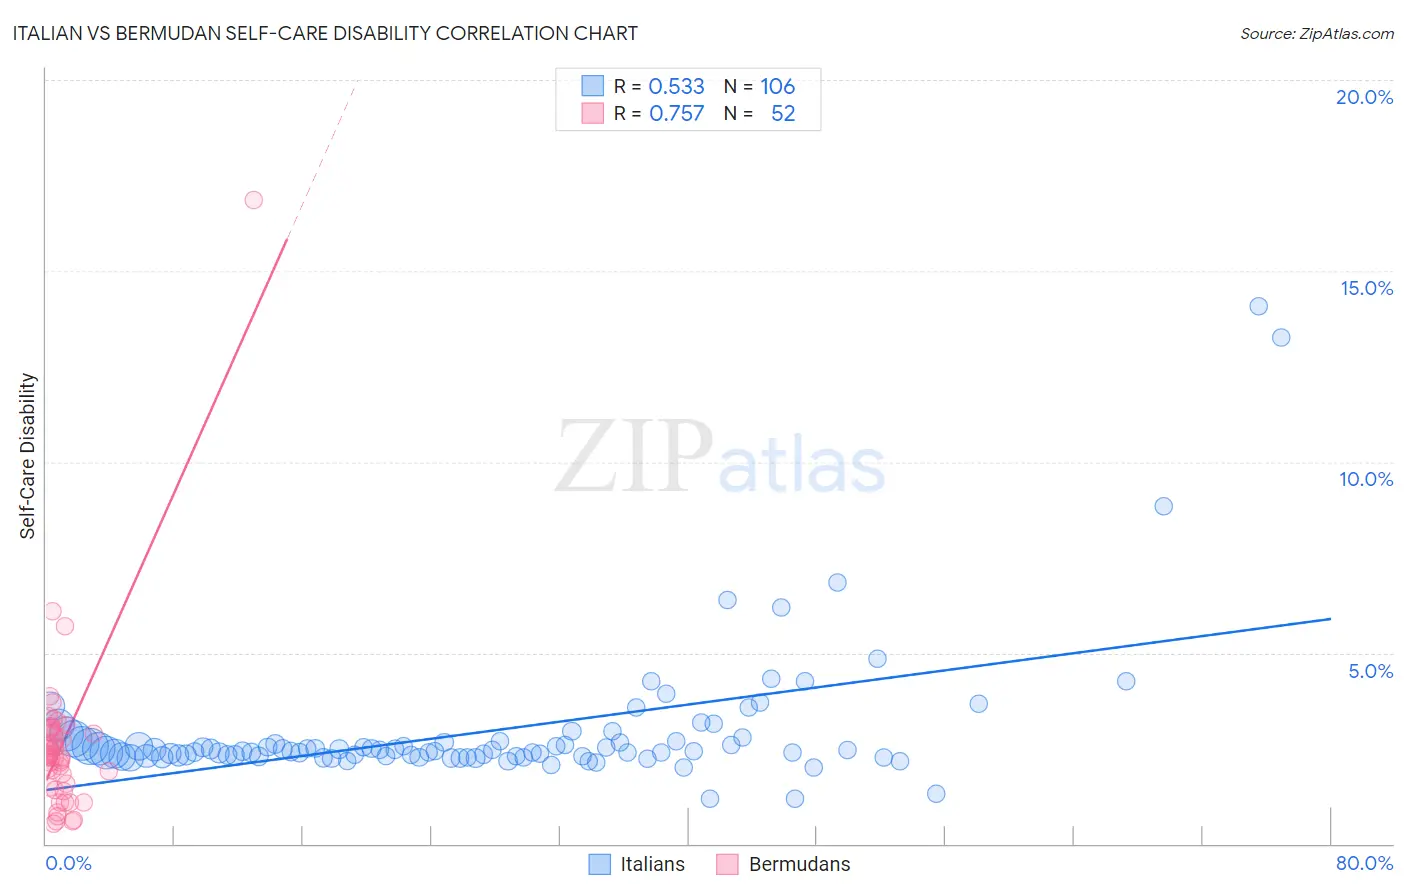
Italian vs Bermudan Self-Care Disability Correlation Chart
The statistical analysis conducted on geographies consisting of 572,484,313 people shows a substantial positive correlation between the proportion of Italians and percentage of population with self-care disability in the United States with a correlation coefficient (R) of 0.533 and weighted average of 2.4%. Similarly, the statistical analysis conducted on geographies consisting of 55,721,549 people shows a strong positive correlation between the proportion of Bermudans and percentage of population with self-care disability in the United States with a correlation coefficient (R) of 0.757 and weighted average of 2.6%, a difference of 5.9%.
Self-Care Disability Correlation Summary
| Measurement | Italian | Bermudan |
| Minimum | 1.2% | 0.52% |
| Maximum | 14.1% | 16.9% |
| Range | 12.9% | 16.3% |
| Mean | 3.0% | 2.6% |
| Median | 2.4% | 2.3% |
| Interquartile 25% (IQ1) | 2.3% | 1.5% |
| Interquartile 75% (IQ3) | 2.7% | 2.9% |
| Interquartile Range (IQR) | 0.40% | 1.4% |
| Standard Deviation (Sample) | 1.8% | 2.3% |
| Standard Deviation (Population) | 1.8% | 2.3% |
Similar Demographics by Self-Care Disability
Demographics Similar to Italians by Self-Care Disability
In terms of self-care disability, the demographic groups most similar to Italians are Pakistani (2.4%, a difference of 0.050%), Tlingit-Haida (2.4%, a difference of 0.080%), Immigrants from England (2.4%, a difference of 0.080%), Nigerian (2.4%, a difference of 0.090%), and Basque (2.4%, a difference of 0.11%).
| Demographics | Rating | Rank | Self-Care Disability |
| Dutch | 77.5 /100 | #147 | Good 2.4% |
| Romanians | 75.8 /100 | #148 | Good 2.4% |
| Arabs | 75.7 /100 | #149 | Good 2.4% |
| Immigrants | Costa Rica | 75.1 /100 | #150 | Good 2.4% |
| Basques | 74.0 /100 | #151 | Good 2.4% |
| Tlingit-Haida | 73.5 /100 | #152 | Good 2.4% |
| Immigrants | England | 73.5 /100 | #153 | Good 2.4% |
| Italians | 72.2 /100 | #154 | Good 2.4% |
| Pakistanis | 71.4 /100 | #155 | Good 2.4% |
| Nigerians | 70.6 /100 | #156 | Good 2.4% |
| Immigrants | Europe | 69.6 /100 | #157 | Good 2.4% |
| Immigrants | Western Europe | 68.6 /100 | #158 | Good 2.4% |
| Immigrants | Italy | 68.5 /100 | #159 | Good 2.4% |
| Finns | 67.0 /100 | #160 | Good 2.4% |
| Lebanese | 66.5 /100 | #161 | Good 2.4% |
Demographics Similar to Bermudans by Self-Care Disability
In terms of self-care disability, the demographic groups most similar to Bermudans are Bahamian (2.6%, a difference of 0.070%), Vietnamese (2.6%, a difference of 0.10%), Liberian (2.6%, a difference of 0.11%), Albanian (2.6%, a difference of 0.15%), and Immigrants from Guatemala (2.6%, a difference of 0.18%).
| Demographics | Rating | Rank | Self-Care Disability |
| Guamanians/Chamorros | 2.5 /100 | #229 | Tragic 2.6% |
| Immigrants | Ecuador | 2.5 /100 | #230 | Tragic 2.6% |
| Immigrants | Guatemala | 2.2 /100 | #231 | Tragic 2.6% |
| Albanians | 2.2 /100 | #232 | Tragic 2.6% |
| Liberians | 2.1 /100 | #233 | Tragic 2.6% |
| Vietnamese | 2.1 /100 | #234 | Tragic 2.6% |
| Bahamians | 2.0 /100 | #235 | Tragic 2.6% |
| Bermudans | 1.9 /100 | #236 | Tragic 2.6% |
| Immigrants | Senegal | 1.6 /100 | #237 | Tragic 2.6% |
| Senegalese | 1.3 /100 | #238 | Tragic 2.6% |
| Immigrants | Panama | 1.2 /100 | #239 | Tragic 2.6% |
| Marshallese | 1.2 /100 | #240 | Tragic 2.6% |
| Immigrants | Syria | 1.0 /100 | #241 | Tragic 2.6% |
| Spanish | 0.8 /100 | #242 | Tragic 2.6% |
| Hawaiians | 0.8 /100 | #243 | Tragic 2.6% |