Italian vs South American Indian Self-Care Disability
COMPARE
Italian
South American Indian
Self-Care Disability
Self-Care Disability Comparison
Italians
South American Indians
2.4%
SELF-CARE DISABILITY
72.2/ 100
METRIC RATING
154th/ 347
METRIC RANK
2.4%
SELF-CARE DISABILITY
87.2/ 100
METRIC RATING
136th/ 347
METRIC RANK
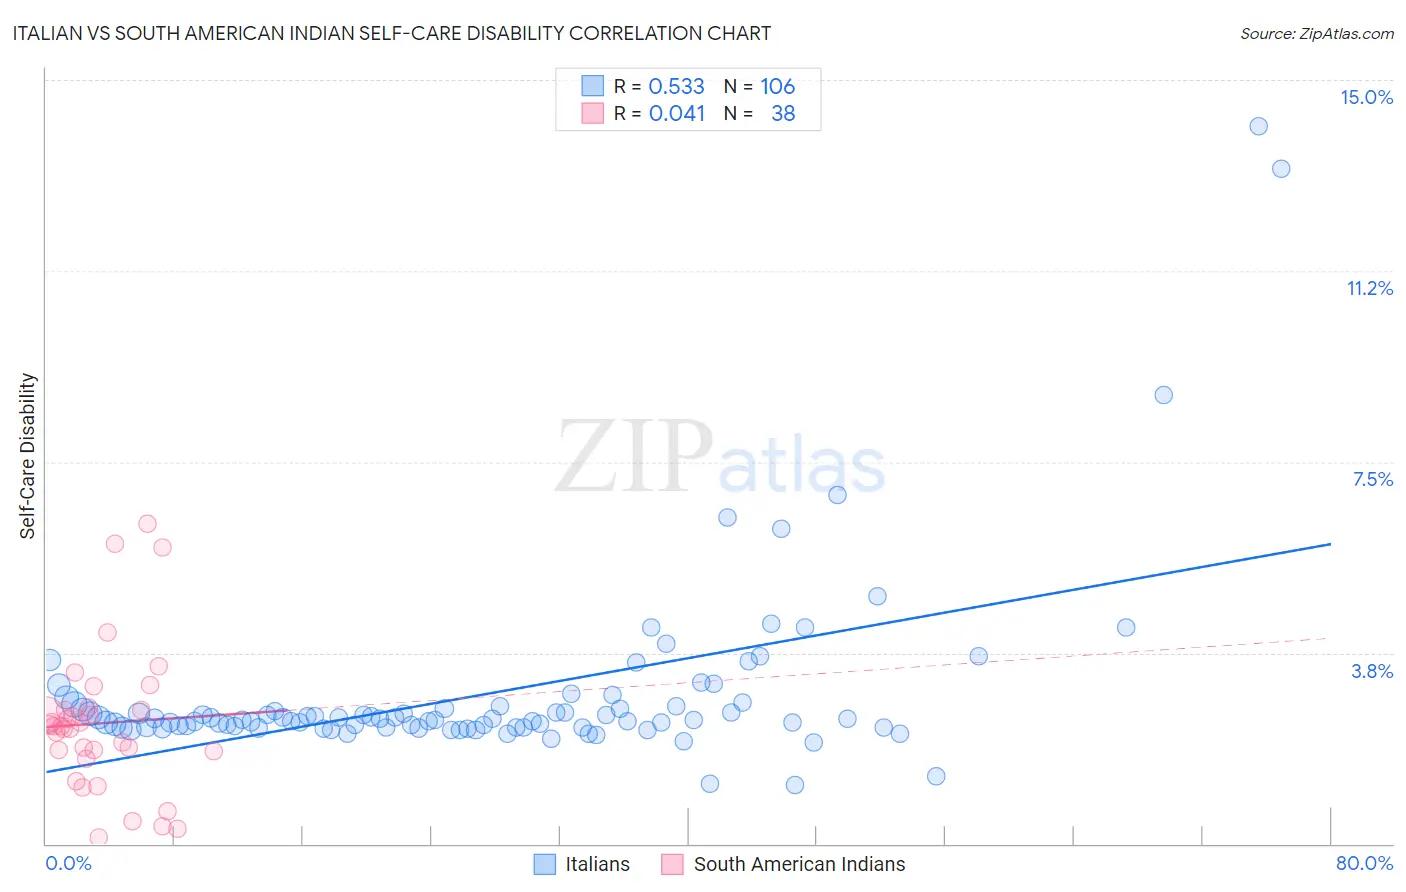
Italian vs South American Indian Self-Care Disability Correlation Chart
The statistical analysis conducted on geographies consisting of 572,484,313 people shows a substantial positive correlation between the proportion of Italians and percentage of population with self-care disability in the United States with a correlation coefficient (R) of 0.533 and weighted average of 2.4%. Similarly, the statistical analysis conducted on geographies consisting of 164,517,360 people shows no correlation between the proportion of South American Indians and percentage of population with self-care disability in the United States with a correlation coefficient (R) of 0.041 and weighted average of 2.4%, a difference of 1.2%.
Self-Care Disability Correlation Summary
| Measurement | Italian | South American Indian |
| Minimum | 1.2% | 0.11% |
| Maximum | 14.1% | 6.3% |
| Range | 12.9% | 6.2% |
| Mean | 3.0% | 2.4% |
| Median | 2.4% | 2.3% |
| Interquartile 25% (IQ1) | 2.3% | 1.8% |
| Interquartile 75% (IQ3) | 2.7% | 2.6% |
| Interquartile Range (IQR) | 0.40% | 0.81% |
| Standard Deviation (Sample) | 1.8% | 1.4% |
| Standard Deviation (Population) | 1.8% | 1.4% |
Demographics Similar to Italians and South American Indians by Self-Care Disability
In terms of self-care disability, the demographic groups most similar to Italians are Pakistani (2.4%, a difference of 0.050%), Tlingit-Haida (2.4%, a difference of 0.080%), Immigrants from England (2.4%, a difference of 0.080%), Basque (2.4%, a difference of 0.11%), and Immigrants from Costa Rica (2.4%, a difference of 0.18%). Similarly, the demographic groups most similar to South American Indians are Austrian (2.4%, a difference of 0.020%), Laotian (2.4%, a difference of 0.070%), Immigrants from Croatia (2.4%, a difference of 0.070%), Sri Lankan (2.4%, a difference of 0.070%), and Immigrants from Uruguay (2.4%, a difference of 0.19%).
| Demographics | Rating | Rank | Self-Care Disability |
| Laotians | 87.8 /100 | #135 | Excellent 2.4% |
| South American Indians | 87.2 /100 | #136 | Excellent 2.4% |
| Austrians | 87.0 /100 | #137 | Excellent 2.4% |
| Immigrants | Croatia | 86.6 /100 | #138 | Excellent 2.4% |
| Sri Lankans | 86.6 /100 | #139 | Excellent 2.4% |
| Immigrants | Uruguay | 85.4 /100 | #140 | Excellent 2.4% |
| Alaska Natives | 84.5 /100 | #141 | Excellent 2.4% |
| Immigrants | Peru | 83.2 /100 | #142 | Excellent 2.4% |
| Afghans | 82.3 /100 | #143 | Excellent 2.4% |
| Costa Ricans | 80.8 /100 | #144 | Excellent 2.4% |
| Germans | 80.1 /100 | #145 | Excellent 2.4% |
| Israelis | 80.0 /100 | #146 | Good 2.4% |
| Dutch | 77.5 /100 | #147 | Good 2.4% |
| Romanians | 75.8 /100 | #148 | Good 2.4% |
| Arabs | 75.7 /100 | #149 | Good 2.4% |
| Immigrants | Costa Rica | 75.1 /100 | #150 | Good 2.4% |
| Basques | 74.0 /100 | #151 | Good 2.4% |
| Tlingit-Haida | 73.5 /100 | #152 | Good 2.4% |
| Immigrants | England | 73.5 /100 | #153 | Good 2.4% |
| Italians | 72.2 /100 | #154 | Good 2.4% |
| Pakistanis | 71.4 /100 | #155 | Good 2.4% |