Immigrants from Latin America vs Navajo Disability Age 5 to 17
COMPARE
Immigrants from Latin America
Navajo
Disability Age 5 to 17
Disability Age 5 to 17 Comparison
Immigrants from Latin America
Navajo
5.6%
DISABILITY AGE 5 TO 17
34.3/ 100
METRIC RATING
183rd/ 347
METRIC RANK
5.4%
DISABILITY AGE 5 TO 17
90.9/ 100
METRIC RATING
137th/ 347
METRIC RANK
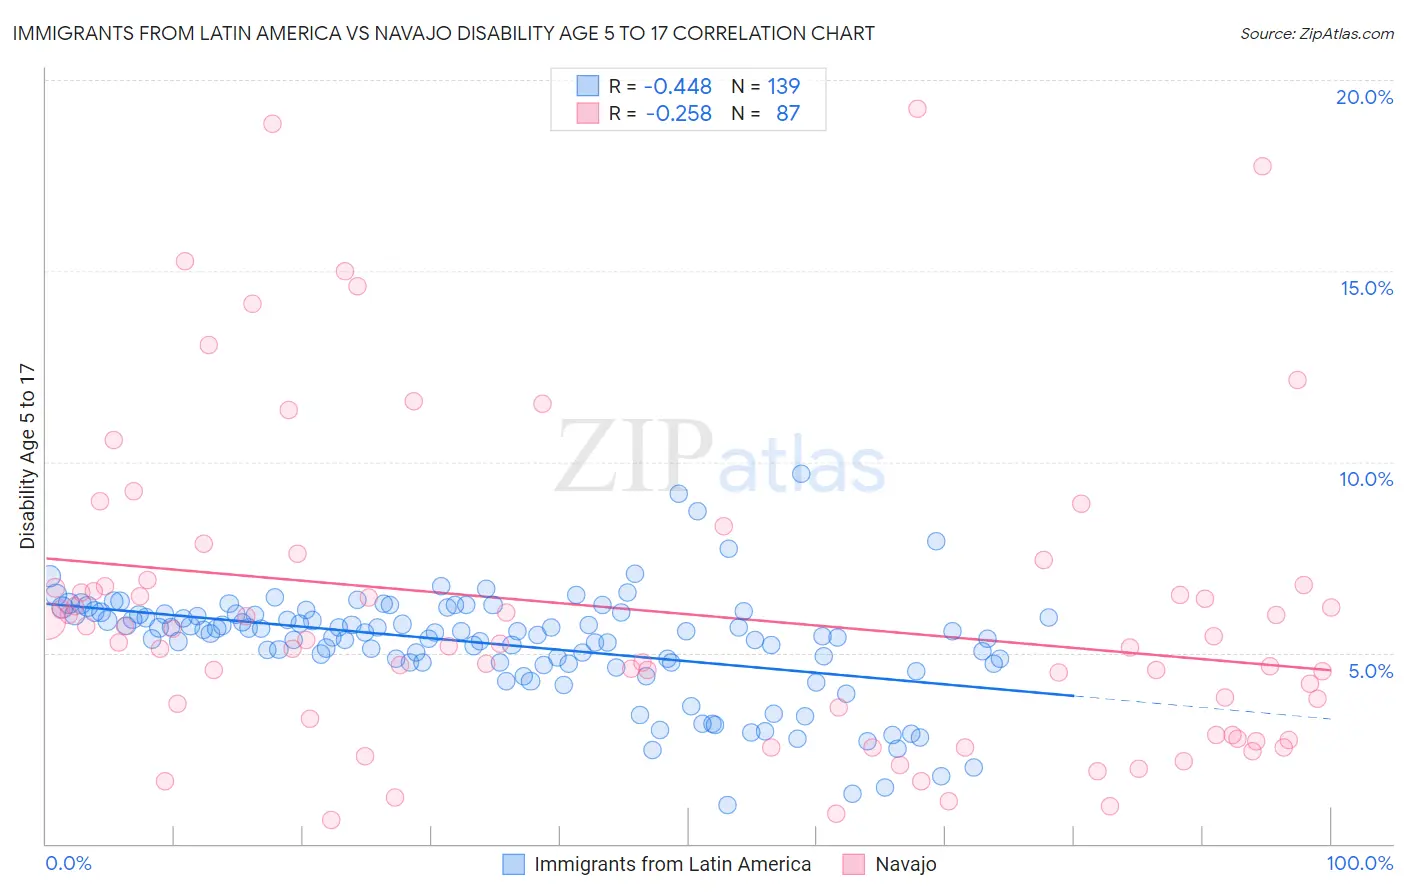
Immigrants from Latin America vs Navajo Disability Age 5 to 17 Correlation Chart
The statistical analysis conducted on geographies consisting of 547,403,428 people shows a moderate negative correlation between the proportion of Immigrants from Latin America and percentage of population with a disability between the ages 5 and 17 in the United States with a correlation coefficient (R) of -0.448 and weighted average of 5.6%. Similarly, the statistical analysis conducted on geographies consisting of 223,670,452 people shows a weak negative correlation between the proportion of Navajo and percentage of population with a disability between the ages 5 and 17 in the United States with a correlation coefficient (R) of -0.258 and weighted average of 5.4%, a difference of 3.7%.
Disability Age 5 to 17 Correlation Summary
| Measurement | Immigrants from Latin America | Navajo |
| Minimum | 1.0% | 0.63% |
| Maximum | 9.7% | 19.3% |
| Range | 8.7% | 18.6% |
| Mean | 5.2% | 6.1% |
| Median | 5.5% | 5.3% |
| Interquartile 25% (IQ1) | 4.7% | 2.8% |
| Interquartile 75% (IQ3) | 6.0% | 6.8% |
| Interquartile Range (IQR) | 1.3% | 3.9% |
| Standard Deviation (Sample) | 1.4% | 4.1% |
| Standard Deviation (Population) | 1.4% | 4.1% |
Similar Demographics by Disability Age 5 to 17
Demographics Similar to Immigrants from Latin America by Disability Age 5 to 17
In terms of disability age 5 to 17, the demographic groups most similar to Immigrants from Latin America are Syrian (5.6%, a difference of 0.020%), Immigrants from Mexico (5.6%, a difference of 0.030%), Mexican American Indian (5.6%, a difference of 0.050%), Immigrants from England (5.6%, a difference of 0.11%), and Fijian (5.7%, a difference of 0.14%).
| Demographics | Rating | Rank | Disability Age 5 to 17 |
| Immigrants | Central America | 49.4 /100 | #176 | Average 5.6% |
| Immigrants | Western Europe | 47.8 /100 | #177 | Average 5.6% |
| Immigrants | Trinidad and Tobago | 47.6 /100 | #178 | Average 5.6% |
| Immigrants | Barbados | 40.5 /100 | #179 | Average 5.6% |
| Immigrants | Uruguay | 37.7 /100 | #180 | Fair 5.6% |
| Immigrants | England | 36.4 /100 | #181 | Fair 5.6% |
| Mexican American Indians | 35.2 /100 | #182 | Fair 5.6% |
| Immigrants | Latin America | 34.3 /100 | #183 | Fair 5.6% |
| Syrians | 33.8 /100 | #184 | Fair 5.6% |
| Immigrants | Mexico | 33.7 /100 | #185 | Fair 5.6% |
| Fijians | 31.7 /100 | #186 | Fair 5.7% |
| Immigrants | Thailand | 30.2 /100 | #187 | Fair 5.7% |
| Marshallese | 28.1 /100 | #188 | Fair 5.7% |
| Pueblo | 27.5 /100 | #189 | Fair 5.7% |
| Immigrants | Eastern Africa | 27.3 /100 | #190 | Fair 5.7% |
Demographics Similar to Navajo by Disability Age 5 to 17
In terms of disability age 5 to 17, the demographic groups most similar to Navajo are Immigrants from Oceania (5.4%, a difference of 0.0%), Belizean (5.4%, a difference of 0.010%), Immigrants from Netherlands (5.4%, a difference of 0.060%), Immigrants from Denmark (5.4%, a difference of 0.080%), and Immigrants from Belize (5.4%, a difference of 0.13%).
| Demographics | Rating | Rank | Disability Age 5 to 17 |
| Immigrants | Bulgaria | 94.0 /100 | #130 | Exceptional 5.4% |
| Arabs | 92.9 /100 | #131 | Exceptional 5.4% |
| Immigrants | Colombia | 92.9 /100 | #132 | Exceptional 5.4% |
| Venezuelans | 92.7 /100 | #133 | Exceptional 5.4% |
| Yuman | 92.3 /100 | #134 | Exceptional 5.4% |
| Immigrants | Belize | 91.7 /100 | #135 | Exceptional 5.4% |
| Immigrants | Denmark | 91.4 /100 | #136 | Exceptional 5.4% |
| Navajo | 90.9 /100 | #137 | Exceptional 5.4% |
| Immigrants | Oceania | 90.8 /100 | #138 | Exceptional 5.4% |
| Belizeans | 90.8 /100 | #139 | Exceptional 5.4% |
| Immigrants | Netherlands | 90.5 /100 | #140 | Exceptional 5.4% |
| South American Indians | 89.3 /100 | #141 | Excellent 5.5% |
| Colombians | 88.0 /100 | #142 | Excellent 5.5% |
| Immigrants | Hungary | 87.9 /100 | #143 | Excellent 5.5% |
| Pakistanis | 87.3 /100 | #144 | Excellent 5.5% |