Celtic vs Arapaho Self-Care Disability
COMPARE
Celtic
Arapaho
Self-Care Disability
Self-Care Disability Comparison
Celtics
Arapaho
2.6%
SELF-CARE DISABILITY
4.4/ 100
METRIC RATING
217th/ 347
METRIC RANK
2.6%
SELF-CARE DISABILITY
0.2/ 100
METRIC RATING
261st/ 347
METRIC RANK
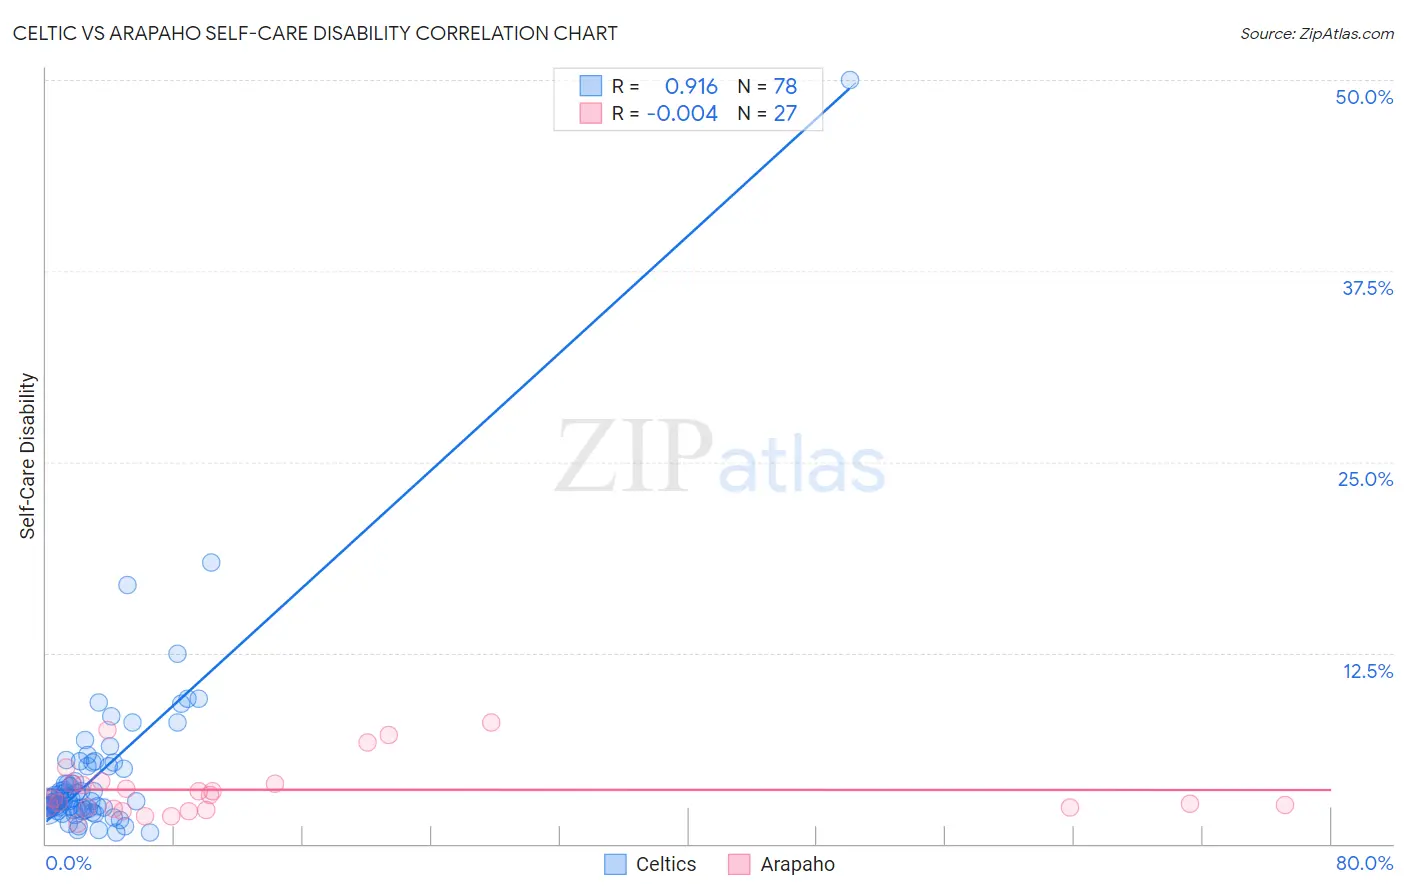
Celtic vs Arapaho Self-Care Disability Correlation Chart
The statistical analysis conducted on geographies consisting of 168,804,948 people shows a near-perfect positive correlation between the proportion of Celtics and percentage of population with self-care disability in the United States with a correlation coefficient (R) of 0.916 and weighted average of 2.6%. Similarly, the statistical analysis conducted on geographies consisting of 29,765,885 people shows no correlation between the proportion of Arapaho and percentage of population with self-care disability in the United States with a correlation coefficient (R) of -0.004 and weighted average of 2.6%, a difference of 3.5%.
Self-Care Disability Correlation Summary
| Measurement | Celtic | Arapaho |
| Minimum | 0.75% | 1.3% |
| Maximum | 50.0% | 7.9% |
| Range | 49.3% | 6.6% |
| Mean | 4.6% | 3.5% |
| Median | 2.8% | 3.0% |
| Interquartile 25% (IQ1) | 2.3% | 2.3% |
| Interquartile 75% (IQ3) | 5.1% | 4.0% |
| Interquartile Range (IQR) | 2.8% | 1.7% |
| Standard Deviation (Sample) | 6.1% | 1.8% |
| Standard Deviation (Population) | 6.1% | 1.8% |
Similar Demographics by Self-Care Disability
Demographics Similar to Celtics by Self-Care Disability
In terms of self-care disability, the demographic groups most similar to Celtics are White/Caucasian (2.6%, a difference of 0.020%), Immigrants from Thailand (2.6%, a difference of 0.040%), Scotch-Irish (2.6%, a difference of 0.070%), Ecuadorian (2.6%, a difference of 0.090%), and Immigrants from Honduras (2.6%, a difference of 0.090%).
| Demographics | Rating | Rank | Self-Care Disability |
| Panamanians | 6.4 /100 | #210 | Tragic 2.5% |
| Native Hawaiians | 5.1 /100 | #211 | Tragic 2.6% |
| Samoans | 5.1 /100 | #212 | Tragic 2.6% |
| Ecuadorians | 4.7 /100 | #213 | Tragic 2.6% |
| Immigrants | Honduras | 4.7 /100 | #214 | Tragic 2.6% |
| Immigrants | Thailand | 4.5 /100 | #215 | Tragic 2.6% |
| Whites/Caucasians | 4.4 /100 | #216 | Tragic 2.6% |
| Celtics | 4.4 /100 | #217 | Tragic 2.6% |
| Scotch-Irish | 4.1 /100 | #218 | Tragic 2.6% |
| Immigrants | Moldova | 4.0 /100 | #219 | Tragic 2.6% |
| Sub-Saharan Africans | 4.0 /100 | #220 | Tragic 2.6% |
| Hondurans | 3.8 /100 | #221 | Tragic 2.6% |
| Spaniards | 3.8 /100 | #222 | Tragic 2.6% |
| French Canadians | 3.8 /100 | #223 | Tragic 2.6% |
| Osage | 3.6 /100 | #224 | Tragic 2.6% |
Demographics Similar to Arapaho by Self-Care Disability
In terms of self-care disability, the demographic groups most similar to Arapaho are Chippewa (2.6%, a difference of 0.020%), Immigrants from Belarus (2.6%, a difference of 0.060%), Nonimmigrants (2.6%, a difference of 0.13%), Shoshone (2.7%, a difference of 0.14%), and Potawatomi (2.6%, a difference of 0.20%).
| Demographics | Rating | Rank | Self-Care Disability |
| Haitians | 0.3 /100 | #254 | Tragic 2.6% |
| Tsimshian | 0.3 /100 | #255 | Tragic 2.6% |
| Immigrants | Central America | 0.3 /100 | #256 | Tragic 2.6% |
| Potawatomi | 0.3 /100 | #257 | Tragic 2.6% |
| Immigrants | Nonimmigrants | 0.3 /100 | #258 | Tragic 2.6% |
| Immigrants | Belarus | 0.2 /100 | #259 | Tragic 2.6% |
| Chippewa | 0.2 /100 | #260 | Tragic 2.6% |
| Arapaho | 0.2 /100 | #261 | Tragic 2.6% |
| Shoshone | 0.2 /100 | #262 | Tragic 2.7% |
| Immigrants | Latin America | 0.2 /100 | #263 | Tragic 2.7% |
| Immigrants | Iran | 0.2 /100 | #264 | Tragic 2.7% |
| Immigrants | Nicaragua | 0.2 /100 | #265 | Tragic 2.7% |
| Immigrants | Cambodia | 0.1 /100 | #266 | Tragic 2.7% |
| Yaqui | 0.1 /100 | #267 | Tragic 2.7% |
| Immigrants | Mexico | 0.1 /100 | #268 | Tragic 2.7% |