Celtic vs Sudanese Self-Care Disability
COMPARE
Celtic
Sudanese
Self-Care Disability
Self-Care Disability Comparison
Celtics
Sudanese
2.6%
SELF-CARE DISABILITY
4.4/ 100
METRIC RATING
217th/ 347
METRIC RANK
2.2%
SELF-CARE DISABILITY
100.0/ 100
METRIC RATING
10th/ 347
METRIC RANK
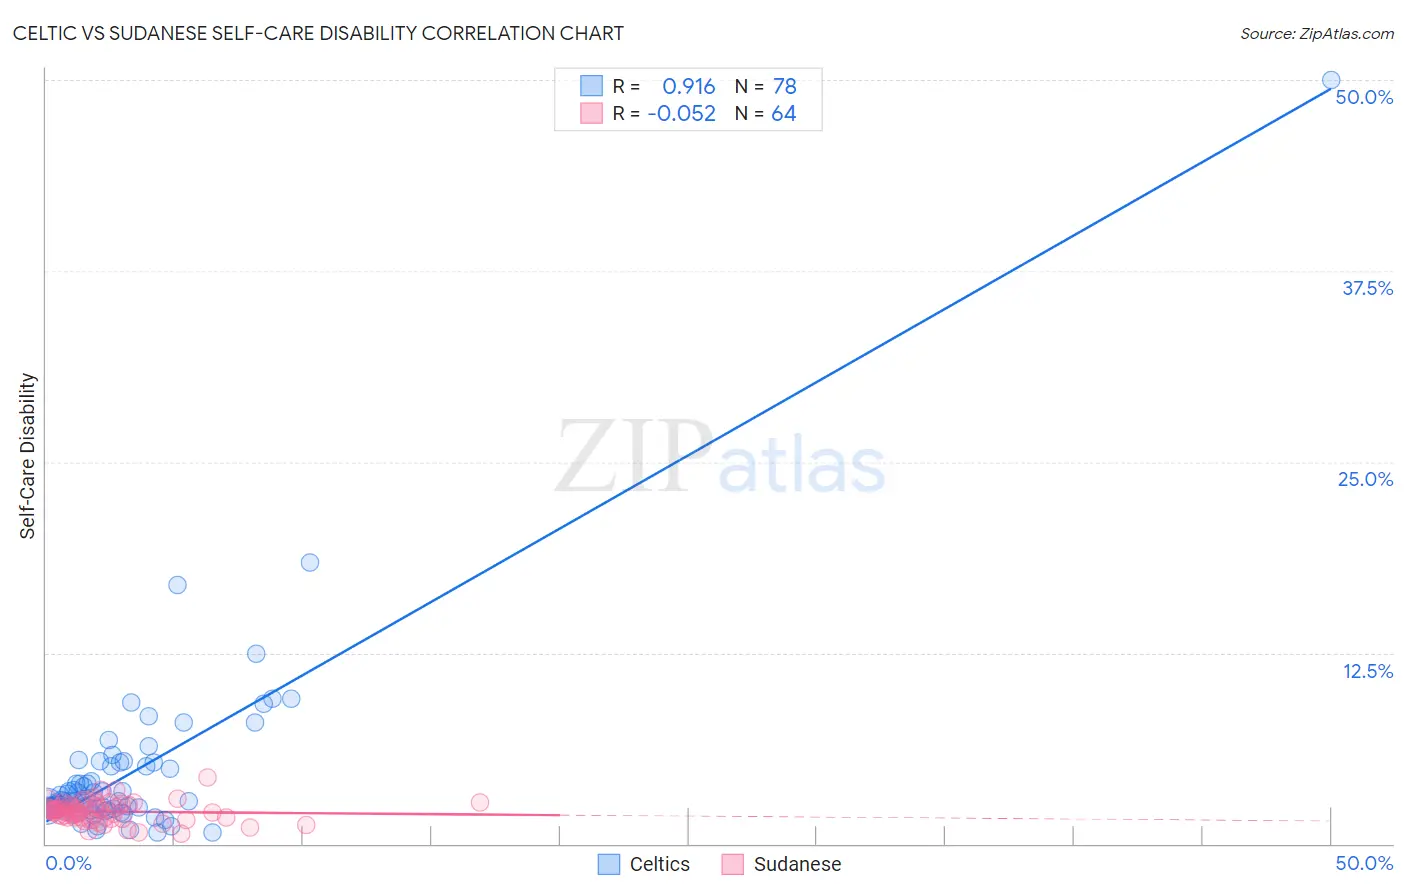
Celtic vs Sudanese Self-Care Disability Correlation Chart
The statistical analysis conducted on geographies consisting of 168,804,948 people shows a near-perfect positive correlation between the proportion of Celtics and percentage of population with self-care disability in the United States with a correlation coefficient (R) of 0.916 and weighted average of 2.6%. Similarly, the statistical analysis conducted on geographies consisting of 110,094,977 people shows a slight negative correlation between the proportion of Sudanese and percentage of population with self-care disability in the United States with a correlation coefficient (R) of -0.052 and weighted average of 2.2%, a difference of 16.7%.
Self-Care Disability Correlation Summary
| Measurement | Celtic | Sudanese |
| Minimum | 0.75% | 0.62% |
| Maximum | 50.0% | 4.3% |
| Range | 49.3% | 3.7% |
| Mean | 4.6% | 2.1% |
| Median | 2.8% | 2.1% |
| Interquartile 25% (IQ1) | 2.3% | 1.7% |
| Interquartile 75% (IQ3) | 5.1% | 2.5% |
| Interquartile Range (IQR) | 2.8% | 0.78% |
| Standard Deviation (Sample) | 6.1% | 0.67% |
| Standard Deviation (Population) | 6.1% | 0.67% |
Similar Demographics by Self-Care Disability
Demographics Similar to Celtics by Self-Care Disability
In terms of self-care disability, the demographic groups most similar to Celtics are White/Caucasian (2.6%, a difference of 0.020%), Immigrants from Thailand (2.6%, a difference of 0.040%), Scotch-Irish (2.6%, a difference of 0.070%), Ecuadorian (2.6%, a difference of 0.090%), and Immigrants from Honduras (2.6%, a difference of 0.090%).
| Demographics | Rating | Rank | Self-Care Disability |
| Panamanians | 6.4 /100 | #210 | Tragic 2.5% |
| Native Hawaiians | 5.1 /100 | #211 | Tragic 2.6% |
| Samoans | 5.1 /100 | #212 | Tragic 2.6% |
| Ecuadorians | 4.7 /100 | #213 | Tragic 2.6% |
| Immigrants | Honduras | 4.7 /100 | #214 | Tragic 2.6% |
| Immigrants | Thailand | 4.5 /100 | #215 | Tragic 2.6% |
| Whites/Caucasians | 4.4 /100 | #216 | Tragic 2.6% |
| Celtics | 4.4 /100 | #217 | Tragic 2.6% |
| Scotch-Irish | 4.1 /100 | #218 | Tragic 2.6% |
| Immigrants | Moldova | 4.0 /100 | #219 | Tragic 2.6% |
| Sub-Saharan Africans | 4.0 /100 | #220 | Tragic 2.6% |
| Hondurans | 3.8 /100 | #221 | Tragic 2.6% |
| Spaniards | 3.8 /100 | #222 | Tragic 2.6% |
| French Canadians | 3.8 /100 | #223 | Tragic 2.6% |
| Osage | 3.6 /100 | #224 | Tragic 2.6% |
Demographics Similar to Sudanese by Self-Care Disability
In terms of self-care disability, the demographic groups most similar to Sudanese are Immigrants from South Central Asia (2.2%, a difference of 0.10%), Immigrants from Ethiopia (2.2%, a difference of 0.16%), Ethiopian (2.2%, a difference of 0.17%), Luxembourger (2.2%, a difference of 0.33%), and Okinawan (2.2%, a difference of 0.34%).
| Demographics | Rating | Rank | Self-Care Disability |
| Thais | 100.0 /100 | #3 | Exceptional 2.1% |
| Immigrants | Singapore | 100.0 /100 | #4 | Exceptional 2.1% |
| Zimbabweans | 100.0 /100 | #5 | Exceptional 2.2% |
| Filipinos | 100.0 /100 | #6 | Exceptional 2.2% |
| Immigrants | Bolivia | 100.0 /100 | #7 | Exceptional 2.2% |
| Bolivians | 100.0 /100 | #8 | Exceptional 2.2% |
| Immigrants | Nepal | 100.0 /100 | #9 | Exceptional 2.2% |
| Sudanese | 100.0 /100 | #10 | Exceptional 2.2% |
| Immigrants | South Central Asia | 100.0 /100 | #11 | Exceptional 2.2% |
| Immigrants | Ethiopia | 100.0 /100 | #12 | Exceptional 2.2% |
| Ethiopians | 100.0 /100 | #13 | Exceptional 2.2% |
| Luxembourgers | 100.0 /100 | #14 | Exceptional 2.2% |
| Okinawans | 100.0 /100 | #15 | Exceptional 2.2% |
| Immigrants | Kuwait | 100.0 /100 | #16 | Exceptional 2.2% |
| Immigrants | Saudi Arabia | 100.0 /100 | #17 | Exceptional 2.2% |