Celtic vs Immigrants from Egypt Self-Care Disability
COMPARE
Celtic
Immigrants from Egypt
Self-Care Disability
Self-Care Disability Comparison
Celtics
Immigrants from Egypt
2.6%
SELF-CARE DISABILITY
4.4/ 100
METRIC RATING
217th/ 347
METRIC RANK
2.3%
SELF-CARE DISABILITY
99.1/ 100
METRIC RATING
73rd/ 347
METRIC RANK
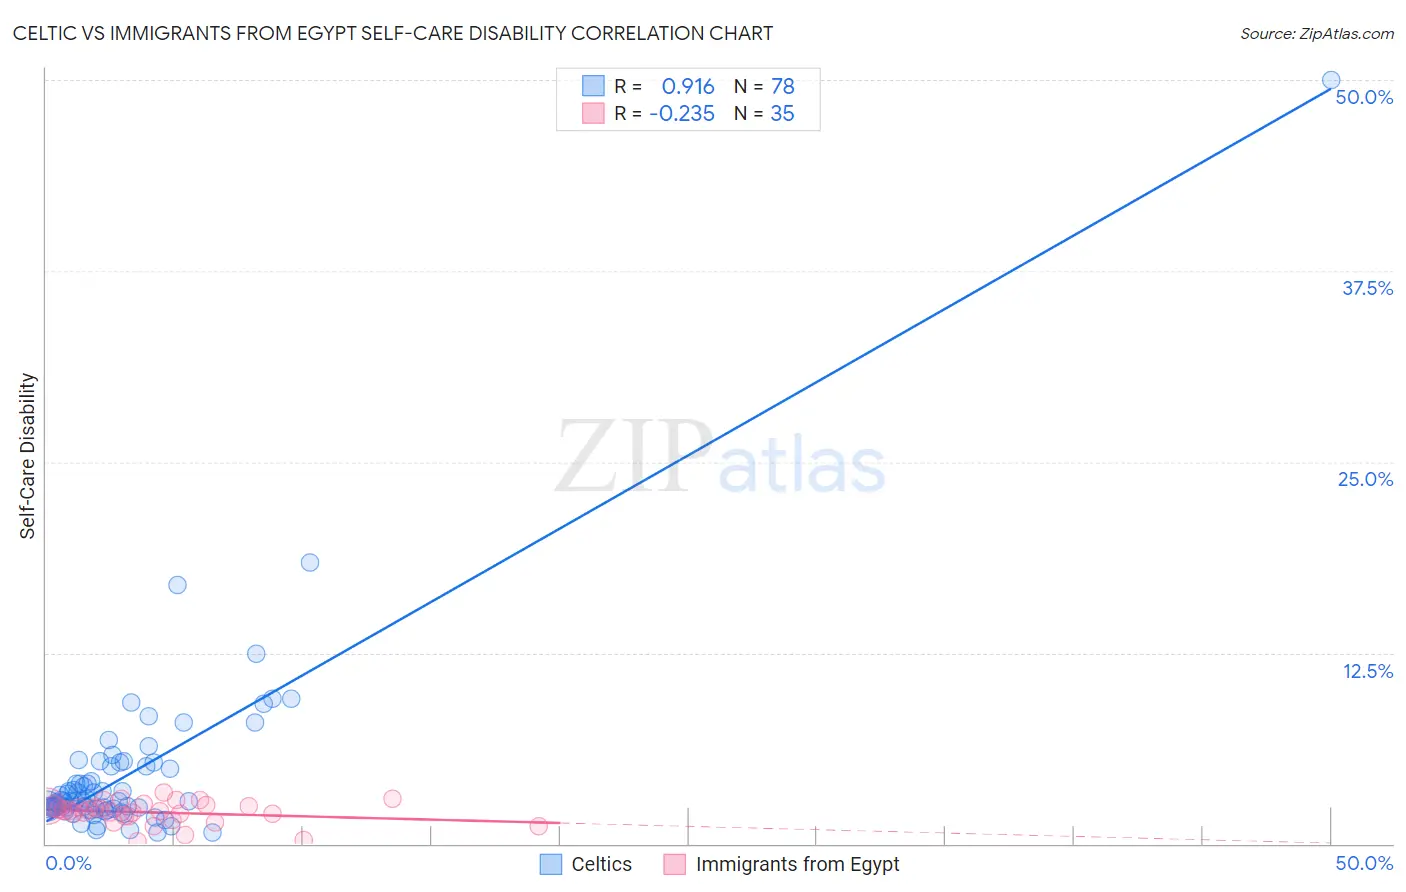
Celtic vs Immigrants from Egypt Self-Care Disability Correlation Chart
The statistical analysis conducted on geographies consisting of 168,804,948 people shows a near-perfect positive correlation between the proportion of Celtics and percentage of population with self-care disability in the United States with a correlation coefficient (R) of 0.916 and weighted average of 2.6%. Similarly, the statistical analysis conducted on geographies consisting of 245,382,985 people shows a weak negative correlation between the proportion of Immigrants from Egypt and percentage of population with self-care disability in the United States with a correlation coefficient (R) of -0.235 and weighted average of 2.3%, a difference of 9.9%.
Self-Care Disability Correlation Summary
| Measurement | Celtic | Immigrants from Egypt |
| Minimum | 0.75% | 0.20% |
| Maximum | 50.0% | 3.3% |
| Range | 49.3% | 3.1% |
| Mean | 4.6% | 2.0% |
| Median | 2.8% | 2.2% |
| Interquartile 25% (IQ1) | 2.3% | 1.8% |
| Interquartile 75% (IQ3) | 5.1% | 2.5% |
| Interquartile Range (IQR) | 2.8% | 0.68% |
| Standard Deviation (Sample) | 6.1% | 0.73% |
| Standard Deviation (Population) | 6.1% | 0.72% |
Similar Demographics by Self-Care Disability
Demographics Similar to Celtics by Self-Care Disability
In terms of self-care disability, the demographic groups most similar to Celtics are White/Caucasian (2.6%, a difference of 0.020%), Immigrants from Thailand (2.6%, a difference of 0.040%), Scotch-Irish (2.6%, a difference of 0.070%), Ecuadorian (2.6%, a difference of 0.090%), and Immigrants from Honduras (2.6%, a difference of 0.090%).
| Demographics | Rating | Rank | Self-Care Disability |
| Panamanians | 6.4 /100 | #210 | Tragic 2.5% |
| Native Hawaiians | 5.1 /100 | #211 | Tragic 2.6% |
| Samoans | 5.1 /100 | #212 | Tragic 2.6% |
| Ecuadorians | 4.7 /100 | #213 | Tragic 2.6% |
| Immigrants | Honduras | 4.7 /100 | #214 | Tragic 2.6% |
| Immigrants | Thailand | 4.5 /100 | #215 | Tragic 2.6% |
| Whites/Caucasians | 4.4 /100 | #216 | Tragic 2.6% |
| Celtics | 4.4 /100 | #217 | Tragic 2.6% |
| Scotch-Irish | 4.1 /100 | #218 | Tragic 2.6% |
| Immigrants | Moldova | 4.0 /100 | #219 | Tragic 2.6% |
| Sub-Saharan Africans | 4.0 /100 | #220 | Tragic 2.6% |
| Hondurans | 3.8 /100 | #221 | Tragic 2.6% |
| Spaniards | 3.8 /100 | #222 | Tragic 2.6% |
| French Canadians | 3.8 /100 | #223 | Tragic 2.6% |
| Osage | 3.6 /100 | #224 | Tragic 2.6% |
Demographics Similar to Immigrants from Egypt by Self-Care Disability
In terms of self-care disability, the demographic groups most similar to Immigrants from Egypt are Eastern European (2.3%, a difference of 0.030%), Asian (2.3%, a difference of 0.060%), Immigrants from Switzerland (2.3%, a difference of 0.060%), Immigrants from Northern Europe (2.3%, a difference of 0.090%), and Immigrants from Netherlands (2.3%, a difference of 0.10%).
| Demographics | Rating | Rank | Self-Care Disability |
| Immigrants | Argentina | 99.3 /100 | #66 | Exceptional 2.3% |
| South Africans | 99.3 /100 | #67 | Exceptional 2.3% |
| Immigrants | Zaire | 99.2 /100 | #68 | Exceptional 2.3% |
| Immigrants | Norway | 99.2 /100 | #69 | Exceptional 2.3% |
| Immigrants | Northern Europe | 99.2 /100 | #70 | Exceptional 2.3% |
| Asians | 99.2 /100 | #71 | Exceptional 2.3% |
| Eastern Europeans | 99.2 /100 | #72 | Exceptional 2.3% |
| Immigrants | Egypt | 99.1 /100 | #73 | Exceptional 2.3% |
| Immigrants | Switzerland | 99.1 /100 | #74 | Exceptional 2.3% |
| Immigrants | Netherlands | 99.1 /100 | #75 | Exceptional 2.3% |
| Immigrants | China | 99.1 /100 | #76 | Exceptional 2.3% |
| Immigrants | Middle Africa | 99.0 /100 | #77 | Exceptional 2.3% |
| Immigrants | Ireland | 99.0 /100 | #78 | Exceptional 2.3% |
| Immigrants | Kenya | 99.0 /100 | #79 | Exceptional 2.3% |
| Chileans | 98.8 /100 | #80 | Exceptional 2.3% |