Celtic vs Immigrants from Sierra Leone Self-Care Disability
COMPARE
Celtic
Immigrants from Sierra Leone
Self-Care Disability
Self-Care Disability Comparison
Celtics
Immigrants from Sierra Leone
2.6%
SELF-CARE DISABILITY
4.4/ 100
METRIC RATING
217th/ 347
METRIC RANK
2.4%
SELF-CARE DISABILITY
91.8/ 100
METRIC RATING
119th/ 347
METRIC RANK
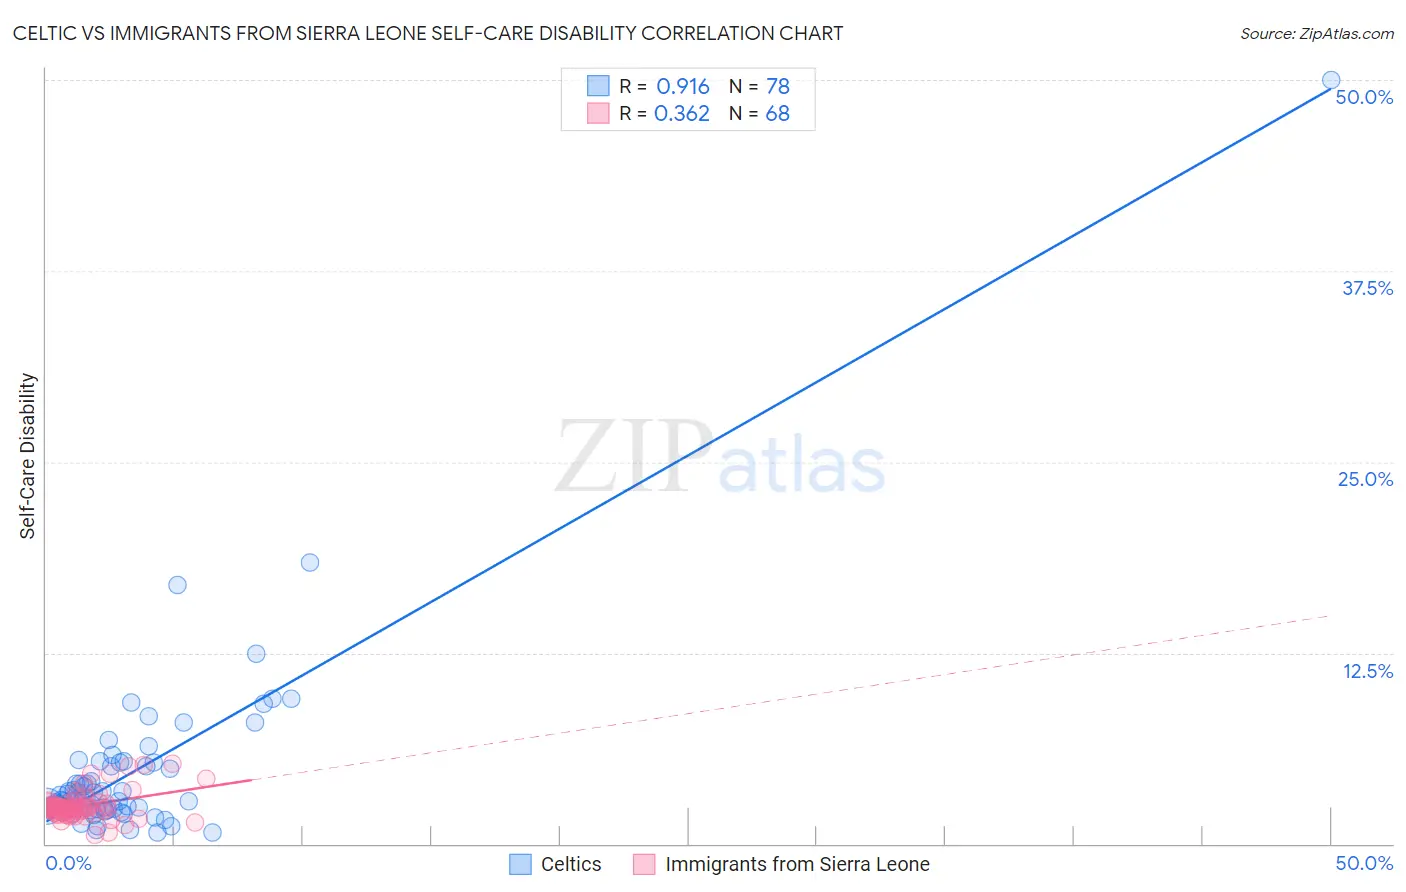
Celtic vs Immigrants from Sierra Leone Self-Care Disability Correlation Chart
The statistical analysis conducted on geographies consisting of 168,804,948 people shows a near-perfect positive correlation between the proportion of Celtics and percentage of population with self-care disability in the United States with a correlation coefficient (R) of 0.916 and weighted average of 2.6%. Similarly, the statistical analysis conducted on geographies consisting of 101,626,227 people shows a mild positive correlation between the proportion of Immigrants from Sierra Leone and percentage of population with self-care disability in the United States with a correlation coefficient (R) of 0.362 and weighted average of 2.4%, a difference of 6.7%.
Self-Care Disability Correlation Summary
| Measurement | Celtic | Immigrants from Sierra Leone |
| Minimum | 0.75% | 0.59% |
| Maximum | 50.0% | 5.3% |
| Range | 49.3% | 4.7% |
| Mean | 4.6% | 2.5% |
| Median | 2.8% | 2.3% |
| Interquartile 25% (IQ1) | 2.3% | 2.0% |
| Interquartile 75% (IQ3) | 5.1% | 2.6% |
| Interquartile Range (IQR) | 2.8% | 0.58% |
| Standard Deviation (Sample) | 6.1% | 0.92% |
| Standard Deviation (Population) | 6.1% | 0.91% |
Similar Demographics by Self-Care Disability
Demographics Similar to Celtics by Self-Care Disability
In terms of self-care disability, the demographic groups most similar to Celtics are White/Caucasian (2.6%, a difference of 0.020%), Immigrants from Thailand (2.6%, a difference of 0.040%), Scotch-Irish (2.6%, a difference of 0.070%), Ecuadorian (2.6%, a difference of 0.090%), and Immigrants from Honduras (2.6%, a difference of 0.090%).
| Demographics | Rating | Rank | Self-Care Disability |
| Panamanians | 6.4 /100 | #210 | Tragic 2.5% |
| Native Hawaiians | 5.1 /100 | #211 | Tragic 2.6% |
| Samoans | 5.1 /100 | #212 | Tragic 2.6% |
| Ecuadorians | 4.7 /100 | #213 | Tragic 2.6% |
| Immigrants | Honduras | 4.7 /100 | #214 | Tragic 2.6% |
| Immigrants | Thailand | 4.5 /100 | #215 | Tragic 2.6% |
| Whites/Caucasians | 4.4 /100 | #216 | Tragic 2.6% |
| Celtics | 4.4 /100 | #217 | Tragic 2.6% |
| Scotch-Irish | 4.1 /100 | #218 | Tragic 2.6% |
| Immigrants | Moldova | 4.0 /100 | #219 | Tragic 2.6% |
| Sub-Saharan Africans | 4.0 /100 | #220 | Tragic 2.6% |
| Hondurans | 3.8 /100 | #221 | Tragic 2.6% |
| Spaniards | 3.8 /100 | #222 | Tragic 2.6% |
| French Canadians | 3.8 /100 | #223 | Tragic 2.6% |
| Osage | 3.6 /100 | #224 | Tragic 2.6% |
Demographics Similar to Immigrants from Sierra Leone by Self-Care Disability
In terms of self-care disability, the demographic groups most similar to Immigrants from Sierra Leone are Immigrants from Canada (2.4%, a difference of 0.030%), Uruguayan (2.4%, a difference of 0.050%), Peruvian (2.4%, a difference of 0.070%), Taiwanese (2.4%, a difference of 0.12%), and Belgian (2.4%, a difference of 0.14%).
| Demographics | Rating | Rank | Self-Care Disability |
| Scandinavians | 93.5 /100 | #112 | Exceptional 2.4% |
| South Americans | 93.2 /100 | #113 | Exceptional 2.4% |
| Immigrants | North Macedonia | 93.1 /100 | #114 | Exceptional 2.4% |
| Immigrants | Hong Kong | 93.1 /100 | #115 | Exceptional 2.4% |
| Northern Europeans | 92.9 /100 | #116 | Exceptional 2.4% |
| Taiwanese | 92.5 /100 | #117 | Exceptional 2.4% |
| Immigrants | Canada | 92.0 /100 | #118 | Exceptional 2.4% |
| Immigrants | Sierra Leone | 91.8 /100 | #119 | Exceptional 2.4% |
| Uruguayans | 91.5 /100 | #120 | Exceptional 2.4% |
| Peruvians | 91.3 /100 | #121 | Exceptional 2.4% |
| Belgians | 90.9 /100 | #122 | Exceptional 2.4% |
| Immigrants | Nigeria | 90.3 /100 | #123 | Exceptional 2.4% |
| Immigrants | North America | 90.2 /100 | #124 | Exceptional 2.4% |
| Immigrants | Morocco | 90.2 /100 | #124 | Exceptional 2.4% |
| Hmong | 89.9 /100 | #126 | Excellent 2.4% |