Aleut vs Immigrants from Congo Self-Care Disability
COMPARE
Aleut
Immigrants from Congo
Self-Care Disability
Self-Care Disability Comparison
Aleuts
Immigrants from Congo
2.8%
SELF-CARE DISABILITY
0.0/ 100
METRIC RATING
306th/ 347
METRIC RANK
2.4%
SELF-CARE DISABILITY
98.0/ 100
METRIC RATING
89th/ 347
METRIC RANK
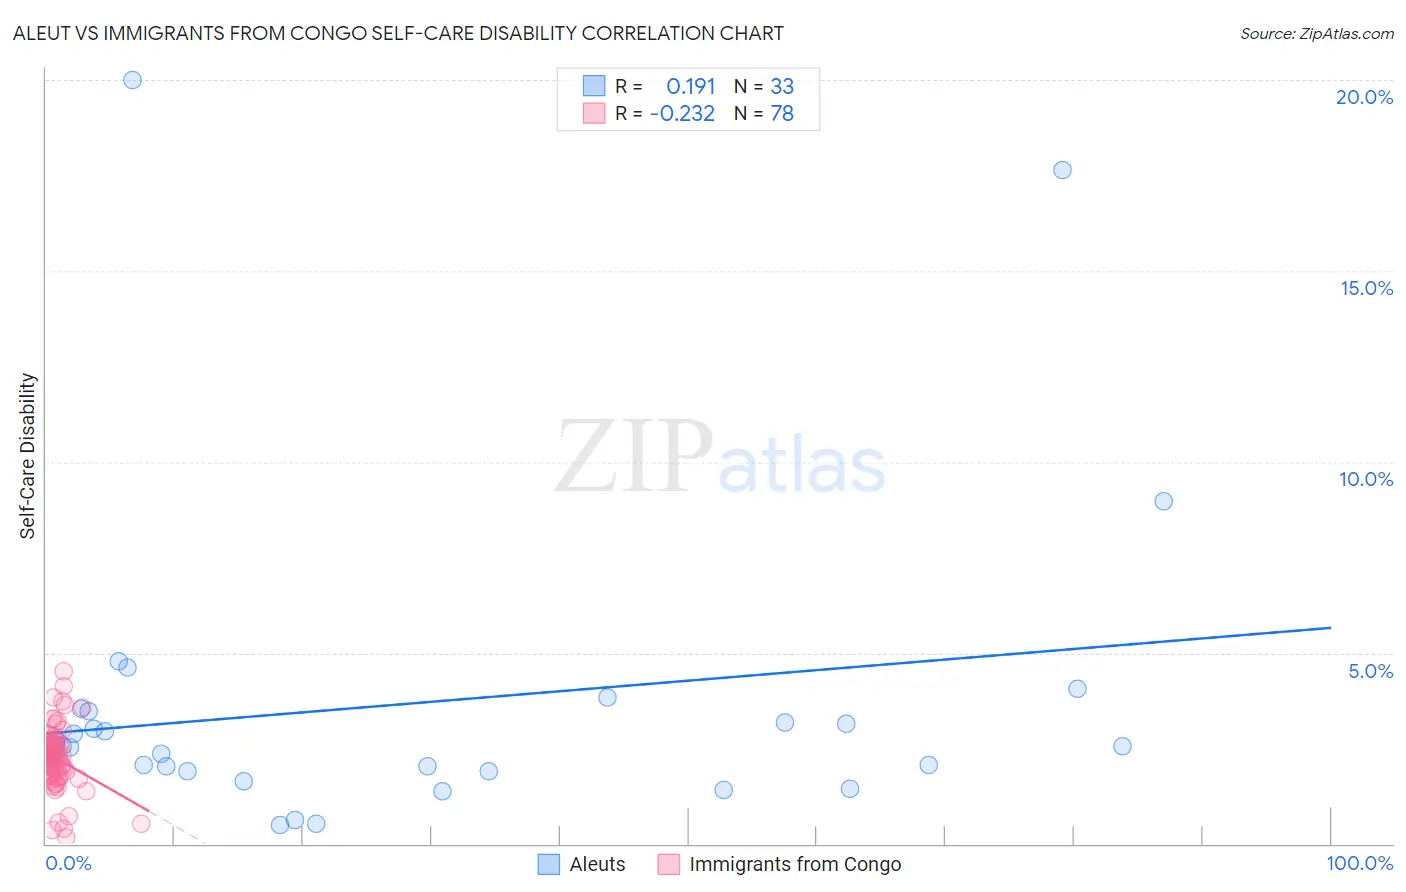
Aleut vs Immigrants from Congo Self-Care Disability Correlation Chart
The statistical analysis conducted on geographies consisting of 61,744,406 people shows a poor positive correlation between the proportion of Aleuts and percentage of population with self-care disability in the United States with a correlation coefficient (R) of 0.191 and weighted average of 2.8%. Similarly, the statistical analysis conducted on geographies consisting of 92,100,672 people shows a weak negative correlation between the proportion of Immigrants from Congo and percentage of population with self-care disability in the United States with a correlation coefficient (R) of -0.232 and weighted average of 2.4%, a difference of 19.1%.
Self-Care Disability Correlation Summary
| Measurement | Aleut | Immigrants from Congo |
| Minimum | 0.50% | 0.17% |
| Maximum | 20.0% | 4.5% |
| Range | 19.5% | 4.4% |
| Mean | 3.7% | 2.2% |
| Median | 2.6% | 2.3% |
| Interquartile 25% (IQ1) | 1.9% | 1.8% |
| Interquartile 75% (IQ3) | 3.5% | 2.6% |
| Interquartile Range (IQR) | 1.6% | 0.76% |
| Standard Deviation (Sample) | 4.2% | 0.81% |
| Standard Deviation (Population) | 4.1% | 0.80% |
Similar Demographics by Self-Care Disability
Demographics Similar to Aleuts by Self-Care Disability
In terms of self-care disability, the demographic groups most similar to Aleuts are Native/Alaskan (2.8%, a difference of 0.070%), Immigrants from Grenada (2.8%, a difference of 0.37%), Immigrants from West Indies (2.8%, a difference of 0.40%), Cree (2.8%, a difference of 0.45%), and Bangladeshi (2.8%, a difference of 0.52%).
| Demographics | Rating | Rank | Self-Care Disability |
| Immigrants | Guyana | 0.0 /100 | #299 | Tragic 2.8% |
| Immigrants | Fiji | 0.0 /100 | #300 | Tragic 2.8% |
| Pima | 0.0 /100 | #301 | Tragic 2.8% |
| Immigrants | St. Vincent and the Grenadines | 0.0 /100 | #302 | Tragic 2.8% |
| Immigrants | Belize | 0.0 /100 | #303 | Tragic 2.8% |
| Cree | 0.0 /100 | #304 | Tragic 2.8% |
| Immigrants | West Indies | 0.0 /100 | #305 | Tragic 2.8% |
| Aleuts | 0.0 /100 | #306 | Tragic 2.8% |
| Natives/Alaskans | 0.0 /100 | #307 | Tragic 2.8% |
| Immigrants | Grenada | 0.0 /100 | #308 | Tragic 2.8% |
| Bangladeshis | 0.0 /100 | #309 | Tragic 2.8% |
| British West Indians | 0.0 /100 | #310 | Tragic 2.8% |
| Puget Sound Salish | 0.0 /100 | #311 | Tragic 2.8% |
| Immigrants | Caribbean | 0.0 /100 | #312 | Tragic 2.8% |
| Spanish Americans | 0.0 /100 | #313 | Tragic 2.8% |
Demographics Similar to Immigrants from Congo by Self-Care Disability
In terms of self-care disability, the demographic groups most similar to Immigrants from Congo are Sierra Leonean (2.4%, a difference of 0.050%), Lithuanian (2.4%, a difference of 0.050%), Immigrants from Czechoslovakia (2.4%, a difference of 0.14%), Immigrants from Jordan (2.4%, a difference of 0.15%), and Immigrants from Northern Africa (2.3%, a difference of 0.19%).
| Demographics | Rating | Rank | Self-Care Disability |
| Immigrants | Denmark | 98.8 /100 | #82 | Exceptional 2.3% |
| Indians (Asian) | 98.7 /100 | #83 | Exceptional 2.3% |
| Immigrants | Spain | 98.7 /100 | #84 | Exceptional 2.3% |
| Estonians | 98.3 /100 | #85 | Exceptional 2.3% |
| Immigrants | Northern Africa | 98.2 /100 | #86 | Exceptional 2.3% |
| Sierra Leoneans | 98.0 /100 | #87 | Exceptional 2.4% |
| Lithuanians | 98.0 /100 | #88 | Exceptional 2.4% |
| Immigrants | Congo | 98.0 /100 | #89 | Exceptional 2.4% |
| Immigrants | Czechoslovakia | 97.7 /100 | #90 | Exceptional 2.4% |
| Immigrants | Jordan | 97.7 /100 | #91 | Exceptional 2.4% |
| Icelanders | 97.4 /100 | #92 | Exceptional 2.4% |
| Immigrants | Latvia | 97.0 /100 | #93 | Exceptional 2.4% |
| Macedonians | 96.9 /100 | #94 | Exceptional 2.4% |
| Immigrants | Asia | 96.9 /100 | #95 | Exceptional 2.4% |
| Immigrants | Chile | 96.7 /100 | #96 | Exceptional 2.4% |