Aleut vs Colombian Self-Care Disability
COMPARE
Aleut
Colombian
Self-Care Disability
Self-Care Disability Comparison
Aleuts
Colombians
2.8%
SELF-CARE DISABILITY
0.0/ 100
METRIC RATING
306th/ 347
METRIC RANK
2.4%
SELF-CARE DISABILITY
89.7/ 100
METRIC RATING
127th/ 347
METRIC RANK
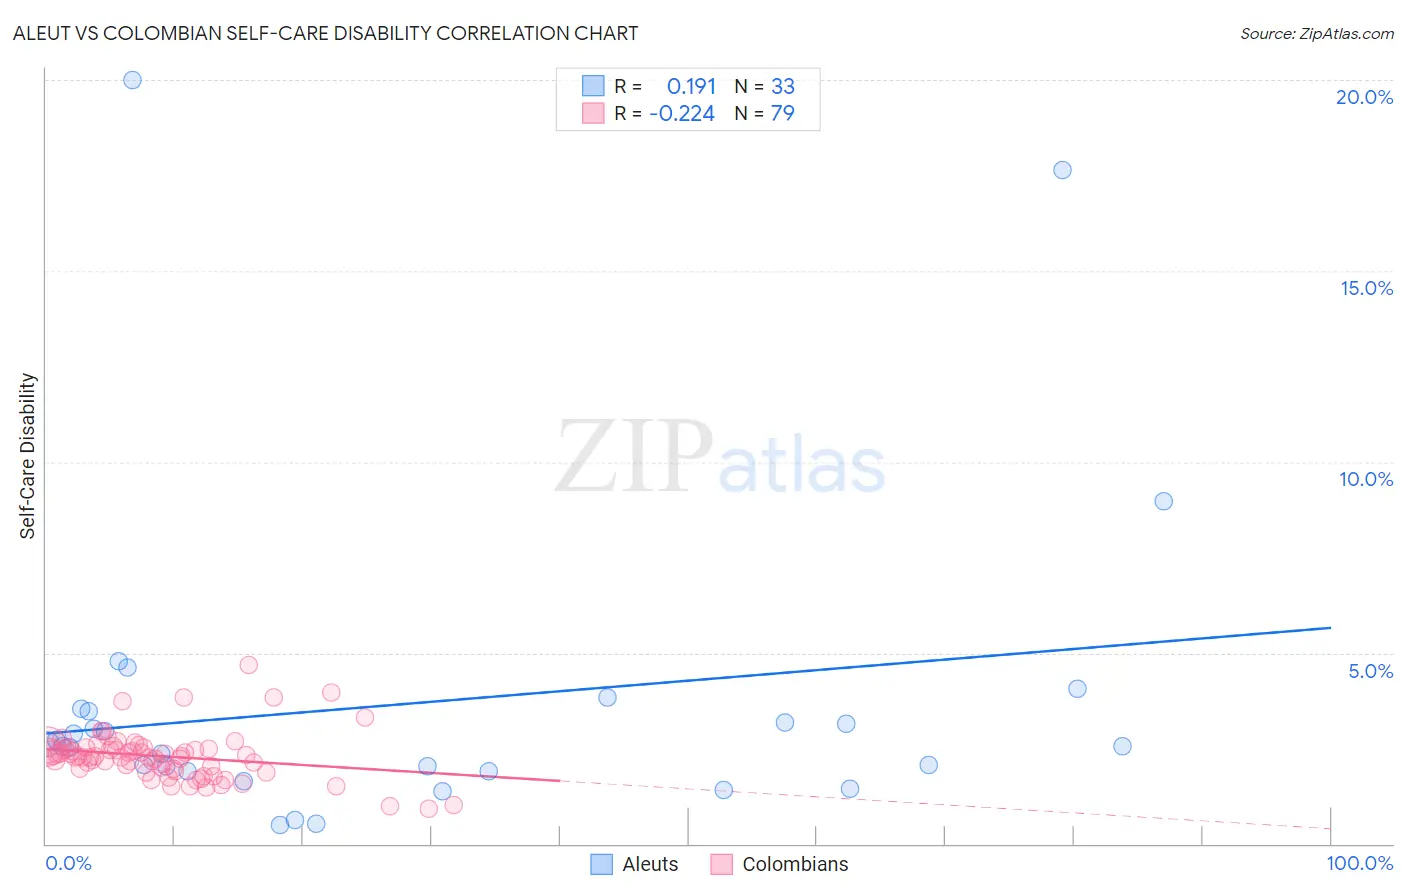
Aleut vs Colombian Self-Care Disability Correlation Chart
The statistical analysis conducted on geographies consisting of 61,744,406 people shows a poor positive correlation between the proportion of Aleuts and percentage of population with self-care disability in the United States with a correlation coefficient (R) of 0.191 and weighted average of 2.8%. Similarly, the statistical analysis conducted on geographies consisting of 419,041,543 people shows a weak negative correlation between the proportion of Colombians and percentage of population with self-care disability in the United States with a correlation coefficient (R) of -0.224 and weighted average of 2.4%, a difference of 16.7%.
Self-Care Disability Correlation Summary
| Measurement | Aleut | Colombian |
| Minimum | 0.50% | 0.93% |
| Maximum | 20.0% | 4.7% |
| Range | 19.5% | 3.8% |
| Mean | 3.7% | 2.3% |
| Median | 2.6% | 2.3% |
| Interquartile 25% (IQ1) | 1.9% | 2.0% |
| Interquartile 75% (IQ3) | 3.5% | 2.5% |
| Interquartile Range (IQR) | 1.6% | 0.55% |
| Standard Deviation (Sample) | 4.2% | 0.63% |
| Standard Deviation (Population) | 4.1% | 0.63% |
Similar Demographics by Self-Care Disability
Demographics Similar to Aleuts by Self-Care Disability
In terms of self-care disability, the demographic groups most similar to Aleuts are Native/Alaskan (2.8%, a difference of 0.070%), Immigrants from Grenada (2.8%, a difference of 0.37%), Immigrants from West Indies (2.8%, a difference of 0.40%), Cree (2.8%, a difference of 0.45%), and Bangladeshi (2.8%, a difference of 0.52%).
| Demographics | Rating | Rank | Self-Care Disability |
| Immigrants | Guyana | 0.0 /100 | #299 | Tragic 2.8% |
| Immigrants | Fiji | 0.0 /100 | #300 | Tragic 2.8% |
| Pima | 0.0 /100 | #301 | Tragic 2.8% |
| Immigrants | St. Vincent and the Grenadines | 0.0 /100 | #302 | Tragic 2.8% |
| Immigrants | Belize | 0.0 /100 | #303 | Tragic 2.8% |
| Cree | 0.0 /100 | #304 | Tragic 2.8% |
| Immigrants | West Indies | 0.0 /100 | #305 | Tragic 2.8% |
| Aleuts | 0.0 /100 | #306 | Tragic 2.8% |
| Natives/Alaskans | 0.0 /100 | #307 | Tragic 2.8% |
| Immigrants | Grenada | 0.0 /100 | #308 | Tragic 2.8% |
| Bangladeshis | 0.0 /100 | #309 | Tragic 2.8% |
| British West Indians | 0.0 /100 | #310 | Tragic 2.8% |
| Puget Sound Salish | 0.0 /100 | #311 | Tragic 2.8% |
| Immigrants | Caribbean | 0.0 /100 | #312 | Tragic 2.8% |
| Spanish Americans | 0.0 /100 | #313 | Tragic 2.8% |
Demographics Similar to Colombians by Self-Care Disability
In terms of self-care disability, the demographic groups most similar to Colombians are Immigrants from Hungary (2.4%, a difference of 0.010%), Hmong (2.4%, a difference of 0.030%), Immigrants from Romania (2.4%, a difference of 0.060%), Immigrants from Morocco (2.4%, a difference of 0.070%), and Immigrants from North America (2.4%, a difference of 0.070%).
| Demographics | Rating | Rank | Self-Care Disability |
| Uruguayans | 91.5 /100 | #120 | Exceptional 2.4% |
| Peruvians | 91.3 /100 | #121 | Exceptional 2.4% |
| Belgians | 90.9 /100 | #122 | Exceptional 2.4% |
| Immigrants | Nigeria | 90.3 /100 | #123 | Exceptional 2.4% |
| Immigrants | Morocco | 90.2 /100 | #124 | Exceptional 2.4% |
| Immigrants | North America | 90.2 /100 | #124 | Exceptional 2.4% |
| Hmong | 89.9 /100 | #126 | Excellent 2.4% |
| Colombians | 89.7 /100 | #127 | Excellent 2.4% |
| Immigrants | Hungary | 89.6 /100 | #128 | Excellent 2.4% |
| Immigrants | Romania | 89.3 /100 | #129 | Excellent 2.4% |
| Immigrants | Austria | 89.0 /100 | #130 | Excellent 2.4% |
| Poles | 88.9 /100 | #131 | Excellent 2.4% |
| Immigrants | South America | 88.8 /100 | #132 | Excellent 2.4% |
| Immigrants | Colombia | 88.5 /100 | #133 | Excellent 2.4% |
| Russians | 88.2 /100 | #134 | Excellent 2.4% |