Aleut vs Immigrants from Panama Self-Care Disability
COMPARE
Aleut
Immigrants from Panama
Self-Care Disability
Self-Care Disability Comparison
Aleuts
Immigrants from Panama
2.8%
SELF-CARE DISABILITY
0.0/ 100
METRIC RATING
306th/ 347
METRIC RANK
2.6%
SELF-CARE DISABILITY
1.2/ 100
METRIC RATING
239th/ 347
METRIC RANK
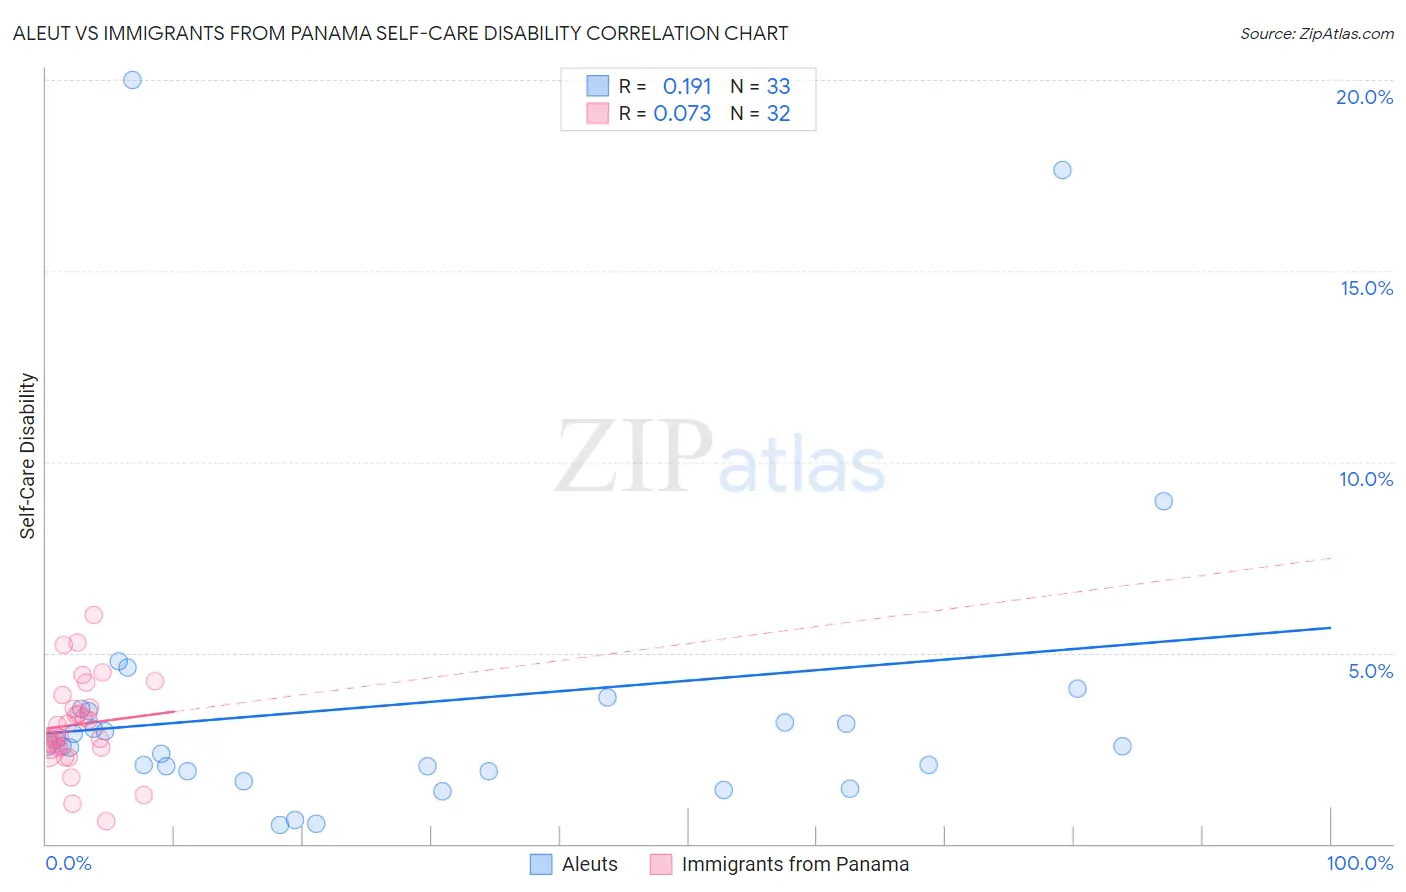
Aleut vs Immigrants from Panama Self-Care Disability Correlation Chart
The statistical analysis conducted on geographies consisting of 61,744,406 people shows a poor positive correlation between the proportion of Aleuts and percentage of population with self-care disability in the United States with a correlation coefficient (R) of 0.191 and weighted average of 2.8%. Similarly, the statistical analysis conducted on geographies consisting of 221,140,353 people shows a slight positive correlation between the proportion of Immigrants from Panama and percentage of population with self-care disability in the United States with a correlation coefficient (R) of 0.073 and weighted average of 2.6%, a difference of 8.0%.
Self-Care Disability Correlation Summary
| Measurement | Aleut | Immigrants from Panama |
| Minimum | 0.50% | 0.60% |
| Maximum | 20.0% | 6.0% |
| Range | 19.5% | 5.4% |
| Mean | 3.7% | 3.1% |
| Median | 2.6% | 3.0% |
| Interquartile 25% (IQ1) | 1.9% | 2.5% |
| Interquartile 75% (IQ3) | 3.5% | 3.7% |
| Interquartile Range (IQR) | 1.6% | 1.2% |
| Standard Deviation (Sample) | 4.2% | 1.2% |
| Standard Deviation (Population) | 4.1% | 1.2% |
Similar Demographics by Self-Care Disability
Demographics Similar to Aleuts by Self-Care Disability
In terms of self-care disability, the demographic groups most similar to Aleuts are Native/Alaskan (2.8%, a difference of 0.070%), Immigrants from Grenada (2.8%, a difference of 0.37%), Immigrants from West Indies (2.8%, a difference of 0.40%), Cree (2.8%, a difference of 0.45%), and Bangladeshi (2.8%, a difference of 0.52%).
| Demographics | Rating | Rank | Self-Care Disability |
| Immigrants | Guyana | 0.0 /100 | #299 | Tragic 2.8% |
| Immigrants | Fiji | 0.0 /100 | #300 | Tragic 2.8% |
| Pima | 0.0 /100 | #301 | Tragic 2.8% |
| Immigrants | St. Vincent and the Grenadines | 0.0 /100 | #302 | Tragic 2.8% |
| Immigrants | Belize | 0.0 /100 | #303 | Tragic 2.8% |
| Cree | 0.0 /100 | #304 | Tragic 2.8% |
| Immigrants | West Indies | 0.0 /100 | #305 | Tragic 2.8% |
| Aleuts | 0.0 /100 | #306 | Tragic 2.8% |
| Natives/Alaskans | 0.0 /100 | #307 | Tragic 2.8% |
| Immigrants | Grenada | 0.0 /100 | #308 | Tragic 2.8% |
| Bangladeshis | 0.0 /100 | #309 | Tragic 2.8% |
| British West Indians | 0.0 /100 | #310 | Tragic 2.8% |
| Puget Sound Salish | 0.0 /100 | #311 | Tragic 2.8% |
| Immigrants | Caribbean | 0.0 /100 | #312 | Tragic 2.8% |
| Spanish Americans | 0.0 /100 | #313 | Tragic 2.8% |
Demographics Similar to Immigrants from Panama by Self-Care Disability
In terms of self-care disability, the demographic groups most similar to Immigrants from Panama are Marshallese (2.6%, a difference of 0.030%), Senegalese (2.6%, a difference of 0.040%), Immigrants from Syria (2.6%, a difference of 0.20%), Immigrants from Senegal (2.6%, a difference of 0.31%), and Spanish (2.6%, a difference of 0.43%).
| Demographics | Rating | Rank | Self-Care Disability |
| Albanians | 2.2 /100 | #232 | Tragic 2.6% |
| Liberians | 2.1 /100 | #233 | Tragic 2.6% |
| Vietnamese | 2.1 /100 | #234 | Tragic 2.6% |
| Bahamians | 2.0 /100 | #235 | Tragic 2.6% |
| Bermudans | 1.9 /100 | #236 | Tragic 2.6% |
| Immigrants | Senegal | 1.6 /100 | #237 | Tragic 2.6% |
| Senegalese | 1.3 /100 | #238 | Tragic 2.6% |
| Immigrants | Panama | 1.2 /100 | #239 | Tragic 2.6% |
| Marshallese | 1.2 /100 | #240 | Tragic 2.6% |
| Immigrants | Syria | 1.0 /100 | #241 | Tragic 2.6% |
| Spanish | 0.8 /100 | #242 | Tragic 2.6% |
| Hawaiians | 0.8 /100 | #243 | Tragic 2.6% |
| Yuman | 0.8 /100 | #244 | Tragic 2.6% |
| Immigrants | Western Asia | 0.6 /100 | #245 | Tragic 2.6% |
| Cheyenne | 0.6 /100 | #246 | Tragic 2.6% |