Aleut vs Immigrants from Eastern Europe Self-Care Disability
COMPARE
Aleut
Immigrants from Eastern Europe
Self-Care Disability
Self-Care Disability Comparison
Aleuts
Immigrants from Eastern Europe
2.8%
SELF-CARE DISABILITY
0.0/ 100
METRIC RATING
306th/ 347
METRIC RANK
2.5%
SELF-CARE DISABILITY
28.0/ 100
METRIC RATING
189th/ 347
METRIC RANK
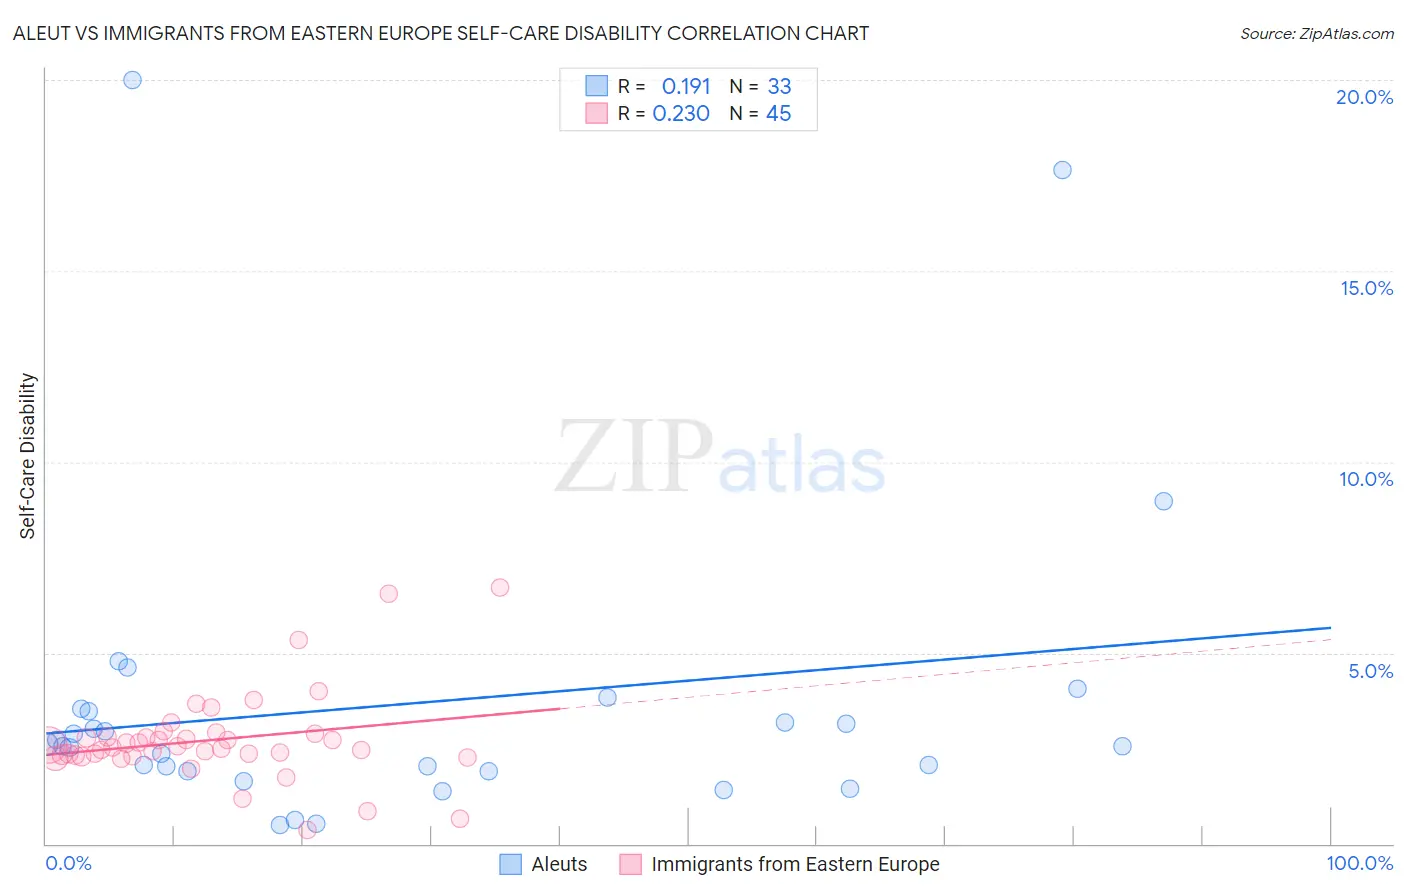
Aleut vs Immigrants from Eastern Europe Self-Care Disability Correlation Chart
The statistical analysis conducted on geographies consisting of 61,744,406 people shows a poor positive correlation between the proportion of Aleuts and percentage of population with self-care disability in the United States with a correlation coefficient (R) of 0.191 and weighted average of 2.8%. Similarly, the statistical analysis conducted on geographies consisting of 474,965,919 people shows a weak positive correlation between the proportion of Immigrants from Eastern Europe and percentage of population with self-care disability in the United States with a correlation coefficient (R) of 0.230 and weighted average of 2.5%, a difference of 12.4%.
Self-Care Disability Correlation Summary
| Measurement | Aleut | Immigrants from Eastern Europe |
| Minimum | 0.50% | 0.35% |
| Maximum | 20.0% | 6.7% |
| Range | 19.5% | 6.4% |
| Mean | 3.7% | 2.7% |
| Median | 2.6% | 2.5% |
| Interquartile 25% (IQ1) | 1.9% | 2.3% |
| Interquartile 75% (IQ3) | 3.5% | 2.8% |
| Interquartile Range (IQR) | 1.6% | 0.54% |
| Standard Deviation (Sample) | 4.2% | 1.2% |
| Standard Deviation (Population) | 4.1% | 1.2% |
Similar Demographics by Self-Care Disability
Demographics Similar to Aleuts by Self-Care Disability
In terms of self-care disability, the demographic groups most similar to Aleuts are Native/Alaskan (2.8%, a difference of 0.070%), Immigrants from Grenada (2.8%, a difference of 0.37%), Immigrants from West Indies (2.8%, a difference of 0.40%), Cree (2.8%, a difference of 0.45%), and Bangladeshi (2.8%, a difference of 0.52%).
| Demographics | Rating | Rank | Self-Care Disability |
| Immigrants | Guyana | 0.0 /100 | #299 | Tragic 2.8% |
| Immigrants | Fiji | 0.0 /100 | #300 | Tragic 2.8% |
| Pima | 0.0 /100 | #301 | Tragic 2.8% |
| Immigrants | St. Vincent and the Grenadines | 0.0 /100 | #302 | Tragic 2.8% |
| Immigrants | Belize | 0.0 /100 | #303 | Tragic 2.8% |
| Cree | 0.0 /100 | #304 | Tragic 2.8% |
| Immigrants | West Indies | 0.0 /100 | #305 | Tragic 2.8% |
| Aleuts | 0.0 /100 | #306 | Tragic 2.8% |
| Natives/Alaskans | 0.0 /100 | #307 | Tragic 2.8% |
| Immigrants | Grenada | 0.0 /100 | #308 | Tragic 2.8% |
| Bangladeshis | 0.0 /100 | #309 | Tragic 2.8% |
| British West Indians | 0.0 /100 | #310 | Tragic 2.8% |
| Puget Sound Salish | 0.0 /100 | #311 | Tragic 2.8% |
| Immigrants | Caribbean | 0.0 /100 | #312 | Tragic 2.8% |
| Spanish Americans | 0.0 /100 | #313 | Tragic 2.8% |
Demographics Similar to Immigrants from Eastern Europe by Self-Care Disability
In terms of self-care disability, the demographic groups most similar to Immigrants from Eastern Europe are Immigrants from Oceania (2.5%, a difference of 0.010%), Irish (2.5%, a difference of 0.040%), Sioux (2.5%, a difference of 0.21%), Immigrants from El Salvador (2.5%, a difference of 0.28%), and Moroccan (2.5%, a difference of 0.32%).
| Demographics | Rating | Rank | Self-Care Disability |
| Maltese | 37.5 /100 | #182 | Fair 2.5% |
| Salvadorans | 36.4 /100 | #183 | Fair 2.5% |
| Yugoslavians | 36.1 /100 | #184 | Fair 2.5% |
| Slavs | 34.3 /100 | #185 | Fair 2.5% |
| Immigrants | El Salvador | 33.0 /100 | #186 | Fair 2.5% |
| Irish | 28.7 /100 | #187 | Fair 2.5% |
| Immigrants | Oceania | 28.3 /100 | #188 | Fair 2.5% |
| Immigrants | Eastern Europe | 28.0 /100 | #189 | Fair 2.5% |
| Sioux | 24.6 /100 | #190 | Fair 2.5% |
| Moroccans | 22.9 /100 | #191 | Fair 2.5% |
| Soviet Union | 22.2 /100 | #192 | Fair 2.5% |
| Ukrainians | 21.4 /100 | #193 | Fair 2.5% |
| Immigrants | Germany | 17.9 /100 | #194 | Poor 2.5% |
| Immigrants | Southern Europe | 15.6 /100 | #195 | Poor 2.5% |
| Koreans | 15.5 /100 | #196 | Poor 2.5% |