Zip Codes with the Highest Percentage of Population Employed in Architecture & Engineering in Rhode Island

RELATED REPORTS & OPTIONS

Architecture & Engineering
Population
Families and Households
Female Fertility
Female Fertility (Unmarried)
Race (Community Size)
Race (Percentage)
Ancestry (Community Size)
AfghanAfricanAlaska NativeAlaskan AthabascanAlbanianAleutAlsatianAmericanApacheArabArapahoArgentineanArmenianAssyrian / Chaldean / SyriacAustralianAustrianBahamianBangladeshiBarbadianBasqueBelgianBelizeanBermudanBhutaneseBlackfeetBolivianBrazilianBritishBritish West IndianBulgarianBurmeseCajunCambodianCanadianCape VerdeanCarpatho RusynCelticCentral AmericanCentral American IndianCherokeeCheyenneChickasawChileanChineseChippewaChoctawColombianColvilleComancheCosta RicanCreeCreekCroatianCrowCubanCypriotCzechCzechoslovakianDanishDelawareDominicanDutchDutch West IndianEastern EuropeanEcuadorianEgyptianEnglishEstonianEthiopianEuropeanFijianFilipinoFinnishFrenchFrench American IndianFrench CanadianGermanGerman RussianGhanaianGreekGuamanian / ChamorroGuatemalanGuyaneseHaitianHmongHonduranHopiHoumaHungarianIcelanderIndian (Asian)IndonesianInupiatIranianIraqiIrishIroquoisIsraeliItalianJamaicanJapaneseJordanianKenyanKiowaKoreanLaotianLatvianLebaneseLiberianLithuanianLumbeeLuxembourgerMacedonianMalaysianMalteseMarshalleseMenomineeMexicanMexican American IndianMongolianMoroccanNative HawaiianNavajoNepaleseNew ZealanderNicaraguanNigerianNorthern EuropeanNorwegianOkinawanOsageOttawaPaiutePakistaniPalestinianPanamanianParaguayanPennsylvania GermanPeruvianPimaPolishPortuguesePotawatomiPuebloPuerto RicanPuget Sound SalishRomanianRussianSalvadoranSamoanScandinavianScotch-IrishScottishSeminoleSenegaleseSerbianShoshoneSierra LeoneanSiouxSlavicSlovakSloveneSomaliSouth AfricanSouth AmericanSouth American IndianSoviet UnionSpaniardSpanishSpanish AmericanSpanish American IndianSri LankanSubsaharan AfricanSudaneseSwedishSwissSyrianTaiwaneseThaiTlingit-HaidaTohono O'OdhamTonganTrinidadian and TobagonianTsimshianTurkishU.S. Virgin IslanderUgandanUkrainianUruguayanUteVenezuelanVietnameseWelshWest IndianYakamaYaquiYugoslavianYumanYup'ikZimbabwean
Ancestry (Percentage)
AfghanAfricanAlaska NativeAlaskan AthabascanAlbanianAleutAlsatianAmericanApacheArabArapahoArgentineanArmenianAssyrian / Chaldean / SyriacAustralianAustrianBahamianBangladeshiBarbadianBasqueBelgianBelizeanBermudanBhutaneseBlackfeetBolivianBrazilianBritishBritish West IndianBulgarianBurmeseCajunCambodianCanadianCape VerdeanCarpatho RusynCelticCentral AmericanCentral American IndianCherokeeCheyenneChickasawChileanChineseChippewaChoctawColombianColvilleComancheCosta RicanCreeCreekCroatianCrowCubanCypriotCzechCzechoslovakianDanishDelawareDominicanDutchDutch West IndianEastern EuropeanEcuadorianEgyptianEnglishEstonianEthiopianEuropeanFijianFilipinoFinnishFrenchFrench American IndianFrench CanadianGermanGerman RussianGhanaianGreekGuamanian / ChamorroGuatemalanGuyaneseHaitianHmongHonduranHopiHoumaHungarianIcelanderIndian (Asian)IndonesianInupiatIranianIraqiIrishIroquoisIsraeliItalianJamaicanJapaneseJordanianKenyanKiowaKoreanLaotianLatvianLebaneseLiberianLithuanianLumbeeLuxembourgerMacedonianMalaysianMalteseMarshalleseMenomineeMexicanMexican American IndianMongolianMoroccanNative HawaiianNavajoNepaleseNew ZealanderNicaraguanNigerianNorthern EuropeanNorwegianOkinawanOsageOttawaPaiutePakistaniPalestinianPanamanianParaguayanPennsylvania GermanPeruvianPimaPolishPortuguesePotawatomiPuebloPuerto RicanPuget Sound SalishRomanianRussianSalvadoranSamoanScandinavianScotch-IrishScottishSeminoleSenegaleseSerbianShoshoneSierra LeoneanSiouxSlavicSlovakSloveneSomaliSouth AfricanSouth AmericanSouth American IndianSoviet UnionSpaniardSpanishSpanish AmericanSpanish American IndianSri LankanSubsaharan AfricanSudaneseSwedishSwissSyrianTaiwaneseThaiTlingit-HaidaTohono O'OdhamTonganTrinidadian and TobagonianTsimshianTurkishU.S. Virgin IslanderUgandanUkrainianUruguayanUteVenezuelanVietnameseWelshWest IndianYakamaYaquiYugoslavianYumanYup'ikZimbabwean
Immigrant Origin (Total)
AfghanistanAfricaAlbaniaArgentinaArmeniaAsiaAustraliaAustriaAzoresBahamasBangladeshBarbadosBelarusBelgiumBelizeBoliviaBosnia and HerzegovinaBrazilBulgariaBurma / MyanmarCabo VerdeCambodiaCameroonCanadaCaribbeanCentral AmericaChileChinaColombiaCongoCosta RicaCroatiaCubaCzechoslovakiaDenmarkDominicaDominican RepublicEastern AfricaEastern AsiaEastern EuropeEcuadorEgyptEl SalvadorEnglandEritreaEthiopiaEuropeFijiFranceGermanyGhanaGreeceGrenadaGuatemalaGuyanaHaitiHondurasHong KongHungaryIndiaIndonesiaIranIraqIrelandIsraelItalyJamaicaJapanJordanKazakhstanKenyaKoreaKuwaitLaosLatin AmericaLatviaLebanonLiberiaLithuaniaMalaysiaMexicoMicronesiaMiddle AfricaMoldovaMoroccoNepalNetherlandsNicaraguaNigeriaNorth MacedoniaNorthern AfricaNorthern EuropeNorwayOceaniaPakistanPanamaPeruPhilippinesPolandPortugalRomaniaRussiaSaudi ArabiaScotlandSenegalSerbiaSierra LeoneSingaporeSomaliaSouth AfricaSouth AmericaSouth Central AsiaSouth Eastern AsiaSouthern EuropeSpainSri LankaSt. Vincent and the GrenadinesSudanSwedenSwitzerlandSyriaTaiwanThailandTrinidad and TobagoTurkeyUgandaUkraineUruguayUzbekistanVenezuelaVietnamWest IndiesWestern AfricaWestern AsiaWestern EuropeYemenZaireZimbabwe
Immigrant Origin (Percentage)
AfghanistanAfricaAlbaniaArgentinaArmeniaAsiaAustraliaAustriaAzoresBahamasBangladeshBarbadosBelarusBelgiumBelizeBoliviaBosnia and HerzegovinaBrazilBulgariaBurma / MyanmarCabo VerdeCambodiaCameroonCanadaCaribbeanCentral AmericaChileChinaColombiaCongoCosta RicaCroatiaCubaCzechoslovakiaDenmarkDominicaDominican RepublicEastern AfricaEastern AsiaEastern EuropeEcuadorEgyptEl SalvadorEnglandEritreaEthiopiaEuropeFijiFranceGermanyGhanaGreeceGrenadaGuatemalaGuyanaHaitiHondurasHong KongHungaryIndiaIndonesiaIranIraqIrelandIsraelItalyJamaicaJapanJordanKazakhstanKenyaKoreaKuwaitLaosLatin AmericaLatviaLebanonLiberiaLithuaniaMalaysiaMexicoMicronesiaMiddle AfricaMoldovaMoroccoNepalNetherlandsNicaraguaNigeriaNorth MacedoniaNorthern AfricaNorthern EuropeNorwayOceaniaPakistanPanamaPeruPhilippinesPolandPortugalRomaniaRussiaSaudi ArabiaScotlandSenegalSerbiaSierra LeoneSingaporeSomaliaSouth AfricaSouth AmericaSouth Central AsiaSouth Eastern AsiaSouthern EuropeSpainSri LankaSt. Vincent and the GrenadinesSudanSwedenSwitzerlandSyriaTaiwanThailandTrinidad and TobagoTurkeyUgandaUkraineUruguayUzbekistanVenezuelaVietnamWest IndiesWestern AfricaWestern AsiaWestern EuropeYemenZaireZimbabwe
Income
Income (Families)
Income (Households)
Poverty
Poverty (Families)
Unemployment
Employment Occupations
Employment Industries
Employer Class
Commute Time
Commute Means
School Enrollment
Education by Degree Field
Occupancy
Finances
Physical Characteristics
Rhode Island
Compare Zip Codes
Comparison Subject

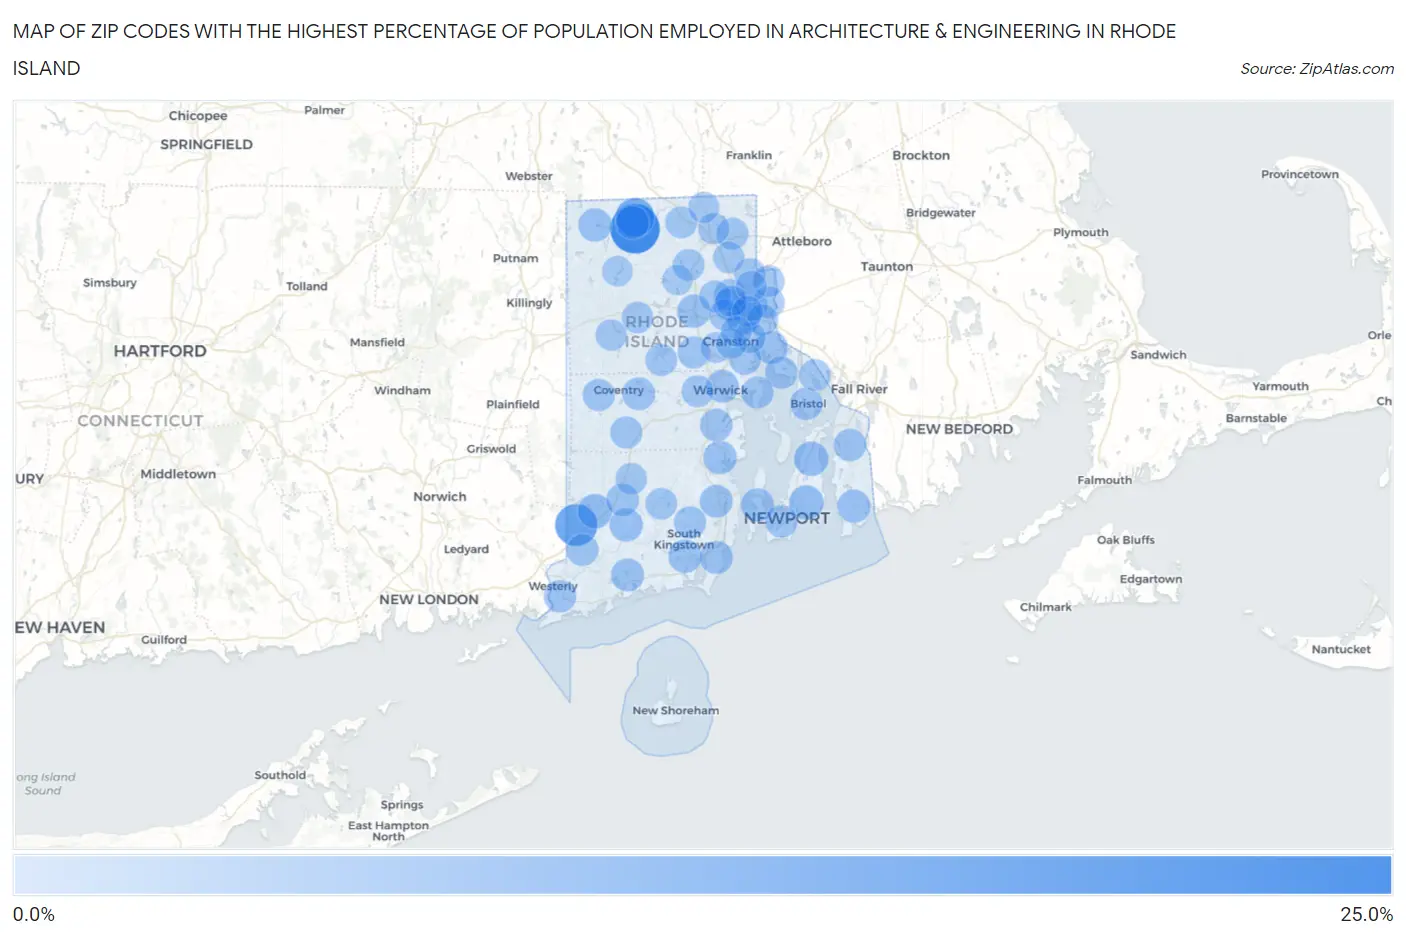
Map of Zip Codes with the Highest Percentage of Population Employed in Architecture & Engineering in Rhode Island

0.0%
25.0%
Zip Codes with the Highest Percentage of Population Employed in Architecture & Engineering in Rhode Island Map

Zip Codes with the Highest Percentage of Population Employed in Architecture & Engineering in Rhode Island

Zip Code % Employed vs State vs National
1.0285823.8%2.2%(+21.7)#12.1%(+21.7)#72
2.0283314.4%2.2%(+12.2)#22.1%(+12.3)#158
3.0282610.7%2.2%(+8.47)#32.1%(+8.51)#300
4.028425.1%2.2%(+2.88)#42.1%(+2.92)#1,614
5.028325.0%2.2%(+2.80)#52.1%(+2.84)#1,671
6.028714.9%2.2%(+2.67)#62.1%(+2.71)#1,777
7.029034.2%2.2%(+2.04)#72.1%(+2.08)#2,461
8.028593.9%2.2%(+1.66)#82.1%(+1.70)#3,004
9.028523.8%2.2%(+1.65)#92.1%(+1.69)#3,017
10.028793.8%2.2%(+1.56)#102.1%(+1.60)#3,195
11.028303.7%2.2%(+1.48)#112.1%(+1.52)#3,363
12.029193.6%2.2%(+1.42)#122.1%(+1.46)#3,493
13.028373.5%2.2%(+1.35)#132.1%(+1.39)#3,649
14.028123.5%2.2%(+1.35)#142.1%(+1.39)#3,653
15.028353.5%2.2%(+1.34)#152.1%(+1.37)#3,670
16.029153.3%2.2%(+1.14)#162.1%(+1.17)#4,141
17.028823.2%2.2%(+1.02)#172.1%(+1.06)#4,443
18.028133.2%2.2%(+0.979)#182.1%(+1.02)#4,551
19.028743.1%2.2%(+0.910)#192.1%(+0.949)#4,746
20.028863.0%2.2%(+0.805)#202.1%(+0.844)#5,076
21.028983.0%2.2%(+0.769)#212.1%(+0.808)#5,208
22.028163.0%2.2%(+0.767)#222.1%(+0.806)#5,217
23.028182.8%2.2%(+0.630)#232.1%(+0.668)#5,718
24.028912.7%2.2%(+0.551)#242.1%(+0.590)#6,005
25.028782.7%2.2%(+0.527)#252.1%(+0.566)#6,100
26.028092.7%2.2%(+0.489)#262.1%(+0.528)#6,256
27.028062.7%2.2%(+0.481)#272.1%(+0.520)#6,294
28.029082.6%2.2%(+0.458)#282.1%(+0.497)#6,385
29.028812.4%2.2%(+0.259)#292.1%(+0.298)#7,243
30.028272.4%2.2%(+0.202)#302.1%(+0.241)#7,520
31.028402.4%2.2%(+0.195)#312.1%(+0.233)#7,557
32.029212.4%2.2%(+0.166)#322.1%(+0.205)#7,699
33.028882.3%2.2%(+0.101)#332.1%(+0.140)#8,004
34.028172.2%2.2%(+0.024)#342.1%(+0.063)#8,426
35.028892.2%2.2%(+0.000)#352.1%(+0.039)#8,539
36.028042.1%2.2%(-0.043)#362.1%(-0.004)#8,790
37.029062.1%2.2%(-0.088)#372.1%(-0.049)#9,043
38.028642.0%2.2%(-0.190)#382.1%(-0.152)#9,619
39.029042.0%2.2%(-0.207)#392.1%(-0.168)#9,731
40.028962.0%2.2%(-0.226)#402.1%(-0.188)#9,837
41.028932.0%2.2%(-0.236)#412.1%(-0.197)#9,904
42.029171.9%2.2%(-0.252)#422.1%(-0.214)#10,012
43.028311.9%2.2%(-0.255)#432.1%(-0.217)#10,030
44.029111.9%2.2%(-0.317)#442.1%(-0.278)#10,426
45.029091.8%2.2%(-0.360)#452.1%(-0.321)#10,673
46.028851.8%2.2%(-0.408)#462.1%(-0.369)#10,954
47.028921.6%2.2%(-0.542)#472.1%(-0.503)#11,865
48.029161.6%2.2%(-0.579)#482.1%(-0.540)#12,130
49.029181.5%2.2%(-0.651)#492.1%(-0.612)#12,603
50.028221.5%2.2%(-0.695)#502.1%(-0.657)#12,935
51.028611.5%2.2%(-0.699)#512.1%(-0.661)#12,967
52.029141.4%2.2%(-0.759)#522.1%(-0.721)#13,361
53.028251.4%2.2%(-0.778)#532.1%(-0.740)#13,520
54.028571.4%2.2%(-0.834)#542.1%(-0.795)#13,929
55.028631.2%2.2%(-0.977)#552.1%(-0.939)#15,000
56.029051.2%2.2%(-0.991)#562.1%(-0.953)#15,104
57.028651.2%2.2%(-1.04)#572.1%(-0.997)#15,461
58.028381.1%2.2%(-1.05)#582.1%(-1.01)#15,583
59.028950.98%2.2%(-1.20)#592.1%(-1.17)#16,721
60.029200.87%2.2%(-1.32)#602.1%(-1.28)#17,596
61.028600.78%2.2%(-1.41)#612.1%(-1.37)#18,274
62.029120.67%2.2%(-1.52)#622.1%(-1.48)#19,122
63.029100.53%2.2%(-1.66)#632.1%(-1.62)#20,081
64.029070.52%2.2%(-1.67)#642.1%(-1.63)#20,129
65.028140.52%2.2%(-1.67)#652.1%(-1.63)#20,150
66.028280.40%2.2%(-1.78)#662.1%(-1.74)#20,918

Common Questions

What are the Top 10 Zip Codes with the Highest Percentage of Population Employed in Architecture & Engineering in Rhode Island?
Top 10 Zip Codes with the Highest Percentage of Population Employed in Architecture & Engineering in Rhode Island are:
#1
23.8%
#2
14.4%
#3
10.7%
#4
5.1%
#5
5.0%
#6
4.9%
#7
4.2%
#8
3.9%
#9
3.8%
#10
3.8%
What zip code has the Highest Percentage of Population Employed in Architecture & Engineering in Rhode Island?
02858 has the Highest Percentage of Population Employed in Architecture & Engineering in Rhode Island with 23.8%.
What is the Percentage of Population Employed in Architecture & Engineering in the State of Rhode Island?
Percentage of Population Employed in Architecture & Engineering in Rhode Island is 2.2%.
What is the Percentage of Population Employed in Architecture & Engineering in the United States?
Percentage of Population Employed in Architecture & Engineering in the United States is 2.1%.