Zip Codes with the Highest Percentage of Population Employed in Architecture & Engineering in Montana
RELATED REPORTS & OPTIONS
Architecture & Engineering
Montana
Compare Zip Codes
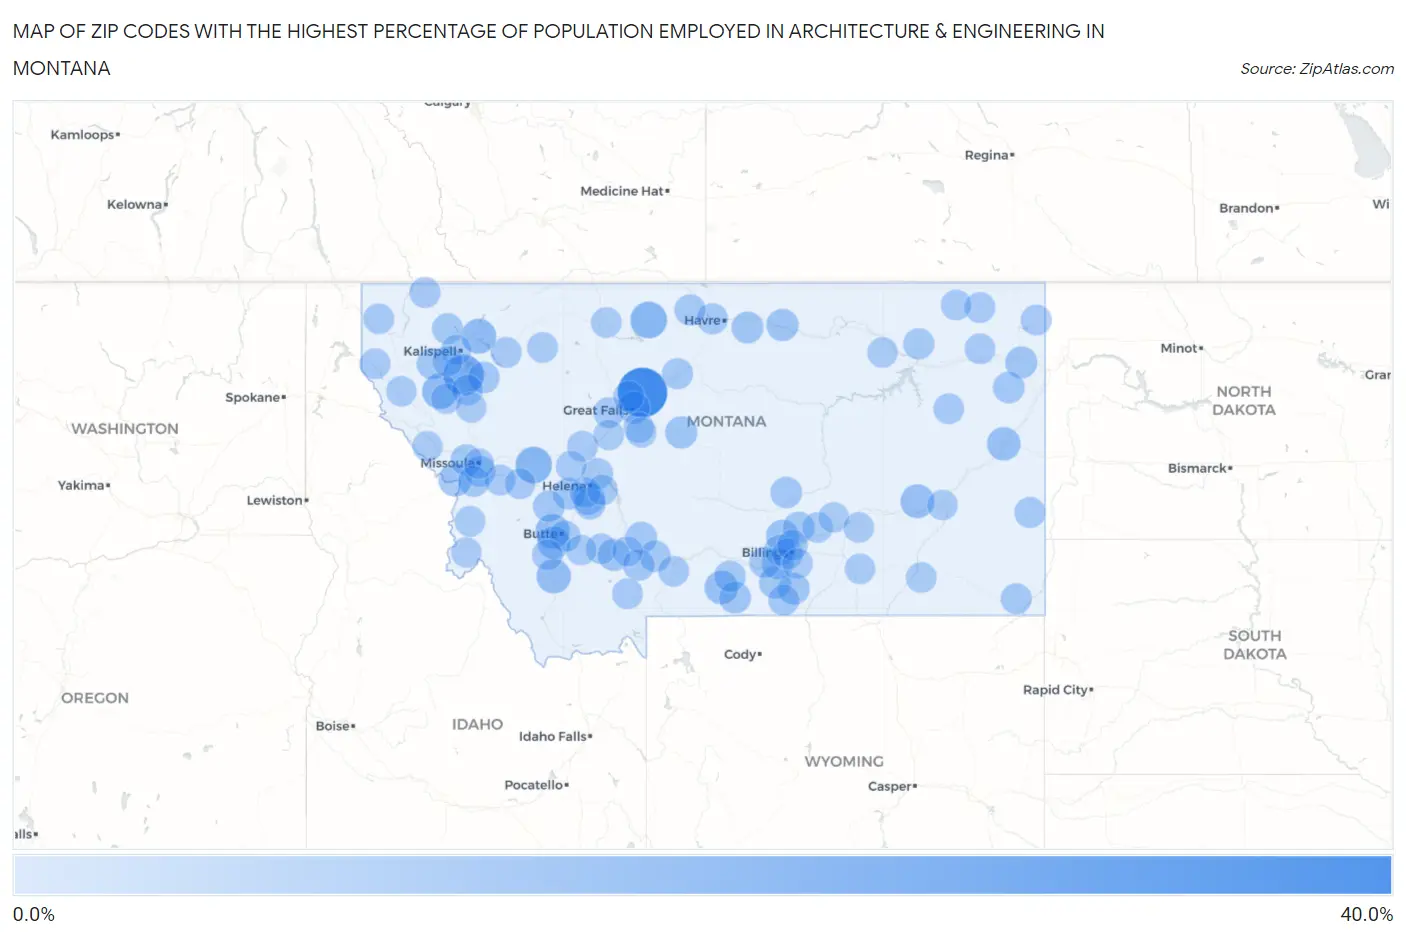
Map of Zip Codes with the Highest Percentage of Population Employed in Architecture & Engineering in Montana
0.0%
40.0%
Zip Codes with the Highest Percentage of Population Employed in Architecture & Engineering in Montana
| Zip Code | % Employed | vs State | vs National | |
| 1. | 59440 | 34.8% | 1.8%(+33.1)#1 | 2.1%(+32.7)#45 |
| 2. | 59931 | 18.4% | 1.8%(+16.6)#2 | 2.1%(+16.2)#108 |
| 3. | 59522 | 12.0% | 1.8%(+10.2)#3 | 2.1%(+9.82)#242 |
| 4. | 59843 | 11.8% | 1.8%(+10.1)#4 | 2.1%(+9.69)#249 |
| 5. | 59848 | 10.0% | 1.8%(+8.25)#5 | 2.1%(+7.85)#342 |
| 6. | 59926 | 8.9% | 1.8%(+7.14)#6 | 2.1%(+6.74)#435 |
| 7. | 59732 | 8.1% | 1.8%(+6.33)#7 | 2.1%(+5.94)#556 |
| 8. | 59748 | 7.8% | 1.8%(+6.06)#8 | 2.1%(+5.66)#606 |
| 9. | 59347 | 7.0% | 1.8%(+5.24)#9 | 2.1%(+4.84)#751 |
| 10. | 59028 | 6.5% | 1.8%(+4.72)#10 | 2.1%(+4.32)#901 |
| 11. | 59330 | 6.4% | 1.8%(+4.61)#11 | 2.1%(+4.21)#940 |
| 12. | 59847 | 5.9% | 1.8%(+4.16)#12 | 2.1%(+3.76)#1,123 |
| 13. | 59002 | 5.5% | 1.8%(+3.74)#13 | 2.1%(+3.35)#1,324 |
| 14. | 59750 | 5.4% | 1.8%(+3.67)#14 | 2.1%(+3.27)#1,372 |
| 15. | 59414 | 4.4% | 1.8%(+2.68)#15 | 2.1%(+2.29)#2,211 |
| 16. | 59447 | 4.4% | 1.8%(+2.65)#16 | 2.1%(+2.25)#2,254 |
| 17. | 59634 | 4.3% | 1.8%(+2.57)#17 | 2.1%(+2.17)#2,350 |
| 18. | 59526 | 4.3% | 1.8%(+2.53)#18 | 2.1%(+2.13)#2,386 |
| 19. | 59218 | 4.0% | 1.8%(+2.29)#19 | 2.1%(+1.90)#2,709 |
| 20. | 59029 | 3.9% | 1.8%(+2.11)#20 | 2.1%(+1.72)#2,987 |
| 21. | 59760 | 3.8% | 1.8%(+2.01)#21 | 2.1%(+1.61)#3,179 |
| 22. | 59523 | 3.7% | 1.8%(+1.97)#22 | 2.1%(+1.57)#3,247 |
| 23. | 59068 | 3.6% | 1.8%(+1.89)#23 | 2.1%(+1.49)#3,426 |
| 24. | 59066 | 3.5% | 1.8%(+1.72)#24 | 2.1%(+1.33)#3,789 |
| 25. | 59728 | 3.5% | 1.8%(+1.71)#25 | 2.1%(+1.32)#3,819 |
| 26. | 59911 | 3.3% | 1.8%(+1.58)#26 | 2.1%(+1.18)#4,122 |
| 27. | 59925 | 3.3% | 1.8%(+1.52)#27 | 2.1%(+1.13)#4,255 |
| 28. | 59243 | 3.2% | 1.8%(+1.41)#28 | 2.1%(+1.02)#4,549 |
| 29. | 59044 | 3.1% | 1.8%(+1.39)#29 | 2.1%(+0.990)#4,628 |
| 30. | 59714 | 3.1% | 1.8%(+1.37)#30 | 2.1%(+0.979)#4,658 |
| 31. | 59079 | 3.1% | 1.8%(+1.35)#31 | 2.1%(+0.952)#4,743 |
| 32. | 59072 | 3.1% | 1.8%(+1.33)#32 | 2.1%(+0.936)#4,781 |
| 33. | 59001 | 3.0% | 1.8%(+1.29)#33 | 2.1%(+0.895)#4,913 |
| 34. | 59722 | 3.0% | 1.8%(+1.24)#34 | 2.1%(+0.841)#5,089 |
| 35. | 59715 | 3.0% | 1.8%(+1.21)#35 | 2.1%(+0.811)#5,196 |
| 36. | 59718 | 2.9% | 1.8%(+1.17)#36 | 2.1%(+0.776)#5,335 |
| 37. | 59638 | 2.8% | 1.8%(+1.06)#37 | 2.1%(+0.668)#5,724 |
| 38. | 59804 | 2.8% | 1.8%(+1.03)#38 | 2.1%(+0.639)#5,828 |
| 39. | 59106 | 2.7% | 1.8%(+0.914)#39 | 2.1%(+0.518)#6,300 |
| 40. | 59063 | 2.6% | 1.8%(+0.850)#40 | 2.1%(+0.455)#6,563 |
| 41. | 59701 | 2.6% | 1.8%(+0.805)#41 | 2.1%(+0.410)#6,749 |
| 42. | 59602 | 2.4% | 1.8%(+0.643)#42 | 2.1%(+0.247)#7,489 |
| 43. | 59803 | 2.4% | 1.8%(+0.627)#43 | 2.1%(+0.232)#7,561 |
| 44. | 59601 | 2.4% | 1.8%(+0.605)#44 | 2.1%(+0.209)#7,674 |
| 45. | 59248 | 2.3% | 1.8%(+0.577)#45 | 2.1%(+0.182)#7,797 |
| 46. | 59833 | 2.3% | 1.8%(+0.545)#46 | 2.1%(+0.150)#7,944 |
| 47. | 59501 | 2.3% | 1.8%(+0.540)#47 | 2.1%(+0.145)#7,982 |
| 48. | 59525 | 2.2% | 1.8%(+0.493)#48 | 2.1%(+0.098)#8,215 |
| 49. | 59014 | 2.2% | 1.8%(+0.481)#49 | 2.1%(+0.085)#8,283 |
| 50. | 59442 | 2.2% | 1.8%(+0.443)#50 | 2.1%(+0.047)#8,490 |
| 51. | 59311 | 2.2% | 1.8%(+0.420)#51 | 2.1%(+0.025)#8,642 |
| 52. | 59313 | 2.1% | 1.8%(+0.361)#52 | 2.1%(-0.035)#8,954 |
| 53. | 59937 | 2.1% | 1.8%(+0.339)#53 | 2.1%(-0.056)#9,086 |
| 54. | 59825 | 2.0% | 1.8%(+0.296)#54 | 2.1%(-0.100)#9,319 |
| 55. | 59860 | 2.0% | 1.8%(+0.261)#55 | 2.1%(-0.135)#9,523 |
| 56. | 59727 | 1.9% | 1.8%(+0.194)#56 | 2.1%(-0.201)#9,929 |
| 57. | 59102 | 1.9% | 1.8%(+0.177)#57 | 2.1%(-0.218)#10,040 |
| 58. | 59917 | 1.9% | 1.8%(+0.169)#58 | 2.1%(-0.226)#10,081 |
| 59. | 59853 | 1.9% | 1.8%(+0.121)#59 | 2.1%(-0.274)#10,405 |
| 60. | 59648 | 1.8% | 1.8%(+0.087)#60 | 2.1%(-0.309)#10,610 |
| 61. | 59222 | 1.8% | 1.8%(+0.081)#61 | 2.1%(-0.314)#10,639 |
| 62. | 59219 | 1.8% | 1.8%(+0.064)#62 | 2.1%(-0.331)#10,728 |
| 63. | 59721 | 1.8% | 1.8%(+0.024)#63 | 2.1%(-0.371)#10,963 |
| 64. | 59448 | 1.8% | 1.8%(+0.016)#64 | 2.1%(-0.379)#11,009 |
| 65. | 59047 | 1.8% | 1.8%(-0.002)#65 | 2.1%(-0.398)#11,143 |
| 66. | 59483 | 1.7% | 1.8%(-0.020)#66 | 2.1%(-0.415)#11,265 |
| 67. | 59633 | 1.7% | 1.8%(-0.020)#67 | 2.1%(-0.415)#11,266 |
| 68. | 59935 | 1.7% | 1.8%(-0.044)#68 | 2.1%(-0.440)#11,423 |
| 69. | 59404 | 1.7% | 1.8%(-0.048)#69 | 2.1%(-0.443)#11,448 |
| 70. | 59936 | 1.7% | 1.8%(-0.059)#70 | 2.1%(-0.454)#11,532 |
| 71. | 59105 | 1.7% | 1.8%(-0.063)#71 | 2.1%(-0.458)#11,565 |
| 72. | 59215 | 1.7% | 1.8%(-0.096)#72 | 2.1%(-0.492)#11,779 |
| 73. | 59405 | 1.6% | 1.8%(-0.106)#73 | 2.1%(-0.501)#11,846 |
| 74. | 59255 | 1.6% | 1.8%(-0.107)#74 | 2.1%(-0.502)#11,856 |
| 75. | 59716 | 1.6% | 1.8%(-0.108)#75 | 2.1%(-0.504)#11,867 |
| 76. | 59832 | 1.6% | 1.8%(-0.151)#76 | 2.1%(-0.547)#12,167 |
| 77. | 59088 | 1.6% | 1.8%(-0.199)#77 | 2.1%(-0.594)#12,469 |
| 78. | 59474 | 1.5% | 1.8%(-0.229)#78 | 2.1%(-0.624)#12,683 |
| 79. | 59263 | 1.5% | 1.8%(-0.239)#79 | 2.1%(-0.634)#12,776 |
| 80. | 59873 | 1.5% | 1.8%(-0.268)#80 | 2.1%(-0.663)#12,993 |
| 81. | 59003 | 1.5% | 1.8%(-0.294)#81 | 2.1%(-0.689)#13,160 |
| 82. | 59840 | 1.4% | 1.8%(-0.351)#82 | 2.1%(-0.746)#13,559 |
| 83. | 59421 | 1.4% | 1.8%(-0.352)#83 | 2.1%(-0.747)#13,568 |
| 84. | 59635 | 1.4% | 1.8%(-0.356)#84 | 2.1%(-0.751)#13,598 |
| 85. | 59024 | 1.4% | 1.8%(-0.374)#85 | 2.1%(-0.770)#13,740 |
| 86. | 59038 | 1.4% | 1.8%(-0.393)#86 | 2.1%(-0.789)#13,876 |
| 87. | 59901 | 1.3% | 1.8%(-0.410)#87 | 2.1%(-0.806)#14,001 |
| 88. | 59101 | 1.3% | 1.8%(-0.426)#88 | 2.1%(-0.822)#14,120 |
| 89. | 59801 | 1.3% | 1.8%(-0.435)#89 | 2.1%(-0.830)#14,190 |
| 90. | 59480 | 1.3% | 1.8%(-0.438)#90 | 2.1%(-0.833)#14,209 |
| 91. | 59759 | 1.3% | 1.8%(-0.485)#91 | 2.1%(-0.880)#14,533 |
| 92. | 59022 | 1.2% | 1.8%(-0.510)#92 | 2.1%(-0.905)#14,728 |
| 93. | 59845 | 1.2% | 1.8%(-0.552)#93 | 2.1%(-0.947)#15,055 |
| 94. | 59230 | 1.2% | 1.8%(-0.556)#94 | 2.1%(-0.951)#15,090 |
| 95. | 59741 | 1.2% | 1.8%(-0.556)#95 | 2.1%(-0.951)#15,093 |
| 96. | 59864 | 1.2% | 1.8%(-0.566)#96 | 2.1%(-0.962)#15,183 |
| 97. | 59301 | 1.1% | 1.8%(-0.632)#97 | 2.1%(-1.03)#15,671 |
| 98. | 59920 | 1.1% | 1.8%(-0.640)#98 | 2.1%(-1.04)#15,735 |
| 99. | 59872 | 1.1% | 1.8%(-0.645)#99 | 2.1%(-1.04)#15,787 |
| 100. | 59829 | 1.1% | 1.8%(-0.676)#100 | 2.1%(-1.07)#16,039 |
Common Questions
What are the Top 10 Zip Codes with the Highest Percentage of Population Employed in Architecture & Engineering in Montana?
Top 10 Zip Codes with the Highest Percentage of Population Employed in Architecture & Engineering in Montana are:
What zip code has the Highest Percentage of Population Employed in Architecture & Engineering in Montana?
59440 has the Highest Percentage of Population Employed in Architecture & Engineering in Montana with 34.8%.
What is the Percentage of Population Employed in Architecture & Engineering in the State of Montana?
Percentage of Population Employed in Architecture & Engineering in Montana is 1.8%.
What is the Percentage of Population Employed in Architecture & Engineering in the United States?
Percentage of Population Employed in Architecture & Engineering in the United States is 2.1%.