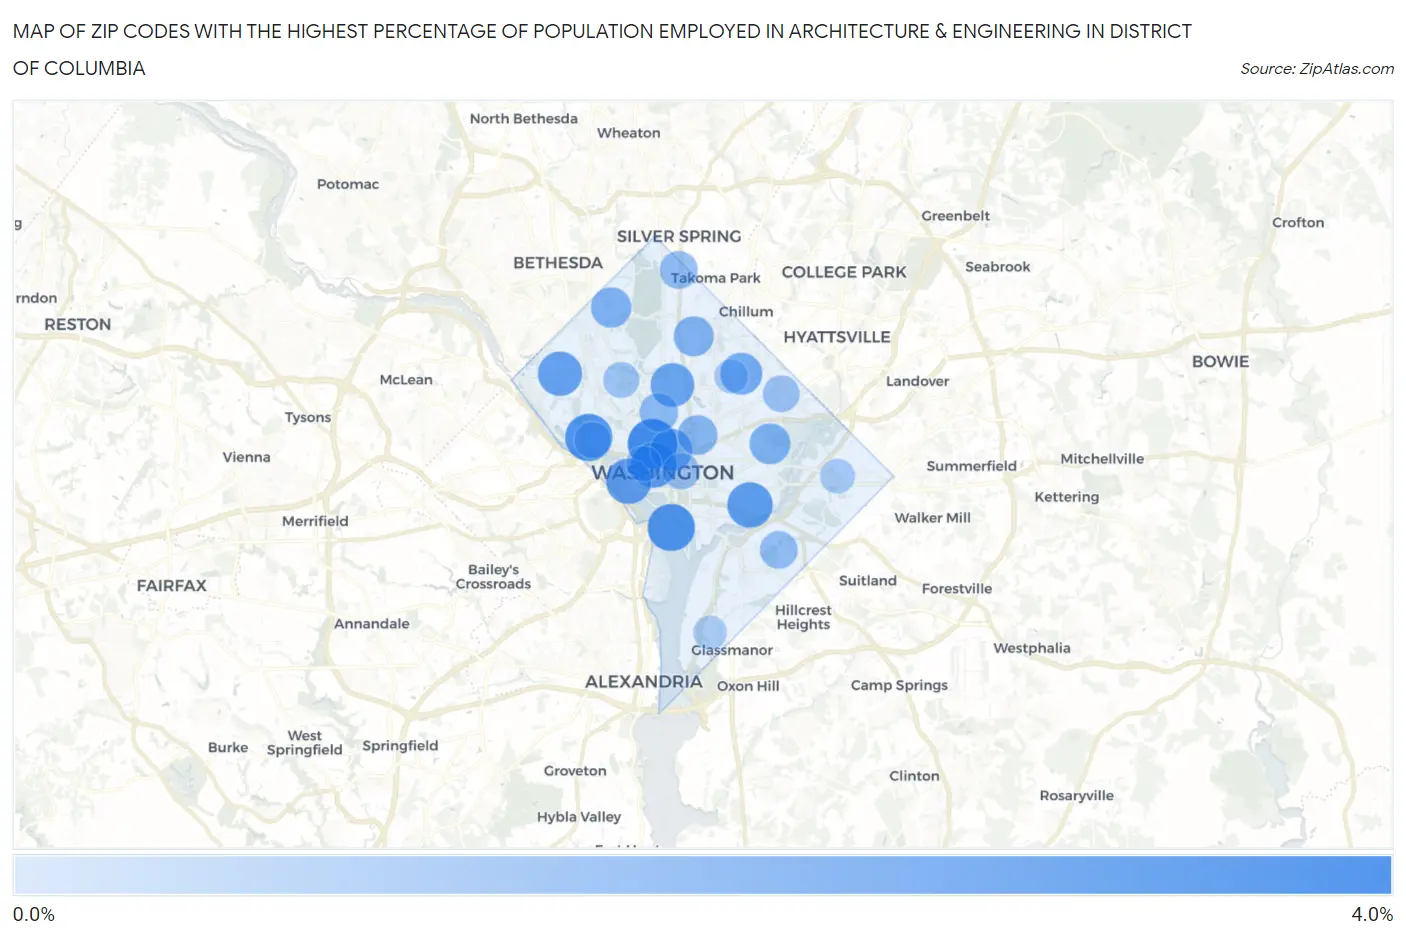
Zip Codes with the Highest Percentage of Population Employed in Architecture & Engineering in District Of Columbia
RELATED REPORTS & OPTIONS
Architecture & Engineering
District Of Columbia
Compare Zip Codes
Map of Zip Codes with the Highest Percentage of Population Employed in Architecture & Engineering in District Of Columbia
0.0%
4.0%
Zip Codes with the Highest Percentage of Population Employed in Architecture & Engineering in District Of Columbia
| Zip Code | % Employed | vs State | vs National | |
| 1. | 20036 | 3.2% | 1.7%(+1.54)#1 | 2.1%(+1.06)#4,430 |
| 2. | 20007 | 2.8% | 1.7%(+1.16)#2 | 2.1%(+0.681)#5,664 |
| 3. | 20024 | 2.8% | 1.7%(+1.15)#3 | 2.1%(+0.675)#5,685 |
| 4. | 20006 | 2.5% | 1.7%(+0.864)#4 | 2.1%(+0.387)#6,851 |
| 5. | 20003 | 2.5% | 1.7%(+0.857)#5 | 2.1%(+0.380)#6,873 |
| 6. | 20037 | 2.5% | 1.7%(+0.832)#6 | 2.1%(+0.355)#6,975 |
| 7. | 20016 | 2.3% | 1.7%(+0.649)#7 | 2.1%(+0.172)#7,845 |
| 8. | 20010 | 2.2% | 1.7%(+0.568)#8 | 2.1%(+0.091)#8,247 |
| 9. | 20005 | 2.0% | 1.7%(+0.317)#9 | 2.1%(-0.160)#9,683 |
| 10. | 20017 | 1.9% | 1.7%(+0.266)#10 | 2.1%(-0.211)#9,988 |
| 11. | 20002 | 1.8% | 1.7%(+0.081)#11 | 2.1%(-0.396)#11,120 |
| 12. | 20015 | 1.7% | 1.7%(+0.020)#12 | 2.1%(-0.458)#11,553 |
| 13. | 20011 | 1.6% | 1.7%(-0.048)#13 | 2.1%(-0.525)#12,012 |
| 14. | 20001 | 1.6% | 1.7%(-0.116)#14 | 2.1%(-0.593)#12,463 |
| 15. | 20009 | 1.4% | 1.7%(-0.267)#15 | 2.1%(-0.744)#13,548 |
| 16. | 20012 | 1.3% | 1.7%(-0.412)#16 | 2.1%(-0.889)#14,599 |
| 17. | 20020 | 1.2% | 1.7%(-0.439)#17 | 2.1%(-0.916)#14,818 |
| 18. | 20018 | 1.1% | 1.7%(-0.591)#18 | 2.1%(-1.07)#16,016 |
| 19. | 20004 | 1.1% | 1.7%(-0.617)#19 | 2.1%(-1.09)#16,210 |
| 20. | 20057 | 1.1% | 1.7%(-0.621)#20 | 2.1%(-1.10)#16,236 |
| 21. | 20008 | 0.95% | 1.7%(-0.727)#21 | 2.1%(-1.20)#17,008 |
| 22. | 20052 | 0.87% | 1.7%(-0.803)#22 | 2.1%(-1.28)#17,599 |
| 23. | 20019 | 0.73% | 1.7%(-0.938)#23 | 2.1%(-1.41)#18,653 |
| 24. | 20064 | 0.63% | 1.7%(-1.04)#24 | 2.1%(-1.52)#19,407 |
| 25. | 20032 | 0.59% | 1.7%(-1.08)#25 | 2.1%(-1.56)#19,663 |
1
Common Questions
What are the Top 10 Zip Codes with the Highest Percentage of Population Employed in Architecture & Engineering in District Of Columbia?
Top 10 Zip Codes with the Highest Percentage of Population Employed in Architecture & Engineering in District Of Columbia are:
What zip code has the Highest Percentage of Population Employed in Architecture & Engineering in District Of Columbia?
20036 has the Highest Percentage of Population Employed in Architecture & Engineering in District Of Columbia with 3.2%.
What is the Percentage of Population Employed in Architecture & Engineering in the State of District Of Columbia?
Percentage of Population Employed in Architecture & Engineering in District Of Columbia is 1.7%.
What is the Percentage of Population Employed in Architecture & Engineering in the United States?
Percentage of Population Employed in Architecture & Engineering in the United States is 2.1%.