Zip Codes with the Highest Percentage of Population Employed in Architecture & Engineering in Pennsylvania
RELATED REPORTS & OPTIONS
Architecture & Engineering
Pennsylvania
Compare Zip Codes
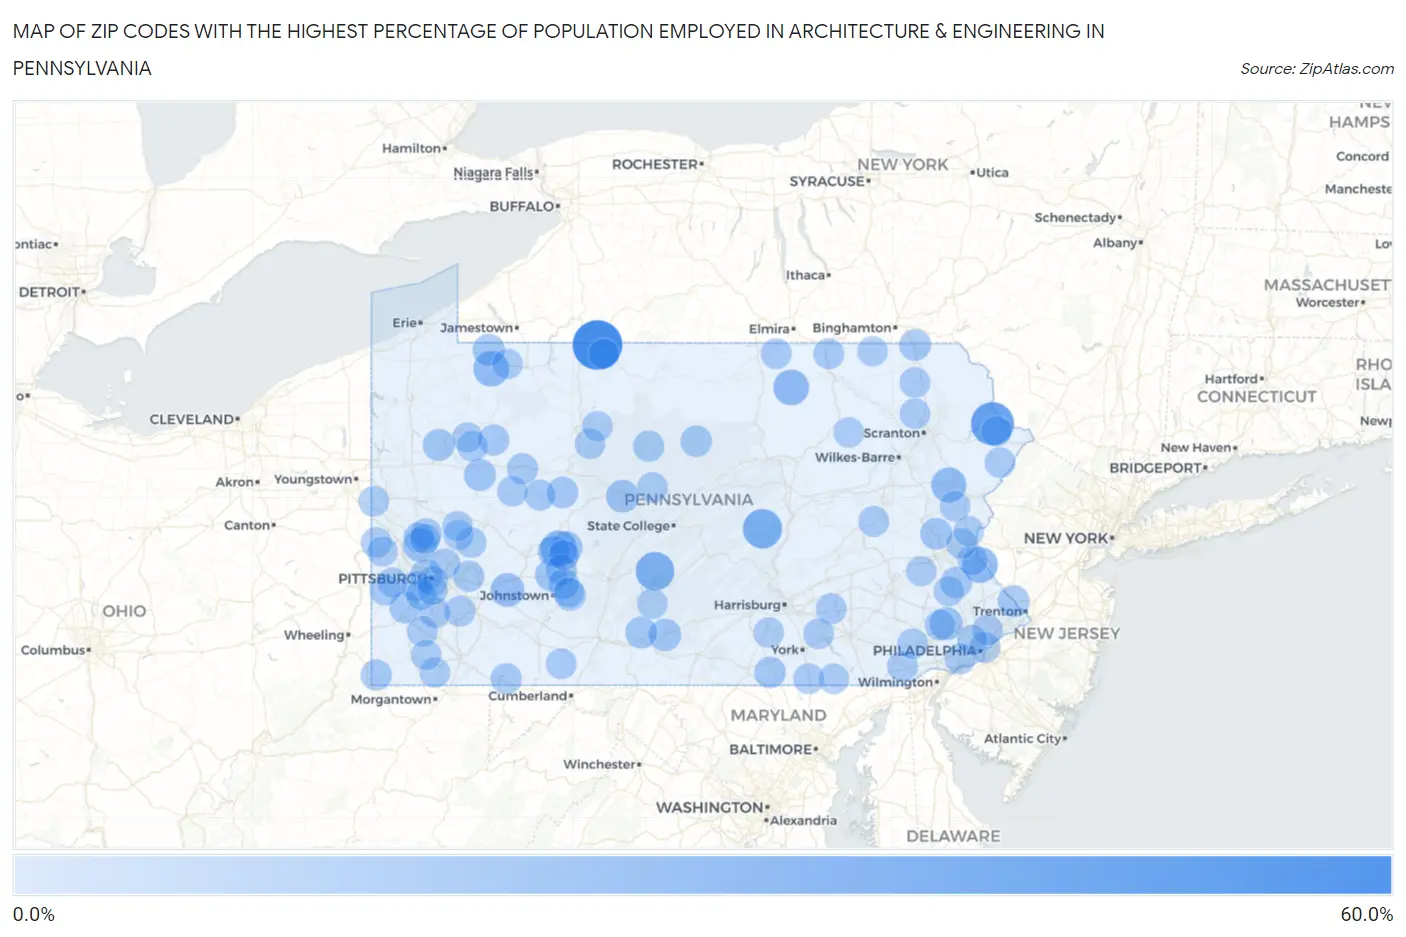
Map of Zip Codes with the Highest Percentage of Population Employed in Architecture & Engineering in Pennsylvania
0.0%
60.0%
Zip Codes with the Highest Percentage of Population Employed in Architecture & Engineering in Pennsylvania
| Zip Code | % Employed | vs State | vs National | |
| 1. | 16727 | 55.6% | 2.0%(+53.5)#1 | 2.1%(+53.4)#11 |
| 2. | 18457 | 38.1% | 2.0%(+36.1)#2 | 2.1%(+35.9)#31 |
| 3. | 17861 | 27.6% | 2.0%(+25.6)#3 | 2.1%(+25.5)#53 |
| 4. | 16654 | 25.9% | 2.0%(+23.9)#4 | 2.1%(+23.8)#60 |
| 5. | 15710 | 20.2% | 2.0%(+18.2)#5 | 2.1%(+18.0)#94 |
| 6. | 18921 | 18.4% | 2.0%(+16.4)#6 | 2.1%(+16.3)#107 |
| 7. | 16416 | 18.2% | 2.0%(+16.1)#7 | 2.1%(+16.0)#110 |
| 8. | 16910 | 18.2% | 2.0%(+16.1)#8 | 2.1%(+16.0)#111 |
| 9. | 18334 | 16.7% | 2.0%(+14.6)#9 | 2.1%(+14.5)#127 |
| 10. | 15671 | 13.2% | 2.0%(+11.1)#10 | 2.1%(+11.0)#192 |
| 11. | 15086 | 12.8% | 2.0%(+10.8)#11 | 2.1%(+10.7)#208 |
| 12. | 19456 | 11.7% | 2.0%(+9.63)#12 | 2.1%(+9.52)#254 |
| 13. | 16825 | 10.8% | 2.0%(+8.74)#13 | 2.1%(+8.63)#294 |
| 14. | 15760 | 10.5% | 2.0%(+8.49)#14 | 2.1%(+8.38)#313 |
| 15. | 17223 | 9.9% | 2.0%(+7.89)#15 | 2.1%(+7.78)#345 |
| 16. | 15961 | 9.9% | 2.0%(+7.83)#16 | 2.1%(+7.72)#350 |
| 17. | 16213 | 9.1% | 2.0%(+7.05)#17 | 2.1%(+6.94)#408 |
| 18. | 16402 | 8.9% | 2.0%(+6.89)#18 | 2.1%(+6.79)#428 |
| 19. | 16691 | 8.5% | 2.0%(+6.49)#19 | 2.1%(+6.38)#483 |
| 20. | 16342 | 8.4% | 2.0%(+6.36)#20 | 2.1%(+6.25)#501 |
| 21. | 18086 | 8.4% | 2.0%(+6.35)#21 | 2.1%(+6.24)#504 |
| 22. | 18977 | 8.3% | 2.0%(+6.23)#22 | 2.1%(+6.12)#523 |
| 23. | 15745 | 8.3% | 2.0%(+6.22)#23 | 2.1%(+6.11)#525 |
| 24. | 15233 | 7.9% | 2.0%(+5.81)#24 | 2.1%(+5.70)#594 |
| 25. | 18970 | 7.8% | 2.0%(+5.81)#25 | 2.1%(+5.70)#596 |
| 26. | 18821 | 7.7% | 2.0%(+5.65)#26 | 2.1%(+5.54)#621 |
| 27. | 15951 | 7.5% | 2.0%(+5.45)#27 | 2.1%(+5.34)#657 |
| 28. | 17344 | 7.3% | 2.0%(+5.25)#28 | 2.1%(+5.14)#692 |
| 29. | 15863 | 7.3% | 2.0%(+5.23)#29 | 2.1%(+5.12)#695 |
| 30. | 15342 | 7.3% | 2.0%(+5.22)#30 | 2.1%(+5.11)#696 |
| 31. | 17760 | 7.2% | 2.0%(+5.16)#31 | 2.1%(+5.05)#708 |
| 32. | 15861 | 6.8% | 2.0%(+4.78)#32 | 2.1%(+4.67)#797 |
| 33. | 15960 | 6.8% | 2.0%(+4.75)#33 | 2.1%(+4.65)#801 |
| 34. | 15668 | 6.5% | 2.0%(+4.47)#34 | 2.1%(+4.36)#885 |
| 35. | 15310 | 6.5% | 2.0%(+4.41)#35 | 2.1%(+4.30)#906 |
| 36. | 15411 | 6.4% | 2.0%(+4.40)#36 | 2.1%(+4.29)#911 |
| 37. | 16024 | 6.4% | 2.0%(+4.39)#37 | 2.1%(+4.28)#916 |
| 38. | 15829 | 6.4% | 2.0%(+4.39)#38 | 2.1%(+4.28)#918 |
| 39. | 15142 | 6.4% | 2.0%(+4.35)#39 | 2.1%(+4.24)#926 |
| 40. | 16326 | 6.2% | 2.0%(+4.17)#40 | 2.1%(+4.06)#999 |
| 41. | 15942 | 6.2% | 2.0%(+4.12)#41 | 2.1%(+4.01)#1,016 |
| 42. | 15764 | 6.1% | 2.0%(+4.08)#42 | 2.1%(+3.97)#1,031 |
| 43. | 15640 | 5.9% | 2.0%(+3.82)#43 | 2.1%(+3.71)#1,153 |
| 44. | 15054 | 5.8% | 2.0%(+3.76)#44 | 2.1%(+3.65)#1,174 |
| 45. | 18214 | 5.8% | 2.0%(+3.71)#45 | 2.1%(+3.60)#1,195 |
| 46. | 18810 | 5.6% | 2.0%(+3.57)#46 | 2.1%(+3.47)#1,275 |
| 47. | 15067 | 5.6% | 2.0%(+3.55)#47 | 2.1%(+3.44)#1,286 |
| 48. | 19081 | 5.6% | 2.0%(+3.52)#48 | 2.1%(+3.41)#1,298 |
| 49. | 19460 | 5.5% | 2.0%(+3.48)#49 | 2.1%(+3.37)#1,317 |
| 50. | 19125 | 5.5% | 2.0%(+3.44)#50 | 2.1%(+3.33)#1,342 |
| 51. | 16859 | 5.4% | 2.0%(+3.37)#51 | 2.1%(+3.27)#1,378 |
| 52. | 15059 | 5.4% | 2.0%(+3.36)#52 | 2.1%(+3.25)#1,389 |
| 53. | 17064 | 5.4% | 2.0%(+3.35)#53 | 2.1%(+3.24)#1,397 |
| 54. | 16936 | 5.3% | 2.0%(+3.30)#54 | 2.1%(+3.20)#1,424 |
| 55. | 15360 | 5.3% | 2.0%(+3.27)#55 | 2.1%(+3.16)#1,440 |
| 56. | 17361 | 5.3% | 2.0%(+3.26)#56 | 2.1%(+3.16)#1,449 |
| 57. | 15538 | 5.3% | 2.0%(+3.24)#57 | 2.1%(+3.13)#1,461 |
| 58. | 19390 | 5.3% | 2.0%(+3.21)#58 | 2.1%(+3.10)#1,484 |
| 59. | 18826 | 5.2% | 2.0%(+3.18)#59 | 2.1%(+3.08)#1,503 |
| 60. | 17547 | 5.2% | 2.0%(+3.15)#60 | 2.1%(+3.05)#1,519 |
| 61. | 19046 | 5.2% | 2.0%(+3.11)#61 | 2.1%(+3.00)#1,559 |
| 62. | 16319 | 5.1% | 2.0%(+3.09)#62 | 2.1%(+2.99)#1,578 |
| 63. | 18322 | 5.0% | 2.0%(+2.99)#63 | 2.1%(+2.88)#1,641 |
| 64. | 16066 | 5.0% | 2.0%(+2.99)#64 | 2.1%(+2.88)#1,642 |
| 65. | 16230 | 5.0% | 2.0%(+2.98)#65 | 2.1%(+2.88)#1,645 |
| 66. | 15203 | 5.0% | 2.0%(+2.96)#66 | 2.1%(+2.85)#1,663 |
| 67. | 18328 | 5.0% | 2.0%(+2.94)#67 | 2.1%(+2.83)#1,676 |
| 68. | 18414 | 5.0% | 2.0%(+2.94)#68 | 2.1%(+2.83)#1,678 |
| 69. | 18077 | 5.0% | 2.0%(+2.92)#69 | 2.1%(+2.81)#1,691 |
| 70. | 15238 | 4.9% | 2.0%(+2.90)#70 | 2.1%(+2.79)#1,702 |
| 71. | 19372 | 4.9% | 2.0%(+2.89)#71 | 2.1%(+2.78)#1,708 |
| 72. | 15846 | 4.9% | 2.0%(+2.86)#72 | 2.1%(+2.75)#1,732 |
| 73. | 15682 | 4.9% | 2.0%(+2.86)#73 | 2.1%(+2.75)#1,738 |
| 74. | 15762 | 4.9% | 2.0%(+2.85)#74 | 2.1%(+2.74)#1,748 |
| 75. | 16371 | 4.9% | 2.0%(+2.85)#75 | 2.1%(+2.74)#1,749 |
| 76. | 16112 | 4.9% | 2.0%(+2.85)#76 | 2.1%(+2.74)#1,751 |
| 77. | 15077 | 4.9% | 2.0%(+2.84)#77 | 2.1%(+2.73)#1,763 |
| 78. | 18628 | 4.9% | 2.0%(+2.84)#78 | 2.1%(+2.73)#1,764 |
| 79. | 18020 | 4.9% | 2.0%(+2.81)#79 | 2.1%(+2.70)#1,782 |
| 80. | 17323 | 4.8% | 2.0%(+2.80)#80 | 2.1%(+2.69)#1,799 |
| 81. | 15241 | 4.8% | 2.0%(+2.78)#81 | 2.1%(+2.67)#1,814 |
| 82. | 15956 | 4.8% | 2.0%(+2.78)#82 | 2.1%(+2.67)#1,816 |
| 83. | 16055 | 4.8% | 2.0%(+2.77)#83 | 2.1%(+2.66)#1,820 |
| 84. | 15019 | 4.8% | 2.0%(+2.74)#84 | 2.1%(+2.63)#1,850 |
| 85. | 19127 | 4.8% | 2.0%(+2.73)#85 | 2.1%(+2.62)#1,855 |
| 86. | 15338 | 4.7% | 2.0%(+2.67)#86 | 2.1%(+2.56)#1,925 |
| 87. | 17321 | 4.7% | 2.0%(+2.66)#87 | 2.1%(+2.55)#1,943 |
| 88. | 18830 | 4.7% | 2.0%(+2.62)#88 | 2.1%(+2.51)#1,972 |
| 89. | 16745 | 4.7% | 2.0%(+2.61)#89 | 2.1%(+2.50)#1,979 |
| 90. | 15857 | 4.6% | 2.0%(+2.60)#90 | 2.1%(+2.50)#1,986 |
| 91. | 15236 | 4.6% | 2.0%(+2.56)#91 | 2.1%(+2.45)#2,020 |
| 92. | 18425 | 4.6% | 2.0%(+2.53)#92 | 2.1%(+2.42)#2,051 |
| 93. | 16346 | 4.6% | 2.0%(+2.52)#93 | 2.1%(+2.41)#2,061 |
| 94. | 16046 | 4.5% | 2.0%(+2.45)#94 | 2.1%(+2.34)#2,138 |
| 95. | 16023 | 4.5% | 2.0%(+2.43)#95 | 2.1%(+2.32)#2,163 |
| 96. | 15344 | 4.4% | 2.0%(+2.38)#96 | 2.1%(+2.28)#2,220 |
| 97. | 18083 | 4.4% | 2.0%(+2.37)#97 | 2.1%(+2.27)#2,235 |
| 98. | 18054 | 4.4% | 2.0%(+2.37)#98 | 2.1%(+2.27)#2,236 |
| 99. | 16623 | 4.4% | 2.0%(+2.35)#99 | 2.1%(+2.24)#2,268 |
| 100. | 19539 | 4.4% | 2.0%(+2.33)#100 | 2.1%(+2.22)#2,291 |
Common Questions
What are the Top 10 Zip Codes with the Highest Percentage of Population Employed in Architecture & Engineering in Pennsylvania?
Top 10 Zip Codes with the Highest Percentage of Population Employed in Architecture & Engineering in Pennsylvania are:
What zip code has the Highest Percentage of Population Employed in Architecture & Engineering in Pennsylvania?
16727 has the Highest Percentage of Population Employed in Architecture & Engineering in Pennsylvania with 55.6%.
What is the Percentage of Population Employed in Architecture & Engineering in the State of Pennsylvania?
Percentage of Population Employed in Architecture & Engineering in Pennsylvania is 2.0%.
What is the Percentage of Population Employed in Architecture & Engineering in the United States?
Percentage of Population Employed in Architecture & Engineering in the United States is 2.1%.