Zip Codes with the Highest Percentage of Population Employed in Architecture & Engineering in Kentucky
RELATED REPORTS & OPTIONS
Architecture & Engineering
Kentucky
Compare Zip Codes
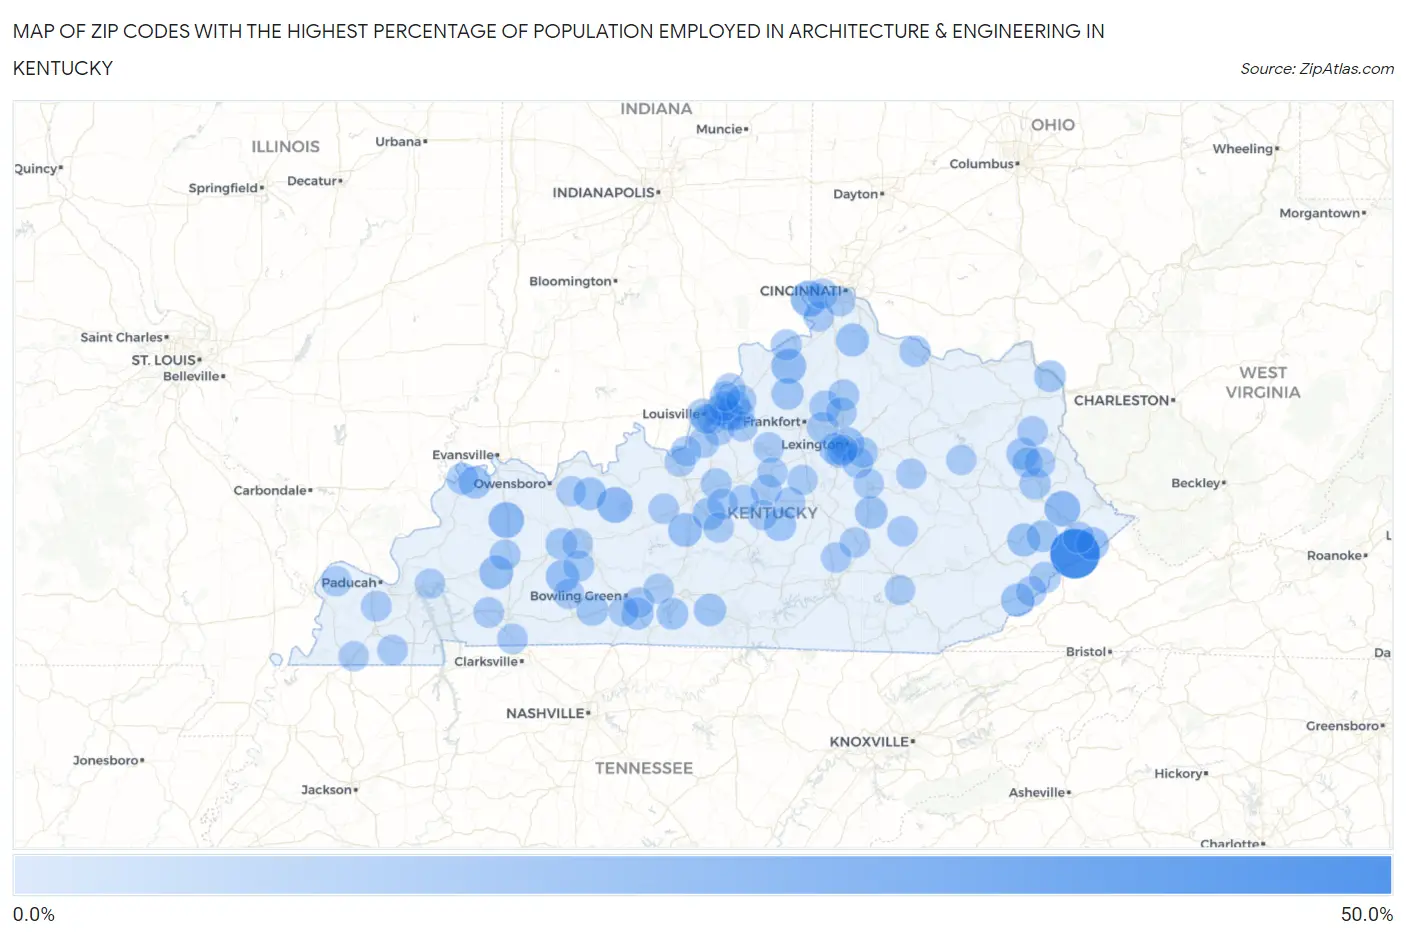
Map of Zip Codes with the Highest Percentage of Population Employed in Architecture & Engineering in Kentucky
0.0%
50.0%
Zip Codes with the Highest Percentage of Population Employed in Architecture & Engineering in Kentucky
| Zip Code | % Employed | vs State | vs National | |
| 1. | 41534 | 40.7% | 1.7%(+39.0)#1 | 2.1%(+38.6)#25 |
| 2. | 41080 | 13.7% | 1.7%(+12.0)#2 | 2.1%(+11.6)#179 |
| 3. | 42456 | 13.1% | 1.7%(+11.4)#3 | 2.1%(+11.0)#195 |
| 4. | 40119 | 13.0% | 1.7%(+11.3)#4 | 2.1%(+10.8)#200 |
| 5. | 41659 | 12.9% | 1.7%(+11.2)#5 | 2.1%(+10.7)#202 |
| 6. | 41098 | 11.3% | 1.7%(+9.60)#6 | 2.1%(+9.15)#271 |
| 7. | 42453 | 9.6% | 1.7%(+7.92)#7 | 2.1%(+7.47)#367 |
| 8. | 42784 | 9.4% | 1.7%(+7.70)#8 | 2.1%(+7.25)#379 |
| 9. | 40507 | 8.4% | 1.7%(+6.71)#9 | 2.1%(+6.27)#498 |
| 10. | 42324 | 8.3% | 1.7%(+6.62)#10 | 2.1%(+6.17)#516 |
| 11. | 41513 | 8.1% | 1.7%(+6.38)#11 | 2.1%(+5.93)#559 |
| 12. | 41831 | 8.0% | 1.7%(+6.35)#12 | 2.1%(+5.90)#565 |
| 13. | 41033 | 7.8% | 1.7%(+6.15)#13 | 2.1%(+5.70)#597 |
| 14. | 40823 | 7.8% | 1.7%(+6.12)#14 | 2.1%(+5.67)#604 |
| 15. | 42368 | 7.1% | 1.7%(+5.40)#15 | 2.1%(+4.95)#727 |
| 16. | 40404 | 7.0% | 1.7%(+5.25)#16 | 2.1%(+4.80)#761 |
| 17. | 42748 | 6.8% | 1.7%(+5.08)#17 | 2.1%(+4.63)#806 |
| 18. | 42406 | 6.6% | 1.7%(+4.94)#18 | 2.1%(+4.49)#843 |
| 19. | 42166 | 6.6% | 1.7%(+4.87)#19 | 2.1%(+4.42)#862 |
| 20. | 40009 | 6.4% | 1.7%(+4.67)#20 | 2.1%(+4.22)#931 |
| 21. | 41226 | 6.2% | 1.7%(+4.49)#21 | 2.1%(+4.04)#1,008 |
| 22. | 40057 | 6.2% | 1.7%(+4.45)#22 | 2.1%(+4.00)#1,018 |
| 23. | 42122 | 6.1% | 1.7%(+4.45)#23 | 2.1%(+4.00)#1,020 |
| 24. | 41859 | 5.6% | 1.7%(+3.86)#24 | 2.1%(+3.41)#1,304 |
| 25. | 42206 | 5.5% | 1.7%(+3.84)#25 | 2.1%(+3.39)#1,309 |
| 26. | 41169 | 5.5% | 1.7%(+3.81)#26 | 2.1%(+3.36)#1,322 |
| 27. | 40513 | 5.5% | 1.7%(+3.78)#27 | 2.1%(+3.33)#1,344 |
| 28. | 42156 | 5.4% | 1.7%(+3.69)#28 | 2.1%(+3.24)#1,393 |
| 29. | 42461 | 5.2% | 1.7%(+3.48)#29 | 2.1%(+3.03)#1,526 |
| 30. | 42369 | 5.0% | 1.7%(+3.30)#30 | 2.1%(+2.85)#1,659 |
| 31. | 41222 | 4.9% | 1.7%(+3.23)#31 | 2.1%(+2.78)#1,707 |
| 32. | 40245 | 4.8% | 1.7%(+3.06)#32 | 2.1%(+2.61)#1,872 |
| 33. | 41034 | 4.8% | 1.7%(+3.05)#33 | 2.1%(+2.60)#1,876 |
| 34. | 40379 | 4.7% | 1.7%(+3.03)#34 | 2.1%(+2.58)#1,896 |
| 35. | 41562 | 4.6% | 1.7%(+2.93)#35 | 2.1%(+2.48)#1,994 |
| 36. | 41837 | 4.5% | 1.7%(+2.80)#36 | 2.1%(+2.35)#2,120 |
| 37. | 40056 | 4.5% | 1.7%(+2.80)#37 | 2.1%(+2.35)#2,121 |
| 38. | 40347 | 4.5% | 1.7%(+2.78)#38 | 2.1%(+2.33)#2,151 |
| 39. | 40370 | 4.4% | 1.7%(+2.66)#39 | 2.1%(+2.21)#2,304 |
| 40. | 41045 | 4.2% | 1.7%(+2.51)#40 | 2.1%(+2.06)#2,482 |
| 41. | 42273 | 4.1% | 1.7%(+2.43)#41 | 2.1%(+1.98)#2,582 |
| 42. | 40514 | 4.1% | 1.7%(+2.37)#42 | 2.1%(+1.92)#2,664 |
| 43. | 40515 | 4.1% | 1.7%(+2.36)#43 | 2.1%(+1.91)#2,689 |
| 44. | 40069 | 4.0% | 1.7%(+2.35)#44 | 2.1%(+1.90)#2,704 |
| 45. | 40107 | 3.9% | 1.7%(+2.25)#45 | 2.1%(+1.80)#2,850 |
| 46. | 42410 | 3.8% | 1.7%(+2.14)#46 | 2.1%(+1.69)#3,023 |
| 47. | 40509 | 3.7% | 1.7%(+2.03)#47 | 2.1%(+1.58)#3,232 |
| 48. | 40503 | 3.7% | 1.7%(+2.01)#48 | 2.1%(+1.56)#3,267 |
| 49. | 42320 | 3.7% | 1.7%(+1.98)#49 | 2.1%(+1.53)#3,336 |
| 50. | 40026 | 3.7% | 1.7%(+1.96)#50 | 2.1%(+1.51)#3,388 |
| 51. | 40324 | 3.6% | 1.7%(+1.93)#51 | 2.1%(+1.48)#3,460 |
| 52. | 42027 | 3.6% | 1.7%(+1.90)#52 | 2.1%(+1.45)#3,510 |
| 53. | 41257 | 3.5% | 1.7%(+1.82)#53 | 2.1%(+1.37)#3,699 |
| 54. | 42103 | 3.5% | 1.7%(+1.80)#54 | 2.1%(+1.35)#3,750 |
| 55. | 42232 | 3.5% | 1.7%(+1.78)#55 | 2.1%(+1.33)#3,779 |
| 56. | 42256 | 3.4% | 1.7%(+1.69)#56 | 2.1%(+1.24)#3,978 |
| 57. | 40051 | 3.4% | 1.7%(+1.67)#57 | 2.1%(+1.22)#4,024 |
| 58. | 40468 | 3.4% | 1.7%(+1.67)#58 | 2.1%(+1.22)#4,028 |
| 59. | 40046 | 3.3% | 1.7%(+1.63)#59 | 2.1%(+1.18)#4,101 |
| 60. | 40223 | 3.3% | 1.7%(+1.62)#60 | 2.1%(+1.17)#4,156 |
| 61. | 40228 | 3.3% | 1.7%(+1.62)#61 | 2.1%(+1.17)#4,165 |
| 62. | 40862 | 3.3% | 1.7%(+1.60)#62 | 2.1%(+1.15)#4,202 |
| 63. | 41180 | 3.3% | 1.7%(+1.57)#63 | 2.1%(+1.12)#4,287 |
| 64. | 40409 | 3.3% | 1.7%(+1.56)#64 | 2.1%(+1.11)#4,308 |
| 65. | 40205 | 3.2% | 1.7%(+1.54)#65 | 2.1%(+1.09)#4,360 |
| 66. | 41091 | 3.2% | 1.7%(+1.52)#66 | 2.1%(+1.07)#4,418 |
| 67. | 40243 | 3.2% | 1.7%(+1.51)#67 | 2.1%(+1.06)#4,427 |
| 68. | 40109 | 3.2% | 1.7%(+1.49)#68 | 2.1%(+1.04)#4,480 |
| 69. | 41219 | 3.2% | 1.7%(+1.48)#69 | 2.1%(+1.03)#4,505 |
| 70. | 42040 | 3.2% | 1.7%(+1.47)#70 | 2.1%(+1.02)#4,540 |
| 71. | 42567 | 3.2% | 1.7%(+1.46)#71 | 2.1%(+1.01)#4,584 |
| 72. | 40023 | 3.1% | 1.7%(+1.44)#72 | 2.1%(+0.989)#4,631 |
| 73. | 42262 | 3.1% | 1.7%(+1.43)#73 | 2.1%(+0.978)#4,660 |
| 74. | 42732 | 3.1% | 1.7%(+1.42)#74 | 2.1%(+0.972)#4,692 |
| 75. | 41048 | 3.1% | 1.7%(+1.41)#75 | 2.1%(+0.958)#4,716 |
| 76. | 40121 | 3.0% | 1.7%(+1.32)#76 | 2.1%(+0.872)#4,983 |
| 77. | 40447 | 3.0% | 1.7%(+1.31)#77 | 2.1%(+0.863)#5,018 |
| 78. | 40312 | 3.0% | 1.7%(+1.31)#78 | 2.1%(+0.861)#5,025 |
| 79. | 40475 | 3.0% | 1.7%(+1.25)#79 | 2.1%(+0.803)#5,228 |
| 80. | 42716 | 2.9% | 1.7%(+1.24)#80 | 2.1%(+0.787)#5,291 |
| 81. | 42171 | 2.9% | 1.7%(+1.23)#81 | 2.1%(+0.784)#5,305 |
| 82. | 40222 | 2.9% | 1.7%(+1.23)#82 | 2.1%(+0.783)#5,310 |
| 83. | 42056 | 2.9% | 1.7%(+1.23)#83 | 2.1%(+0.783)#5,311 |
| 84. | 40241 | 2.9% | 1.7%(+1.20)#84 | 2.1%(+0.748)#5,429 |
| 85. | 40033 | 2.9% | 1.7%(+1.16)#85 | 2.1%(+0.713)#5,551 |
| 86. | 42104 | 2.8% | 1.7%(+1.08)#86 | 2.1%(+0.631)#5,858 |
| 87. | 40177 | 2.8% | 1.7%(+1.07)#87 | 2.1%(+0.624)#5,889 |
| 88. | 42041 | 2.8% | 1.7%(+1.07)#88 | 2.1%(+0.617)#5,911 |
| 89. | 40203 | 2.7% | 1.7%(+1.05)#89 | 2.1%(+0.598)#5,976 |
| 90. | 40037 | 2.7% | 1.7%(+1.05)#90 | 2.1%(+0.596)#5,986 |
| 91. | 40014 | 2.7% | 1.7%(+1.04)#91 | 2.1%(+0.586)#6,019 |
| 92. | 40330 | 2.7% | 1.7%(+1.01)#92 | 2.1%(+0.556)#6,131 |
| 93. | 42055 | 2.7% | 1.7%(+0.989)#93 | 2.1%(+0.540)#6,210 |
| 94. | 40078 | 2.7% | 1.7%(+0.972)#94 | 2.1%(+0.522)#6,281 |
| 95. | 40387 | 2.7% | 1.7%(+0.962)#95 | 2.1%(+0.512)#6,324 |
| 96. | 40217 | 2.7% | 1.7%(+0.955)#96 | 2.1%(+0.505)#6,349 |
| 97. | 42366 | 2.6% | 1.7%(+0.946)#97 | 2.1%(+0.496)#6,389 |
| 98. | 40740 | 2.6% | 1.7%(+0.904)#98 | 2.1%(+0.454)#6,568 |
| 99. | 40059 | 2.6% | 1.7%(+0.867)#99 | 2.1%(+0.417)#6,718 |
| 100. | 41017 | 2.6% | 1.7%(+0.858)#100 | 2.1%(+0.408)#6,753 |
Common Questions
What are the Top 10 Zip Codes with the Highest Percentage of Population Employed in Architecture & Engineering in Kentucky?
Top 10 Zip Codes with the Highest Percentage of Population Employed in Architecture & Engineering in Kentucky are:
What zip code has the Highest Percentage of Population Employed in Architecture & Engineering in Kentucky?
41534 has the Highest Percentage of Population Employed in Architecture & Engineering in Kentucky with 40.7%.
What is the Percentage of Population Employed in Architecture & Engineering in the State of Kentucky?
Percentage of Population Employed in Architecture & Engineering in Kentucky is 1.7%.
What is the Percentage of Population Employed in Architecture & Engineering in the United States?
Percentage of Population Employed in Architecture & Engineering in the United States is 2.1%.