Zip Codes with the Highest Percentage of Population Employed in Architecture & Engineering in New Hampshire
RELATED REPORTS & OPTIONS
Architecture & Engineering
New Hampshire
Compare Zip Codes
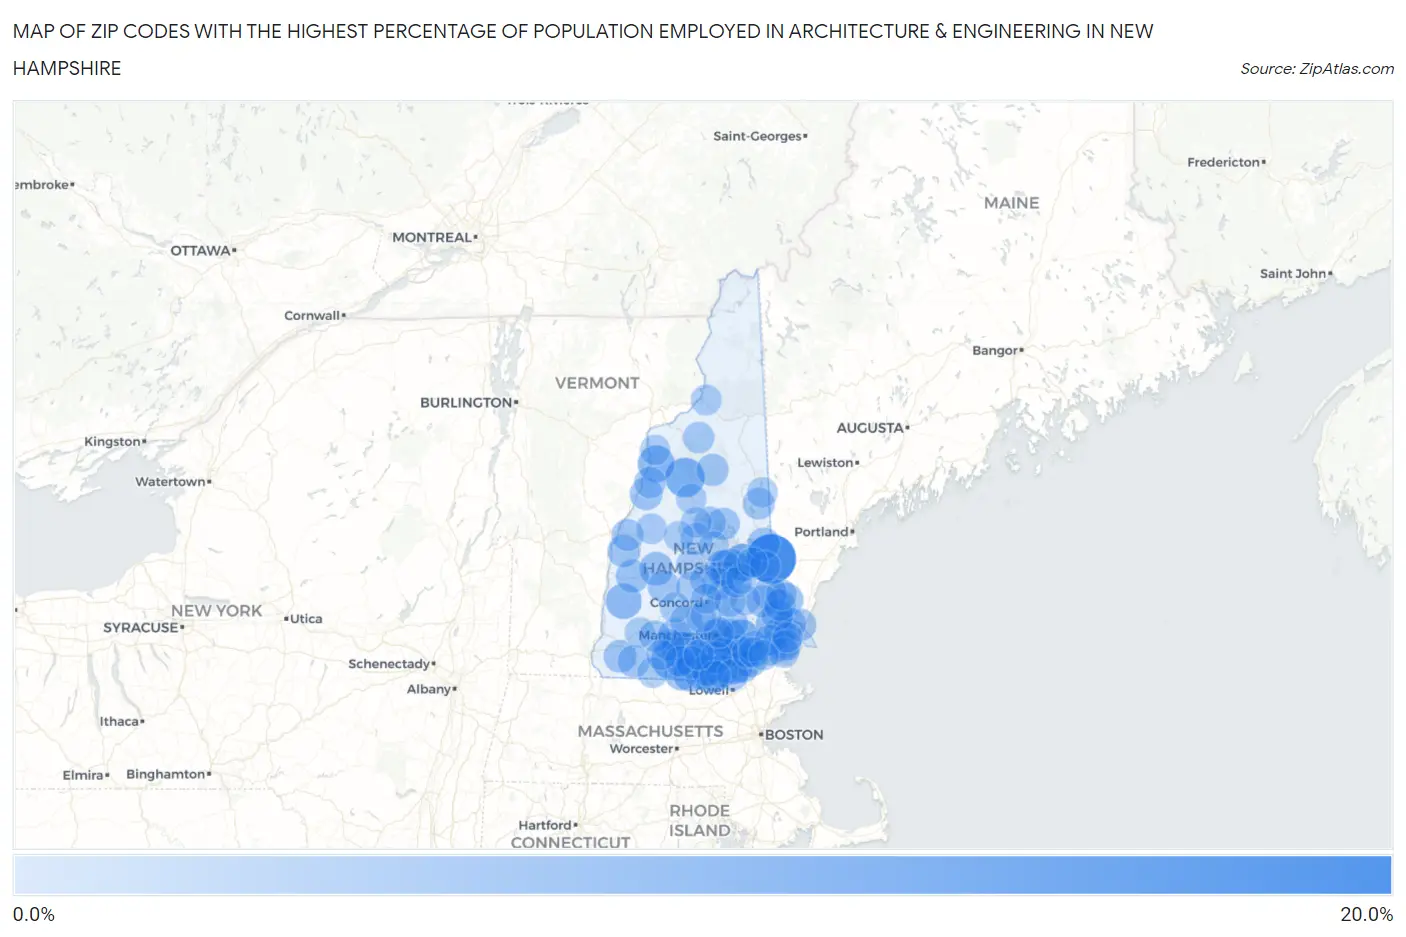
Map of Zip Codes with the Highest Percentage of Population Employed in Architecture & Engineering in New Hampshire
0.0%
20.0%
Zip Codes with the Highest Percentage of Population Employed in Architecture & Engineering in New Hampshire
| Zip Code | % Employed | vs State | vs National | |
| 1. | 03852 | 18.3% | 3.1%(+15.1)#1 | 2.1%(+16.1)#109 |
| 2. | 03837 | 9.9% | 3.1%(+6.76)#2 | 2.1%(+7.72)#351 |
| 3. | 03262 | 9.9% | 3.1%(+6.75)#3 | 2.1%(+7.71)#352 |
| 4. | 03036 | 9.1% | 3.1%(+5.94)#4 | 2.1%(+6.90)#412 |
| 5. | 03087 | 8.7% | 3.1%(+5.63)#5 | 2.1%(+6.59)#453 |
| 6. | 03084 | 8.5% | 3.1%(+5.39)#6 | 2.1%(+6.35)#484 |
| 7. | 03809 | 8.2% | 3.1%(+5.09)#7 | 2.1%(+6.05)#538 |
| 8. | 03774 | 7.8% | 3.1%(+4.67)#8 | 2.1%(+5.63)#613 |
| 9. | 03082 | 7.5% | 3.1%(+4.38)#9 | 2.1%(+5.34)#656 |
| 10. | 03033 | 6.9% | 3.1%(+3.78)#10 | 2.1%(+4.74)#779 |
| 11. | 03607 | 6.8% | 3.1%(+3.71)#11 | 2.1%(+4.67)#796 |
| 12. | 03857 | 6.7% | 3.1%(+3.59)#12 | 2.1%(+4.55)#827 |
| 13. | 03237 | 6.1% | 3.1%(+3.02)#13 | 2.1%(+3.99)#1,023 |
| 14. | 03062 | 6.1% | 3.1%(+3.02)#14 | 2.1%(+3.98)#1,026 |
| 15. | 03049 | 5.6% | 3.1%(+2.47)#15 | 2.1%(+3.43)#1,290 |
| 16. | 03032 | 5.6% | 3.1%(+2.46)#16 | 2.1%(+3.43)#1,294 |
| 17. | 03869 | 5.5% | 3.1%(+2.42)#17 | 2.1%(+3.38)#1,313 |
| 18. | 03811 | 5.5% | 3.1%(+2.38)#18 | 2.1%(+3.34)#1,331 |
| 19. | 03839 | 5.3% | 3.1%(+2.17)#19 | 2.1%(+3.13)#1,462 |
| 20. | 03257 | 5.2% | 3.1%(+2.10)#20 | 2.1%(+3.06)#1,513 |
| 21. | 03101 | 5.1% | 3.1%(+1.99)#21 | 2.1%(+2.95)#1,598 |
| 22. | 03054 | 5.0% | 3.1%(+1.88)#22 | 2.1%(+2.85)#1,665 |
| 23. | 03110 | 5.0% | 3.1%(+1.88)#23 | 2.1%(+2.84)#1,668 |
| 24. | 03048 | 4.8% | 3.1%(+1.70)#24 | 2.1%(+2.66)#1,823 |
| 25. | 03773 | 4.8% | 3.1%(+1.69)#25 | 2.1%(+2.65)#1,833 |
| 26. | 03057 | 4.7% | 3.1%(+1.61)#26 | 2.1%(+2.57)#1,910 |
| 27. | 03038 | 4.7% | 3.1%(+1.59)#27 | 2.1%(+2.55)#1,944 |
| 28. | 03043 | 4.5% | 3.1%(+1.40)#28 | 2.1%(+2.36)#2,107 |
| 29. | 03051 | 4.5% | 3.1%(+1.40)#29 | 2.1%(+2.36)#2,112 |
| 30. | 03777 | 4.5% | 3.1%(+1.38)#30 | 2.1%(+2.34)#2,141 |
| 31. | 03827 | 4.4% | 3.1%(+1.33)#31 | 2.1%(+2.29)#2,208 |
| 32. | 03055 | 4.4% | 3.1%(+1.32)#32 | 2.1%(+2.28)#2,218 |
| 33. | 03446 | 4.4% | 3.1%(+1.31)#33 | 2.1%(+2.27)#2,232 |
| 34. | 03079 | 4.3% | 3.1%(+1.22)#34 | 2.1%(+2.19)#2,334 |
| 35. | 03770 | 4.3% | 3.1%(+1.19)#35 | 2.1%(+2.16)#2,362 |
| 36. | 03872 | 4.3% | 3.1%(+1.19)#36 | 2.1%(+2.15)#2,367 |
| 37. | 03854 | 4.3% | 3.1%(+1.17)#37 | 2.1%(+2.13)#2,396 |
| 38. | 03307 | 4.3% | 3.1%(+1.14)#38 | 2.1%(+2.10)#2,425 |
| 39. | 03053 | 4.2% | 3.1%(+1.11)#39 | 2.1%(+2.07)#2,471 |
| 40. | 03063 | 4.2% | 3.1%(+1.05)#40 | 2.1%(+2.01)#2,538 |
| 41. | 03215 | 4.1% | 3.1%(+1.02)#41 | 2.1%(+1.98)#2,578 |
| 42. | 03885 | 4.1% | 3.1%(+1.01)#42 | 2.1%(+1.97)#2,589 |
| 43. | 03465 | 4.1% | 3.1%(+0.979)#43 | 2.1%(+1.94)#2,632 |
| 44. | 03281 | 4.1% | 3.1%(+0.966)#44 | 2.1%(+1.93)#2,652 |
| 45. | 03273 | 4.1% | 3.1%(+0.954)#45 | 2.1%(+1.92)#2,675 |
| 46. | 03825 | 4.1% | 3.1%(+0.953)#46 | 2.1%(+1.91)#2,678 |
| 47. | 03766 | 4.0% | 3.1%(+0.923)#47 | 2.1%(+1.88)#2,724 |
| 48. | 03801 | 4.0% | 3.1%(+0.871)#48 | 2.1%(+1.83)#2,797 |
| 49. | 03254 | 3.9% | 3.1%(+0.838)#49 | 2.1%(+1.80)#2,849 |
| 50. | 03047 | 3.9% | 3.1%(+0.790)#50 | 2.1%(+1.75)#2,935 |
| 51. | 03052 | 3.8% | 3.1%(+0.646)#51 | 2.1%(+1.61)#3,182 |
| 52. | 03226 | 3.7% | 3.1%(+0.636)#52 | 2.1%(+1.60)#3,202 |
| 53. | 03824 | 3.7% | 3.1%(+0.620)#53 | 2.1%(+1.58)#3,235 |
| 54. | 03836 | 3.7% | 3.1%(+0.608)#54 | 2.1%(+1.57)#3,255 |
| 55. | 03820 | 3.7% | 3.1%(+0.604)#55 | 2.1%(+1.57)#3,260 |
| 56. | 03076 | 3.6% | 3.1%(+0.507)#56 | 2.1%(+1.47)#3,473 |
| 57. | 03779 | 3.6% | 3.1%(+0.468)#57 | 2.1%(+1.43)#3,548 |
| 58. | 03449 | 3.5% | 3.1%(+0.407)#58 | 2.1%(+1.37)#3,691 |
| 59. | 03034 | 3.5% | 3.1%(+0.340)#59 | 2.1%(+1.30)#3,850 |
| 60. | 03256 | 3.4% | 3.1%(+0.317)#60 | 2.1%(+1.28)#3,906 |
| 61. | 03258 | 3.4% | 3.1%(+0.288)#61 | 2.1%(+1.25)#3,961 |
| 62. | 03574 | 3.4% | 3.1%(+0.250)#62 | 2.1%(+1.21)#4,042 |
| 63. | 03841 | 3.2% | 3.1%(+0.124)#63 | 2.1%(+1.09)#4,371 |
| 64. | 03304 | 3.2% | 3.1%(+0.113)#64 | 2.1%(+1.08)#4,403 |
| 65. | 03060 | 3.2% | 3.1%(+0.042)#65 | 2.1%(+1.00)#4,595 |
| 66. | 03878 | 3.1% | 3.1%(-0.003)#66 | 2.1%(+0.959)#4,715 |
| 67. | 03844 | 3.1% | 3.1%(-0.045)#67 | 2.1%(+0.917)#4,827 |
| 68. | 03234 | 3.1% | 3.1%(-0.047)#68 | 2.1%(+0.915)#4,840 |
| 69. | 03819 | 3.0% | 3.1%(-0.085)#69 | 2.1%(+0.877)#4,969 |
| 70. | 03833 | 3.0% | 3.1%(-0.101)#70 | 2.1%(+0.861)#5,028 |
| 71. | 03842 | 2.9% | 3.1%(-0.167)#71 | 2.1%(+0.795)#5,255 |
| 72. | 03303 | 2.9% | 3.1%(-0.176)#72 | 2.1%(+0.785)#5,299 |
| 73. | 03261 | 2.9% | 3.1%(-0.228)#73 | 2.1%(+0.734)#5,479 |
| 74. | 03217 | 2.9% | 3.1%(-0.228)#74 | 2.1%(+0.733)#5,482 |
| 75. | 03851 | 2.8% | 3.1%(-0.269)#75 | 2.1%(+0.693)#5,612 |
| 76. | 03584 | 2.8% | 3.1%(-0.269)#76 | 2.1%(+0.693)#5,613 |
| 77. | 03235 | 2.8% | 3.1%(-0.269)#77 | 2.1%(+0.692)#5,615 |
| 78. | 03104 | 2.8% | 3.1%(-0.325)#78 | 2.1%(+0.637)#5,834 |
| 79. | 03874 | 2.8% | 3.1%(-0.349)#79 | 2.1%(+0.613)#5,920 |
| 80. | 03741 | 2.7% | 3.1%(-0.383)#80 | 2.1%(+0.579)#6,050 |
| 81. | 03461 | 2.7% | 3.1%(-0.385)#81 | 2.1%(+0.577)#6,061 |
| 82. | 03046 | 2.7% | 3.1%(-0.389)#82 | 2.1%(+0.573)#6,075 |
| 83. | 03218 | 2.7% | 3.1%(-0.418)#83 | 2.1%(+0.544)#6,192 |
| 84. | 03224 | 2.7% | 3.1%(-0.435)#84 | 2.1%(+0.527)#6,258 |
| 85. | 03086 | 2.7% | 3.1%(-0.442)#85 | 2.1%(+0.520)#6,291 |
| 86. | 03832 | 2.6% | 3.1%(-0.462)#86 | 2.1%(+0.500)#6,372 |
| 87. | 03826 | 2.6% | 3.1%(-0.463)#87 | 2.1%(+0.499)#6,374 |
| 88. | 03740 | 2.6% | 3.1%(-0.485)#88 | 2.1%(+0.477)#6,462 |
| 89. | 03031 | 2.6% | 3.1%(-0.500)#89 | 2.1%(+0.462)#6,529 |
| 90. | 03246 | 2.6% | 3.1%(-0.537)#90 | 2.1%(+0.424)#6,683 |
| 91. | 03457 | 2.6% | 3.1%(-0.540)#91 | 2.1%(+0.421)#6,696 |
| 92. | 03223 | 2.6% | 3.1%(-0.547)#92 | 2.1%(+0.415)#6,726 |
| 93. | 03225 | 2.5% | 3.1%(-0.574)#93 | 2.1%(+0.388)#6,849 |
| 94. | 03858 | 2.5% | 3.1%(-0.578)#94 | 2.1%(+0.384)#6,862 |
| 95. | 03862 | 2.5% | 3.1%(-0.586)#95 | 2.1%(+0.376)#6,884 |
| 96. | 03222 | 2.5% | 3.1%(-0.596)#96 | 2.1%(+0.365)#6,934 |
| 97. | 03458 | 2.5% | 3.1%(-0.602)#97 | 2.1%(+0.359)#6,951 |
| 98. | 03855 | 2.5% | 3.1%(-0.611)#98 | 2.1%(+0.351)#6,992 |
| 99. | 03242 | 2.5% | 3.1%(-0.619)#99 | 2.1%(+0.342)#7,031 |
| 100. | 03301 | 2.5% | 3.1%(-0.622)#100 | 2.1%(+0.340)#7,047 |
Common Questions
What are the Top 10 Zip Codes with the Highest Percentage of Population Employed in Architecture & Engineering in New Hampshire?
Top 10 Zip Codes with the Highest Percentage of Population Employed in Architecture & Engineering in New Hampshire are:
What zip code has the Highest Percentage of Population Employed in Architecture & Engineering in New Hampshire?
03852 has the Highest Percentage of Population Employed in Architecture & Engineering in New Hampshire with 18.3%.
What is the Percentage of Population Employed in Architecture & Engineering in the State of New Hampshire?
Percentage of Population Employed in Architecture & Engineering in New Hampshire is 3.1%.
What is the Percentage of Population Employed in Architecture & Engineering in the United States?
Percentage of Population Employed in Architecture & Engineering in the United States is 2.1%.