Zip Codes with the Highest Percentage of Population Employed in Architecture & Engineering in Alabama
RELATED REPORTS & OPTIONS
Architecture & Engineering
Alabama
Compare Zip Codes
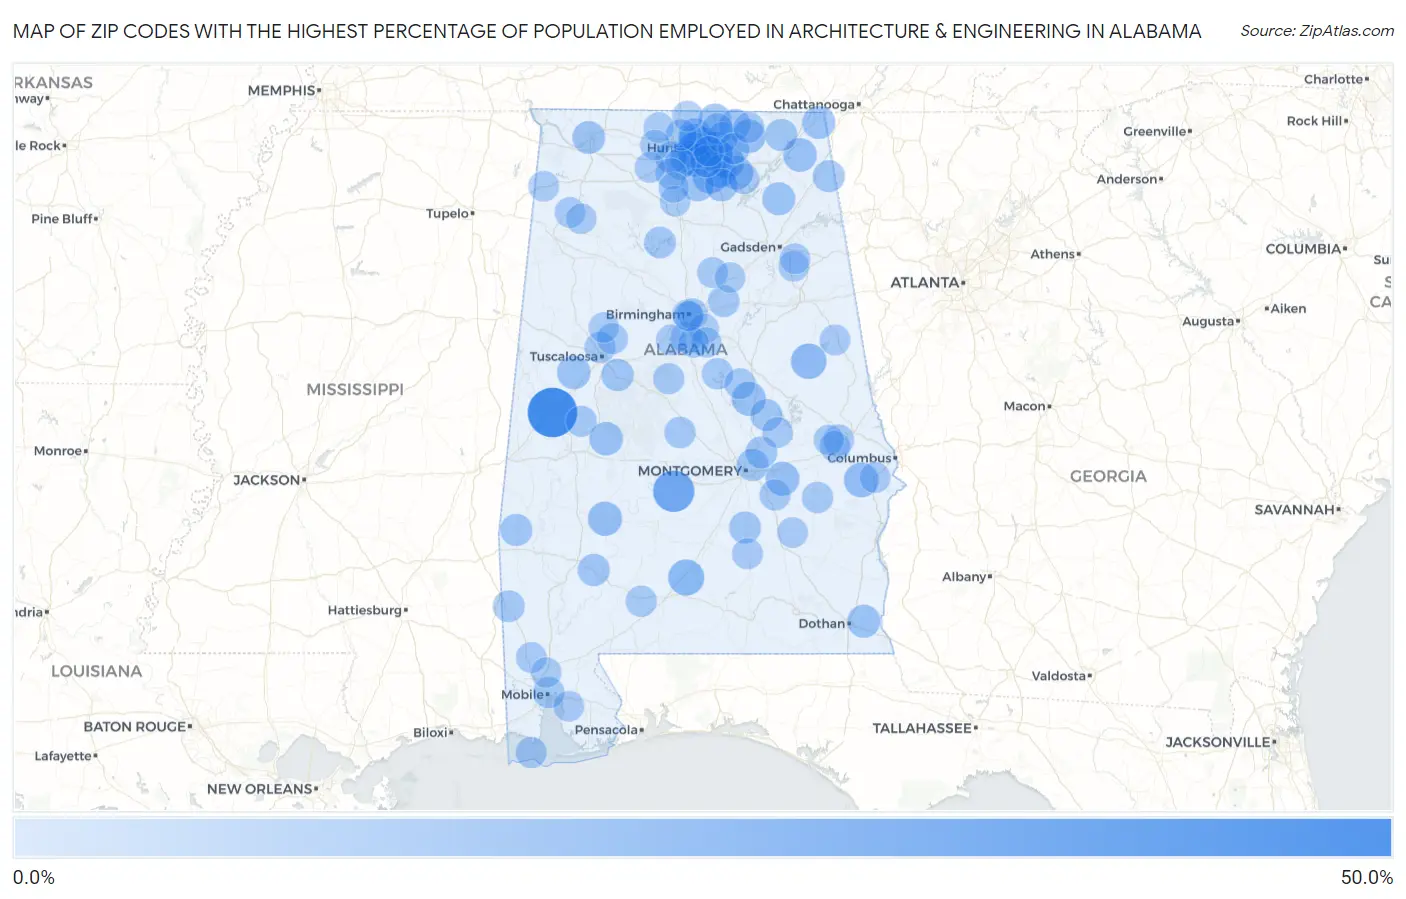
Map of Zip Codes with the Highest Percentage of Population Employed in Architecture & Engineering in Alabama
0.0%
50.0%
Zip Codes with the Highest Percentage of Population Employed in Architecture & Engineering in Alabama
| Zip Code | % Employed | vs State | vs National | |
| 1. | 35443 | 41.3% | 2.4%(+38.9)#1 | 2.1%(+39.2)#24 |
| 2. | 36775 | 24.7% | 2.4%(+22.3)#2 | 2.1%(+22.5)#65 |
| 3. | 36456 | 14.3% | 2.4%(+11.9)#3 | 2.1%(+12.1)#168 |
| 4. | 36255 | 13.1% | 2.4%(+10.7)#4 | 2.1%(+11.0)#196 |
| 5. | 35806 | 12.4% | 2.4%(+9.96)#5 | 2.1%(+10.2)#222 |
| 6. | 35758 | 12.0% | 2.4%(+9.58)#6 | 2.1%(+9.84)#241 |
| 7. | 36858 | 11.6% | 2.4%(+9.16)#7 | 2.1%(+9.42)#258 |
| 8. | 35754 | 11.5% | 2.4%(+9.05)#8 | 2.1%(+9.30)#266 |
| 9. | 36769 | 10.5% | 2.4%(+8.09)#9 | 2.1%(+8.35)#315 |
| 10. | 35136 | 10.3% | 2.4%(+7.91)#10 | 2.1%(+8.16)#323 |
| 11. | 35801 | 10.2% | 2.4%(+7.76)#11 | 2.1%(+8.02)#332 |
| 12. | 36013 | 10.0% | 2.4%(+7.59)#12 | 2.1%(+7.85)#339 |
| 13. | 35756 | 10.0% | 2.4%(+7.55)#13 | 2.1%(+7.81)#344 |
| 14. | 35760 | 9.9% | 2.4%(+7.50)#14 | 2.1%(+7.76)#349 |
| 15. | 35763 | 9.8% | 2.4%(+7.44)#15 | 2.1%(+7.70)#353 |
| 16. | 35751 | 9.6% | 2.4%(+7.22)#16 | 2.1%(+7.48)#366 |
| 17. | 35765 | 9.4% | 2.4%(+7.00)#17 | 2.1%(+7.26)#378 |
| 18. | 36765 | 9.2% | 2.4%(+6.83)#18 | 2.1%(+7.09)#393 |
| 19. | 35802 | 9.0% | 2.4%(+6.63)#19 | 2.1%(+6.89)#413 |
| 20. | 35824 | 8.9% | 2.4%(+6.45)#20 | 2.1%(+6.71)#441 |
| 21. | 35480 | 8.9% | 2.4%(+6.45)#21 | 2.1%(+6.70)#442 |
| 22. | 35803 | 8.6% | 2.4%(+6.24)#22 | 2.1%(+6.49)#470 |
| 23. | 35749 | 8.4% | 2.4%(+6.02)#23 | 2.1%(+6.28)#495 |
| 24. | 35958 | 8.3% | 2.4%(+5.90)#24 | 2.1%(+6.16)#517 |
| 25. | 36376 | 8.3% | 2.4%(+5.90)#25 | 2.1%(+6.16)#518 |
| 26. | 35974 | 8.2% | 2.4%(+5.80)#26 | 2.1%(+6.06)#537 |
| 27. | 35757 | 8.1% | 2.4%(+5.72)#27 | 2.1%(+5.98)#549 |
| 28. | 35670 | 7.9% | 2.4%(+5.45)#28 | 2.1%(+5.70)#595 |
| 29. | 35632 | 7.7% | 2.4%(+5.26)#29 | 2.1%(+5.52)#626 |
| 30. | 35750 | 7.6% | 2.4%(+5.24)#30 | 2.1%(+5.49)#631 |
| 31. | 35175 | 7.6% | 2.4%(+5.21)#31 | 2.1%(+5.47)#635 |
| 32. | 35456 | 7.1% | 2.4%(+4.71)#32 | 2.1%(+4.97)#725 |
| 33. | 36908 | 6.7% | 2.4%(+4.29)#33 | 2.1%(+4.54)#828 |
| 34. | 35808 | 6.7% | 2.4%(+4.25)#34 | 2.1%(+4.50)#838 |
| 35. | 36482 | 6.6% | 2.4%(+4.17)#35 | 2.1%(+4.43)#858 |
| 36. | 35746 | 6.5% | 2.4%(+4.12)#36 | 2.1%(+4.38)#878 |
| 37. | 36115 | 6.5% | 2.4%(+4.04)#37 | 2.1%(+4.30)#905 |
| 38. | 36026 | 6.3% | 2.4%(+3.85)#38 | 2.1%(+4.11)#973 |
| 39. | 35761 | 6.3% | 2.4%(+3.85)#39 | 2.1%(+4.11)#975 |
| 40. | 36041 | 6.2% | 2.4%(+3.82)#40 | 2.1%(+4.08)#989 |
| 41. | 36093 | 6.2% | 2.4%(+3.81)#41 | 2.1%(+4.07)#996 |
| 42. | 35984 | 6.2% | 2.4%(+3.77)#42 | 2.1%(+4.03)#1,011 |
| 43. | 35671 | 6.0% | 2.4%(+3.55)#43 | 2.1%(+3.81)#1,099 |
| 44. | 35649 | 5.7% | 2.4%(+3.31)#44 | 2.1%(+3.57)#1,217 |
| 45. | 36539 | 5.6% | 2.4%(+3.24)#45 | 2.1%(+3.50)#1,250 |
| 46. | 35053 | 5.5% | 2.4%(+3.11)#46 | 2.1%(+3.37)#1,319 |
| 47. | 35004 | 5.5% | 2.4%(+3.09)#47 | 2.1%(+3.35)#1,325 |
| 48. | 36758 | 5.2% | 2.4%(+2.79)#48 | 2.1%(+3.05)#1,517 |
| 49. | 36602 | 5.1% | 2.4%(+2.64)#49 | 2.1%(+2.90)#1,631 |
| 50. | 36089 | 5.0% | 2.4%(+2.56)#50 | 2.1%(+2.82)#1,685 |
| 51. | 35143 | 4.9% | 2.4%(+2.51)#51 | 2.1%(+2.77)#1,718 |
| 52. | 36528 | 4.9% | 2.4%(+2.47)#52 | 2.1%(+2.73)#1,761 |
| 53. | 35244 | 4.8% | 2.4%(+2.44)#53 | 2.1%(+2.70)#1,785 |
| 54. | 35613 | 4.8% | 2.4%(+2.44)#54 | 2.1%(+2.69)#1,794 |
| 55. | 35811 | 4.7% | 2.4%(+2.34)#55 | 2.1%(+2.59)#1,885 |
| 56. | 35759 | 4.7% | 2.4%(+2.34)#56 | 2.1%(+2.59)#1,887 |
| 57. | 35748 | 4.7% | 2.4%(+2.27)#57 | 2.1%(+2.53)#1,960 |
| 58. | 35603 | 4.7% | 2.4%(+2.26)#58 | 2.1%(+2.52)#1,969 |
| 59. | 36776 | 4.6% | 2.4%(+2.15)#59 | 2.1%(+2.41)#2,062 |
| 60. | 36475 | 4.5% | 2.4%(+2.12)#60 | 2.1%(+2.37)#2,094 |
| 61. | 36052 | 4.5% | 2.4%(+2.11)#61 | 2.1%(+2.37)#2,096 |
| 62. | 35035 | 4.4% | 2.4%(+2.04)#62 | 2.1%(+2.30)#2,195 |
| 63. | 35473 | 4.4% | 2.4%(+2.00)#63 | 2.1%(+2.26)#2,249 |
| 64. | 35183 | 4.4% | 2.4%(+1.99)#64 | 2.1%(+2.25)#2,258 |
| 65. | 35406 | 4.4% | 2.4%(+1.97)#65 | 2.1%(+2.23)#2,286 |
| 66. | 35203 | 4.2% | 2.4%(+1.83)#66 | 2.1%(+2.09)#2,450 |
| 67. | 36049 | 4.2% | 2.4%(+1.77)#67 | 2.1%(+2.03)#2,513 |
| 68. | 36849 | 4.1% | 2.4%(+1.72)#68 | 2.1%(+1.98)#2,583 |
| 69. | 36875 | 4.1% | 2.4%(+1.69)#69 | 2.1%(+1.95)#2,618 |
| 70. | 35747 | 4.0% | 2.4%(+1.56)#70 | 2.1%(+1.81)#2,830 |
| 71. | 36278 | 4.0% | 2.4%(+1.55)#71 | 2.1%(+1.81)#2,834 |
| 72. | 35022 | 3.9% | 2.4%(+1.54)#72 | 2.1%(+1.80)#2,855 |
| 73. | 36279 | 3.9% | 2.4%(+1.49)#73 | 2.1%(+1.74)#2,946 |
| 74. | 36521 | 3.9% | 2.4%(+1.47)#74 | 2.1%(+1.73)#2,966 |
| 75. | 35905 | 3.9% | 2.4%(+1.45)#75 | 2.1%(+1.70)#3,000 |
| 76. | 35222 | 3.8% | 2.4%(+1.43)#76 | 2.1%(+1.69)#3,019 |
| 77. | 35133 | 3.8% | 2.4%(+1.41)#77 | 2.1%(+1.67)#3,058 |
| 78. | 35766 | 3.8% | 2.4%(+1.38)#78 | 2.1%(+1.64)#3,122 |
| 79. | 35564 | 3.7% | 2.4%(+1.34)#79 | 2.1%(+1.59)#3,213 |
| 80. | 36830 | 3.7% | 2.4%(+1.34)#80 | 2.1%(+1.59)#3,214 |
| 81. | 36024 | 3.7% | 2.4%(+1.31)#81 | 2.1%(+1.56)#3,262 |
| 82. | 35673 | 3.7% | 2.4%(+1.28)#82 | 2.1%(+1.53)#3,335 |
| 83. | 36081 | 3.7% | 2.4%(+1.27)#83 | 2.1%(+1.53)#3,342 |
| 84. | 36526 | 3.7% | 2.4%(+1.26)#84 | 2.1%(+1.52)#3,369 |
| 85. | 35739 | 3.7% | 2.4%(+1.25)#85 | 2.1%(+1.51)#3,385 |
| 86. | 35582 | 3.6% | 2.4%(+1.18)#86 | 2.1%(+1.43)#3,542 |
| 87. | 35146 | 3.4% | 2.4%(+1.03)#87 | 2.1%(+1.29)#3,881 |
| 88. | 35622 | 3.4% | 2.4%(+0.974)#88 | 2.1%(+1.23)#3,998 |
| 89. | 35543 | 3.4% | 2.4%(+0.973)#89 | 2.1%(+1.23)#3,999 |
| 90. | 35242 | 3.4% | 2.4%(+0.944)#90 | 2.1%(+1.20)#4,070 |
| 91. | 35475 | 3.3% | 2.4%(+0.931)#91 | 2.1%(+1.19)#4,092 |
| 92. | 35614 | 3.3% | 2.4%(+0.866)#92 | 2.1%(+1.12)#4,264 |
| 93. | 35043 | 3.2% | 2.4%(+0.824)#93 | 2.1%(+1.08)#4,381 |
| 94. | 35611 | 3.2% | 2.4%(+0.784)#94 | 2.1%(+1.04)#4,483 |
| 95. | 35805 | 3.2% | 2.4%(+0.764)#95 | 2.1%(+1.02)#4,538 |
| 96. | 35124 | 3.2% | 2.4%(+0.761)#96 | 2.1%(+1.02)#4,545 |
| 97. | 36832 | 3.2% | 2.4%(+0.761)#97 | 2.1%(+1.02)#4,548 |
| 98. | 36572 | 3.2% | 2.4%(+0.749)#98 | 2.1%(+1.01)#4,586 |
| 99. | 35233 | 3.1% | 2.4%(+0.735)#99 | 2.1%(+0.993)#4,621 |
| 100. | 35640 | 3.1% | 2.4%(+0.722)#100 | 2.1%(+0.979)#4,657 |
Common Questions
What are the Top 10 Zip Codes with the Highest Percentage of Population Employed in Architecture & Engineering in Alabama?
Top 10 Zip Codes with the Highest Percentage of Population Employed in Architecture & Engineering in Alabama are:
What zip code has the Highest Percentage of Population Employed in Architecture & Engineering in Alabama?
35443 has the Highest Percentage of Population Employed in Architecture & Engineering in Alabama with 41.3%.
What is the Percentage of Population Employed in Architecture & Engineering in the State of Alabama?
Percentage of Population Employed in Architecture & Engineering in Alabama is 2.4%.
What is the Percentage of Population Employed in Architecture & Engineering in the United States?
Percentage of Population Employed in Architecture & Engineering in the United States is 2.1%.