Seba Dalkai, AZ Map & Demographics
Seba Dalkai Map
Seba Dalkai Overview
$14,780
PER CAPITA INCOME
$58,750
AVG FAMILY INCOME
$58,750
AVG HOUSEHOLD INCOME
0.39
INEQUALITY / GINI INDEX
132
TOTAL POPULATION
61
MALE POPULATION
71
FEMALE POPULATION
85.92
MALES / 100 FEMALES
116.39
FEMALES / 100 MALES
24.5
MEDIAN AGE
8.0
AVG FAMILY SIZE
4.9
AVG HOUSEHOLD SIZE
26
LABOR FORCE [ PEOPLE ]
29.5%
PERCENT IN LABOR FORCE
Income in Seba Dalkai
Income Overview in Seba Dalkai
Per Capita Income in Seba Dalkai is $14,780, while median incomes of families and households are $58,750 and $58,750 respectively.
| Characteristic | Number | Measure |
| Per Capita Income | 132 | $14,780 |
| Median Family Income | 15 | $58,750 |
| Mean Family Income | 15 | $68,280 |
| Median Household Income | 27 | $58,750 |
| Mean Household Income | 27 | $72,426 |
| Income Deficit | 15 | $0 |
| Wage / Income Gap (%) | 132 | 0.00% |
| Wage / Income Gap ($) | 132 | 100.00¢ per $1 |
| Gini / Inequality Index | 132 | 0.39 |
Earnings by Sex in Seba Dalkai
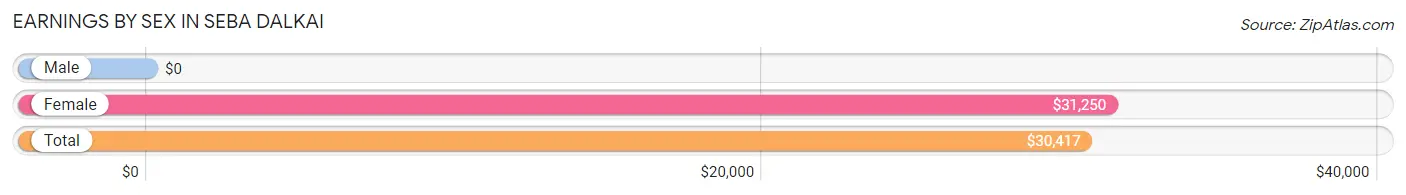
| Sex | Number | Average Earnings |
| Male | 14 (42.4%) | $0 |
| Female | 19 (57.6%) | $31,250 |
| Total | 33 (100.0%) | $30,417 |
Earnings by Sex by Income Bracket in Seba Dalkai
The most common earnings brackets in Seba Dalkai are $2,499 or less for men (4 | 28.6%) and $25,000 to $29,999 for women (5 | 26.3%).
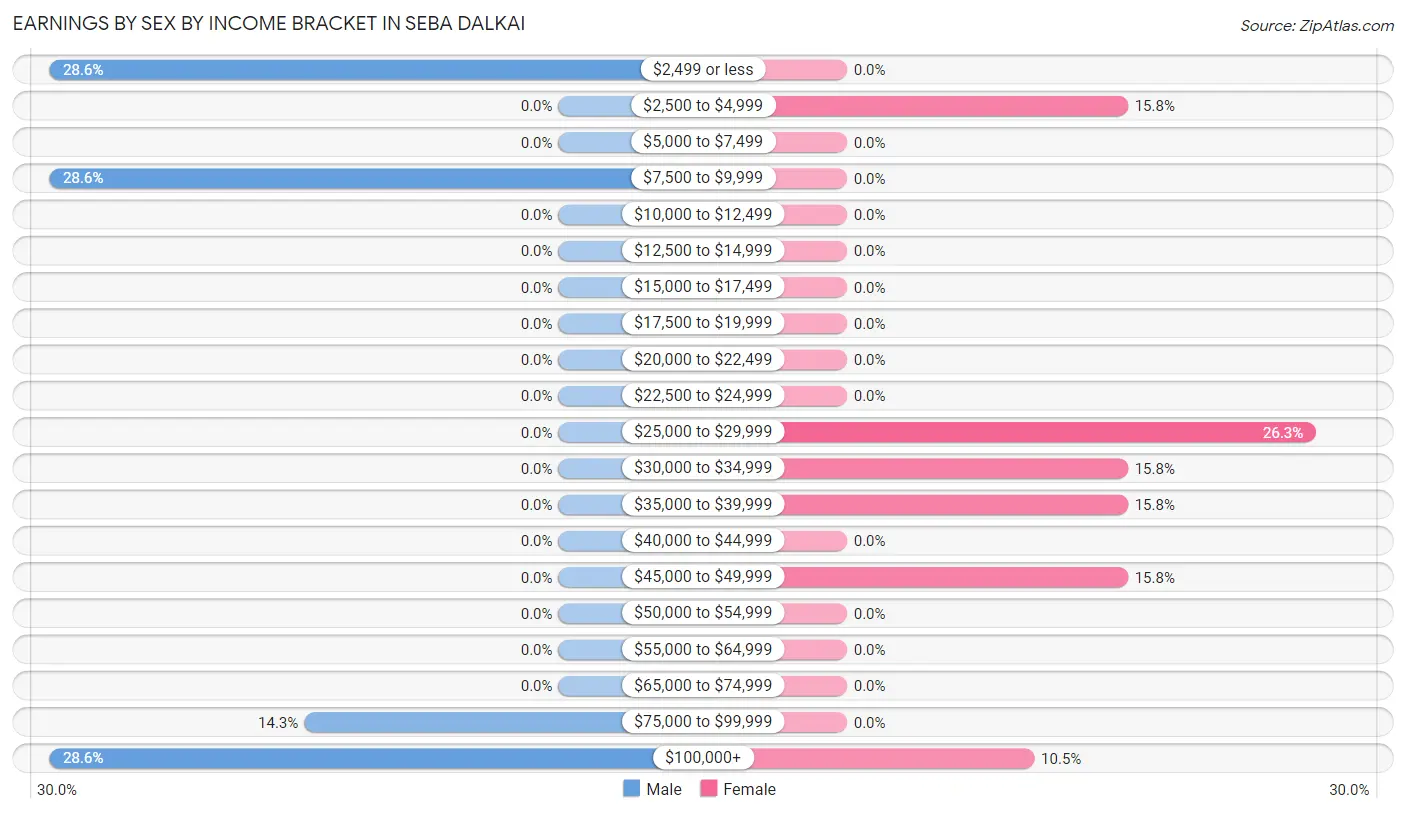
| Income | Male | Female |
| $2,499 or less | 4 (28.6%) | 0 (0.0%) |
| $2,500 to $4,999 | 0 (0.0%) | 3 (15.8%) |
| $5,000 to $7,499 | 0 (0.0%) | 0 (0.0%) |
| $7,500 to $9,999 | 4 (28.6%) | 0 (0.0%) |
| $10,000 to $12,499 | 0 (0.0%) | 0 (0.0%) |
| $12,500 to $14,999 | 0 (0.0%) | 0 (0.0%) |
| $15,000 to $17,499 | 0 (0.0%) | 0 (0.0%) |
| $17,500 to $19,999 | 0 (0.0%) | 0 (0.0%) |
| $20,000 to $22,499 | 0 (0.0%) | 0 (0.0%) |
| $22,500 to $24,999 | 0 (0.0%) | 0 (0.0%) |
| $25,000 to $29,999 | 0 (0.0%) | 5 (26.3%) |
| $30,000 to $34,999 | 0 (0.0%) | 3 (15.8%) |
| $35,000 to $39,999 | 0 (0.0%) | 3 (15.8%) |
| $40,000 to $44,999 | 0 (0.0%) | 0 (0.0%) |
| $45,000 to $49,999 | 0 (0.0%) | 3 (15.8%) |
| $50,000 to $54,999 | 0 (0.0%) | 0 (0.0%) |
| $55,000 to $64,999 | 0 (0.0%) | 0 (0.0%) |
| $65,000 to $74,999 | 0 (0.0%) | 0 (0.0%) |
| $75,000 to $99,999 | 2 (14.3%) | 0 (0.0%) |
| $100,000+ | 4 (28.6%) | 2 (10.5%) |
| Total | 14 (100.0%) | 19 (100.0%) |
Earnings by Sex by Educational Attainment in Seba Dalkai
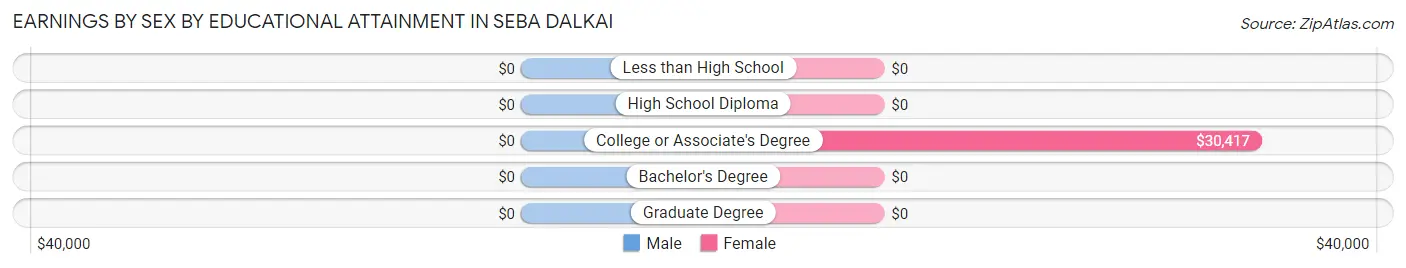
| Educational Attainment | Male Income | Female Income |
| Less than High School | - | - |
| High School Diploma | - | - |
| College or Associate's Degree | - | - |
| Bachelor's Degree | - | - |
| Graduate Degree | - | - |
| Total | - | - |
Family Income in Seba Dalkai
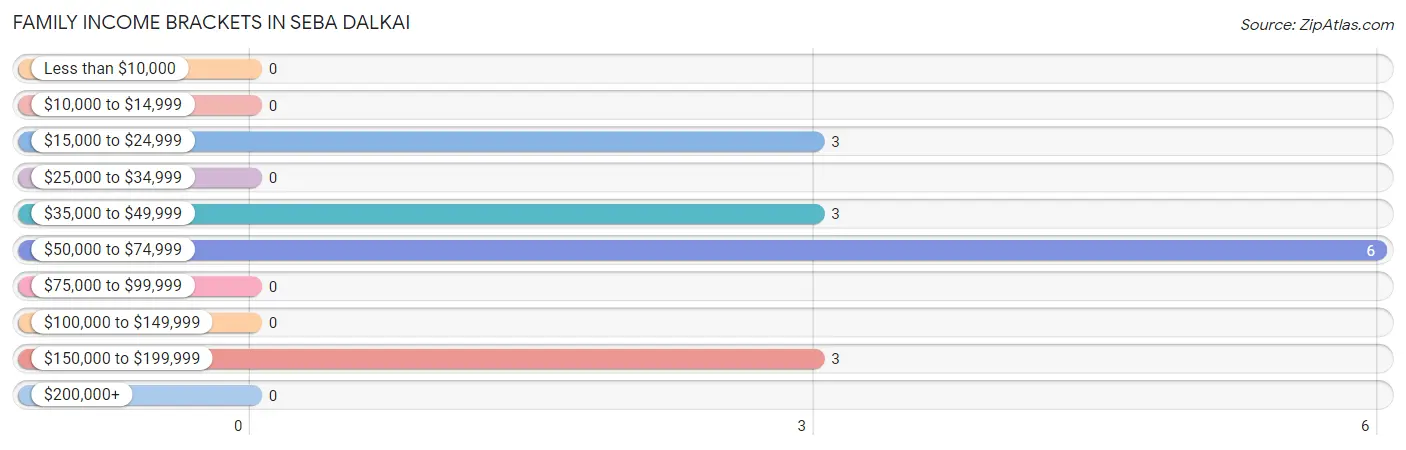
Family Income Brackets in Seba Dalkai
According to the Seba Dalkai family income data, there are 6 families falling into the $50,000 to $74,999 income range, which is the most common income bracket and makes up 40.0% of all families.
| Income Bracket | # Families | % Families |
| Less than $10,000 | 0 | 0.0% |
| $10,000 to $14,999 | 0 | 0.0% |
| $15,000 to $24,999 | 3 | 20.0% |
| $25,000 to $34,999 | 0 | 0.0% |
| $35,000 to $49,999 | 3 | 20.0% |
| $50,000 to $74,999 | 6 | 40.0% |
| $75,000 to $99,999 | 0 | 0.0% |
| $100,000 to $149,999 | 0 | 0.0% |
| $150,000 to $199,999 | 3 | 20.0% |
| $200,000+ | 0 | 0.0% |
Family Income by Famaliy Size in Seba Dalkai
| Income Bracket | # Families | Median Income |
| 2-Person Families | 3 (20.0%) | $0 |
| 3-Person Families | 3 (20.0%) | $0 |
| 4-Person Families | 0 (0.0%) | $0 |
| 5-Person Families | 0 (0.0%) | $0 |
| 6-Person Families | 3 (20.0%) | $0 |
| 7+ Person Families | 6 (40.0%) | $0 |
| Total | 15 (100.0%) | $58,750 |
Family Income by Number of Earners in Seba Dalkai
| Number of Earners | # Families | Median Income |
| No Earners | 6 (40.0%) | $0 |
| 1 Earner | 3 (20.0%) | $0 |
| 2 Earners | 3 (20.0%) | $0 |
| 3+ Earners | 3 (20.0%) | $0 |
| Total | 15 (100.0%) | $58,750 |
Household Income in Seba Dalkai
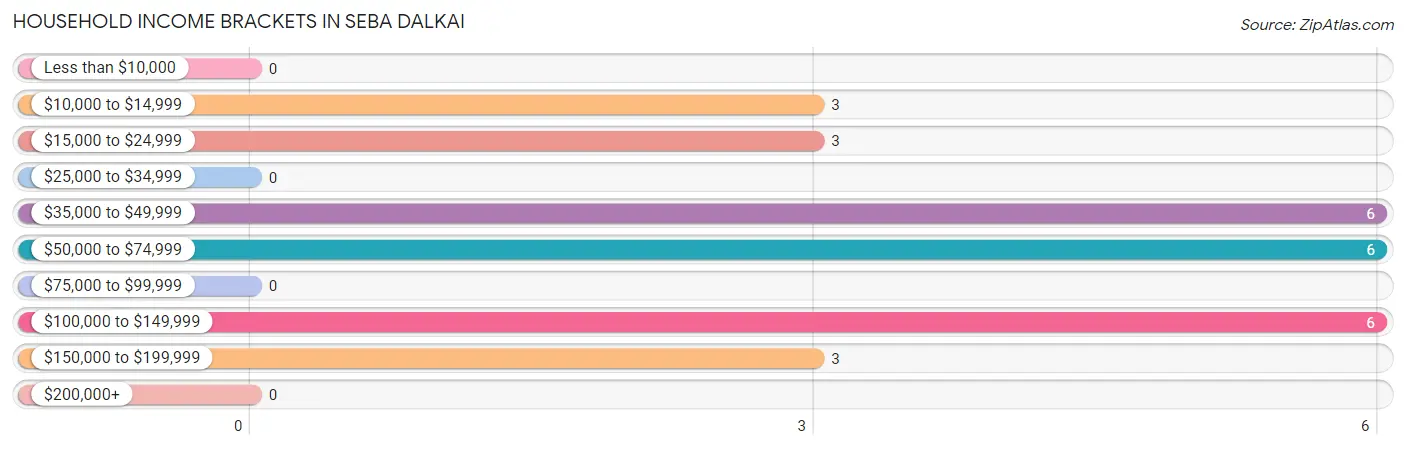
Household Income Brackets in Seba Dalkai
With 6 households falling in the category, the $35,000 to $49,999 income range is the most frequent in Seba Dalkai, accounting for 22.2% of all households.
| Income Bracket | # Households | % Households |
| Less than $10,000 | 0 | 0.0% |
| $10,000 to $14,999 | 3 | 11.1% |
| $15,000 to $24,999 | 3 | 11.1% |
| $25,000 to $34,999 | 0 | 0.0% |
| $35,000 to $49,999 | 6 | 22.2% |
| $50,000 to $74,999 | 6 | 22.2% |
| $75,000 to $99,999 | 0 | 0.0% |
| $100,000 to $149,999 | 6 | 22.2% |
| $150,000 to $199,999 | 3 | 11.1% |
| $200,000+ | 0 | 0.0% |
Household Income by Householder Age in Seba Dalkai
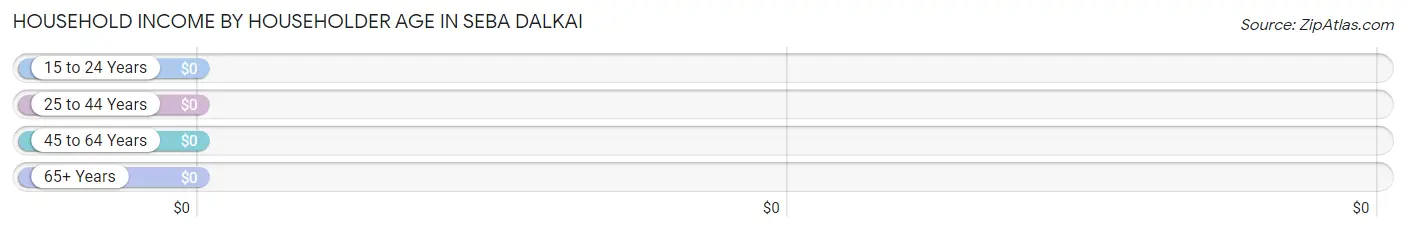
| Income Bracket | # Households | Median Income |
| 15 to 24 Years | 0 (0.0%) | $0 |
| 25 to 44 Years | 0 (0.0%) | $0 |
| 45 to 64 Years | 16 (59.3%) | $0 |
| 65+ Years | 11 (40.7%) | $0 |
| Total | 27 (100.0%) | $58,750 |
Poverty in Seba Dalkai
Income Below Poverty by Sex and Age in Seba Dalkai
With 21.3% poverty level for males and 15.5% for females among the residents of Seba Dalkai, 12 to 14 year old males and 12 to 14 year old females are the most vulnerable to poverty, with 3 males (100.0%) and 4 females (100.0%) in their respective age groups living below the poverty level.
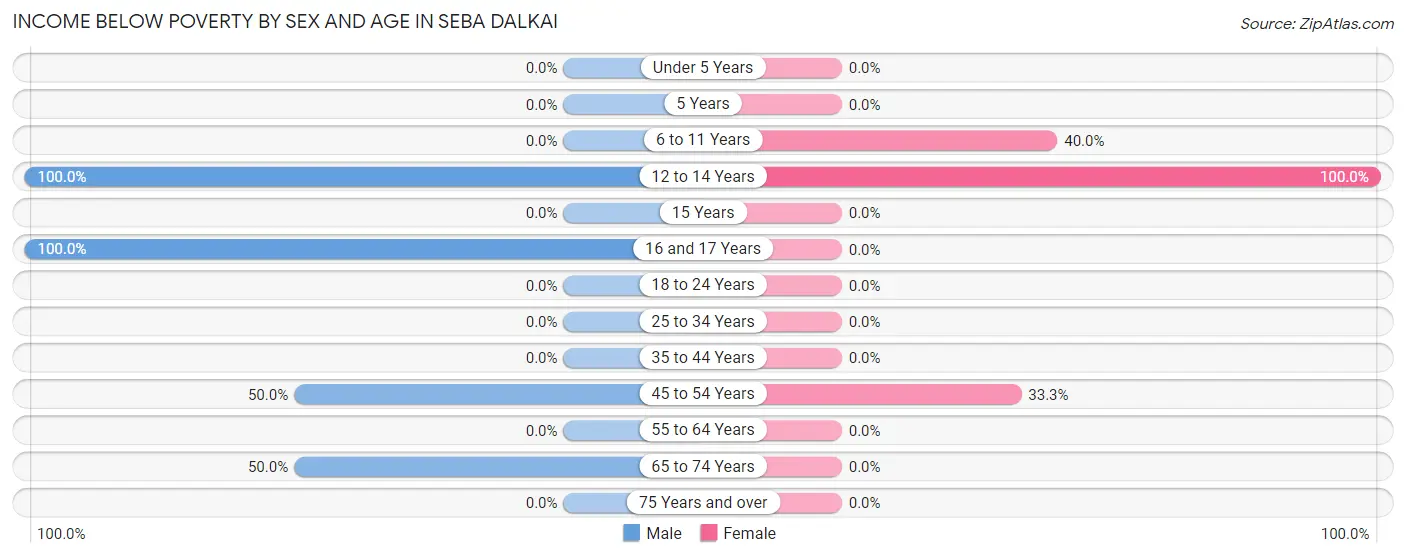
| Age Bracket | Male | Female |
| Under 5 Years | 0 (0.0%) | 0 (0.0%) |
| 5 Years | 0 (0.0%) | 0 (0.0%) |
| 6 to 11 Years | 0 (0.0%) | 4 (40.0%) |
| 12 to 14 Years | 3 (100.0%) | 4 (100.0%) |
| 15 Years | 0 (0.0%) | 0 (0.0%) |
| 16 and 17 Years | 3 (100.0%) | 0 (0.0%) |
| 18 to 24 Years | 0 (0.0%) | 0 (0.0%) |
| 25 to 34 Years | 0 (0.0%) | 0 (0.0%) |
| 35 to 44 Years | 0 (0.0%) | 0 (0.0%) |
| 45 to 54 Years | 4 (50.0%) | 3 (33.3%) |
| 55 to 64 Years | 0 (0.0%) | 0 (0.0%) |
| 65 to 74 Years | 3 (50.0%) | 0 (0.0%) |
| 75 Years and over | 0 (0.0%) | 0 (0.0%) |
| Total | 13 (21.3%) | 11 (15.5%) |
Income Above Poverty by Sex and Age in Seba Dalkai
According to the poverty statistics in Seba Dalkai, males aged under 5 years and females aged under 5 years are the age groups that are most secure financially, with 100.0% of males and 100.0% of females in these age groups living above the poverty line.
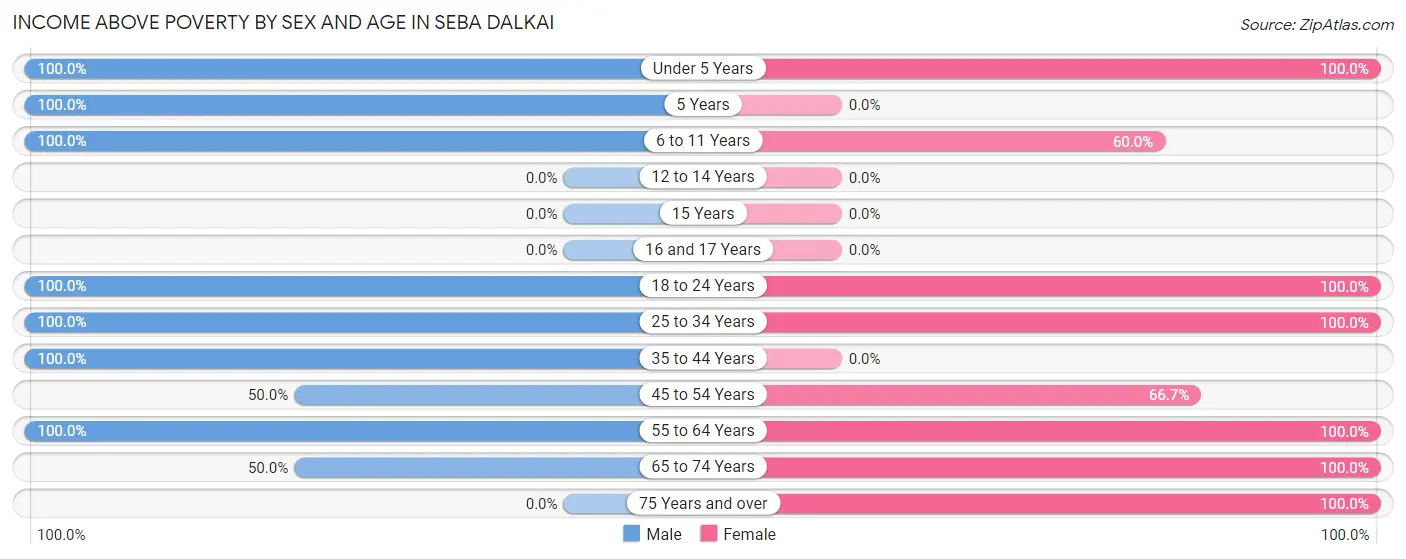
| Age Bracket | Male | Female |
| Under 5 Years | 10 (100.0%) | 9 (100.0%) |
| 5 Years | 5 (100.0%) | 0 (0.0%) |
| 6 to 11 Years | 3 (100.0%) | 6 (60.0%) |
| 12 to 14 Years | 0 (0.0%) | 0 (0.0%) |
| 15 Years | 0 (0.0%) | 0 (0.0%) |
| 16 and 17 Years | 0 (0.0%) | 0 (0.0%) |
| 18 to 24 Years | 8 (100.0%) | 13 (100.0%) |
| 25 to 34 Years | 8 (100.0%) | 12 (100.0%) |
| 35 to 44 Years | 5 (100.0%) | 0 (0.0%) |
| 45 to 54 Years | 4 (50.0%) | 6 (66.7%) |
| 55 to 64 Years | 2 (100.0%) | 3 (100.0%) |
| 65 to 74 Years | 3 (50.0%) | 8 (100.0%) |
| 75 Years and over | 0 (0.0%) | 3 (100.0%) |
| Total | 48 (78.7%) | 60 (84.5%) |
Income Below Poverty Among Married-Couple Families in Seba Dalkai
The poverty statistics for married-couple families in Seba Dalkai show that 50.0% or 3 of the total 6 families live below the poverty line. Families with 3 or 4 children have the highest poverty rate of 100.0%, comprising of 3 families. On the other hand, families with 5 or more children have the lowest poverty rate of 0.0%, which includes 0 families.
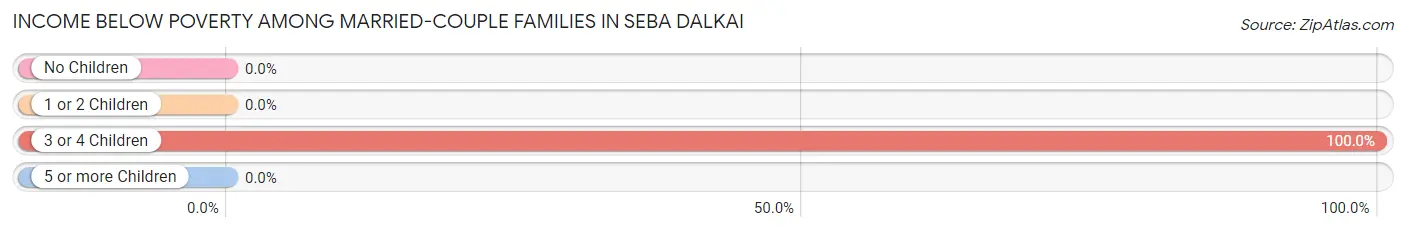
| Children | Above Poverty | Below Poverty |
| No Children | 0 (0.0%) | 0 (0.0%) |
| 1 or 2 Children | 0 (0.0%) | 0 (0.0%) |
| 3 or 4 Children | 0 (0.0%) | 3 (100.0%) |
| 5 or more Children | 3 (100.0%) | 0 (0.0%) |
| Total | 3 (50.0%) | 3 (50.0%) |
Income Below Poverty Among Single-Parent Households in Seba Dalkai
| Children | Single Father | Single Mother |
| No Children | 0 (0.0%) | 0 (0.0%) |
| 1 or 2 Children | 0 (0.0%) | 0 (0.0%) |
| 3 or 4 Children | 0 (0.0%) | 0 (0.0%) |
| 5 or more Children | 0 (0.0%) | 0 (0.0%) |
| Total | 0 (0.0%) | 0 (0.0%) |
Income Below Poverty Among Married-Couple vs Single-Parent Households in Seba Dalkai
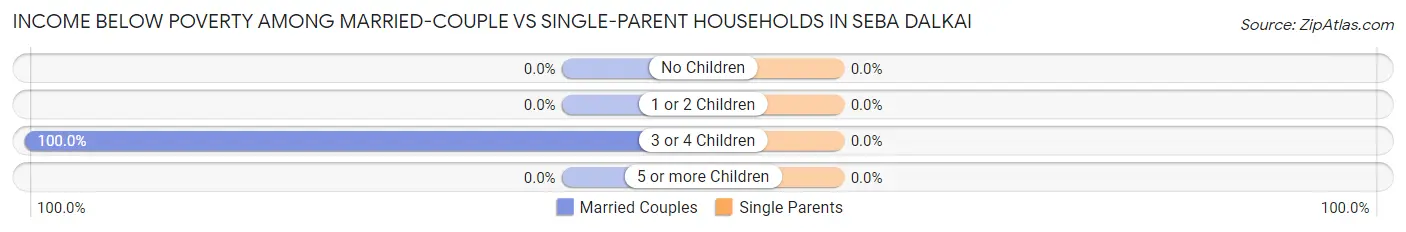
| Children | Married-Couple Families | Single-Parent Households |
| No Children | 0 (0.0%) | 0 (0.0%) |
| 1 or 2 Children | 0 (0.0%) | 0 (0.0%) |
| 3 or 4 Children | 3 (100.0%) | 0 (0.0%) |
| 5 or more Children | 0 (0.0%) | 0 (0.0%) |
| Total | 3 (50.0%) | 0 (0.0%) |
Race in Seba Dalkai
The most populous races in Seba Dalkai are , and Native / Alaskan (132 | 100.0%).
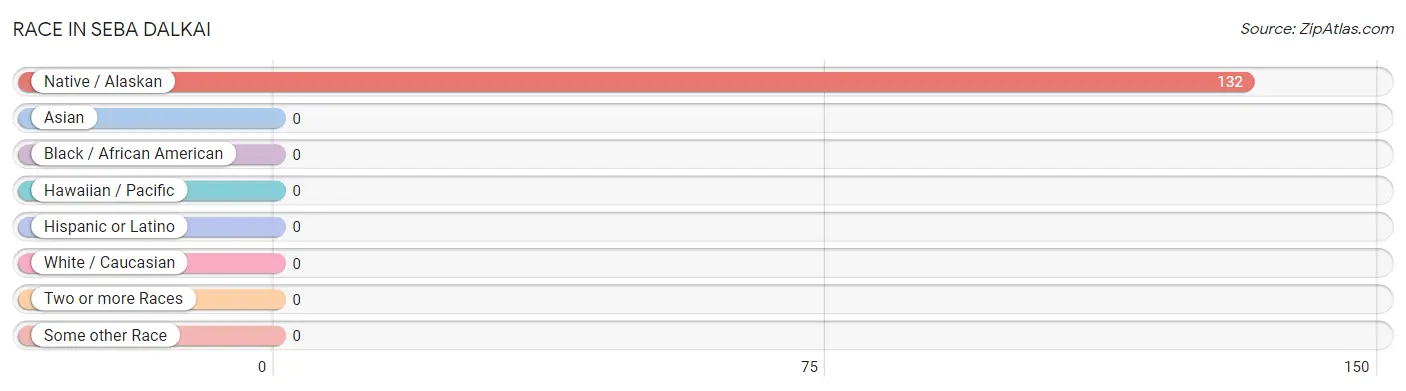
| Race | # Population | % Population |
| Asian | 0 | 0.0% |
| Black / African American | 0 | 0.0% |
| Hawaiian / Pacific | 0 | 0.0% |
| Hispanic or Latino | 0 | 0.0% |
| Native / Alaskan | 132 | 100.0% |
| White / Caucasian | 0 | 0.0% |
| Two or more Races | 0 | 0.0% |
| Some other Race | 0 | 0.0% |
| Total | 132 | 100.0% |
Ancestry in Seba Dalkai
The most populous ancestries reported in Seba Dalkai are , and Navajo (132 | 100.0%), together accounting for 100.0% of all Seba Dalkai residents.

| Ancestry | # Population | % Population |
| Navajo | 132 | 100.0% | View All 1 Rows |
Immigrants in Seba Dalkai

| Immigration Origin | # Population | % Population | View All 0 Rows |
Sex and Age in Seba Dalkai
Sex and Age in Seba Dalkai
The most populous age groups in Seba Dalkai are Under 5 Years (10 | 16.4%) for men and 20 to 24 Years (13 | 18.3%) for women.
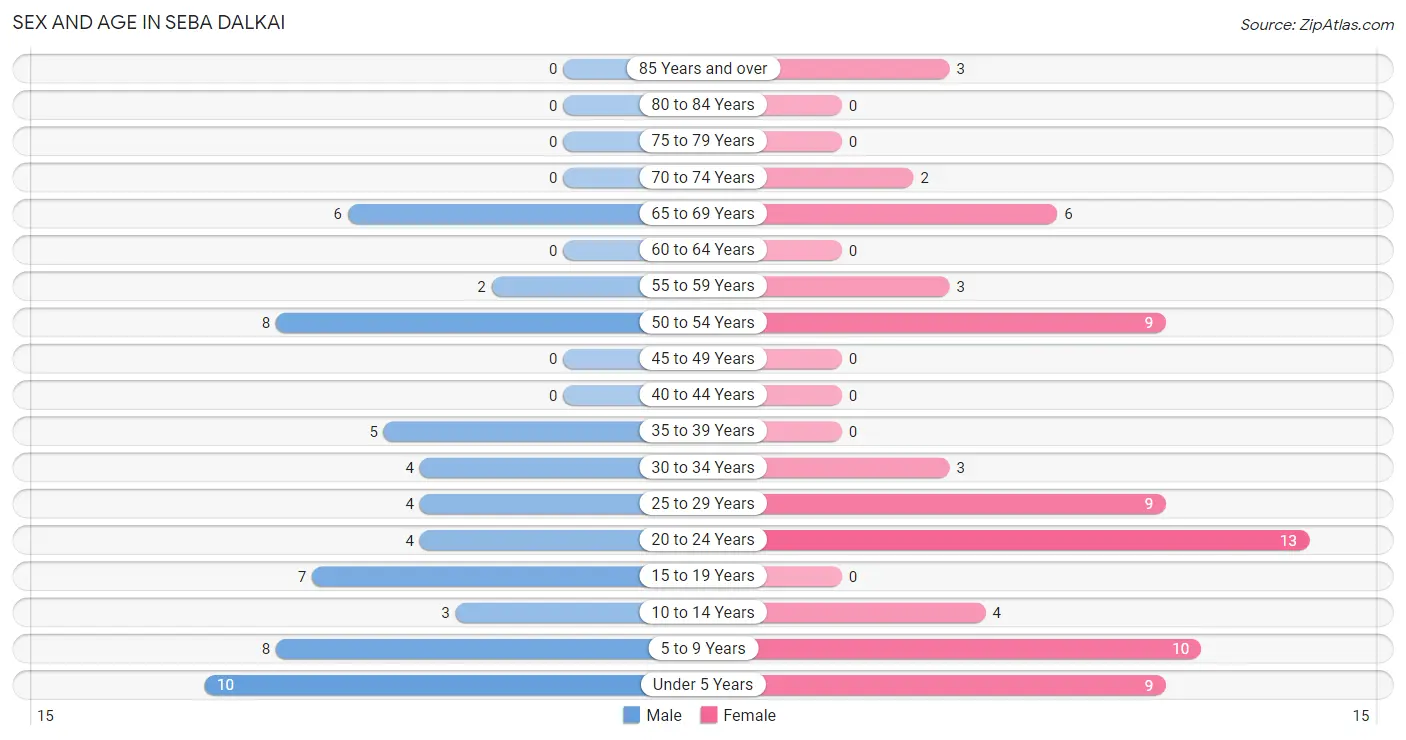
| Age Bracket | Male | Female |
| Under 5 Years | 10 (16.4%) | 9 (12.7%) |
| 5 to 9 Years | 8 (13.1%) | 10 (14.1%) |
| 10 to 14 Years | 3 (4.9%) | 4 (5.6%) |
| 15 to 19 Years | 7 (11.5%) | 0 (0.0%) |
| 20 to 24 Years | 4 (6.6%) | 13 (18.3%) |
| 25 to 29 Years | 4 (6.6%) | 9 (12.7%) |
| 30 to 34 Years | 4 (6.6%) | 3 (4.2%) |
| 35 to 39 Years | 5 (8.2%) | 0 (0.0%) |
| 40 to 44 Years | 0 (0.0%) | 0 (0.0%) |
| 45 to 49 Years | 0 (0.0%) | 0 (0.0%) |
| 50 to 54 Years | 8 (13.1%) | 9 (12.7%) |
| 55 to 59 Years | 2 (3.3%) | 3 (4.2%) |
| 60 to 64 Years | 0 (0.0%) | 0 (0.0%) |
| 65 to 69 Years | 6 (9.8%) | 6 (8.5%) |
| 70 to 74 Years | 0 (0.0%) | 2 (2.8%) |
| 75 to 79 Years | 0 (0.0%) | 0 (0.0%) |
| 80 to 84 Years | 0 (0.0%) | 0 (0.0%) |
| 85 Years and over | 0 (0.0%) | 3 (4.2%) |
| Total | 61 (100.0%) | 71 (100.0%) |
Families and Households in Seba Dalkai
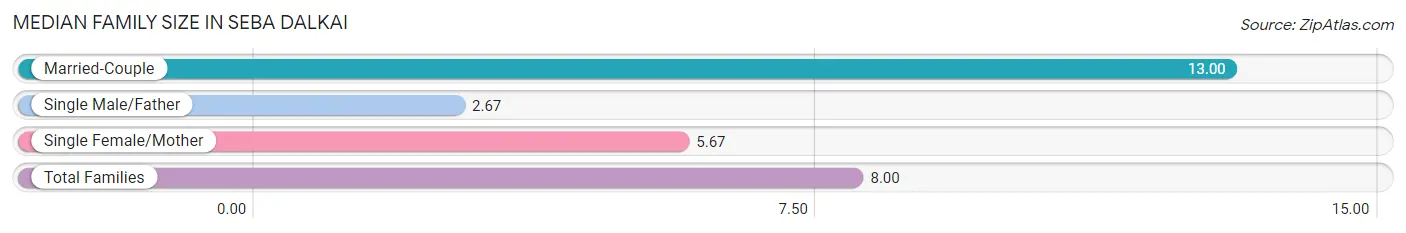
Median Family Size in Seba Dalkai
The median family size in Seba Dalkai is 8.00 persons per family, with married-couple families (6 | 40.0%) accounting for the largest median family size of 13 persons per family. On the other hand, single male/father families (3 | 20.0%) represent the smallest median family size with 2.67 persons per family.
| Family Type | # Families | Family Size |
| Married-Couple | 6 (40.0%) | 13.00 |
| Single Male/Father | 3 (20.0%) | 2.67 |
| Single Female/Mother | 6 (40.0%) | 5.67 |
| Total Families | 15 (100.0%) | 8.00 |
Median Household Size in Seba Dalkai
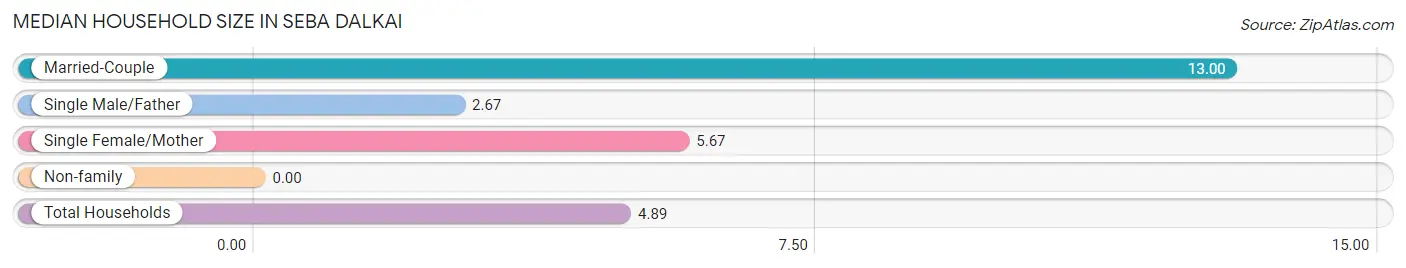
| Household Type | # Households | Household Size |
| Married-Couple | 6 (22.2%) | 13.00 |
| Single Male/Father | 3 (11.1%) | 2.67 |
| Single Female/Mother | 6 (22.2%) | 5.67 |
| Non-family | 12 (44.4%) | - |
| Total Households | 27 (100.0%) | 4.89 |
Household Size by Marriage Status in Seba Dalkai
Out of a total of 27 households in Seba Dalkai, 15 (55.6%) are family households, while 12 (44.4%) are nonfamily households. The most numerous type of family households are 7+ person households, comprising 6, and the most common type of nonfamily households are 1-person households, comprising 12.
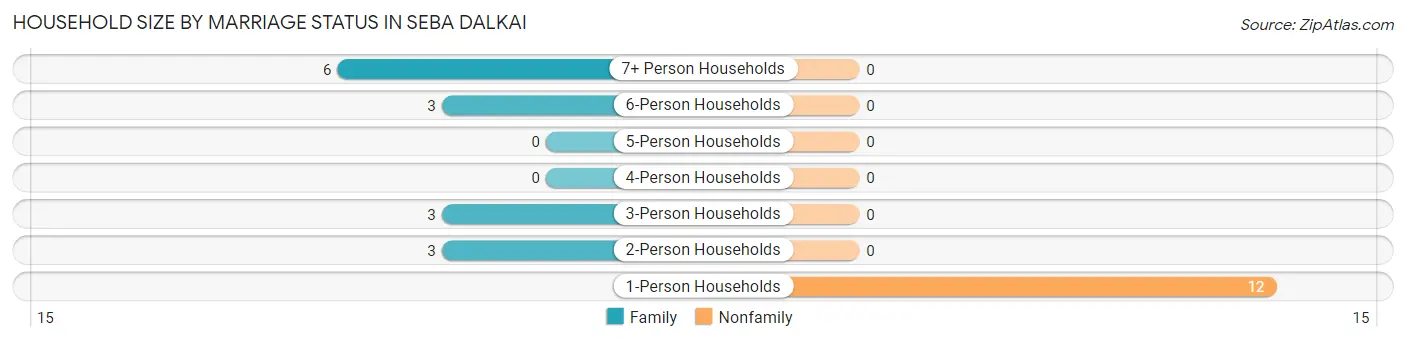
| Household Size | Family Households | Nonfamily Households |
| 1-Person Households | - | 12 (44.4%) |
| 2-Person Households | 3 (11.1%) | 0 (0.0%) |
| 3-Person Households | 3 (11.1%) | 0 (0.0%) |
| 4-Person Households | 0 (0.0%) | 0 (0.0%) |
| 5-Person Households | 0 (0.0%) | 0 (0.0%) |
| 6-Person Households | 3 (11.1%) | 0 (0.0%) |
| 7+ Person Households | 6 (22.2%) | 0 (0.0%) |
| Total | 15 (55.6%) | 12 (44.4%) |
Female Fertility in Seba Dalkai
Fertility by Age in Seba Dalkai
Average fertility rate in Seba Dalkai is 320.0 births per 1,000 women. Women in the age bracket of 20 to 34 years have the highest fertility rate with 320.0 births per 1,000 women. Women in the age bracket of 20 to 34 years acount for 100.0% of all women with births.
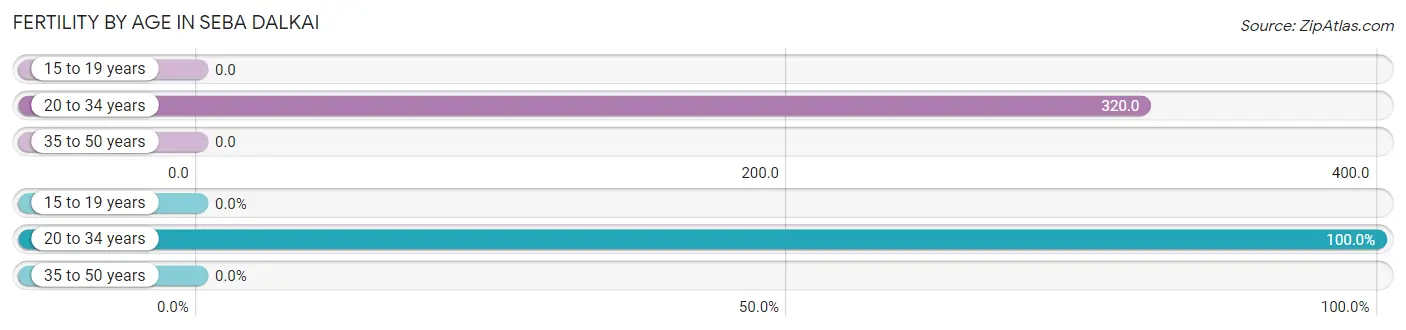
| Age Bracket | Women with Births | Births / 1,000 Women |
| 15 to 19 years | 0 (0.0%) | 0.0 |
| 20 to 34 years | 8 (100.0%) | 320.0 |
| 35 to 50 years | 0 (0.0%) | 0.0 |
| Total | 8 (100.0%) | 320.0 |
Fertility by Age by Marriage Status in Seba Dalkai
50.0% of women with births (8) in Seba Dalkai are married. The highest percentage of unmarried women with births falls into 20 to 34 years age bracket with 50.0% of them unmarried at the time of birth, while the lowest percentage of unmarried women with births belong to 20 to 34 years age bracket with 50.0% of them unmarried.
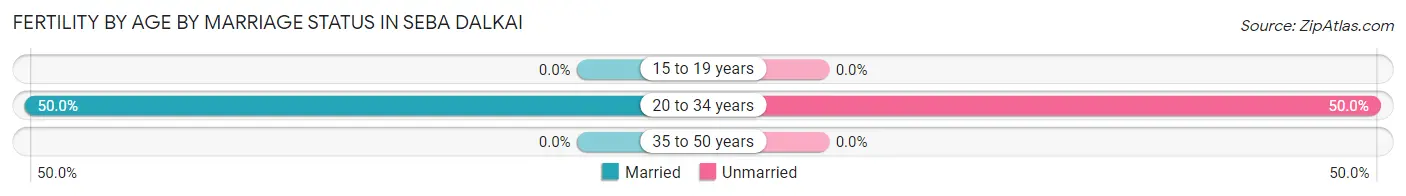
| Age Bracket | Married | Unmarried |
| 15 to 19 years | 0 (0.0%) | 0 (0.0%) |
| 20 to 34 years | 4 (50.0%) | 4 (50.0%) |
| 35 to 50 years | 0 (0.0%) | 0 (0.0%) |
| Total | 4 (50.0%) | 4 (50.0%) |
Fertility by Education in Seba Dalkai
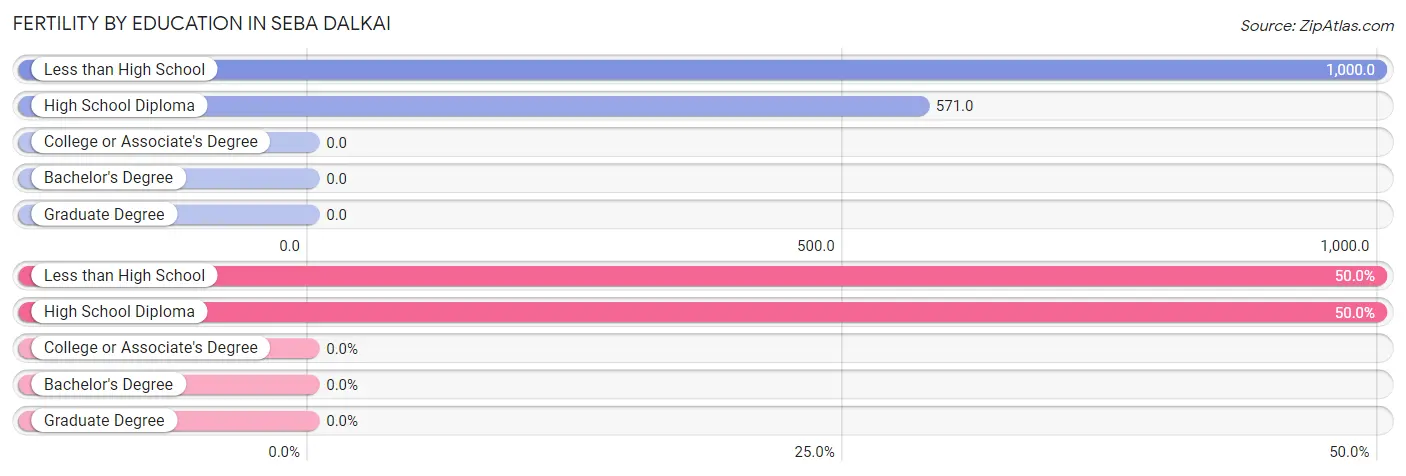
| Educational Attainment | Women with Births | Births / 1,000 Women |
| Less than High School | 4 (50.0%) | 1,000.0 |
| High School Diploma | 4 (50.0%) | 571.0 |
| College or Associate's Degree | 0 (0.0%) | 0.0 |
| Bachelor's Degree | 0 (0.0%) | 0.0 |
| Graduate Degree | 0 (0.0%) | 0.0 |
| Total | 8 (100.0%) | 320.0 |
Fertility by Education by Marriage Status in Seba Dalkai
50.0% of women with births in Seba Dalkai are unmarried. Women with the educational attainment of high school diploma are most likely to be married with 100.0% of them married at childbirth, while women with the educational attainment of less than high school are least likely to be married with 100.0% of them unmarried at childbirth.
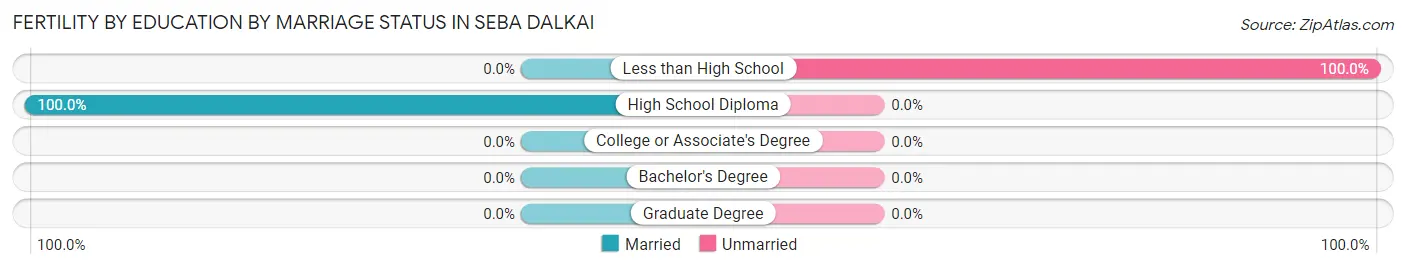
| Educational Attainment | Married | Unmarried |
| Less than High School | 0 (0.0%) | 4 (100.0%) |
| High School Diploma | 4 (100.0%) | 0 (0.0%) |
| College or Associate's Degree | 0 (0.0%) | 0 (0.0%) |
| Bachelor's Degree | 0 (0.0%) | 0 (0.0%) |
| Graduate Degree | 0 (0.0%) | 0 (0.0%) |
| Total | 4 (50.0%) | 4 (50.0%) |
Employment Characteristics in Seba Dalkai
Employment by Class of Employer in Seba Dalkai
Among the 26 employed individuals in Seba Dalkai, private company employees (21 | 80.8%), and federal government employees (5 | 19.2%) make up the most common classes of employment.
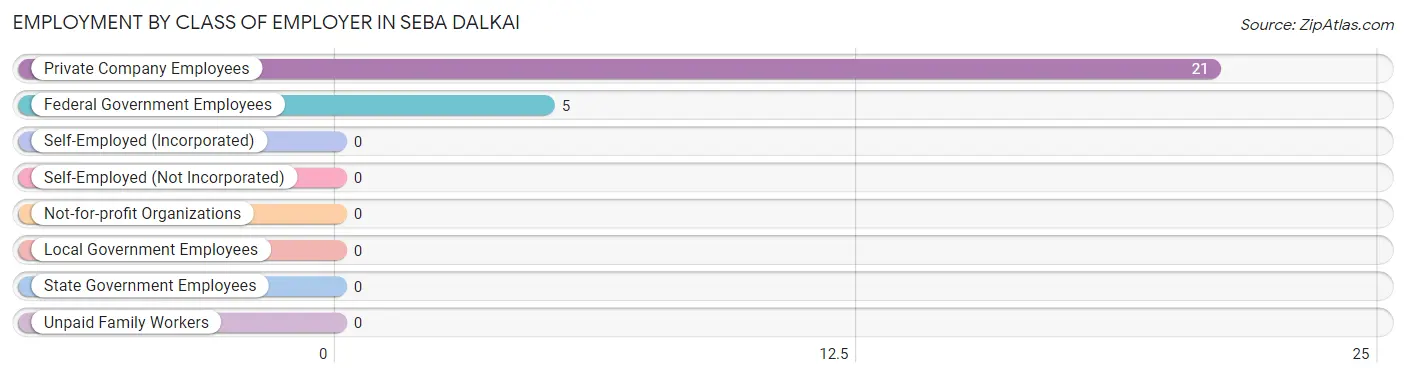
| Employer Class | # Employees | % Employees |
| Private Company Employees | 21 | 80.8% |
| Self-Employed (Incorporated) | 0 | 0.0% |
| Self-Employed (Not Incorporated) | 0 | 0.0% |
| Not-for-profit Organizations | 0 | 0.0% |
| Local Government Employees | 0 | 0.0% |
| State Government Employees | 0 | 0.0% |
| Federal Government Employees | 5 | 19.2% |
| Unpaid Family Workers | 0 | 0.0% |
| Total | 26 | 100.0% |
Employment Status by Age in Seba Dalkai
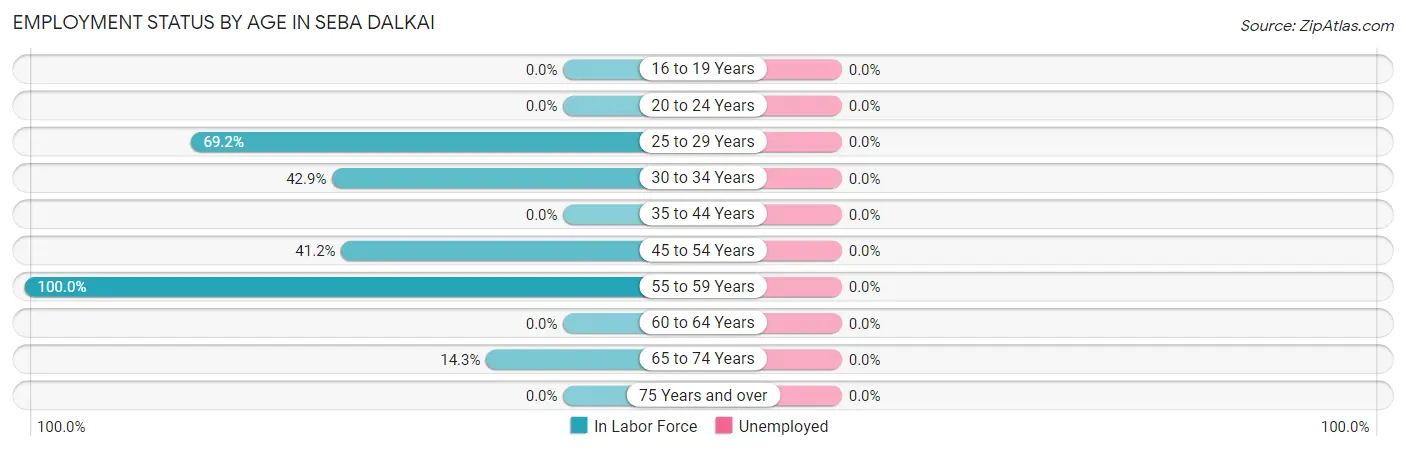
| Age Bracket | In Labor Force | Unemployed |
| 16 to 19 Years | 0 (0.0%) | 0 (0.0%) |
| 20 to 24 Years | 0 (0.0%) | 0 (0.0%) |
| 25 to 29 Years | 9 (69.2%) | 0 (0.0%) |
| 30 to 34 Years | 3 (42.9%) | 0 (0.0%) |
| 35 to 44 Years | 0 (0.0%) | 0 (0.0%) |
| 45 to 54 Years | 7 (41.2%) | 0 (0.0%) |
| 55 to 59 Years | 5 (100.0%) | 0 (0.0%) |
| 60 to 64 Years | 0 (0.0%) | 0 (0.0%) |
| 65 to 74 Years | 2 (14.3%) | 0 (0.0%) |
| 75 Years and over | 0 (0.0%) | 0 (0.0%) |
| Total | 26 (29.5%) | 0 (0.0%) |
Employment Status by Educational Attainment in Seba Dalkai
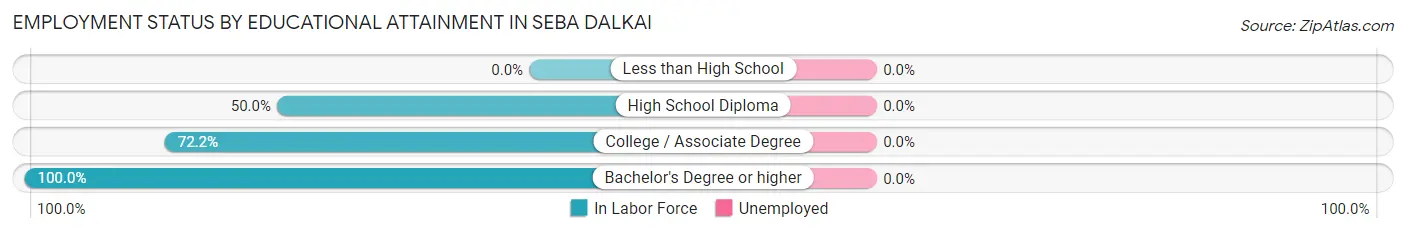
| Educational Attainment | In Labor Force | Unemployed |
| Less than High School | 0 (0.0%) | 0 (0.0%) |
| High School Diploma | 7 (50.0%) | 0 (0.0%) |
| College / Associate Degree | 13 (72.2%) | 0 (0.0%) |
| Bachelor's Degree or higher | 4 (100.0%) | 0 (0.0%) |
| Total | 24 (51.1%) | 0 (0.0%) |
Employment Occupations by Sex in Seba Dalkai
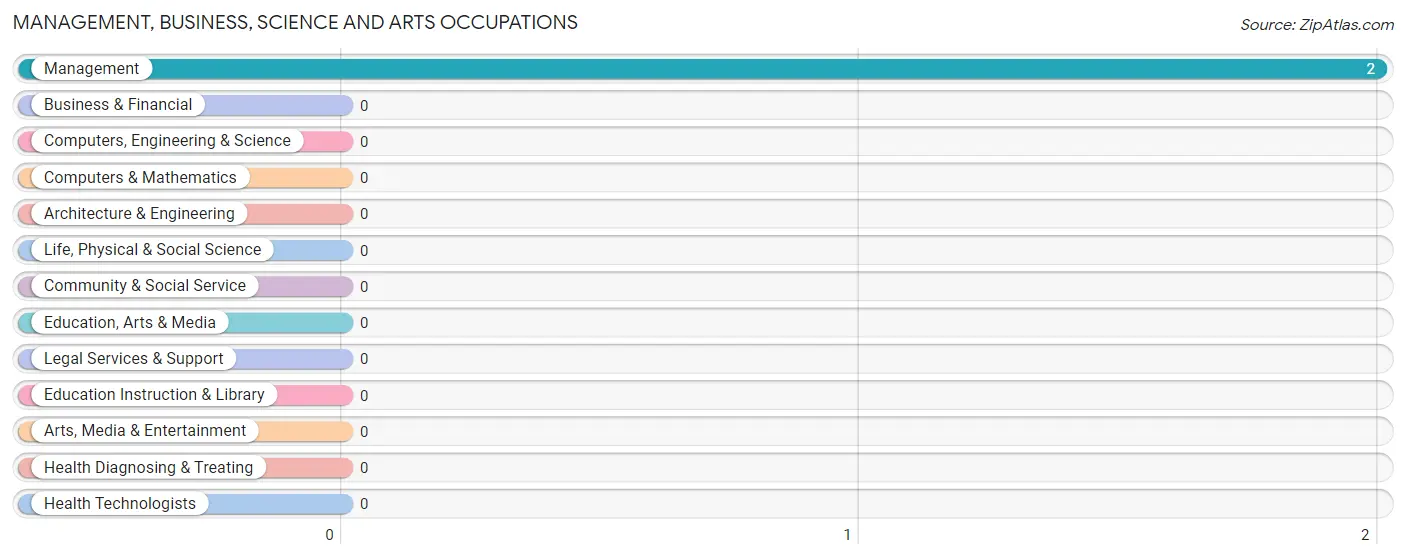
Management, Business, Science and Arts Occupations
The most common Management, Business, Science and Arts occupations in Seba Dalkai are , and Management (2 | 7.7%).
Management, Business, Science and Arts Occupations by Sex
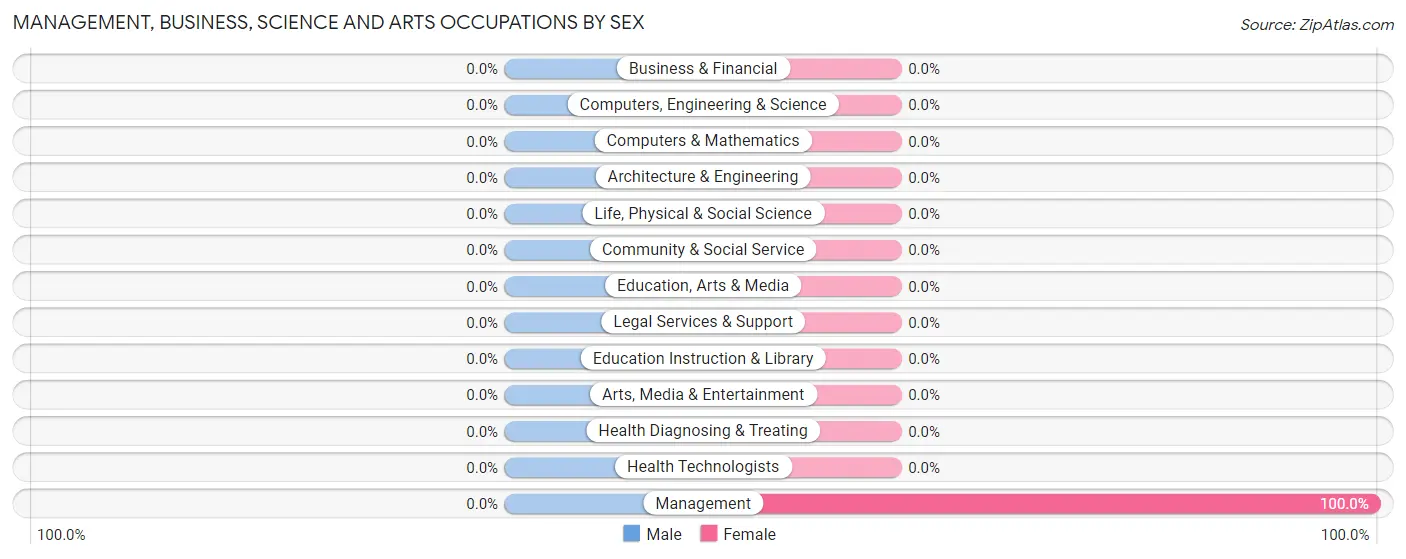
| Occupation | Male | Female |
| Management | 0 (0.0%) | 2 (100.0%) |
| Business & Financial | 0 (0.0%) | 0 (0.0%) |
| Computers, Engineering & Science | 0 (0.0%) | 0 (0.0%) |
| Computers & Mathematics | 0 (0.0%) | 0 (0.0%) |
| Architecture & Engineering | 0 (0.0%) | 0 (0.0%) |
| Life, Physical & Social Science | 0 (0.0%) | 0 (0.0%) |
| Community & Social Service | 0 (0.0%) | 0 (0.0%) |
| Education, Arts & Media | 0 (0.0%) | 0 (0.0%) |
| Legal Services & Support | 0 (0.0%) | 0 (0.0%) |
| Education Instruction & Library | 0 (0.0%) | 0 (0.0%) |
| Arts, Media & Entertainment | 0 (0.0%) | 0 (0.0%) |
| Health Diagnosing & Treating | 0 (0.0%) | 0 (0.0%) |
| Health Technologists | 0 (0.0%) | 0 (0.0%) |
| Total (Category) | 0 (0.0%) | 2 (100.0%) |
| Total (Overall) | 10 (38.5%) | 16 (61.5%) |
Services Occupations
The most common Services occupations in Seba Dalkai are , and Healthcare Support (8 | 30.8%).
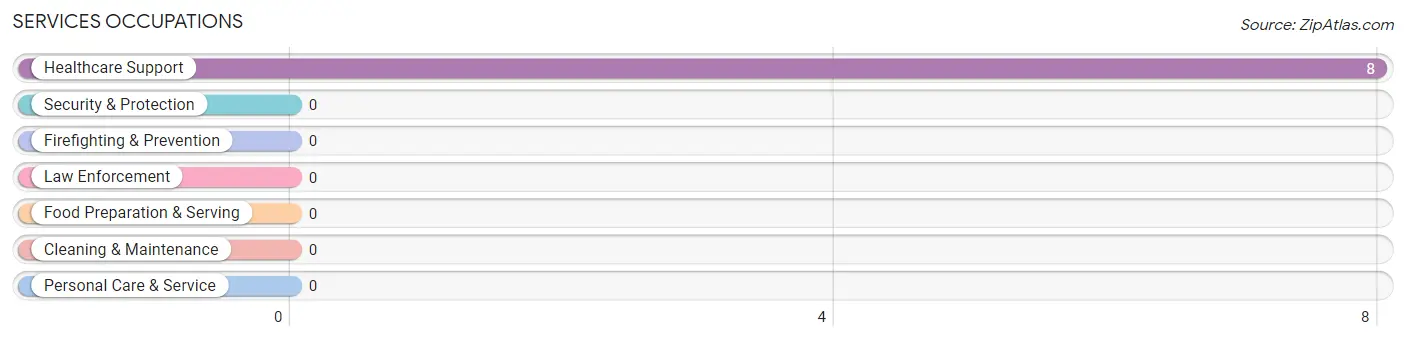
Services Occupations by Sex
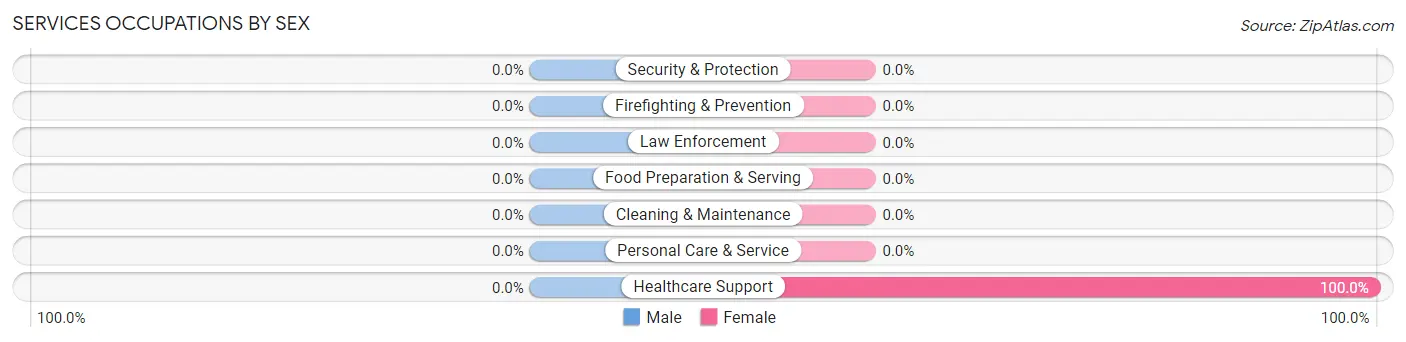
| Occupation | Male | Female |
| Healthcare Support | 0 (0.0%) | 8 (100.0%) |
| Security & Protection | 0 (0.0%) | 0 (0.0%) |
| Firefighting & Prevention | 0 (0.0%) | 0 (0.0%) |
| Law Enforcement | 0 (0.0%) | 0 (0.0%) |
| Food Preparation & Serving | 0 (0.0%) | 0 (0.0%) |
| Cleaning & Maintenance | 0 (0.0%) | 0 (0.0%) |
| Personal Care & Service | 0 (0.0%) | 0 (0.0%) |
| Total (Category) | 0 (0.0%) | 8 (100.0%) |
| Total (Overall) | 10 (38.5%) | 16 (61.5%) |
Sales and Office Occupations
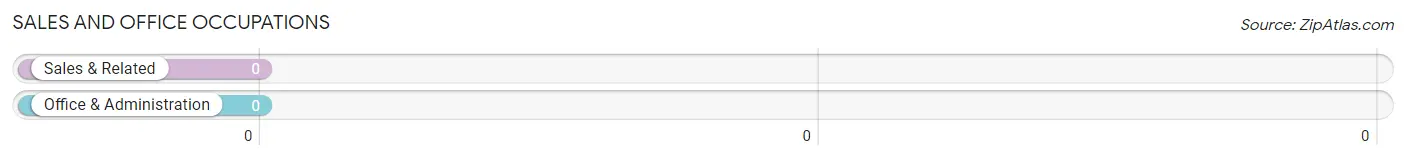
Sales and Office Occupations by Sex
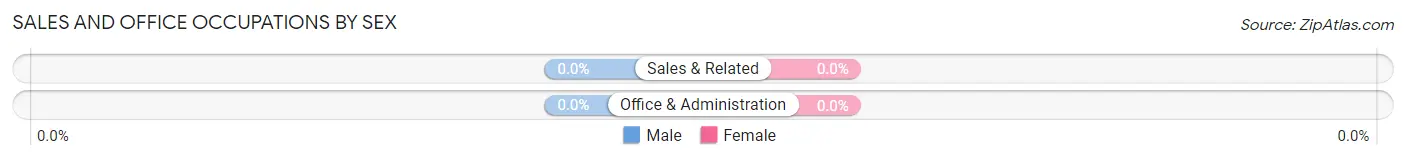
| Occupation | Male | Female |
| Sales & Related | 0 (0.0%) | 0 (0.0%) |
| Office & Administration | 0 (0.0%) | 0 (0.0%) |
| Total (Category) | 0 (0.0%) | 0 (0.0%) |
| Total (Overall) | 10 (38.5%) | 16 (61.5%) |
Natural Resources, Construction and Maintenance Occupations
The most common Natural Resources, Construction and Maintenance occupations in Seba Dalkai are Installation, Maintenance & Repair (7 | 26.9%), and Construction & Extraction (6 | 23.1%).
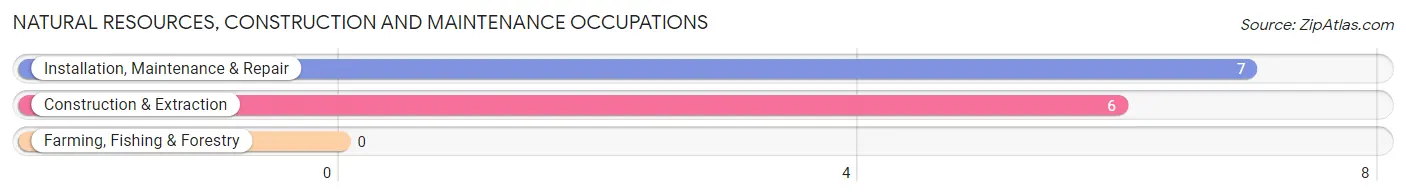
Natural Resources, Construction and Maintenance Occupations by Sex
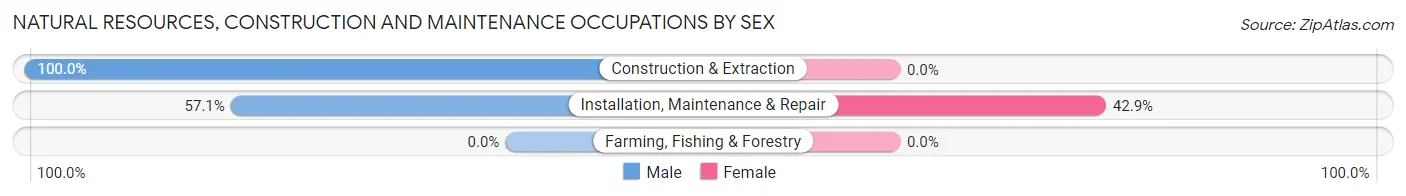
| Occupation | Male | Female |
| Farming, Fishing & Forestry | 0 (0.0%) | 0 (0.0%) |
| Construction & Extraction | 6 (100.0%) | 0 (0.0%) |
| Installation, Maintenance & Repair | 4 (57.1%) | 3 (42.9%) |
| Total (Category) | 10 (76.9%) | 3 (23.1%) |
| Total (Overall) | 10 (38.5%) | 16 (61.5%) |
Production, Transportation and Moving Occupations
The most common Production, Transportation and Moving occupations in Seba Dalkai are , and Transportation (3 | 11.5%).
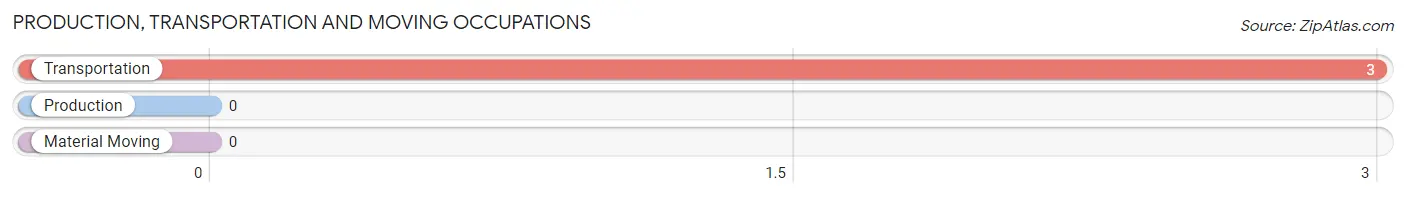
Production, Transportation and Moving Occupations by Sex
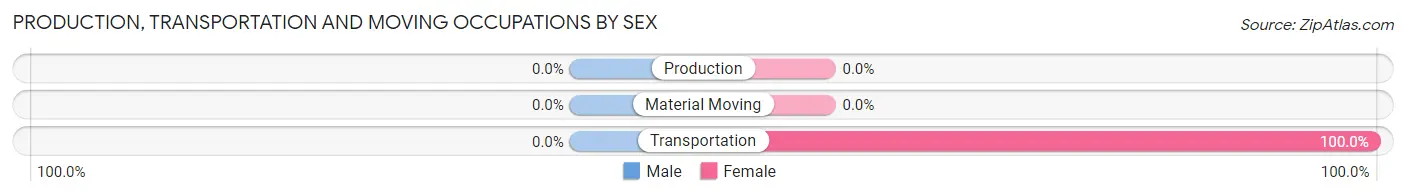
| Occupation | Male | Female |
| Production | 0 (0.0%) | 0 (0.0%) |
| Transportation | 0 (0.0%) | 3 (100.0%) |
| Material Moving | 0 (0.0%) | 0 (0.0%) |
| Total (Category) | 0 (0.0%) | 3 (100.0%) |
| Total (Overall) | 10 (38.5%) | 16 (61.5%) |
Employment Industries by Sex in Seba Dalkai
Employment Industries in Seba Dalkai
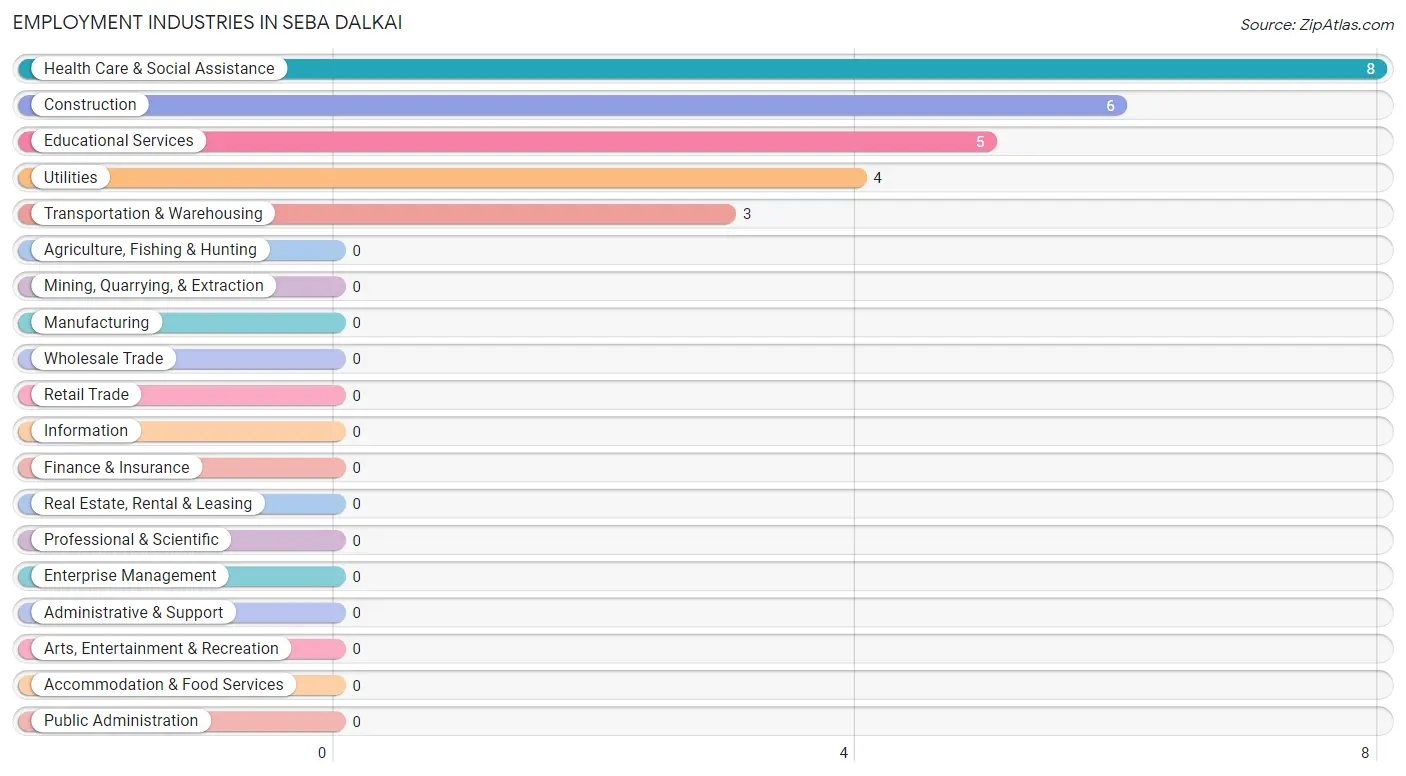
The major employment industries in Seba Dalkai include Health Care & Social Assistance (8 | 30.8%), Construction (6 | 23.1%), Educational Services (5 | 19.2%), Utilities (4 | 15.4%), and Transportation & Warehousing (3 | 11.5%).
Employment Industries by Sex in Seba Dalkai
The Seba Dalkai industries that see more men than women are Construction (100.0%), and Utilities (100.0%), whereas the industries that tend to have a higher number of women are Transportation & Warehousing (100.0%), Educational Services (100.0%), and Health Care & Social Assistance (100.0%).
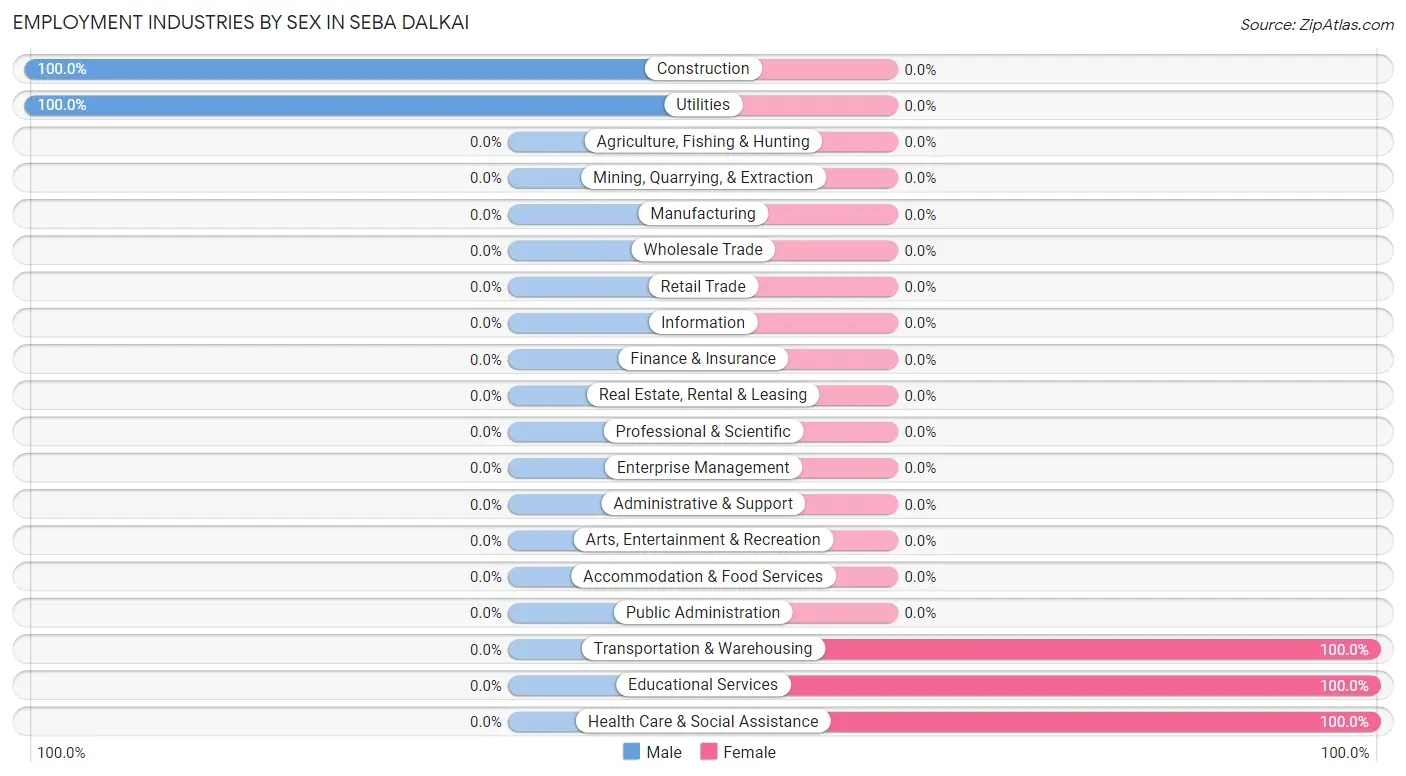
| Industry | Male | Female |
| Agriculture, Fishing & Hunting | 0 (0.0%) | 0 (0.0%) |
| Mining, Quarrying, & Extraction | 0 (0.0%) | 0 (0.0%) |
| Construction | 6 (100.0%) | 0 (0.0%) |
| Manufacturing | 0 (0.0%) | 0 (0.0%) |
| Wholesale Trade | 0 (0.0%) | 0 (0.0%) |
| Retail Trade | 0 (0.0%) | 0 (0.0%) |
| Transportation & Warehousing | 0 (0.0%) | 3 (100.0%) |
| Utilities | 4 (100.0%) | 0 (0.0%) |
| Information | 0 (0.0%) | 0 (0.0%) |
| Finance & Insurance | 0 (0.0%) | 0 (0.0%) |
| Real Estate, Rental & Leasing | 0 (0.0%) | 0 (0.0%) |
| Professional & Scientific | 0 (0.0%) | 0 (0.0%) |
| Enterprise Management | 0 (0.0%) | 0 (0.0%) |
| Administrative & Support | 0 (0.0%) | 0 (0.0%) |
| Educational Services | 0 (0.0%) | 5 (100.0%) |
| Health Care & Social Assistance | 0 (0.0%) | 8 (100.0%) |
| Arts, Entertainment & Recreation | 0 (0.0%) | 0 (0.0%) |
| Accommodation & Food Services | 0 (0.0%) | 0 (0.0%) |
| Public Administration | 0 (0.0%) | 0 (0.0%) |
| Total | 10 (38.5%) | 16 (61.5%) |
Education in Seba Dalkai
School Enrollment in Seba Dalkai
The most common levels of schooling among the 48 students in Seba Dalkai are elementary school (13 | 27.1%), nursery / preschool (10 | 20.8%), and college / undergraduate (9 | 18.8%).
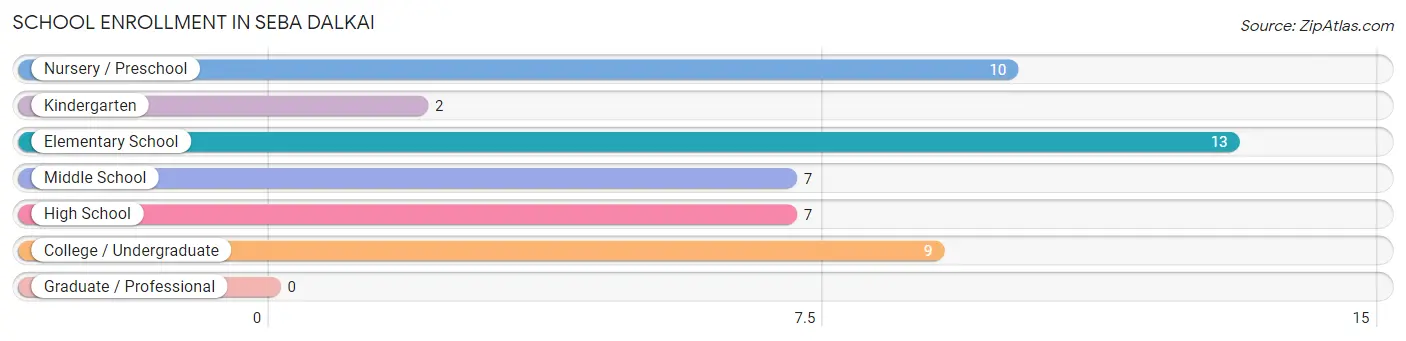
| School Level | # Students | % Students |
| Nursery / Preschool | 10 | 20.8% |
| Kindergarten | 2 | 4.2% |
| Elementary School | 13 | 27.1% |
| Middle School | 7 | 14.6% |
| High School | 7 | 14.6% |
| College / Undergraduate | 9 | 18.8% |
| Graduate / Professional | 0 | 0.0% |
| Total | 48 | 100.0% |
School Enrollment by Age by Funding Source in Seba Dalkai
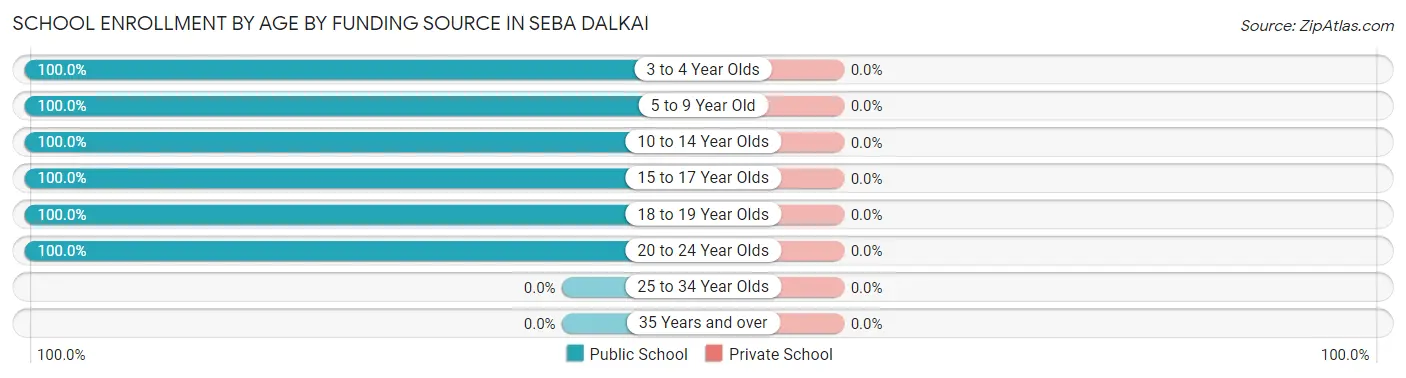
| Age Bracket | Public School | Private School |
| 3 to 4 Year Olds | 7 (100.0%) | 0 (0.0%) |
| 5 to 9 Year Old | 18 (100.0%) | 0 (0.0%) |
| 10 to 14 Year Olds | 7 (100.0%) | 0 (0.0%) |
| 15 to 17 Year Olds | 3 (100.0%) | 0 (0.0%) |
| 18 to 19 Year Olds | 4 (100.0%) | 0 (0.0%) |
| 20 to 24 Year Olds | 9 (100.0%) | 0 (0.0%) |
| 25 to 34 Year Olds | 0 (0.0%) | 0 (0.0%) |
| 35 Years and over | 0 (0.0%) | 0 (0.0%) |
| Total | 48 (100.0%) | 0 (0.0%) |
Educational Attainment by Field of Study in Seba Dalkai
Bio, nature & agricultural (4 | 66.7%), and education (2 | 33.3%) are the most common fields of study among 6 individuals in Seba Dalkai who have obtained a bachelor's degree or higher.
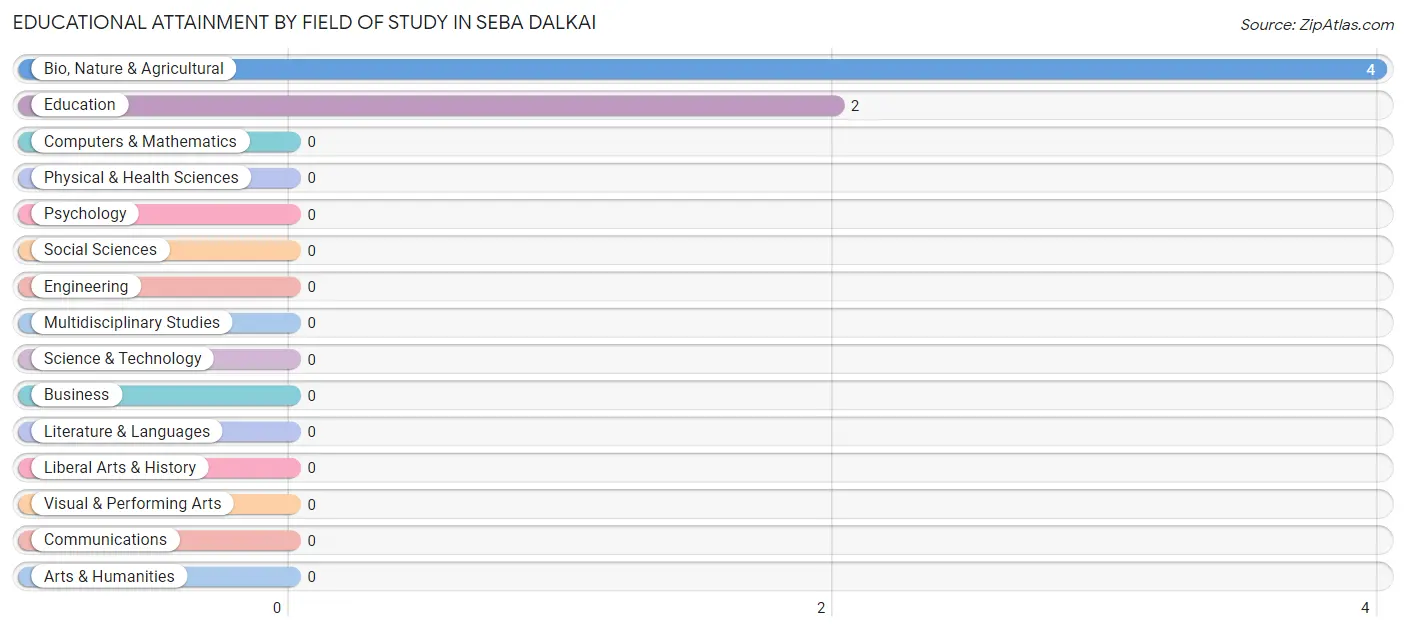
| Field of Study | # Graduates | % Graduates |
| Computers & Mathematics | 0 | 0.0% |
| Bio, Nature & Agricultural | 4 | 66.7% |
| Physical & Health Sciences | 0 | 0.0% |
| Psychology | 0 | 0.0% |
| Social Sciences | 0 | 0.0% |
| Engineering | 0 | 0.0% |
| Multidisciplinary Studies | 0 | 0.0% |
| Science & Technology | 0 | 0.0% |
| Business | 0 | 0.0% |
| Education | 2 | 33.3% |
| Literature & Languages | 0 | 0.0% |
| Liberal Arts & History | 0 | 0.0% |
| Visual & Performing Arts | 0 | 0.0% |
| Communications | 0 | 0.0% |
| Arts & Humanities | 0 | 0.0% |
| Total | 6 | 100.0% |
Transportation & Commute in Seba Dalkai
Vehicle Availability by Sex in Seba Dalkai
The most prevalent vehicle ownership categories in Seba Dalkai are males with 5 or more vehicles (6, accounting for 60.0%) and females with 5 or more vehicles (0, making up 37.5%).
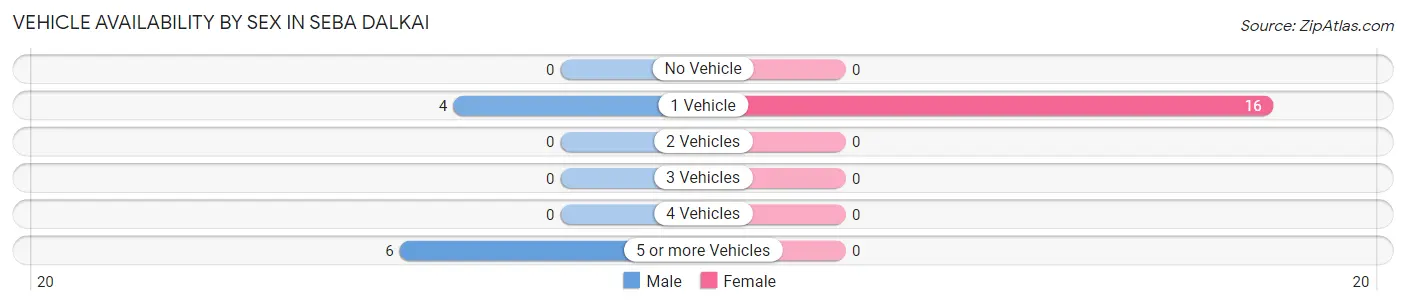
| Vehicles Available | Male | Female |
| No Vehicle | 0 (0.0%) | 0 (0.0%) |
| 1 Vehicle | 4 (40.0%) | 16 (100.0%) |
| 2 Vehicles | 0 (0.0%) | 0 (0.0%) |
| 3 Vehicles | 0 (0.0%) | 0 (0.0%) |
| 4 Vehicles | 0 (0.0%) | 0 (0.0%) |
| 5 or more Vehicles | 6 (60.0%) | 0 (0.0%) |
| Total | 10 (100.0%) | 16 (100.0%) |
Commute Time in Seba Dalkai
The most frequently occuring commute durations in Seba Dalkai are 5 to 9 minutes (9 commuters, 34.6%), 90 or more minutes (8 commuters, 30.8%), and 10 to 14 minutes (4 commuters, 15.4%).
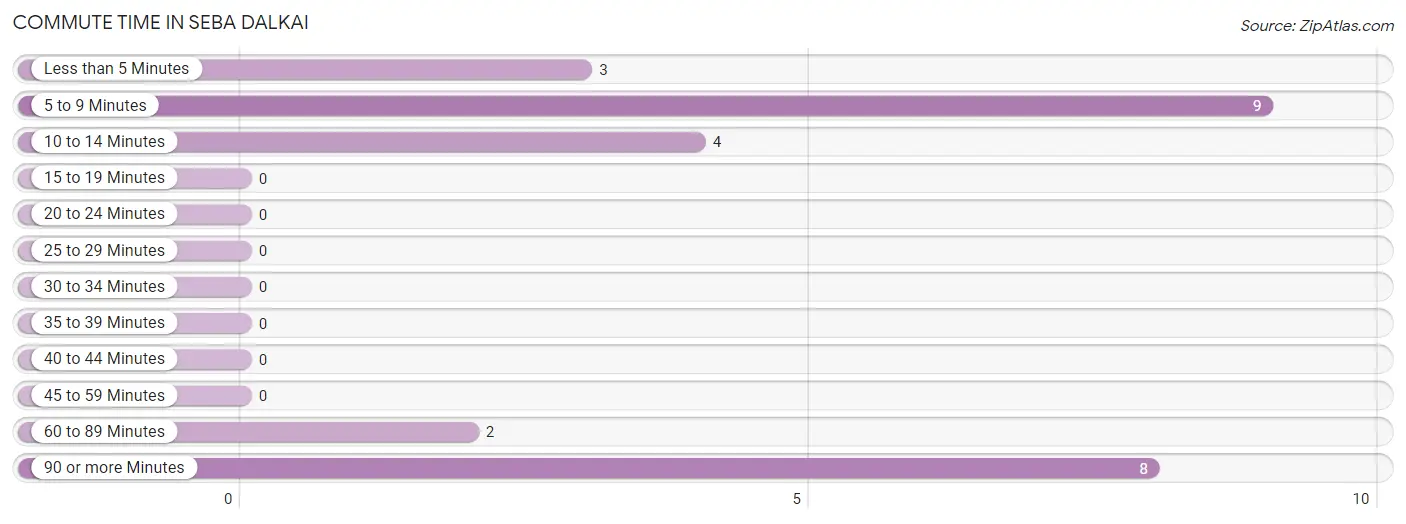
| Commute Time | # Commuters | % Commuters |
| Less than 5 Minutes | 3 | 11.5% |
| 5 to 9 Minutes | 9 | 34.6% |
| 10 to 14 Minutes | 4 | 15.4% |
| 15 to 19 Minutes | 0 | 0.0% |
| 20 to 24 Minutes | 0 | 0.0% |
| 25 to 29 Minutes | 0 | 0.0% |
| 30 to 34 Minutes | 0 | 0.0% |
| 35 to 39 Minutes | 0 | 0.0% |
| 40 to 44 Minutes | 0 | 0.0% |
| 45 to 59 Minutes | 0 | 0.0% |
| 60 to 89 Minutes | 2 | 7.7% |
| 90 or more Minutes | 8 | 30.8% |
Commute Time by Sex in Seba Dalkai
The most common commute times in Seba Dalkai are 5 to 9 minutes (4 commuters, 40.0%) for males and 90 or more minutes (8 commuters, 50.0%) for females.
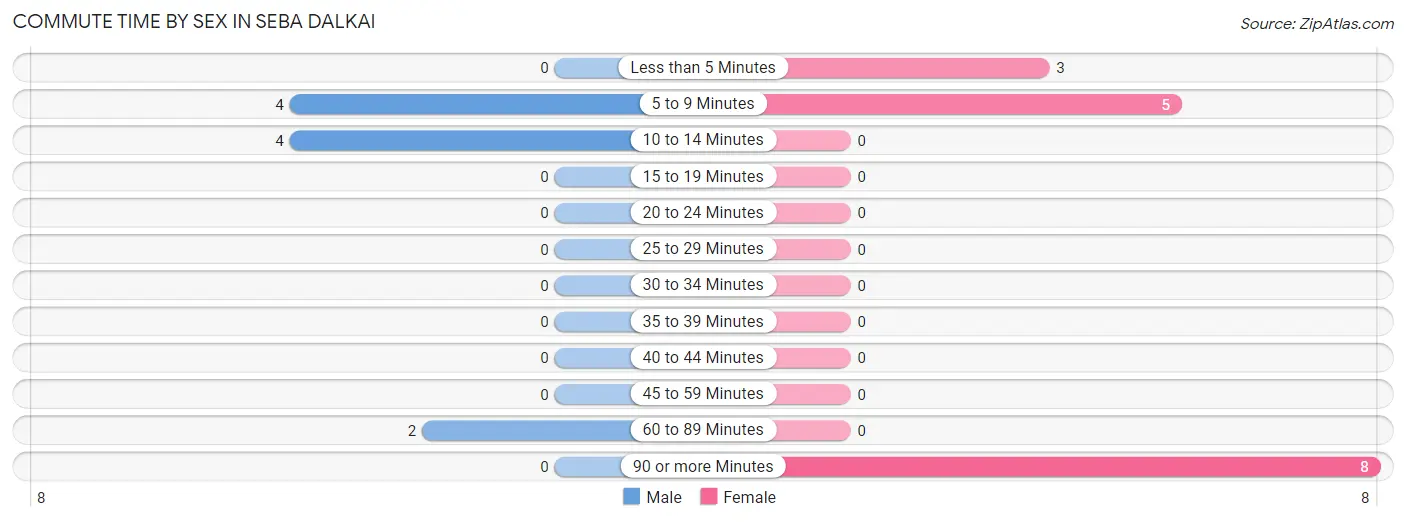
| Commute Time | Male | Female |
| Less than 5 Minutes | 0 (0.0%) | 3 (18.8%) |
| 5 to 9 Minutes | 4 (40.0%) | 5 (31.2%) |
| 10 to 14 Minutes | 4 (40.0%) | 0 (0.0%) |
| 15 to 19 Minutes | 0 (0.0%) | 0 (0.0%) |
| 20 to 24 Minutes | 0 (0.0%) | 0 (0.0%) |
| 25 to 29 Minutes | 0 (0.0%) | 0 (0.0%) |
| 30 to 34 Minutes | 0 (0.0%) | 0 (0.0%) |
| 35 to 39 Minutes | 0 (0.0%) | 0 (0.0%) |
| 40 to 44 Minutes | 0 (0.0%) | 0 (0.0%) |
| 45 to 59 Minutes | 0 (0.0%) | 0 (0.0%) |
| 60 to 89 Minutes | 2 (20.0%) | 0 (0.0%) |
| 90 or more Minutes | 0 (0.0%) | 8 (50.0%) |
Time of Departure to Work by Sex in Seba Dalkai
The most frequent times of departure to work in Seba Dalkai are 5:00 AM to 5:29 AM (4, 40.0%) for males and 5:00 AM to 5:29 AM (5, 31.2%) for females.
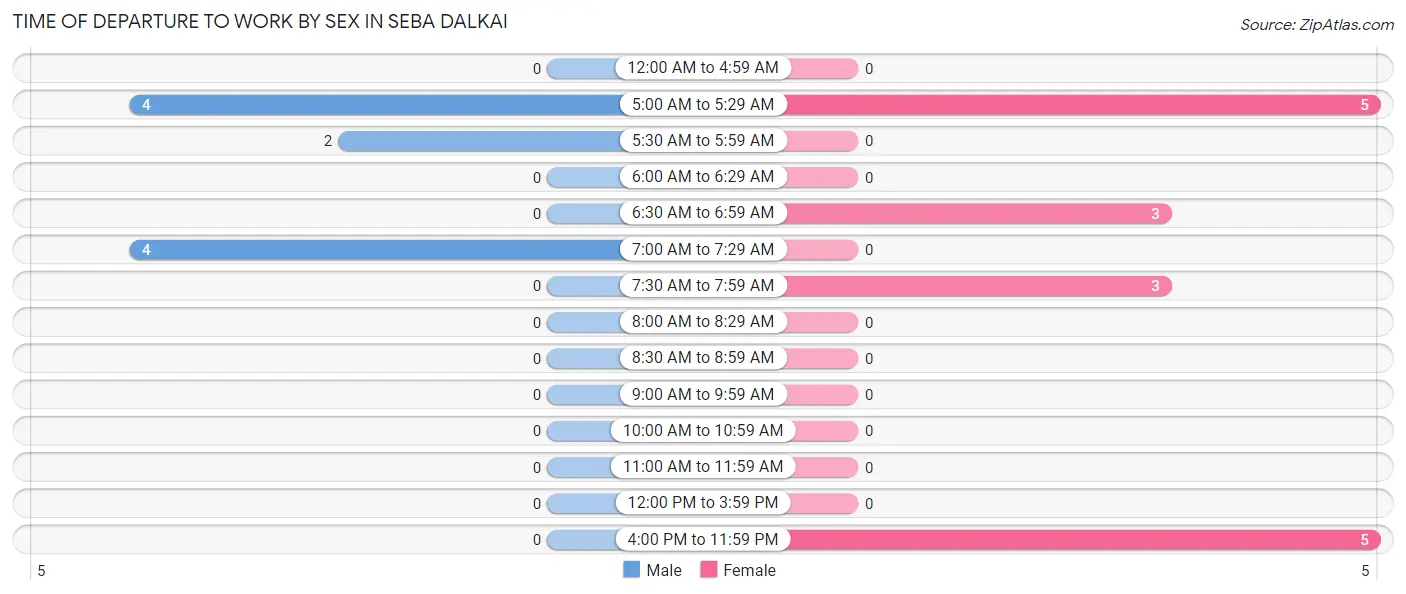
| Time of Departure | Male | Female |
| 12:00 AM to 4:59 AM | 0 (0.0%) | 0 (0.0%) |
| 5:00 AM to 5:29 AM | 4 (40.0%) | 5 (31.2%) |
| 5:30 AM to 5:59 AM | 2 (20.0%) | 0 (0.0%) |
| 6:00 AM to 6:29 AM | 0 (0.0%) | 0 (0.0%) |
| 6:30 AM to 6:59 AM | 0 (0.0%) | 3 (18.8%) |
| 7:00 AM to 7:29 AM | 4 (40.0%) | 0 (0.0%) |
| 7:30 AM to 7:59 AM | 0 (0.0%) | 3 (18.8%) |
| 8:00 AM to 8:29 AM | 0 (0.0%) | 0 (0.0%) |
| 8:30 AM to 8:59 AM | 0 (0.0%) | 0 (0.0%) |
| 9:00 AM to 9:59 AM | 0 (0.0%) | 0 (0.0%) |
| 10:00 AM to 10:59 AM | 0 (0.0%) | 0 (0.0%) |
| 11:00 AM to 11:59 AM | 0 (0.0%) | 0 (0.0%) |
| 12:00 PM to 3:59 PM | 0 (0.0%) | 0 (0.0%) |
| 4:00 PM to 11:59 PM | 0 (0.0%) | 5 (31.2%) |
| Total | 10 (100.0%) | 16 (100.0%) |
Housing Occupancy in Seba Dalkai
Occupancy by Ownership in Seba Dalkai
Of the total 27 dwellings in Seba Dalkai, owner-occupied units account for 22 (81.5%), while renter-occupied units make up 5 (18.5%).
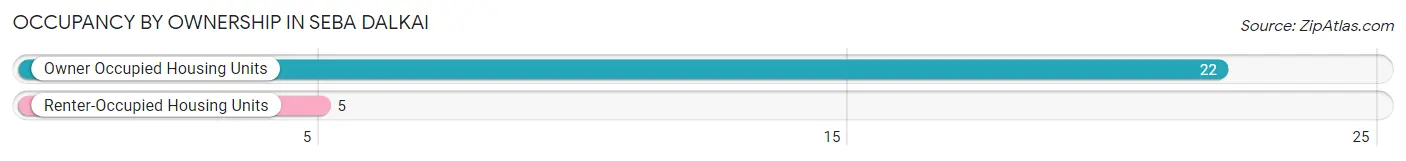
| Occupancy | # Housing Units | % Housing Units |
| Owner Occupied Housing Units | 22 | 81.5% |
| Renter-Occupied Housing Units | 5 | 18.5% |
| Total Occupied Housing Units | 27 | 100.0% |
Occupancy by Household Size in Seba Dalkai
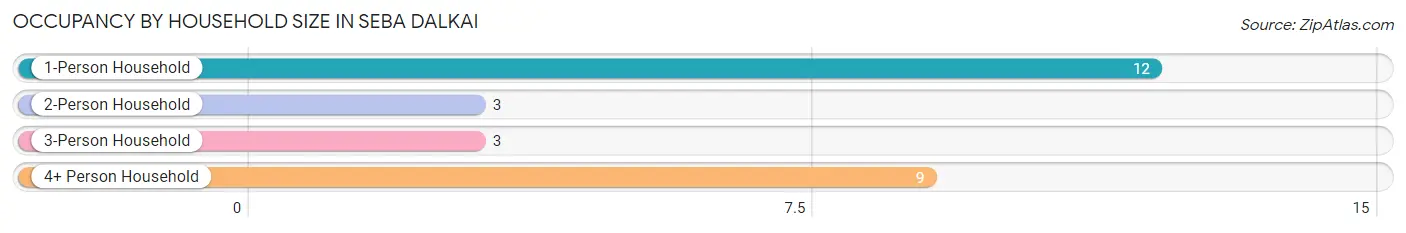
| Household Size | # Housing Units | % Housing Units |
| 1-Person Household | 12 | 44.4% |
| 2-Person Household | 3 | 11.1% |
| 3-Person Household | 3 | 11.1% |
| 4+ Person Household | 9 | 33.3% |
| Total Housing Units | 27 | 100.0% |
Occupancy by Ownership by Household Size in Seba Dalkai
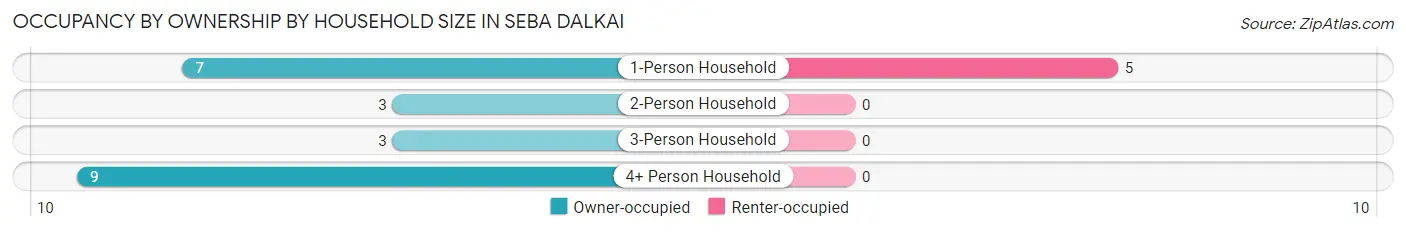
| Household Size | Owner-occupied | Renter-occupied |
| 1-Person Household | 7 (58.3%) | 5 (41.7%) |
| 2-Person Household | 3 (100.0%) | 0 (0.0%) |
| 3-Person Household | 3 (100.0%) | 0 (0.0%) |
| 4+ Person Household | 9 (100.0%) | 0 (0.0%) |
| Total Housing Units | 22 (81.5%) | 5 (18.5%) |
Occupancy by Educational Attainment in Seba Dalkai
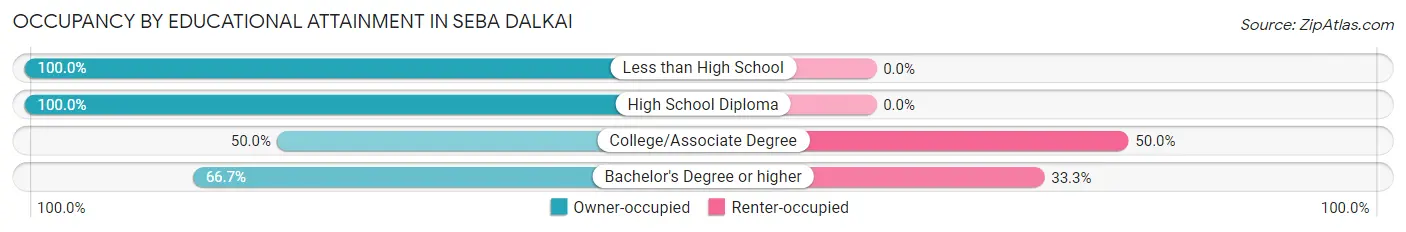
| Household Size | Owner-occupied | Renter-occupied |
| Less than High School | 9 (100.0%) | 0 (0.0%) |
| High School Diploma | 6 (100.0%) | 0 (0.0%) |
| College/Associate Degree | 3 (50.0%) | 3 (50.0%) |
| Bachelor's Degree or higher | 4 (66.7%) | 2 (33.3%) |
Occupancy by Age of Householder in Seba Dalkai
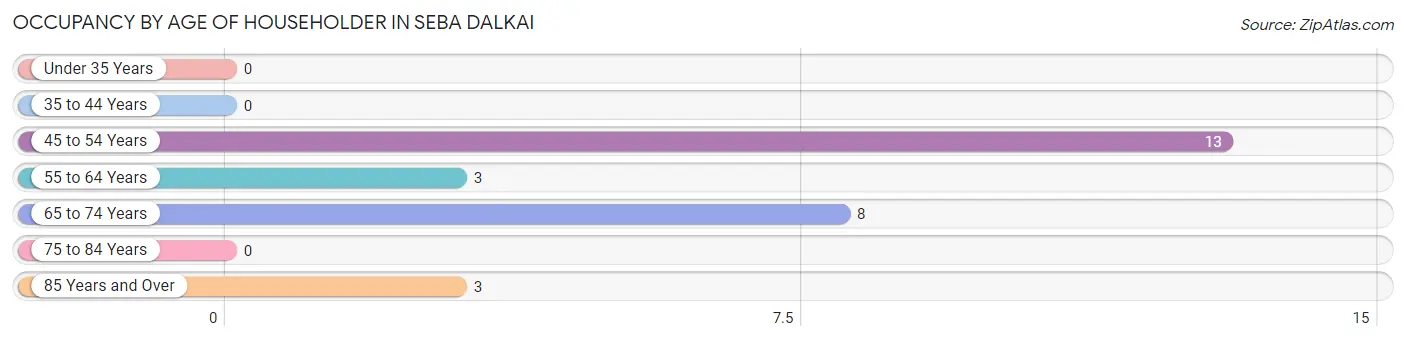
| Age Bracket | # Households | % Households |
| Under 35 Years | 0 | 0.0% |
| 35 to 44 Years | 0 | 0.0% |
| 45 to 54 Years | 13 | 48.1% |
| 55 to 64 Years | 3 | 11.1% |
| 65 to 74 Years | 8 | 29.6% |
| 75 to 84 Years | 0 | 0.0% |
| 85 Years and Over | 3 | 11.1% |
| Total | 27 | 100.0% |
Housing Finances in Seba Dalkai
Median Income by Occupancy in Seba Dalkai
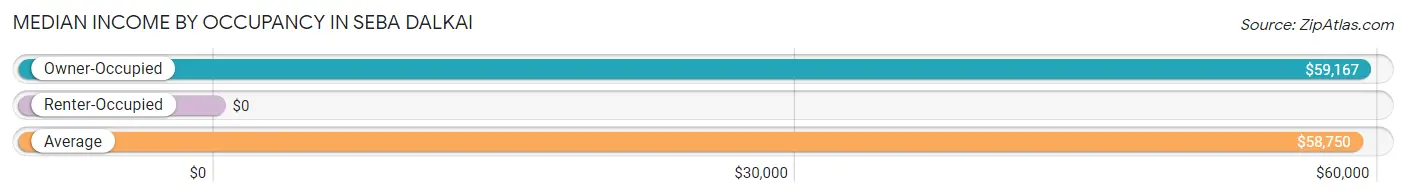
| Occupancy Type | # Households | Median Income |
| Owner-Occupied | 22 (81.5%) | $59,167 |
| Renter-Occupied | 5 (18.5%) | $0 |
| Average | 27 (100.0%) | $58,750 |
Occupancy by Householder Income Bracket in Seba Dalkai
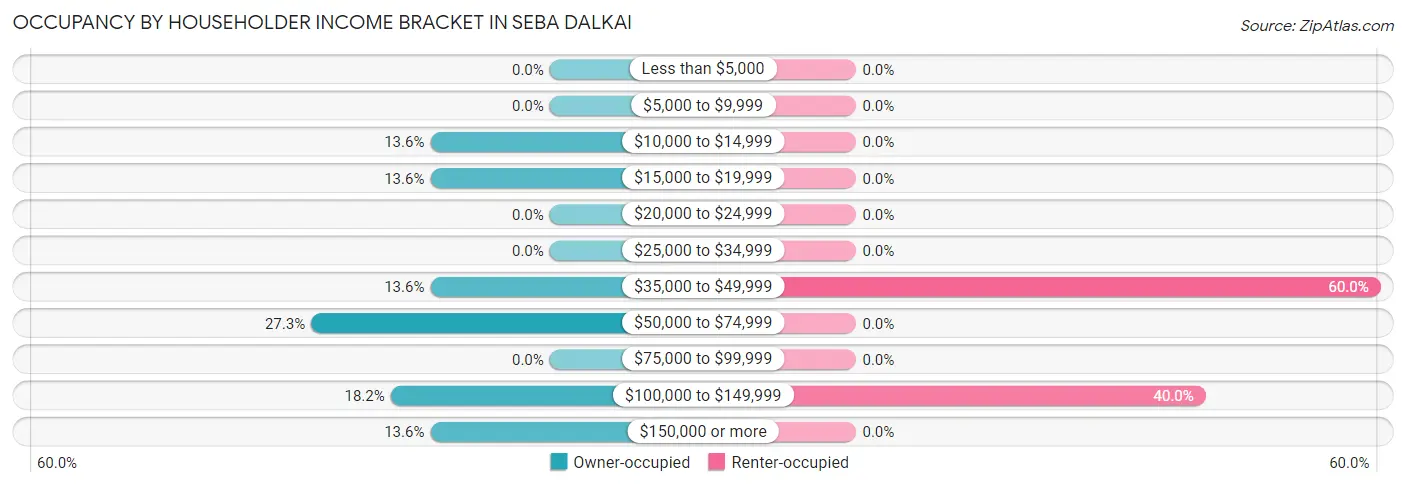
| Income Bracket | Owner-occupied | Renter-occupied |
| Less than $5,000 | 0 (0.0%) | 0 (0.0%) |
| $5,000 to $9,999 | 0 (0.0%) | 0 (0.0%) |
| $10,000 to $14,999 | 3 (13.6%) | 0 (0.0%) |
| $15,000 to $19,999 | 3 (13.6%) | 0 (0.0%) |
| $20,000 to $24,999 | 0 (0.0%) | 0 (0.0%) |
| $25,000 to $34,999 | 0 (0.0%) | 0 (0.0%) |
| $35,000 to $49,999 | 3 (13.6%) | 3 (60.0%) |
| $50,000 to $74,999 | 6 (27.3%) | 0 (0.0%) |
| $75,000 to $99,999 | 0 (0.0%) | 0 (0.0%) |
| $100,000 to $149,999 | 4 (18.2%) | 2 (40.0%) |
| $150,000 or more | 3 (13.6%) | 0 (0.0%) |
| Total | 22 (100.0%) | 5 (100.0%) |
Monthly Housing Cost Tiers in Seba Dalkai
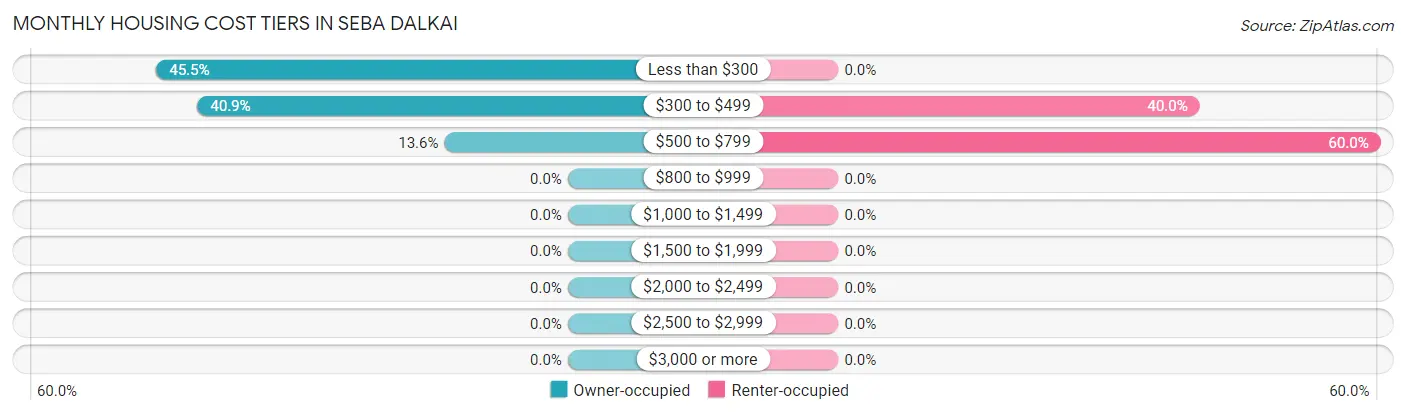
| Monthly Cost | Owner-occupied | Renter-occupied |
| Less than $300 | 10 (45.5%) | 0 (0.0%) |
| $300 to $499 | 9 (40.9%) | 2 (40.0%) |
| $500 to $799 | 3 (13.6%) | 3 (60.0%) |
| $800 to $999 | 0 (0.0%) | 0 (0.0%) |
| $1,000 to $1,499 | 0 (0.0%) | 0 (0.0%) |
| $1,500 to $1,999 | 0 (0.0%) | 0 (0.0%) |
| $2,000 to $2,499 | 0 (0.0%) | 0 (0.0%) |
| $2,500 to $2,999 | 0 (0.0%) | 0 (0.0%) |
| $3,000 or more | 0 (0.0%) | 0 (0.0%) |
| Total | 22 (100.0%) | 5 (100.0%) |
Physical Housing Characteristics in Seba Dalkai
Housing Structures in Seba Dalkai
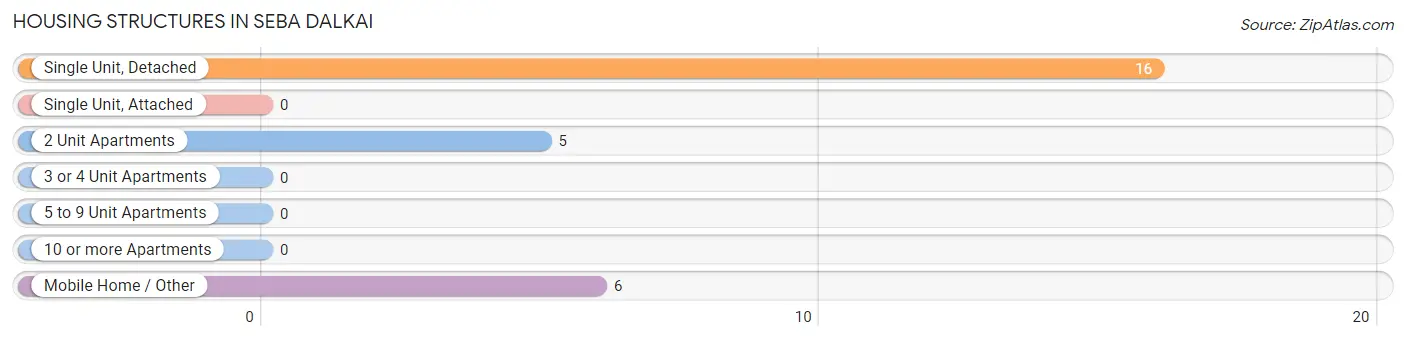
| Structure Type | # Housing Units | % Housing Units |
| Single Unit, Detached | 16 | 59.3% |
| Single Unit, Attached | 0 | 0.0% |
| 2 Unit Apartments | 5 | 18.5% |
| 3 or 4 Unit Apartments | 0 | 0.0% |
| 5 to 9 Unit Apartments | 0 | 0.0% |
| 10 or more Apartments | 0 | 0.0% |
| Mobile Home / Other | 6 | 22.2% |
| Total | 27 | 100.0% |
Housing Structures by Occupancy in Seba Dalkai
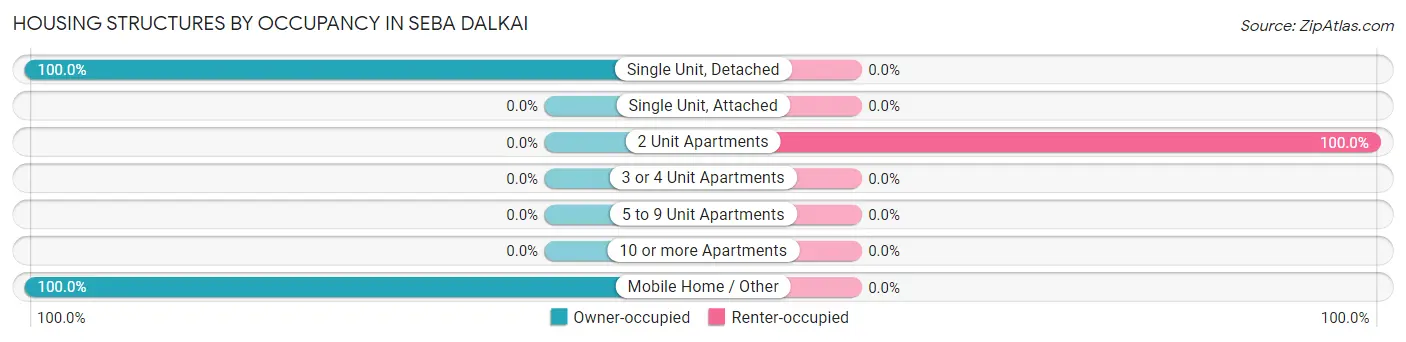
| Structure Type | Owner-occupied | Renter-occupied |
| Single Unit, Detached | 16 (100.0%) | 0 (0.0%) |
| Single Unit, Attached | 0 (0.0%) | 0 (0.0%) |
| 2 Unit Apartments | 0 (0.0%) | 5 (100.0%) |
| 3 or 4 Unit Apartments | 0 (0.0%) | 0 (0.0%) |
| 5 to 9 Unit Apartments | 0 (0.0%) | 0 (0.0%) |
| 10 or more Apartments | 0 (0.0%) | 0 (0.0%) |
| Mobile Home / Other | 6 (100.0%) | 0 (0.0%) |
| Total | 22 (81.5%) | 5 (18.5%) |
Housing Structures by Number of Rooms in Seba Dalkai
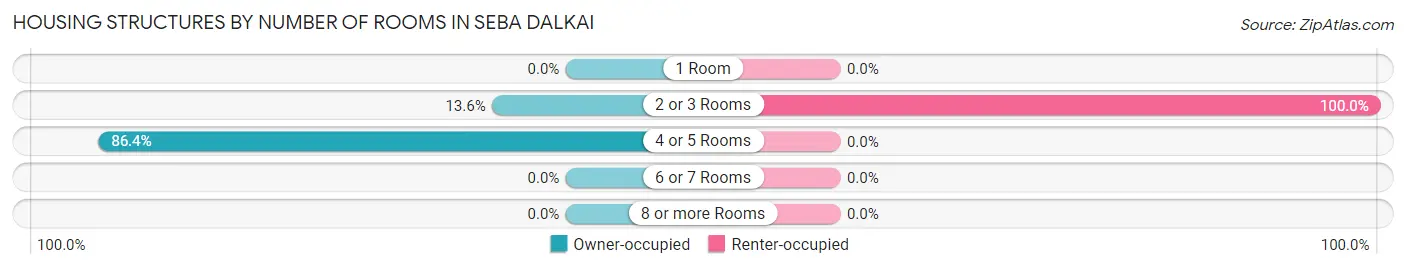
| Number of Rooms | Owner-occupied | Renter-occupied |
| 1 Room | 0 (0.0%) | 0 (0.0%) |
| 2 or 3 Rooms | 3 (13.6%) | 5 (100.0%) |
| 4 or 5 Rooms | 19 (86.4%) | 0 (0.0%) |
| 6 or 7 Rooms | 0 (0.0%) | 0 (0.0%) |
| 8 or more Rooms | 0 (0.0%) | 0 (0.0%) |
| Total | 22 (100.0%) | 5 (100.0%) |
Housing Structure by Heating Type in Seba Dalkai
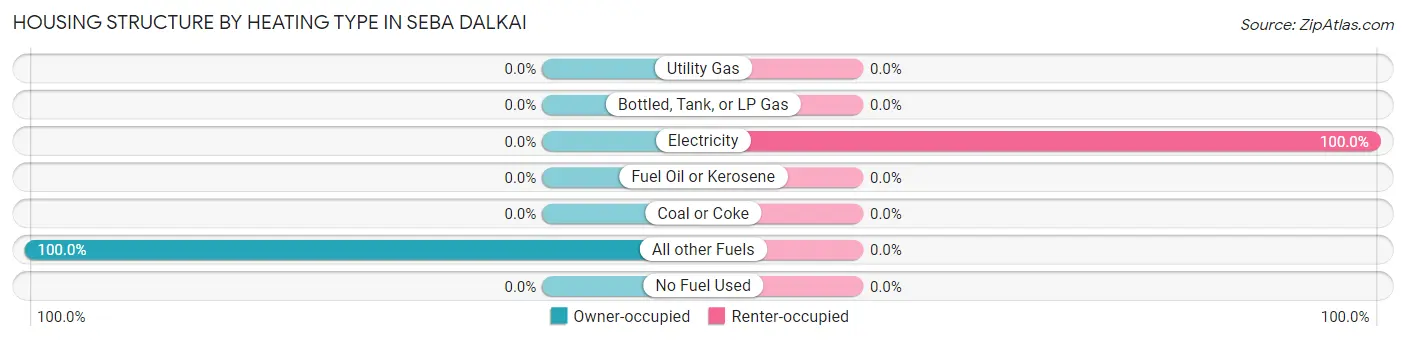
| Heating Type | Owner-occupied | Renter-occupied |
| Utility Gas | 0 (0.0%) | 0 (0.0%) |
| Bottled, Tank, or LP Gas | 0 (0.0%) | 0 (0.0%) |
| Electricity | 0 (0.0%) | 5 (100.0%) |
| Fuel Oil or Kerosene | 0 (0.0%) | 0 (0.0%) |
| Coal or Coke | 0 (0.0%) | 0 (0.0%) |
| All other Fuels | 22 (100.0%) | 0 (0.0%) |
| No Fuel Used | 0 (0.0%) | 0 (0.0%) |
| Total | 22 (100.0%) | 5 (100.0%) |
Household Vehicle Usage in Seba Dalkai
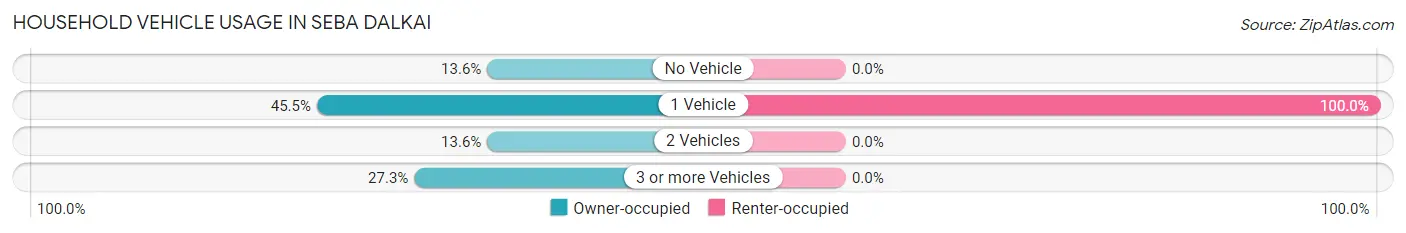
| Vehicles per Household | Owner-occupied | Renter-occupied |
| No Vehicle | 3 (13.6%) | 0 (0.0%) |
| 1 Vehicle | 10 (45.5%) | 5 (100.0%) |
| 2 Vehicles | 3 (13.6%) | 0 (0.0%) |
| 3 or more Vehicles | 6 (27.3%) | 0 (0.0%) |
| Total | 22 (100.0%) | 5 (100.0%) |
Real Estate & Mortgages in Seba Dalkai
Real Estate and Mortgage Overview in Seba Dalkai
| Characteristic | Without Mortgage | With Mortgage |
| Housing Units | 22 | 0 |
| Median Property Value | $141,700 | $0 |
| Median Household Income | $59,167 | $0 |
| Monthly Housing Costs | $317 | $0 |
| Real Estate Taxes | - | - |
Property Value by Mortgage Status in Seba Dalkai
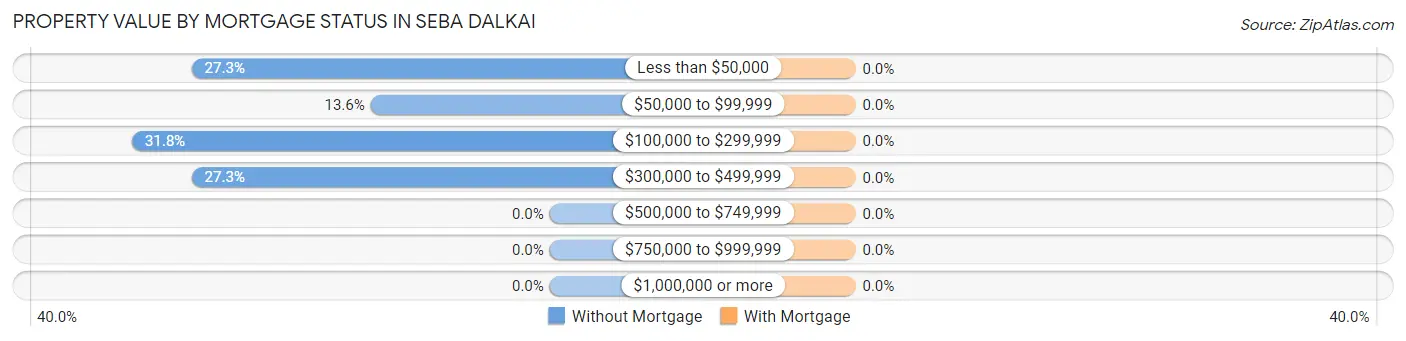
| Property Value | Without Mortgage | With Mortgage |
| Less than $50,000 | 6 (27.3%) | 0 (0.0%) |
| $50,000 to $99,999 | 3 (13.6%) | 0 (0.0%) |
| $100,000 to $299,999 | 7 (31.8%) | 0 (0.0%) |
| $300,000 to $499,999 | 6 (27.3%) | 0 (0.0%) |
| $500,000 to $749,999 | 0 (0.0%) | 0 (0.0%) |
| $750,000 to $999,999 | 0 (0.0%) | 0 (0.0%) |
| $1,000,000 or more | 0 (0.0%) | 0 (0.0%) |
| Total | 22 (100.0%) | 0 (0.0%) |
Household Income by Mortgage Status in Seba Dalkai
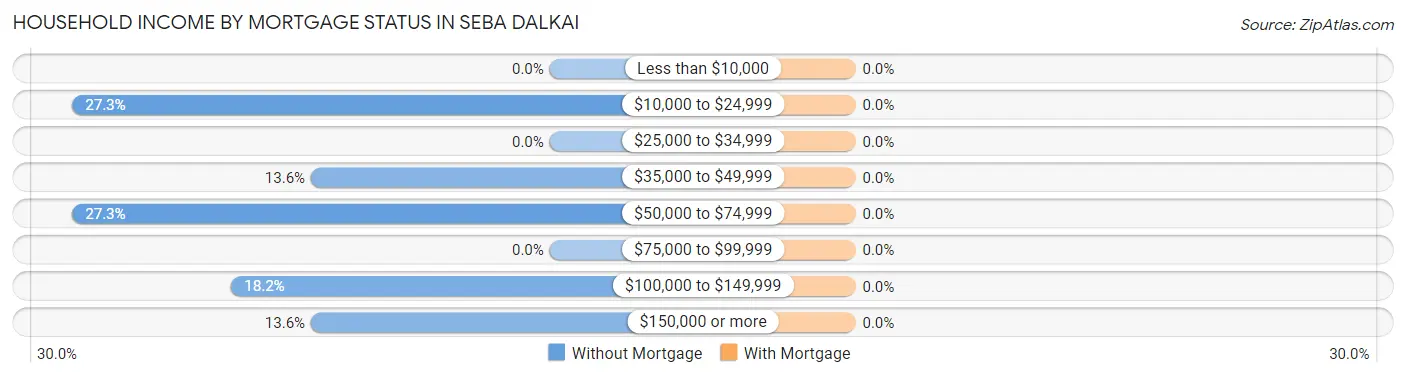
| Household Income | Without Mortgage | With Mortgage |
| Less than $10,000 | 0 (0.0%) | 0 (0.0%) |
| $10,000 to $24,999 | 6 (27.3%) | 0 (0.0%) |
| $25,000 to $34,999 | 0 (0.0%) | 0 (0.0%) |
| $35,000 to $49,999 | 3 (13.6%) | 0 (0.0%) |
| $50,000 to $74,999 | 6 (27.3%) | 0 (0.0%) |
| $75,000 to $99,999 | 0 (0.0%) | 0 (0.0%) |
| $100,000 to $149,999 | 4 (18.2%) | 0 (0.0%) |
| $150,000 or more | 3 (13.6%) | 0 (0.0%) |
| Total | 22 (100.0%) | 0 (0.0%) |
Property Value to Household Income Ratio in Seba Dalkai
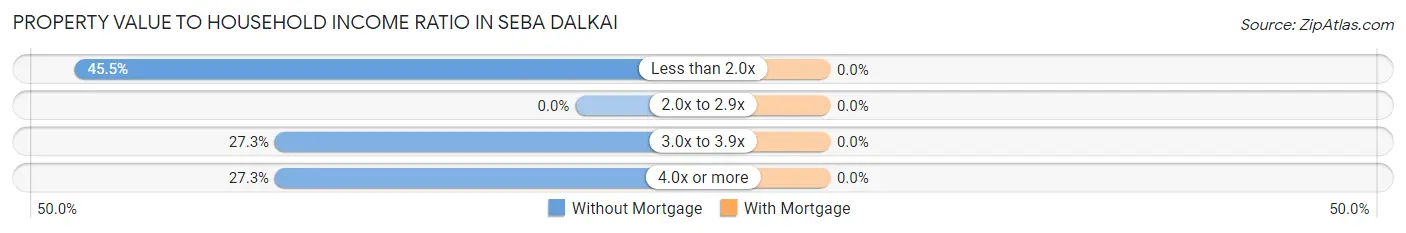
| Value-to-Income Ratio | Without Mortgage | With Mortgage |
| Less than 2.0x | 10 (45.5%) | 0 (0.0%) |
| 2.0x to 2.9x | 0 (0.0%) | 0 (0.0%) |
| 3.0x to 3.9x | 6 (27.3%) | 0 (0.0%) |
| 4.0x or more | 6 (27.3%) | 0 (0.0%) |
| Total | 22 (100.0%) | 0 (0.0%) |
Real Estate Taxes by Mortgage Status in Seba Dalkai
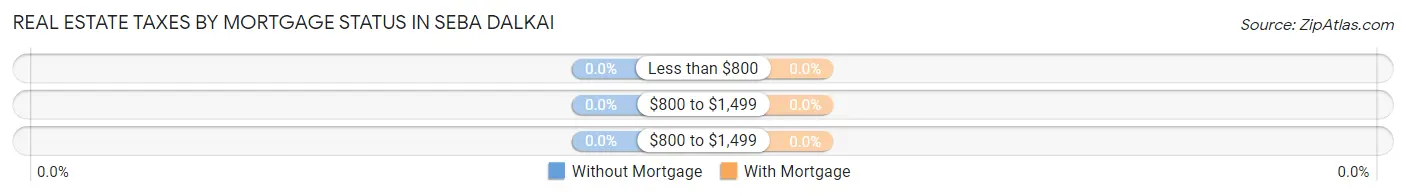
| Property Taxes | Without Mortgage | With Mortgage |
| Less than $800 | 0 (0.0%) | 0 (0.0%) |
| $800 to $1,499 | 0 (0.0%) | 0 (0.0%) |
| $800 to $1,499 | 0 (0.0%) | 0 (0.0%) |
| Total | 22 (100.0%) | 0 (0.0%) |
Health & Disability in Seba Dalkai
Health Insurance Coverage by Age in Seba Dalkai
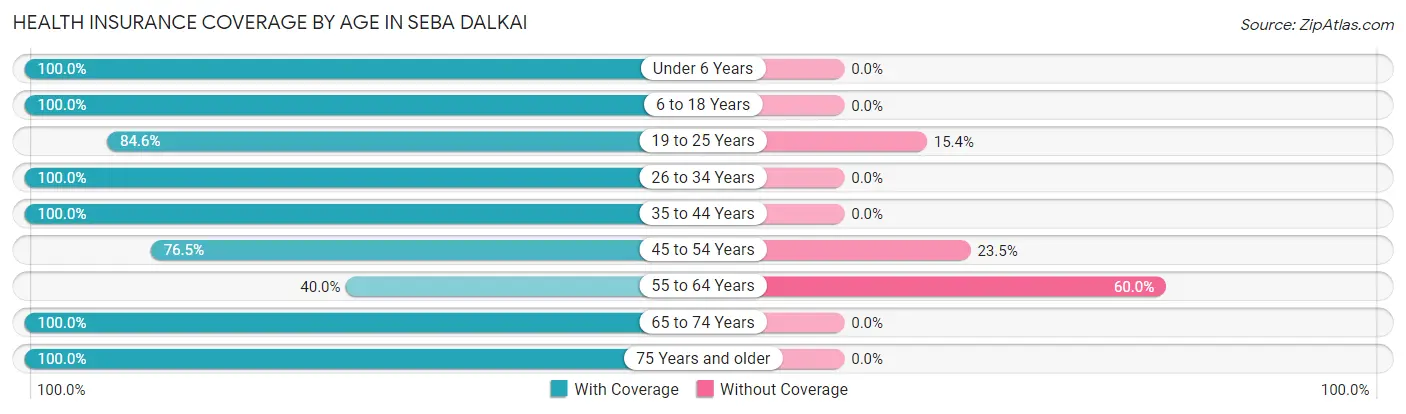
| Age Bracket | With Coverage | Without Coverage |
| Under 6 Years | 24 (100.0%) | 0 (0.0%) |
| 6 to 18 Years | 27 (100.0%) | 0 (0.0%) |
| 19 to 25 Years | 22 (84.6%) | 4 (15.4%) |
| 26 to 34 Years | 11 (100.0%) | 0 (0.0%) |
| 35 to 44 Years | 5 (100.0%) | 0 (0.0%) |
| 45 to 54 Years | 13 (76.5%) | 4 (23.5%) |
| 55 to 64 Years | 2 (40.0%) | 3 (60.0%) |
| 65 to 74 Years | 14 (100.0%) | 0 (0.0%) |
| 75 Years and older | 3 (100.0%) | 0 (0.0%) |
| Total | 121 (91.7%) | 11 (8.3%) |
Health Insurance Coverage by Citizenship Status in Seba Dalkai
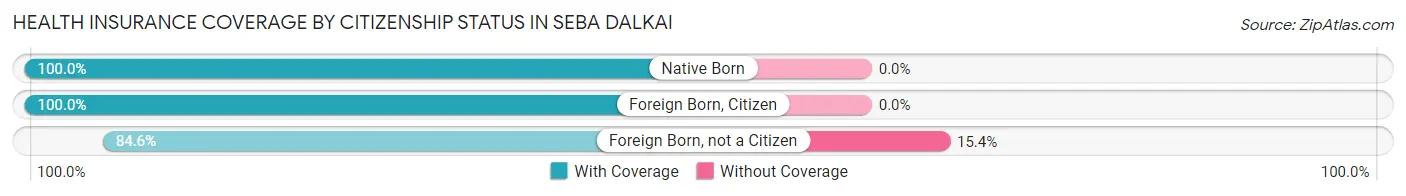
| Citizenship Status | With Coverage | Without Coverage |
| Native Born | 24 (100.0%) | 0 (0.0%) |
| Foreign Born, Citizen | 27 (100.0%) | 0 (0.0%) |
| Foreign Born, not a Citizen | 22 (84.6%) | 4 (15.4%) |
Health Insurance Coverage by Household Income in Seba Dalkai
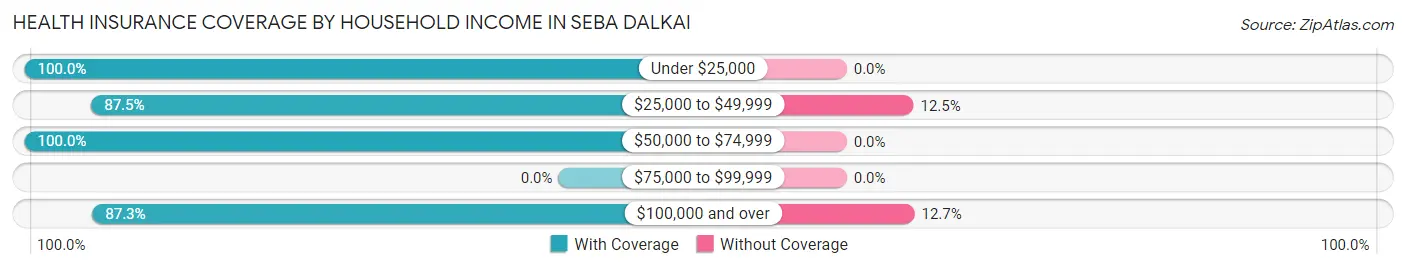
| Household Income | With Coverage | Without Coverage |
| Under $25,000 | 11 (100.0%) | 0 (0.0%) |
| $25,000 to $49,999 | 21 (87.5%) | 3 (12.5%) |
| $50,000 to $74,999 | 34 (100.0%) | 0 (0.0%) |
| $75,000 to $99,999 | 0 (0.0%) | 0 (0.0%) |
| $100,000 and over | 55 (87.3%) | 8 (12.7%) |
Public vs Private Health Insurance Coverage by Age in Seba Dalkai
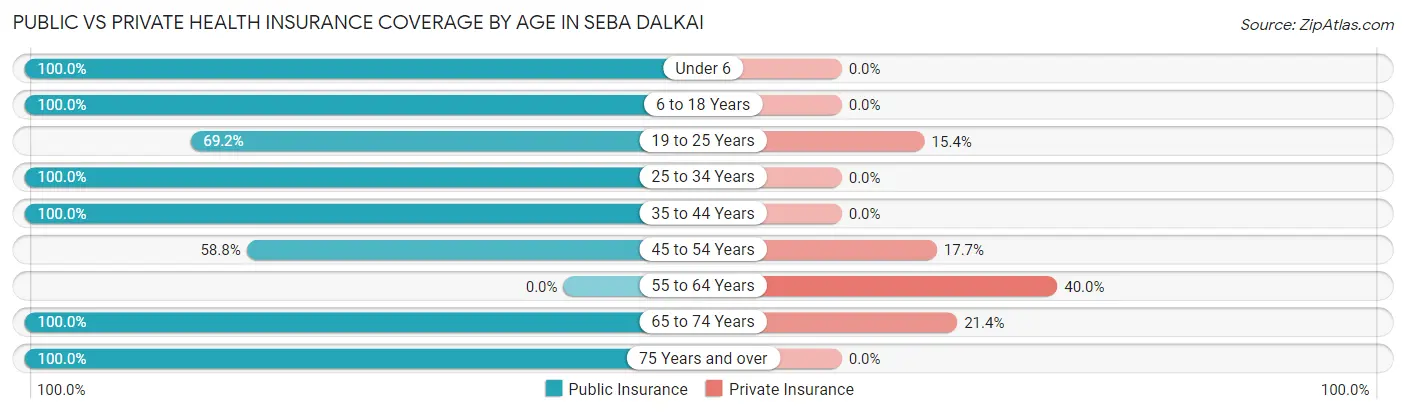
| Age Bracket | Public Insurance | Private Insurance |
| Under 6 | 24 (100.0%) | 0 (0.0%) |
| 6 to 18 Years | 27 (100.0%) | 0 (0.0%) |
| 19 to 25 Years | 18 (69.2%) | 4 (15.4%) |
| 25 to 34 Years | 11 (100.0%) | 0 (0.0%) |
| 35 to 44 Years | 5 (100.0%) | 0 (0.0%) |
| 45 to 54 Years | 10 (58.8%) | 3 (17.6%) |
| 55 to 64 Years | 0 (0.0%) | 2 (40.0%) |
| 65 to 74 Years | 14 (100.0%) | 3 (21.4%) |
| 75 Years and over | 3 (100.0%) | 0 (0.0%) |
| Total | 112 (84.9%) | 12 (9.1%) |
Disability Status by Sex by Age in Seba Dalkai
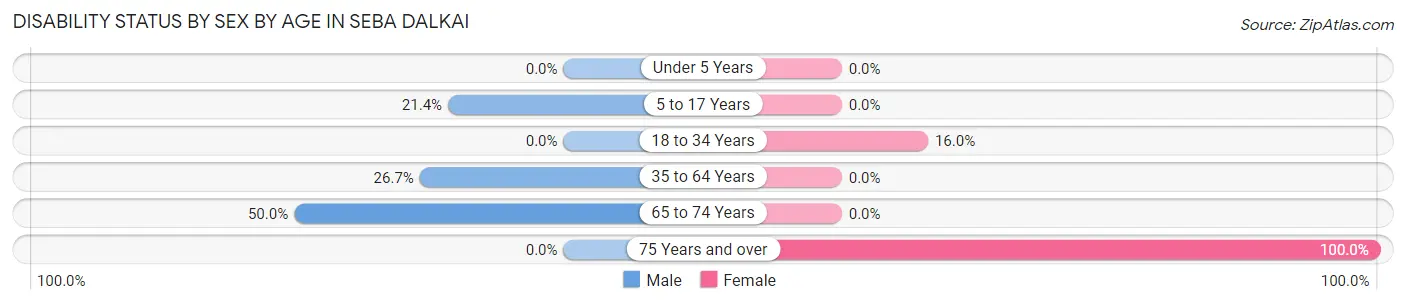
| Age Bracket | Male | Female |
| Under 5 Years | 0 (0.0%) | 0 (0.0%) |
| 5 to 17 Years | 3 (21.4%) | 0 (0.0%) |
| 18 to 34 Years | 0 (0.0%) | 4 (16.0%) |
| 35 to 64 Years | 4 (26.7%) | 0 (0.0%) |
| 65 to 74 Years | 3 (50.0%) | 0 (0.0%) |
| 75 Years and over | 0 (0.0%) | 3 (100.0%) |
Disability Class by Sex by Age in Seba Dalkai
Disability Class: Hearing Difficulty
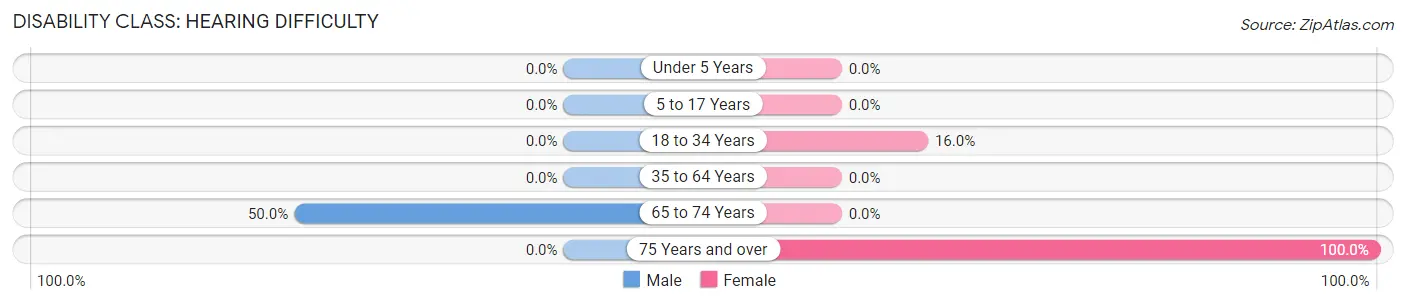
| Age Bracket | Male | Female |
| Under 5 Years | 0 (0.0%) | 0 (0.0%) |
| 5 to 17 Years | 0 (0.0%) | 0 (0.0%) |
| 18 to 34 Years | 0 (0.0%) | 4 (16.0%) |
| 35 to 64 Years | 0 (0.0%) | 0 (0.0%) |
| 65 to 74 Years | 3 (50.0%) | 0 (0.0%) |
| 75 Years and over | 0 (0.0%) | 3 (100.0%) |
Disability Class: Vision Difficulty
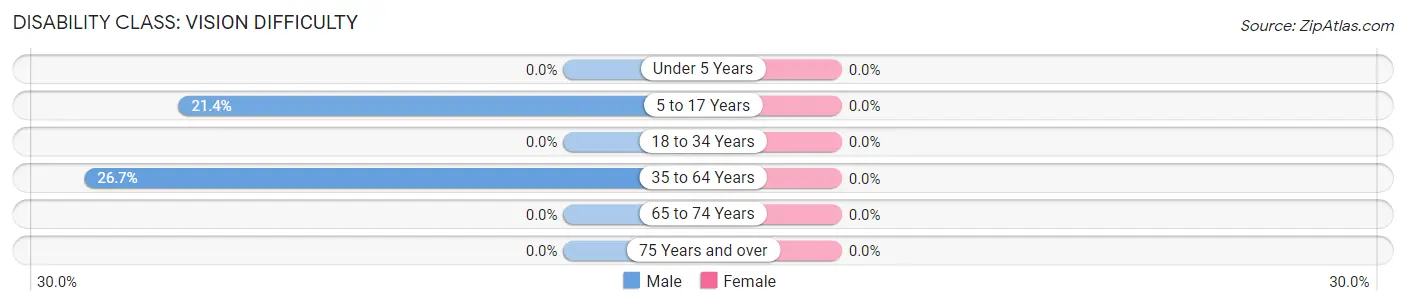
| Age Bracket | Male | Female |
| Under 5 Years | 0 (0.0%) | 0 (0.0%) |
| 5 to 17 Years | 3 (21.4%) | 0 (0.0%) |
| 18 to 34 Years | 0 (0.0%) | 0 (0.0%) |
| 35 to 64 Years | 4 (26.7%) | 0 (0.0%) |
| 65 to 74 Years | 0 (0.0%) | 0 (0.0%) |
| 75 Years and over | 0 (0.0%) | 0 (0.0%) |
Disability Class: Cognitive Difficulty
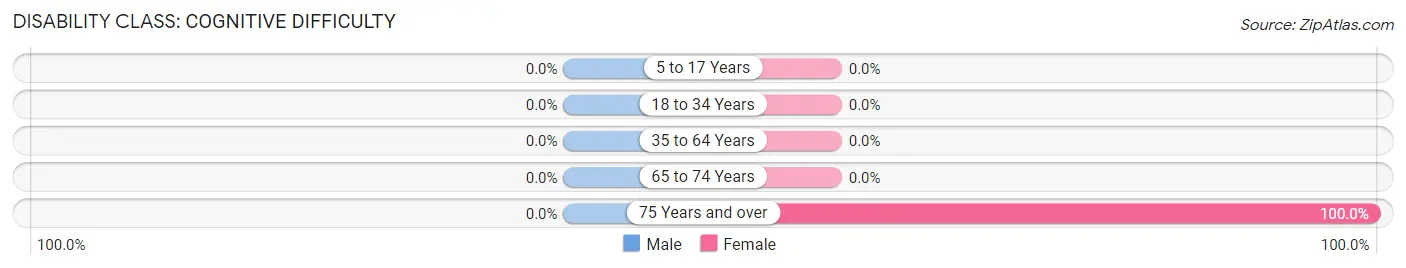
| Age Bracket | Male | Female |
| 5 to 17 Years | 0 (0.0%) | 0 (0.0%) |
| 18 to 34 Years | 0 (0.0%) | 0 (0.0%) |
| 35 to 64 Years | 0 (0.0%) | 0 (0.0%) |
| 65 to 74 Years | 0 (0.0%) | 0 (0.0%) |
| 75 Years and over | 0 (0.0%) | 3 (100.0%) |
Disability Class: Ambulatory Difficulty
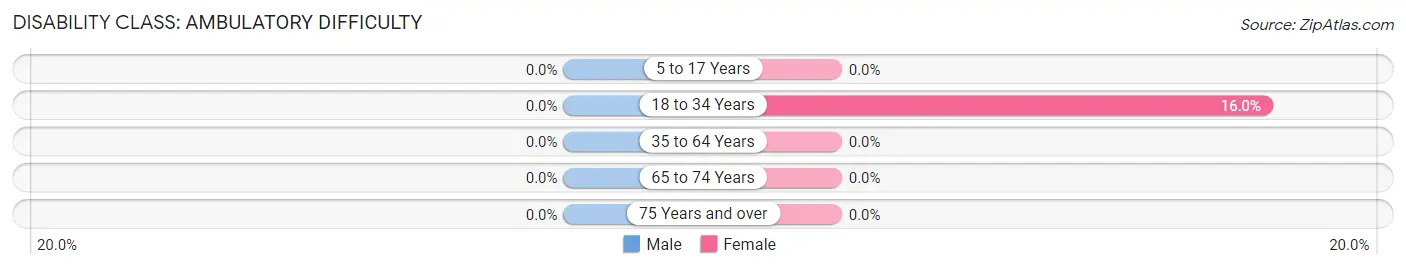
| Age Bracket | Male | Female |
| 5 to 17 Years | 0 (0.0%) | 0 (0.0%) |
| 18 to 34 Years | 0 (0.0%) | 4 (16.0%) |
| 35 to 64 Years | 0 (0.0%) | 0 (0.0%) |
| 65 to 74 Years | 0 (0.0%) | 0 (0.0%) |
| 75 Years and over | 0 (0.0%) | 0 (0.0%) |
Disability Class: Self-Care Difficulty
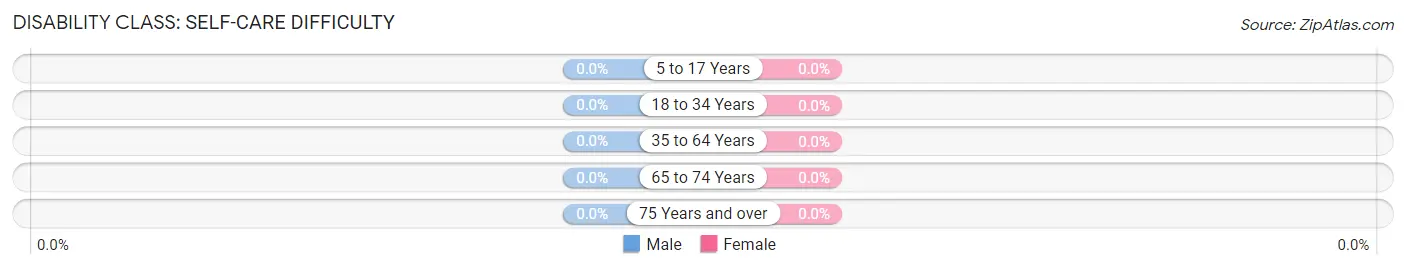
| Age Bracket | Male | Female |
| 5 to 17 Years | 0 (0.0%) | 0 (0.0%) |
| 18 to 34 Years | 0 (0.0%) | 0 (0.0%) |
| 35 to 64 Years | 0 (0.0%) | 0 (0.0%) |
| 65 to 74 Years | 0 (0.0%) | 0 (0.0%) |
| 75 Years and over | 0 (0.0%) | 0 (0.0%) |
Technology Access in Seba Dalkai
Computing Device Access in Seba Dalkai
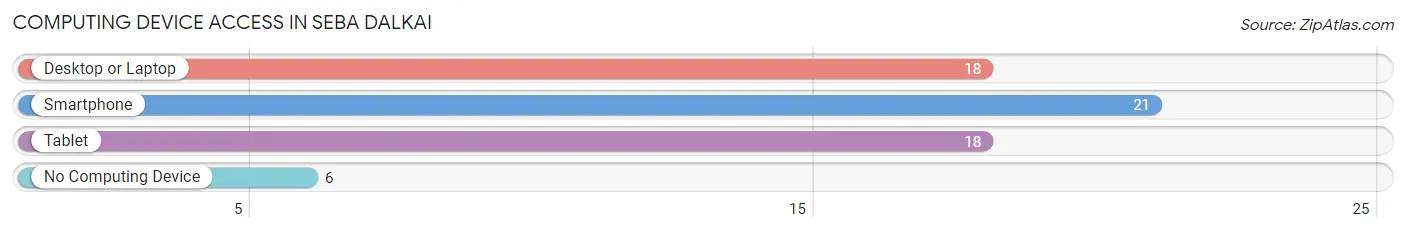
| Device Type | # Households | % Households |
| Desktop or Laptop | 18 | 66.7% |
| Smartphone | 21 | 77.8% |
| Tablet | 18 | 66.7% |
| No Computing Device | 6 | 22.2% |
| Total | 27 | 100.0% |
Internet Access in Seba Dalkai
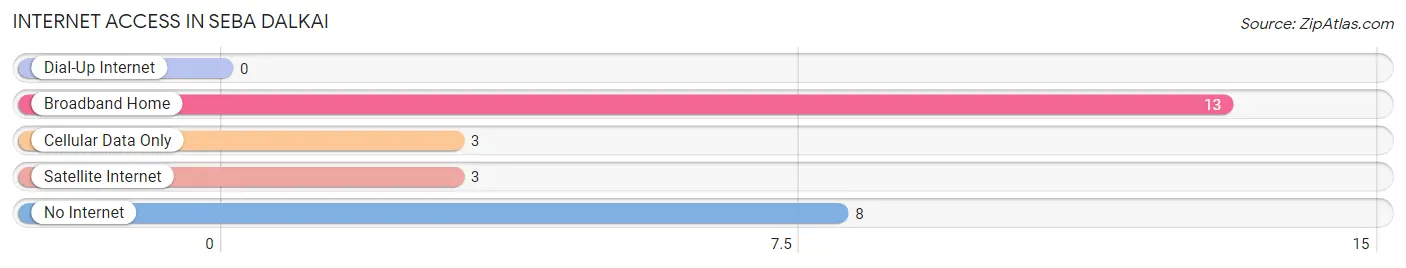
| Internet Type | # Households | % Households |
| Dial-Up Internet | 0 | 0.0% |
| Broadband Home | 13 | 48.1% |
| Cellular Data Only | 3 | 11.1% |
| Satellite Internet | 3 | 11.1% |
| No Internet | 8 | 29.6% |
| Total | 27 | 100.0% |
Seba Dalkai Summary
Arizona is a state located in the southwestern region of the United States. It is the sixth largest state in the country and is bordered by California, Nevada, Utah, New Mexico, and Mexico. Arizona is known for its desert climate, its diverse landscape, and its rich cultural heritage.
History
Arizona has a long and varied history. The area was first inhabited by Native American tribes, including the Hohokam, the Pima, and the Apache. These tribes were hunter-gatherers who lived in the area for thousands of years. In 1539, Spanish explorer Francisco Vásquez de Coronado became the first European to explore the area. In 1853, the United States acquired the area as part of the Gadsden Purchase. In 1863, Arizona became a territory of the United States. In 1912, Arizona became the 48th state to join the Union.
Geography
Arizona is located in the southwestern region of the United States. It is bordered by California, Nevada, Utah, New Mexico, and Mexico. Arizona is the sixth largest state in the country and covers an area of 113,990 square miles. The state is divided into two distinct regions: the Colorado Plateau and the Basin and Range Province. The Colorado Plateau is a high desert region that covers the northern part of the state. It is characterized by its high elevation, its rugged terrain, and its numerous canyons and mesas. The Basin and Range Province is a low desert region that covers the southern part of the state. It is characterized by its flat terrain, its numerous mountain ranges, and its dry climate.
Economy
Arizona has a diverse economy that is driven by a variety of industries. The state’s largest industry is tourism, which accounts for more than $20 billion in annual revenue. Other major industries include manufacturing, agriculture, mining, and technology. Arizona is also home to a number of Fortune 500 companies, including Avnet, Freeport-McMoRan, and PetSmart.
Demographics
As of 2020, Arizona had an estimated population of 7.3 million people. The state is home to a diverse population that is composed of many different ethnic and racial groups. The largest ethnic group in the state is Hispanic or Latino, which makes up 31.7% of the population. Other major ethnic groups include White (60.3%), Native American (4.9%), and Asian (2.7%). The state’s largest cities are Phoenix, Tucson, Mesa, and Glendale.
Conclusion
Arizona is a state located in the southwestern region of the United States. It is the sixth largest state in the country and is bordered by California, Nevada, Utah, New Mexico, and Mexico. Arizona is known for its desert climate, its diverse landscape, and its rich cultural heritage. The state has a diverse economy that is driven by a variety of industries, including tourism, manufacturing, agriculture, mining, and technology. Arizona is also home to a diverse population that is composed of many different ethnic and racial groups.
Common Questions
What is Per Capita Income in Seba Dalkai?
Per Capita income in Seba Dalkai is $14,780.
What is the Median Family Income in Seba Dalkai?
Median Family Income in Seba Dalkai is $58,750.
What is the Median Household income in Seba Dalkai?
Median Household Income in Seba Dalkai is $58,750.
What is Inequality or Gini Index in Seba Dalkai?
Inequality or Gini Index in Seba Dalkai is 0.39.
What is the Total Population of Seba Dalkai?
Total Population of Seba Dalkai is 132.
What is the Total Male Population of Seba Dalkai?
Total Male Population of Seba Dalkai is 61.
What is the Total Female Population of Seba Dalkai?
Total Female Population of Seba Dalkai is 71.
What is the Ratio of Males per 100 Females in Seba Dalkai?
There are 85.92 Males per 100 Females in Seba Dalkai.
What is the Ratio of Females per 100 Males in Seba Dalkai?
There are 116.39 Females per 100 Males in Seba Dalkai.
What is the Median Population Age in Seba Dalkai?
Median Population Age in Seba Dalkai is 24.5 Years.
What is the Average Family Size in Seba Dalkai
Average Family Size in Seba Dalkai is 8.0 People.
What is the Average Household Size in Seba Dalkai
Average Household Size in Seba Dalkai is 4.9 People.
How Large is the Labor Force in Seba Dalkai?
There are 26 People in the Labor Forcein in Seba Dalkai.
What is the Percentage of People in the Labor Force in Seba Dalkai?
29.5% of People are in the Labor Force in Seba Dalkai.