Immigrants from Philippines vs Immigrants from India Self-Care Disability
COMPARE
Immigrants from Philippines
Immigrants from India
Self-Care Disability
Self-Care Disability Comparison
Immigrants from Philippines
Immigrants from India
2.6%
SELF-CARE DISABILITY
2.7/ 100
METRIC RATING
227th/ 347
METRIC RANK
2.0%
SELF-CARE DISABILITY
100.0/ 100
METRIC RATING
2nd/ 347
METRIC RANK
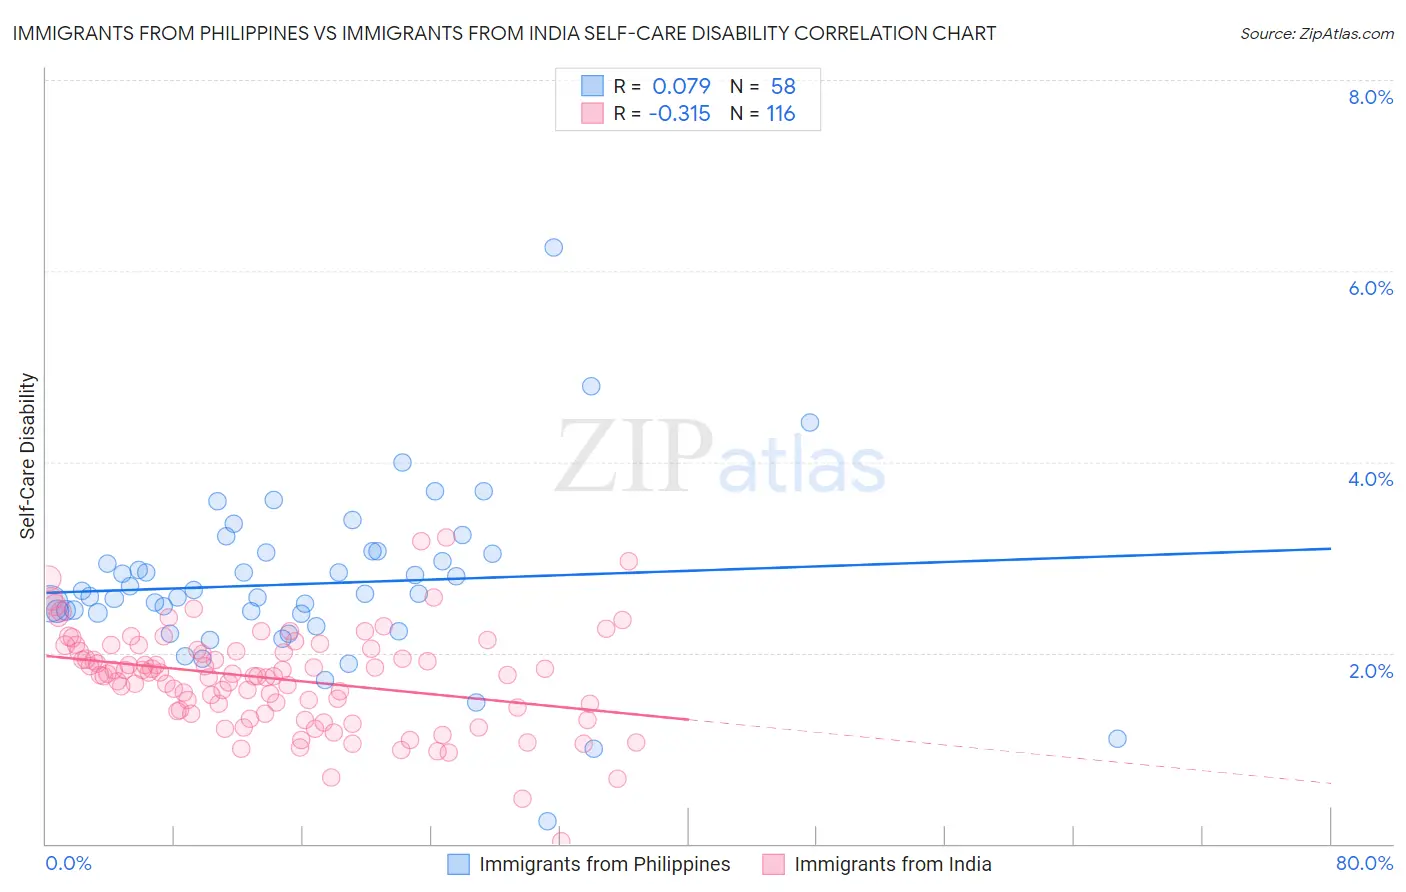
Immigrants from Philippines vs Immigrants from India Self-Care Disability Correlation Chart
The statistical analysis conducted on geographies consisting of 470,541,015 people shows a slight positive correlation between the proportion of Immigrants from Philippines and percentage of population with self-care disability in the United States with a correlation coefficient (R) of 0.079 and weighted average of 2.6%. Similarly, the statistical analysis conducted on geographies consisting of 433,462,707 people shows a mild negative correlation between the proportion of Immigrants from India and percentage of population with self-care disability in the United States with a correlation coefficient (R) of -0.315 and weighted average of 2.0%, a difference of 27.3%.
Self-Care Disability Correlation Summary
| Measurement | Immigrants from Philippines | Immigrants from India |
| Minimum | 0.24% | 0.030% |
| Maximum | 6.2% | 3.2% |
| Range | 6.0% | 3.2% |
| Mean | 2.7% | 1.7% |
| Median | 2.6% | 1.8% |
| Interquartile 25% (IQ1) | 2.4% | 1.4% |
| Interquartile 75% (IQ3) | 3.0% | 2.0% |
| Interquartile Range (IQR) | 0.64% | 0.64% |
| Standard Deviation (Sample) | 0.89% | 0.52% |
| Standard Deviation (Population) | 0.88% | 0.52% |
Similar Demographics by Self-Care Disability
Demographics Similar to Immigrants from Philippines by Self-Care Disability
In terms of self-care disability, the demographic groups most similar to Immigrants from Philippines are Guatemalan (2.6%, a difference of 0.010%), Chinese (2.6%, a difference of 0.080%), Guamanian/Chamorro (2.6%, a difference of 0.080%), Immigrants from Ecuador (2.6%, a difference of 0.080%), and Iraqi (2.6%, a difference of 0.18%).
| Demographics | Rating | Rank | Self-Care Disability |
| Sub-Saharan Africans | 4.0 /100 | #220 | Tragic 2.6% |
| Hondurans | 3.8 /100 | #221 | Tragic 2.6% |
| Spaniards | 3.8 /100 | #222 | Tragic 2.6% |
| French Canadians | 3.8 /100 | #223 | Tragic 2.6% |
| Osage | 3.6 /100 | #224 | Tragic 2.6% |
| Iraqis | 3.2 /100 | #225 | Tragic 2.6% |
| Chinese | 2.9 /100 | #226 | Tragic 2.6% |
| Immigrants | Philippines | 2.7 /100 | #227 | Tragic 2.6% |
| Guatemalans | 2.7 /100 | #228 | Tragic 2.6% |
| Guamanians/Chamorros | 2.5 /100 | #229 | Tragic 2.6% |
| Immigrants | Ecuador | 2.5 /100 | #230 | Tragic 2.6% |
| Immigrants | Guatemala | 2.2 /100 | #231 | Tragic 2.6% |
| Albanians | 2.2 /100 | #232 | Tragic 2.6% |
| Liberians | 2.1 /100 | #233 | Tragic 2.6% |
| Vietnamese | 2.1 /100 | #234 | Tragic 2.6% |
Demographics Similar to Immigrants from India by Self-Care Disability
In terms of self-care disability, the demographic groups most similar to Immigrants from India are Thai (2.1%, a difference of 3.0%), Immigrants from Singapore (2.1%, a difference of 5.4%), Zimbabwean (2.2%, a difference of 6.5%), Filipino (2.2%, a difference of 6.7%), and Immigrants from Bolivia (2.2%, a difference of 6.9%).
| Demographics | Rating | Rank | Self-Care Disability |
| Yup'ik | 100.0 /100 | #1 | Exceptional 1.9% |
| Immigrants | India | 100.0 /100 | #2 | Exceptional 2.0% |
| Thais | 100.0 /100 | #3 | Exceptional 2.1% |
| Immigrants | Singapore | 100.0 /100 | #4 | Exceptional 2.1% |
| Zimbabweans | 100.0 /100 | #5 | Exceptional 2.2% |
| Filipinos | 100.0 /100 | #6 | Exceptional 2.2% |
| Immigrants | Bolivia | 100.0 /100 | #7 | Exceptional 2.2% |
| Bolivians | 100.0 /100 | #8 | Exceptional 2.2% |
| Immigrants | Nepal | 100.0 /100 | #9 | Exceptional 2.2% |
| Sudanese | 100.0 /100 | #10 | Exceptional 2.2% |
| Immigrants | South Central Asia | 100.0 /100 | #11 | Exceptional 2.2% |
| Immigrants | Ethiopia | 100.0 /100 | #12 | Exceptional 2.2% |
| Ethiopians | 100.0 /100 | #13 | Exceptional 2.2% |
| Luxembourgers | 100.0 /100 | #14 | Exceptional 2.2% |
| Okinawans | 100.0 /100 | #15 | Exceptional 2.2% |