Fall River, WI Map & Demographics
Fall River Map
Fall River Overview
$30,793
PER CAPITA INCOME
$88,750
AVG FAMILY INCOME
$74,688
AVG HOUSEHOLD INCOME
36.3%
WAGE / INCOME GAP [ % ]
63.7¢/ $1
WAGE / INCOME GAP [ $ ]
0.36
INEQUALITY / GINI INDEX
1,708
TOTAL POPULATION
860
MALE POPULATION
848
FEMALE POPULATION
101.42
MALES / 100 FEMALES
98.60
FEMALES / 100 MALES
35.5
MEDIAN AGE
3.3
AVG FAMILY SIZE
2.8
AVG HOUSEHOLD SIZE
937
LABOR FORCE [ PEOPLE ]
75.6%
PERCENT IN LABOR FORCE
3.0%
UNEMPLOYMENT RATE
Fall River Zip Codes
Fall River Area Codes
Income in Fall River
Income Overview in Fall River
Per Capita Income in Fall River is $30,793, while median incomes of families and households are $88,750 and $74,688 respectively.
| Characteristic | Number | Measure |
| Per Capita Income | 1,708 | $30,793 |
| Median Family Income | 435 | $88,750 |
| Mean Family Income | 435 | $95,162 |
| Median Household Income | 618 | $74,688 |
| Mean Household Income | 618 | $83,324 |
| Income Deficit | 435 | $0 |
| Wage / Income Gap (%) | 1,708 | 36.25% |
| Wage / Income Gap ($) | 1,708 | 63.75¢ per $1 |
| Gini / Inequality Index | 1,708 | 0.36 |
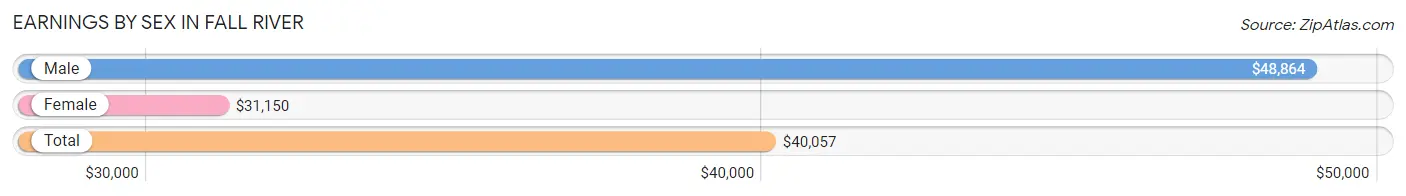
Earnings by Sex in Fall River
Average Earnings in Fall River are $40,057, $48,864 for men and $31,150 for women, a difference of 36.2%.
| Sex | Number | Average Earnings |
| Male | 500 (50.8%) | $48,864 |
| Female | 485 (49.2%) | $31,150 |
| Total | 985 (100.0%) | $40,057 |
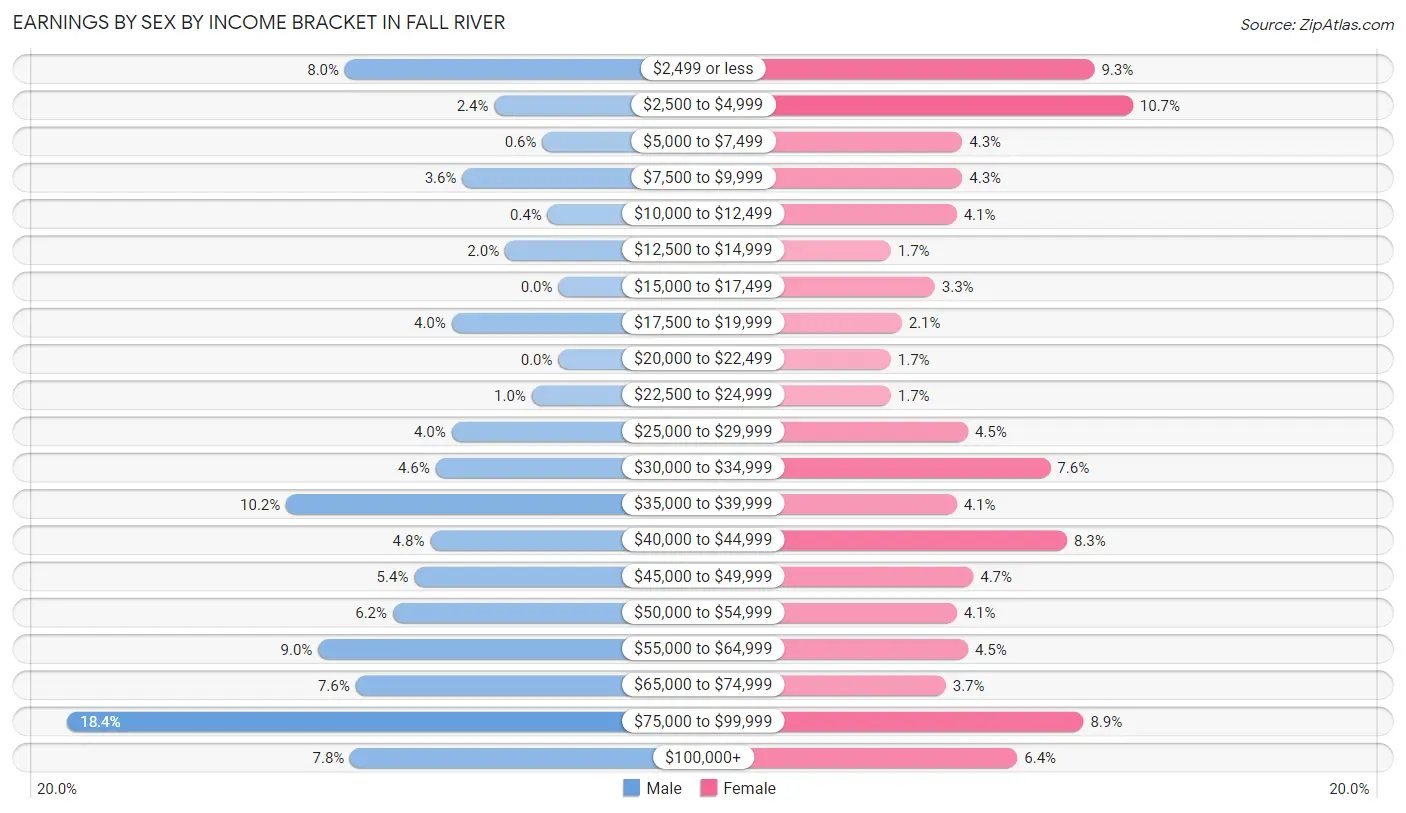
Earnings by Sex by Income Bracket in Fall River
The most common earnings brackets in Fall River are $75,000 to $99,999 for men (92 | 18.4%) and $2,500 to $4,999 for women (52 | 10.7%).
| Income | Male | Female |
| $2,499 or less | 40 (8.0%) | 45 (9.3%) |
| $2,500 to $4,999 | 12 (2.4%) | 52 (10.7%) |
| $5,000 to $7,499 | 3 (0.6%) | 21 (4.3%) |
| $7,500 to $9,999 | 18 (3.6%) | 21 (4.3%) |
| $10,000 to $12,499 | 2 (0.4%) | 20 (4.1%) |
| $12,500 to $14,999 | 10 (2.0%) | 8 (1.7%) |
| $15,000 to $17,499 | 0 (0.0%) | 16 (3.3%) |
| $17,500 to $19,999 | 20 (4.0%) | 10 (2.1%) |
| $20,000 to $22,499 | 0 (0.0%) | 8 (1.7%) |
| $22,500 to $24,999 | 5 (1.0%) | 8 (1.7%) |
| $25,000 to $29,999 | 20 (4.0%) | 22 (4.5%) |
| $30,000 to $34,999 | 23 (4.6%) | 37 (7.6%) |
| $35,000 to $39,999 | 51 (10.2%) | 20 (4.1%) |
| $40,000 to $44,999 | 24 (4.8%) | 40 (8.3%) |
| $45,000 to $49,999 | 27 (5.4%) | 23 (4.7%) |
| $50,000 to $54,999 | 31 (6.2%) | 20 (4.1%) |
| $55,000 to $64,999 | 45 (9.0%) | 22 (4.5%) |
| $65,000 to $74,999 | 38 (7.6%) | 18 (3.7%) |
| $75,000 to $99,999 | 92 (18.4%) | 43 (8.9%) |
| $100,000+ | 39 (7.8%) | 31 (6.4%) |
| Total | 500 (100.0%) | 485 (100.0%) |
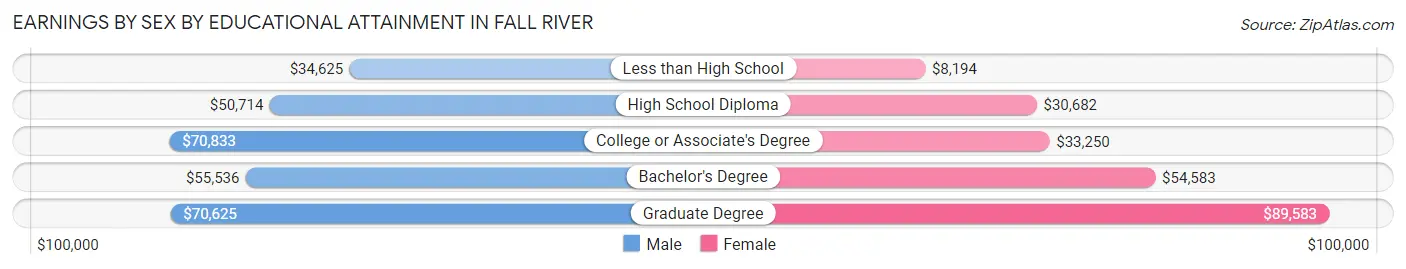
Earnings by Sex by Educational Attainment in Fall River
Average earnings in Fall River are $54,531 for men and $36,250 for women, a difference of 33.5%. Men with an educational attainment of college or associate's degree enjoy the highest average annual earnings of $70,833, while those with less than high school education earn the least with $34,625. Women with an educational attainment of graduate degree earn the most with the average annual earnings of $89,583, while those with less than high school education have the smallest earnings of $8,194.
| Educational Attainment | Male Income | Female Income |
| Less than High School | $34,625 | $8,194 |
| High School Diploma | $50,714 | $30,682 |
| College or Associate's Degree | $70,833 | $33,250 |
| Bachelor's Degree | $55,536 | $54,583 |
| Graduate Degree | $70,625 | $89,583 |
| Total | $54,531 | $36,250 |
Family Income in Fall River
Family Income Brackets in Fall River
According to the Fall River family income data, there are 112 families falling into the $100,000 to $149,999 income range, which is the most common income bracket and makes up 25.8% of all families. Conversely, the $15,000 to $24,999 income bracket is the least frequent group with only 4 families (0.9%) belonging to this category.
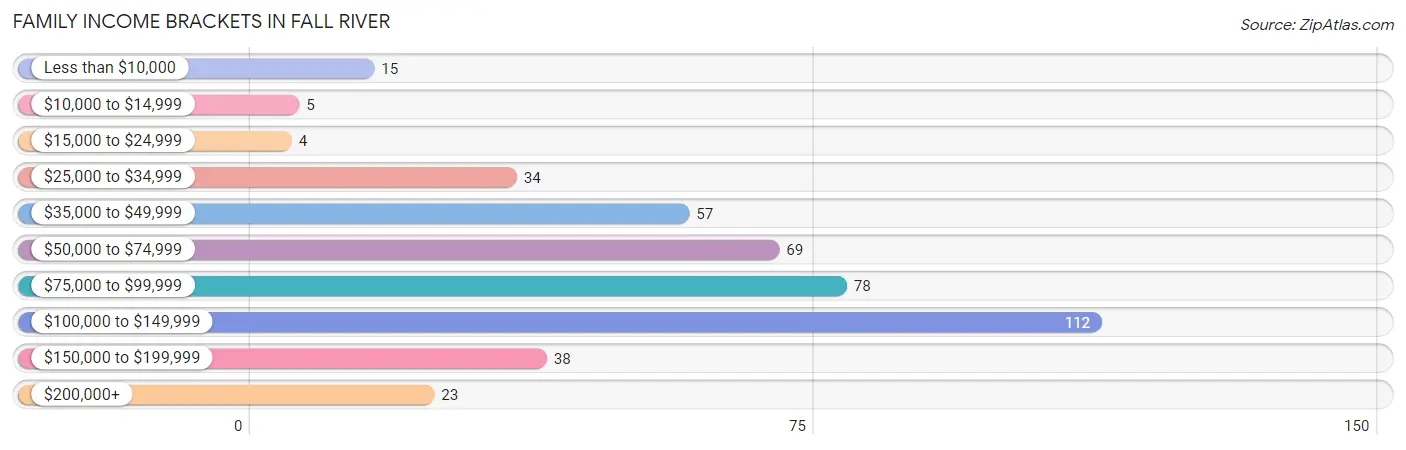
| Income Bracket | # Families | % Families |
| Less than $10,000 | 15 | 3.4% |
| $10,000 to $14,999 | 5 | 1.1% |
| $15,000 to $24,999 | 4 | 0.9% |
| $25,000 to $34,999 | 34 | 7.8% |
| $35,000 to $49,999 | 57 | 13.1% |
| $50,000 to $74,999 | 69 | 15.9% |
| $75,000 to $99,999 | 78 | 17.9% |
| $100,000 to $149,999 | 112 | 25.7% |
| $150,000 to $199,999 | 38 | 8.7% |
| $200,000+ | 23 | 5.3% |
Family Income by Famaliy Size in Fall River
3-person families (136 | 31.3%) account for the highest median family income in Fall River with $98,750 per family, while 2-person families (159 | 36.5%) have the highest median income of $46,406 per family member.
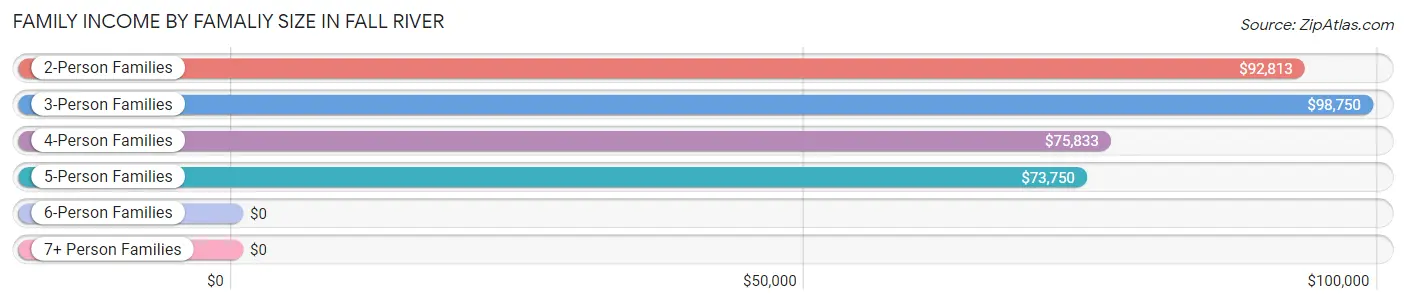
| Income Bracket | # Families | Median Income |
| 2-Person Families | 159 (36.5%) | $92,813 |
| 3-Person Families | 136 (31.3%) | $98,750 |
| 4-Person Families | 60 (13.8%) | $75,833 |
| 5-Person Families | 58 (13.3%) | $73,750 |
| 6-Person Families | 8 (1.8%) | $0 |
| 7+ Person Families | 14 (3.2%) | $0 |
| Total | 435 (100.0%) | $88,750 |
Family Income by Number of Earners in Fall River
The median family income in Fall River is $88,750, with families comprising 2 earners (220) having the highest median family income of $98,750, while families with no earners (27) have the lowest median family income of $58,750, accounting for 50.6% and 6.2% of families, respectively.
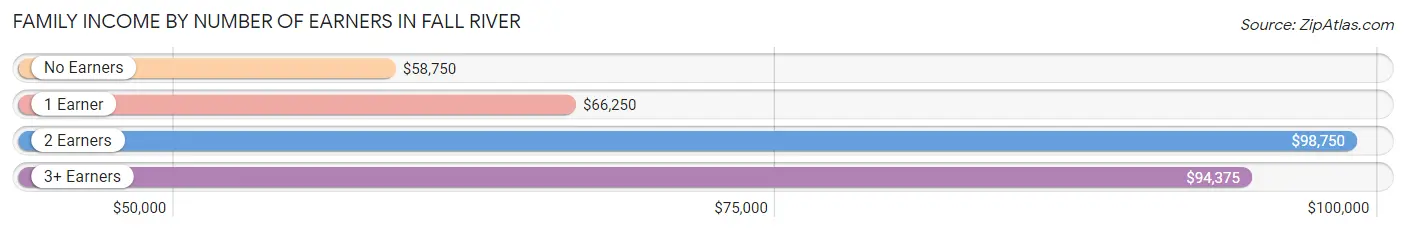
| Number of Earners | # Families | Median Income |
| No Earners | 27 (6.2%) | $58,750 |
| 1 Earner | 114 (26.2%) | $66,250 |
| 2 Earners | 220 (50.6%) | $98,750 |
| 3+ Earners | 74 (17.0%) | $94,375 |
| Total | 435 (100.0%) | $88,750 |
Household Income in Fall River
Household Income Brackets in Fall River
With 122 households falling in the category, the $100,000 to $149,999 income range is the most frequent in Fall River, accounting for 19.7% of all households. In contrast, only 14 households (2.3%) fall into the $10,000 to $14,999 income bracket, making it the least populous group.
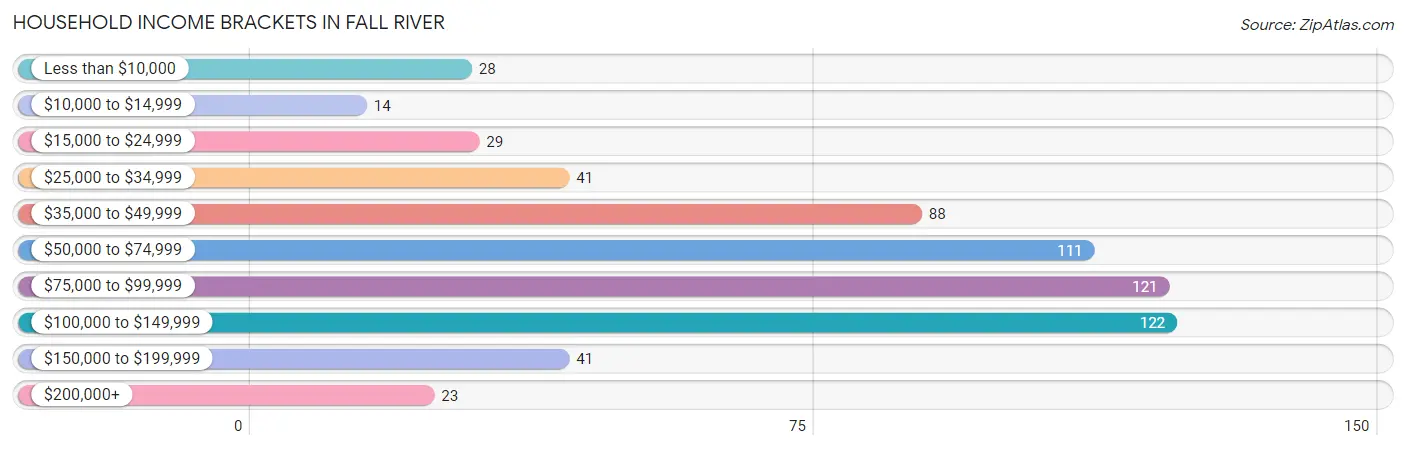
| Income Bracket | # Households | % Households |
| Less than $10,000 | 28 | 4.5% |
| $10,000 to $14,999 | 14 | 2.3% |
| $15,000 to $24,999 | 29 | 4.7% |
| $25,000 to $34,999 | 41 | 6.6% |
| $35,000 to $49,999 | 88 | 14.2% |
| $50,000 to $74,999 | 111 | 18.0% |
| $75,000 to $99,999 | 121 | 19.6% |
| $100,000 to $149,999 | 122 | 19.7% |
| $150,000 to $199,999 | 41 | 6.6% |
| $200,000+ | 23 | 3.7% |
Household Income by Householder Age in Fall River
The median household income in Fall River is $74,688, with the highest median household income of $82,667 found in the 45 to 64 years age bracket for the primary householder. A total of 274 households (44.3%) fall into this category. Meanwhile, the 15 to 24 years age bracket for the primary householder has the lowest median household income of $0, with 11 households (1.8%) in this group.
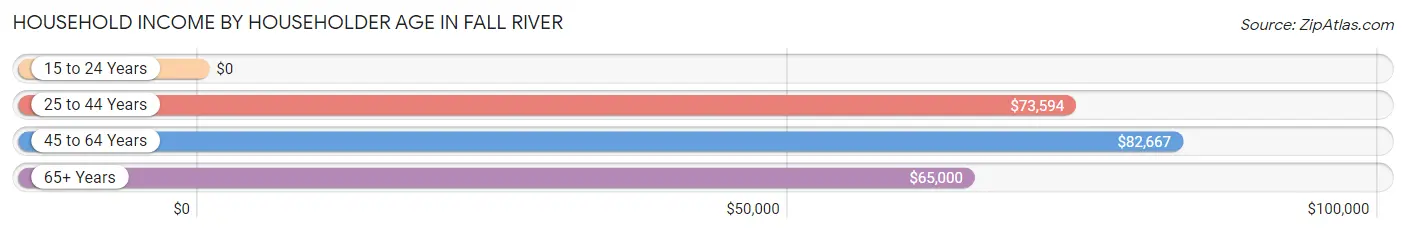
| Income Bracket | # Households | Median Income |
| 15 to 24 Years | 11 (1.8%) | $0 |
| 25 to 44 Years | 233 (37.7%) | $73,594 |
| 45 to 64 Years | 274 (44.3%) | $82,667 |
| 65+ Years | 100 (16.2%) | $65,000 |
| Total | 618 (100.0%) | $74,688 |
Poverty in Fall River
Income Below Poverty by Sex and Age in Fall River
With 8.5% poverty level for males and 11.4% for females among the residents of Fall River, 16 and 17 year old males and 15 year old females are the most vulnerable to poverty, with 17 males (46.0%) and 5 females (100.0%) in their respective age groups living below the poverty level.
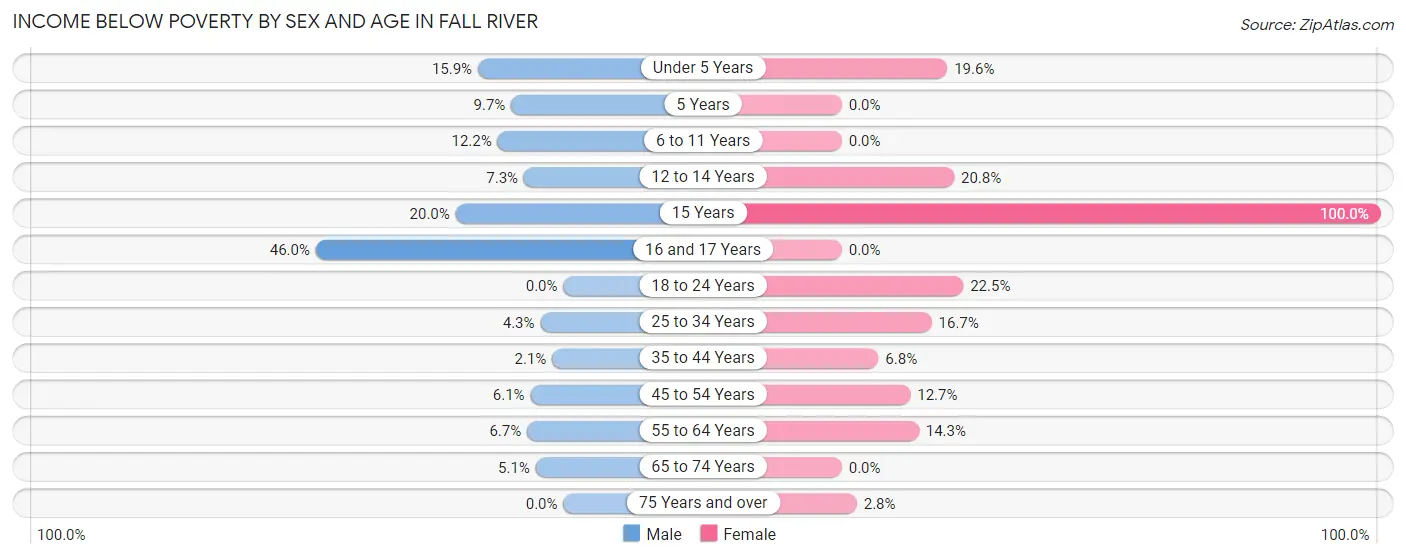
| Age Bracket | Male | Female |
| Under 5 Years | 13 (15.9%) | 9 (19.6%) |
| 5 Years | 3 (9.7%) | 0 (0.0%) |
| 6 to 11 Years | 11 (12.2%) | 0 (0.0%) |
| 12 to 14 Years | 3 (7.3%) | 10 (20.8%) |
| 15 Years | 3 (20.0%) | 5 (100.0%) |
| 16 and 17 Years | 17 (46.0%) | 0 (0.0%) |
| 18 to 24 Years | 0 (0.0%) | 16 (22.5%) |
| 25 to 34 Years | 4 (4.3%) | 15 (16.7%) |
| 35 to 44 Years | 3 (2.1%) | 10 (6.8%) |
| 45 to 54 Years | 8 (6.1%) | 15 (12.7%) |
| 55 to 64 Years | 6 (6.7%) | 15 (14.3%) |
| 65 to 74 Years | 2 (5.1%) | 0 (0.0%) |
| 75 Years and over | 0 (0.0%) | 1 (2.8%) |
| Total | 73 (8.5%) | 96 (11.4%) |
Income Above Poverty by Sex and Age in Fall River
According to the poverty statistics in Fall River, males aged 18 to 24 years and females aged 5 years are the age groups that are most secure financially, with 100.0% of males and 100.0% of females in these age groups living above the poverty line.
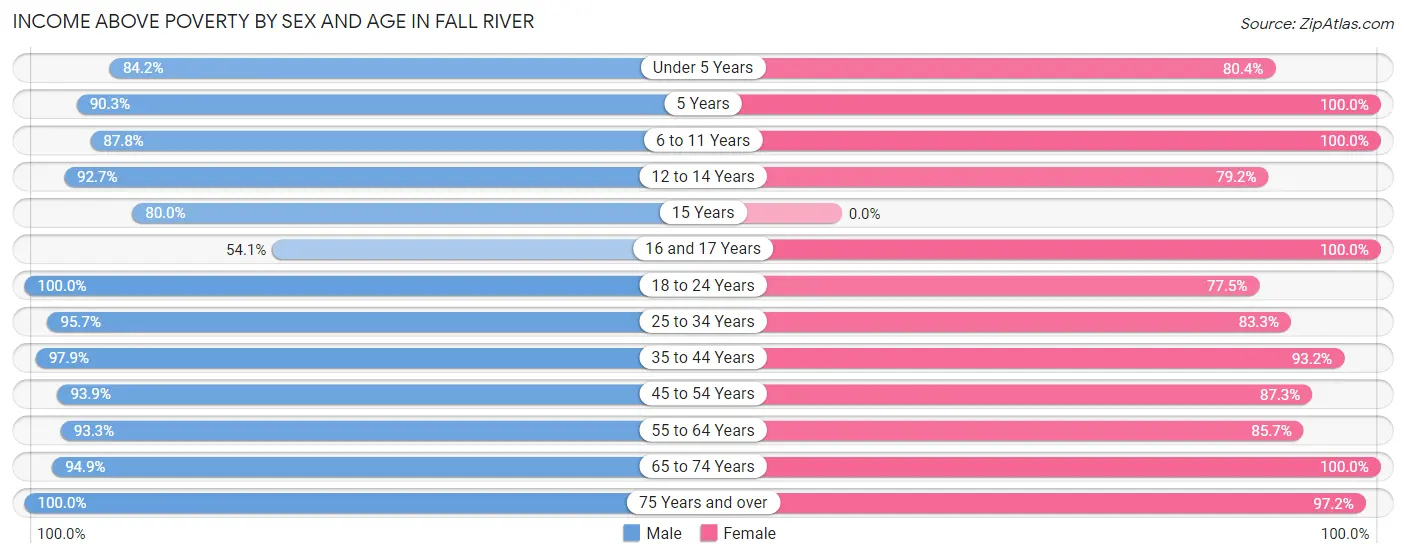
| Age Bracket | Male | Female |
| Under 5 Years | 69 (84.2%) | 37 (80.4%) |
| 5 Years | 28 (90.3%) | 6 (100.0%) |
| 6 to 11 Years | 79 (87.8%) | 91 (100.0%) |
| 12 to 14 Years | 38 (92.7%) | 38 (79.2%) |
| 15 Years | 12 (80.0%) | 0 (0.0%) |
| 16 and 17 Years | 20 (54.0%) | 27 (100.0%) |
| 18 to 24 Years | 54 (100.0%) | 55 (77.5%) |
| 25 to 34 Years | 90 (95.7%) | 75 (83.3%) |
| 35 to 44 Years | 142 (97.9%) | 137 (93.2%) |
| 45 to 54 Years | 123 (93.9%) | 103 (87.3%) |
| 55 to 64 Years | 83 (93.3%) | 90 (85.7%) |
| 65 to 74 Years | 37 (94.9%) | 49 (100.0%) |
| 75 Years and over | 7 (100.0%) | 35 (97.2%) |
| Total | 782 (91.5%) | 743 (88.6%) |
Income Below Poverty Among Married-Couple Families in Fall River
The poverty statistics for married-couple families in Fall River show that 3.5% or 11 of the total 311 families live below the poverty line. Families with 5 or more children have the highest poverty rate of 100.0%, comprising of 3 families. On the other hand, families with no children have the lowest poverty rate of 0.0%, which includes 0 families.
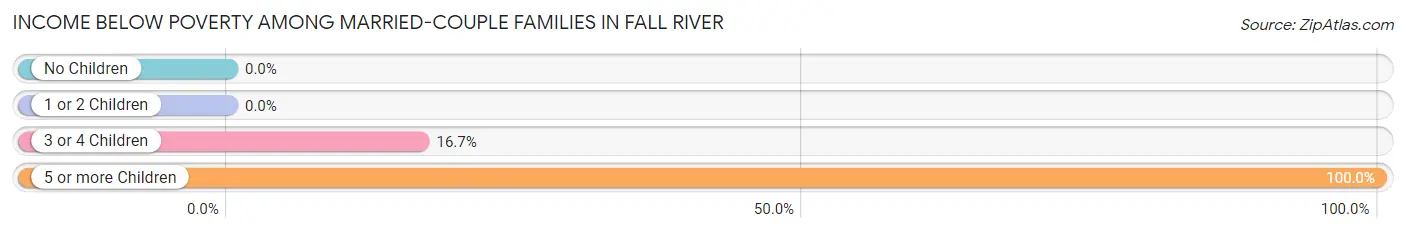
| Children | Above Poverty | Below Poverty |
| No Children | 134 (100.0%) | 0 (0.0%) |
| 1 or 2 Children | 126 (100.0%) | 0 (0.0%) |
| 3 or 4 Children | 40 (83.3%) | 8 (16.7%) |
| 5 or more Children | 0 (0.0%) | 3 (100.0%) |
| Total | 300 (96.5%) | 11 (3.5%) |
Income Below Poverty Among Single-Parent Households in Fall River
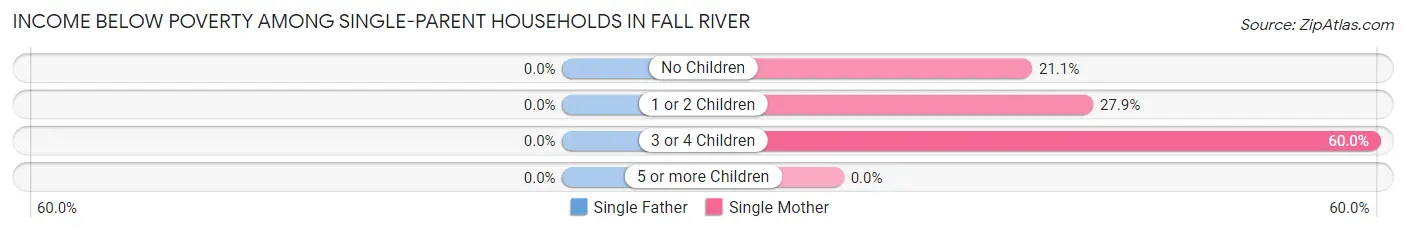
| Children | Single Father | Single Mother |
| No Children | 0 (0.0%) | 4 (21.0%) |
| 1 or 2 Children | 0 (0.0%) | 17 (27.9%) |
| 3 or 4 Children | 0 (0.0%) | 3 (60.0%) |
| 5 or more Children | 0 (0.0%) | 0 (0.0%) |
| Total | 0 (0.0%) | 24 (28.2%) |
Income Below Poverty Among Married-Couple vs Single-Parent Households in Fall River
The poverty data for Fall River shows that 11 of the married-couple family households (3.5%) and 24 of the single-parent households (19.4%) are living below the poverty level. Within the married-couple family households, those with 5 or more children have the highest poverty rate, with 3 households (100.0%) falling below the poverty line. Among the single-parent households, those with 3 or 4 children have the highest poverty rate, with 3 household (37.5%) living below poverty.
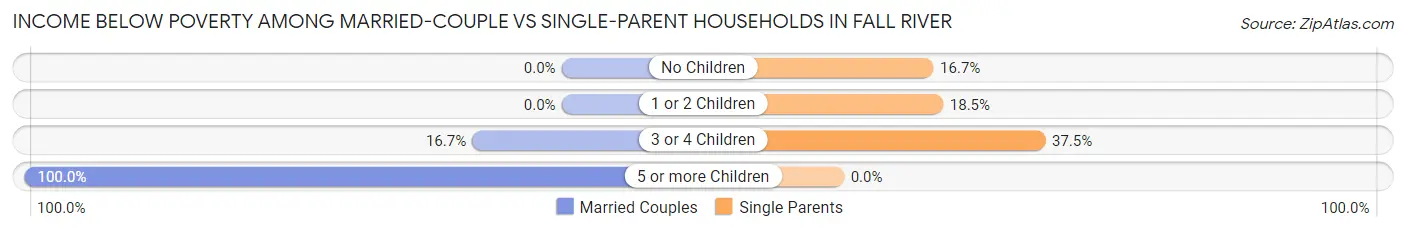
| Children | Married-Couple Families | Single-Parent Households |
| No Children | 0 (0.0%) | 4 (16.7%) |
| 1 or 2 Children | 0 (0.0%) | 17 (18.5%) |
| 3 or 4 Children | 8 (16.7%) | 3 (37.5%) |
| 5 or more Children | 3 (100.0%) | 0 (0.0%) |
| Total | 11 (3.5%) | 24 (19.4%) |
Race in Fall River
The most populous races in Fall River are White / Caucasian (1,401 | 82.0%), Hispanic or Latino (155 | 9.1%), and Two or more Races (121 | 7.1%).
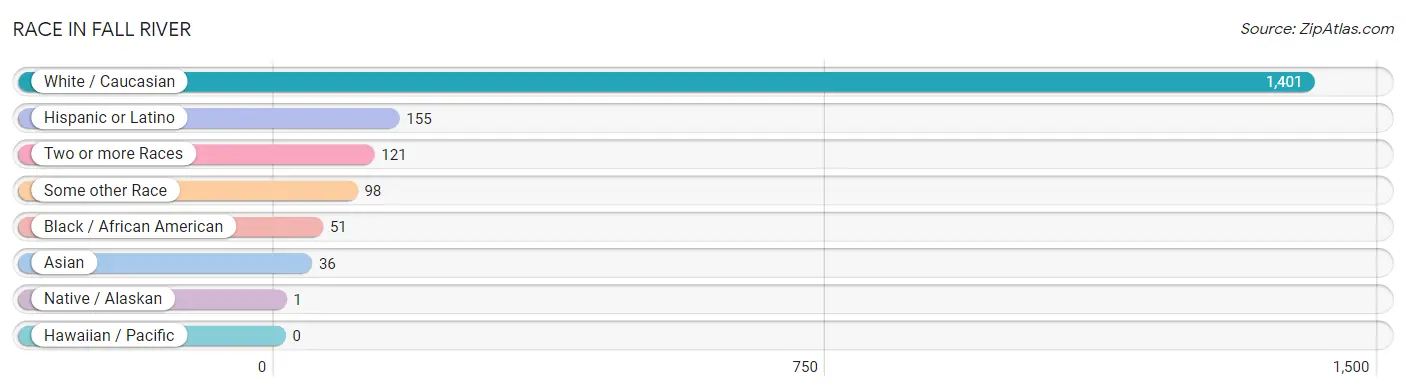
| Race | # Population | % Population |
| Asian | 36 | 2.1% |
| Black / African American | 51 | 3.0% |
| Hawaiian / Pacific | 0 | 0.0% |
| Hispanic or Latino | 155 | 9.1% |
| Native / Alaskan | 1 | 0.1% |
| White / Caucasian | 1,401 | 82.0% |
| Two or more Races | 121 | 7.1% |
| Some other Race | 98 | 5.7% |
| Total | 1,708 | 100.0% |
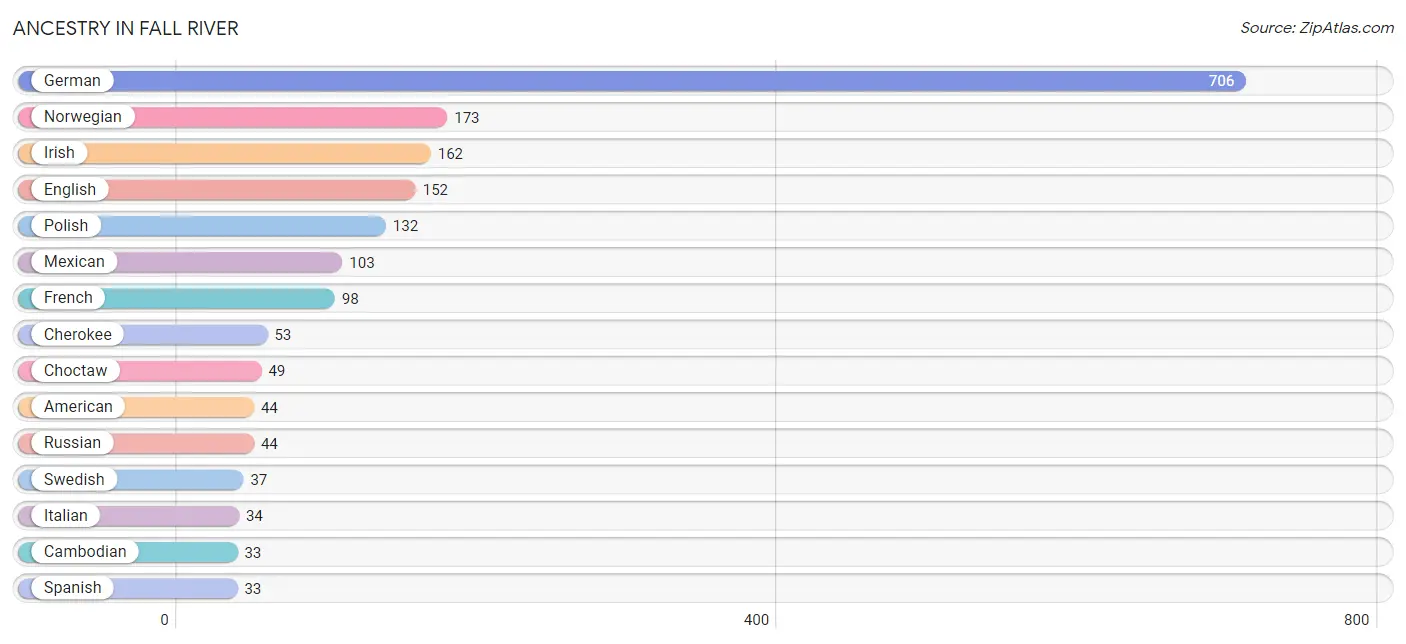
Ancestry in Fall River
The most populous ancestries reported in Fall River are German (706 | 41.3%), Norwegian (173 | 10.1%), Irish (162 | 9.5%), English (152 | 8.9%), and Polish (132 | 7.7%), together accounting for 77.6% of all Fall River residents.
| Ancestry | # Population | % Population |
| African | 3 | 0.2% |
| American | 44 | 2.6% |
| Arab | 7 | 0.4% |
| Austrian | 3 | 0.2% |
| Belgian | 6 | 0.4% |
| Bhutanese | 2 | 0.1% |
| Brazilian | 12 | 0.7% |
| British | 1 | 0.1% |
| Cambodian | 33 | 1.9% |
| Central American | 9 | 0.5% |
| Cherokee | 53 | 3.1% |
| Chippewa | 3 | 0.2% |
| Choctaw | 49 | 2.9% |
| Czech | 4 | 0.2% |
| Czechoslovakian | 8 | 0.5% |
| Danish | 25 | 1.5% |
| Dutch | 32 | 1.9% |
| Eastern European | 6 | 0.4% |
| English | 152 | 8.9% |
| European | 25 | 1.5% |
| Finnish | 1 | 0.1% |
| French | 98 | 5.7% |
| French Canadian | 2 | 0.1% |
| German | 706 | 41.3% |
| Ghanaian | 2 | 0.1% |
| Greek | 3 | 0.2% |
| Honduran | 9 | 0.5% |
| Hungarian | 13 | 0.8% |
| Iranian | 2 | 0.1% |
| Irish | 162 | 9.5% |
| Italian | 34 | 2.0% |
| Lebanese | 3 | 0.2% |
| Mexican | 103 | 6.0% |
| Moroccan | 2 | 0.1% |
| Norwegian | 173 | 10.1% |
| Polish | 132 | 7.7% |
| Portuguese | 3 | 0.2% |
| Russian | 44 | 2.6% |
| Scandinavian | 1 | 0.1% |
| Scotch-Irish | 10 | 0.6% |
| Scottish | 5 | 0.3% |
| Slovak | 3 | 0.2% |
| Slovene | 9 | 0.5% |
| Spanish | 33 | 1.9% |
| Sri Lankan | 9 | 0.5% |
| Subsaharan African | 9 | 0.5% |
| Swedish | 37 | 2.2% |
| Swiss | 15 | 0.9% |
| Syrian | 2 | 0.1% |
| Welsh | 15 | 0.9% |
| Zimbabwean | 4 | 0.2% | View All 51 Rows |
Immigrants in Fall River
The most numerous immigrant groups reported in Fall River came from Central America (32 | 1.9%), Latin America (32 | 1.9%), Honduras (30 | 1.8%), Asia (14 | 0.8%), and Eastern Asia (14 | 0.8%), together accounting for 7.1% of all Fall River residents.
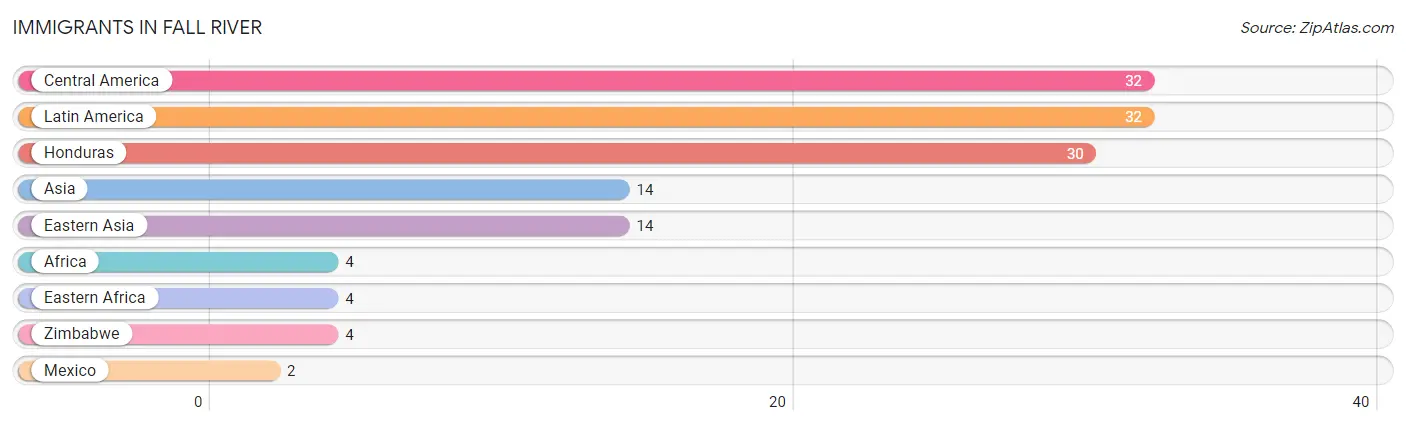
| Immigration Origin | # Population | % Population |
| Africa | 4 | 0.2% |
| Asia | 14 | 0.8% |
| Central America | 32 | 1.9% |
| Eastern Africa | 4 | 0.2% |
| Eastern Asia | 14 | 0.8% |
| Honduras | 30 | 1.8% |
| Latin America | 32 | 1.9% |
| Mexico | 2 | 0.1% |
| Zimbabwe | 4 | 0.2% | View All 9 Rows |
Sex and Age in Fall River
Sex and Age in Fall River
The most populous age groups in Fall River are Under 5 Years (84 | 9.8%) for men and 35 to 39 Years (94 | 11.1%) for women.
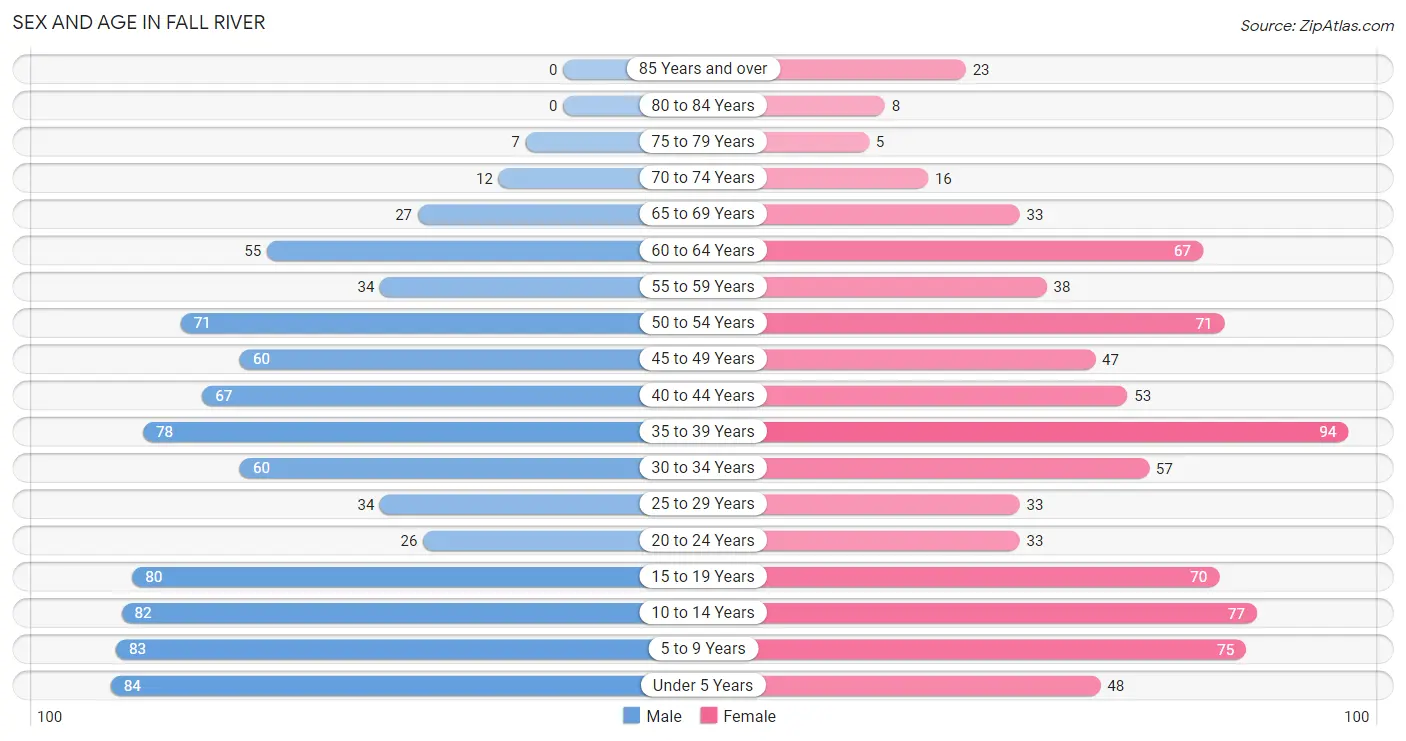
| Age Bracket | Male | Female |
| Under 5 Years | 84 (9.8%) | 48 (5.7%) |
| 5 to 9 Years | 83 (9.7%) | 75 (8.8%) |
| 10 to 14 Years | 82 (9.5%) | 77 (9.1%) |
| 15 to 19 Years | 80 (9.3%) | 70 (8.3%) |
| 20 to 24 Years | 26 (3.0%) | 33 (3.9%) |
| 25 to 29 Years | 34 (4.0%) | 33 (3.9%) |
| 30 to 34 Years | 60 (7.0%) | 57 (6.7%) |
| 35 to 39 Years | 78 (9.1%) | 94 (11.1%) |
| 40 to 44 Years | 67 (7.8%) | 53 (6.2%) |
| 45 to 49 Years | 60 (7.0%) | 47 (5.5%) |
| 50 to 54 Years | 71 (8.3%) | 71 (8.4%) |
| 55 to 59 Years | 34 (4.0%) | 38 (4.5%) |
| 60 to 64 Years | 55 (6.4%) | 67 (7.9%) |
| 65 to 69 Years | 27 (3.1%) | 33 (3.9%) |
| 70 to 74 Years | 12 (1.4%) | 16 (1.9%) |
| 75 to 79 Years | 7 (0.8%) | 5 (0.6%) |
| 80 to 84 Years | 0 (0.0%) | 8 (0.9%) |
| 85 Years and over | 0 (0.0%) | 23 (2.7%) |
| Total | 860 (100.0%) | 848 (100.0%) |
Families and Households in Fall River
Median Family Size in Fall River
The median family size in Fall River is 3.31 persons per family, with married-couple families (311 | 71.5%) accounting for the largest median family size of 3.54 persons per family. On the other hand, single male/father families (39 | 9.0%) represent the smallest median family size with 2.64 persons per family.
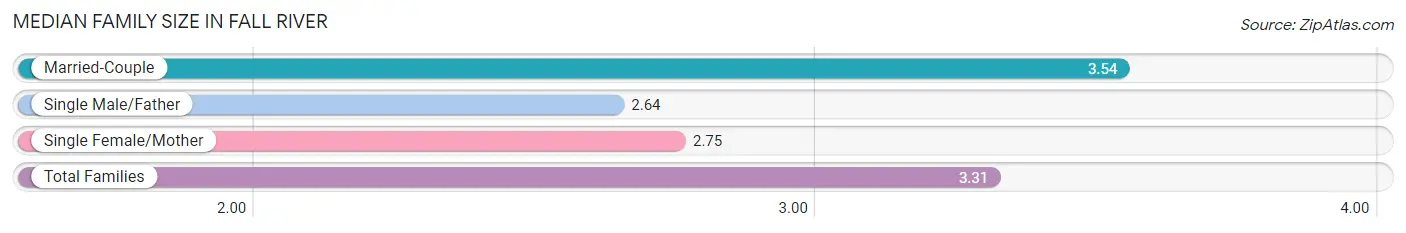
| Family Type | # Families | Family Size |
| Married-Couple | 311 (71.5%) | 3.54 |
| Single Male/Father | 39 (9.0%) | 2.64 |
| Single Female/Mother | 85 (19.5%) | 2.75 |
| Total Families | 435 (100.0%) | 3.31 |
Median Household Size in Fall River
The median household size in Fall River is 2.76 persons per household, with married-couple households (311 | 50.3%) accounting for the largest median household size of 3.59 persons per household. non-family households (183 | 29.6%) represent the smallest median household size with 1.15 persons per household.
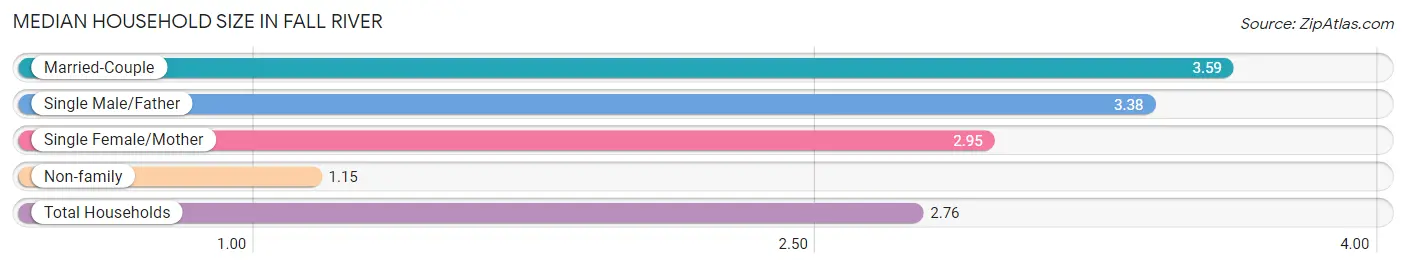
| Household Type | # Households | Household Size |
| Married-Couple | 311 (50.3%) | 3.59 |
| Single Male/Father | 39 (6.3%) | 3.38 |
| Single Female/Mother | 85 (13.8%) | 2.95 |
| Non-family | 183 (29.6%) | 1.15 |
| Total Households | 618 (100.0%) | 2.76 |
Household Size by Marriage Status in Fall River
Out of a total of 618 households in Fall River, 435 (70.4%) are family households, while 183 (29.6%) are nonfamily households. The most numerous type of family households are 2-person households, comprising 139, and the most common type of nonfamily households are 1-person households, comprising 160.
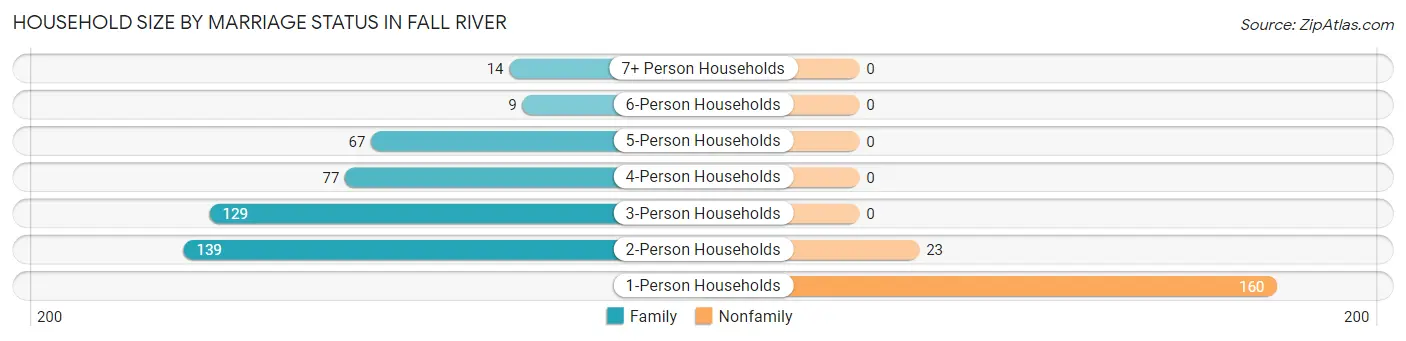
| Household Size | Family Households | Nonfamily Households |
| 1-Person Households | - | 160 (25.9%) |
| 2-Person Households | 139 (22.5%) | 23 (3.7%) |
| 3-Person Households | 129 (20.9%) | 0 (0.0%) |
| 4-Person Households | 77 (12.5%) | 0 (0.0%) |
| 5-Person Households | 67 (10.8%) | 0 (0.0%) |
| 6-Person Households | 9 (1.5%) | 0 (0.0%) |
| 7+ Person Households | 14 (2.3%) | 0 (0.0%) |
| Total | 435 (70.4%) | 183 (29.6%) |
Female Fertility in Fall River
Fertility by Age in Fall River
Average fertility rate in Fall River is 51.0 births per 1,000 women. Women in the age bracket of 20 to 34 years have the highest fertility rate with 106.0 births per 1,000 women. Women in the age bracket of 20 to 34 years acount for 65.0% of all women with births.
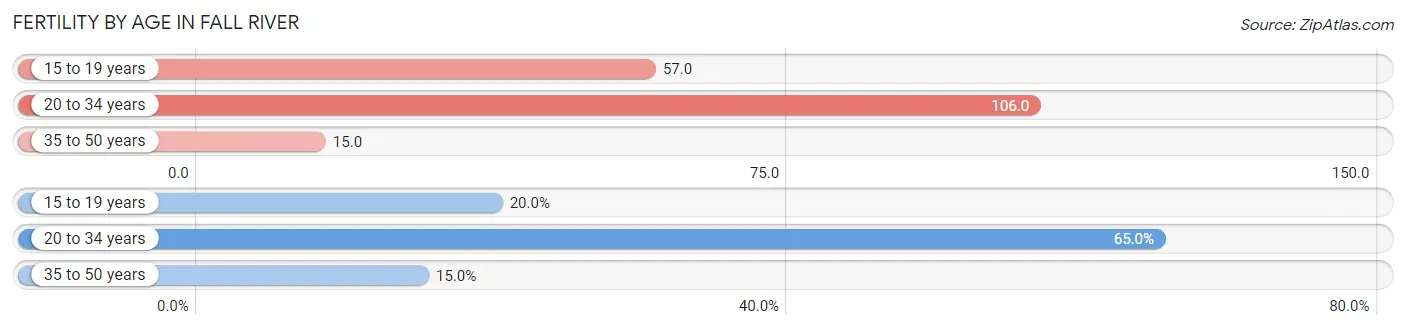
| Age Bracket | Women with Births | Births / 1,000 Women |
| 15 to 19 years | 4 (20.0%) | 57.0 |
| 20 to 34 years | 13 (65.0%) | 106.0 |
| 35 to 50 years | 3 (15.0%) | 15.0 |
| Total | 20 (100.0%) | 51.0 |
Fertility by Age by Marriage Status in Fall River
65.0% of women with births (20) in Fall River are married. The highest percentage of unmarried women with births falls into 15 to 19 years age bracket with 100.0% of them unmarried at the time of birth, while the lowest percentage of unmarried women with births belong to 35 to 50 years age bracket with 0.0% of them unmarried.
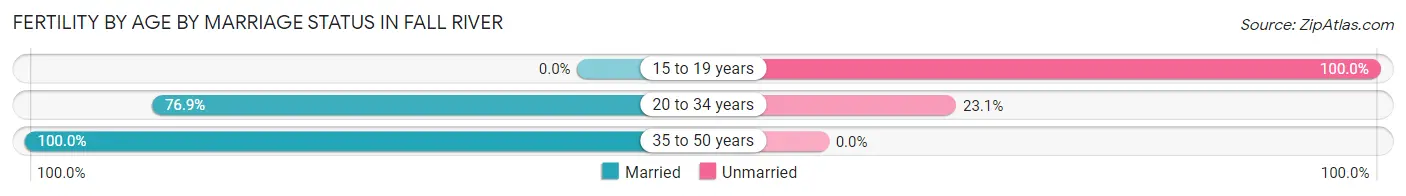
| Age Bracket | Married | Unmarried |
| 15 to 19 years | 0 (0.0%) | 4 (100.0%) |
| 20 to 34 years | 10 (76.9%) | 3 (23.1%) |
| 35 to 50 years | 3 (100.0%) | 0 (0.0%) |
| Total | 13 (65.0%) | 7 (35.0%) |
Fertility by Education in Fall River
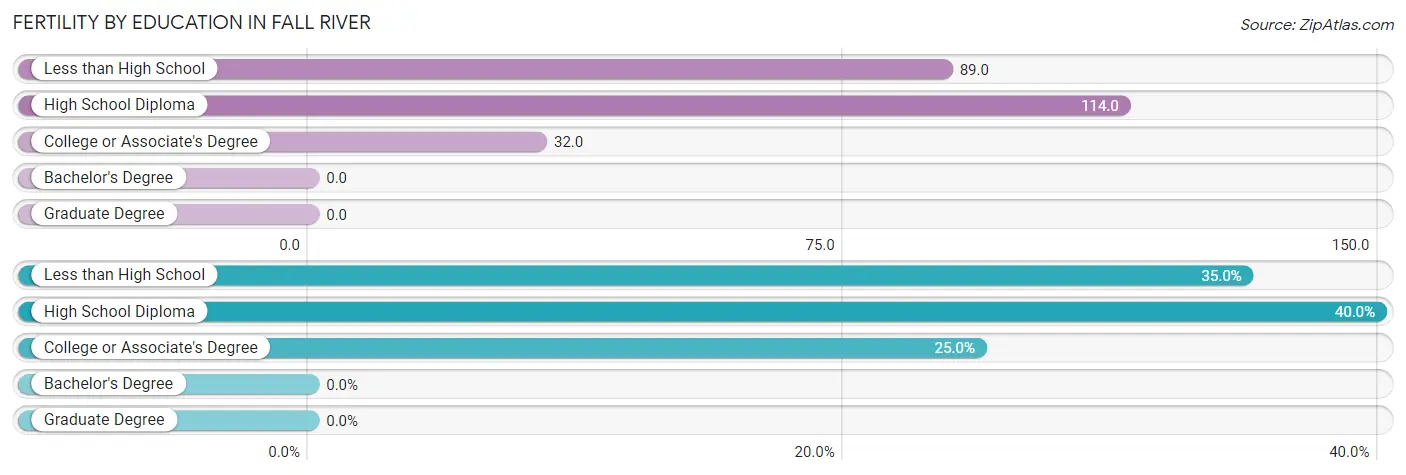
| Educational Attainment | Women with Births | Births / 1,000 Women |
| Less than High School | 7 (35.0%) | 89.0 |
| High School Diploma | 8 (40.0%) | 114.0 |
| College or Associate's Degree | 5 (25.0%) | 32.0 |
| Bachelor's Degree | 0 (0.0%) | 0.0 |
| Graduate Degree | 0 (0.0%) | 0.0 |
| Total | 20 (100.0%) | 51.0 |
Fertility by Education by Marriage Status in Fall River
35.0% of women with births in Fall River are unmarried. Women with the educational attainment of college or associate's degree are most likely to be married with 100.0% of them married at childbirth, while women with the educational attainment of less than high school are least likely to be married with 57.1% of them unmarried at childbirth.
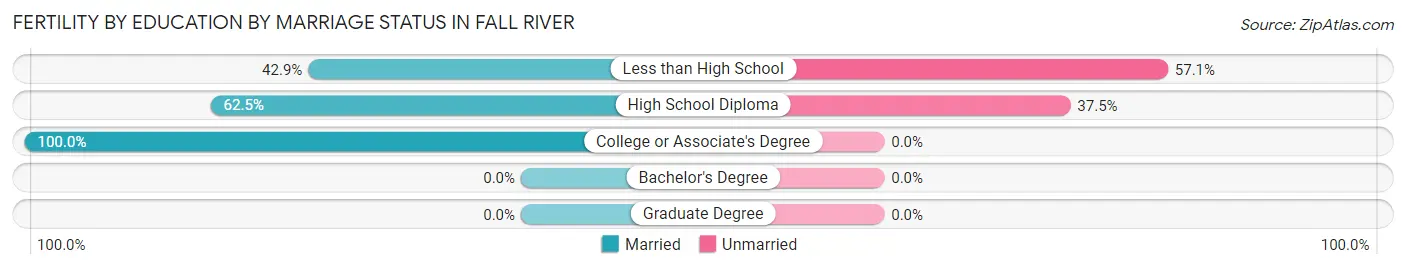
| Educational Attainment | Married | Unmarried |
| Less than High School | 3 (42.9%) | 4 (57.1%) |
| High School Diploma | 5 (62.5%) | 3 (37.5%) |
| College or Associate's Degree | 5 (100.0%) | 0 (0.0%) |
| Bachelor's Degree | 0 (0.0%) | 0 (0.0%) |
| Graduate Degree | 0 (0.0%) | 0 (0.0%) |
| Total | 13 (65.0%) | 7 (35.0%) |
Employment Characteristics in Fall River
Employment by Class of Employer in Fall River
Among the 896 employed individuals in Fall River, private company employees (617 | 68.9%), not-for-profit organizations (80 | 8.9%), and local government employees (57 | 6.4%) make up the most common classes of employment.
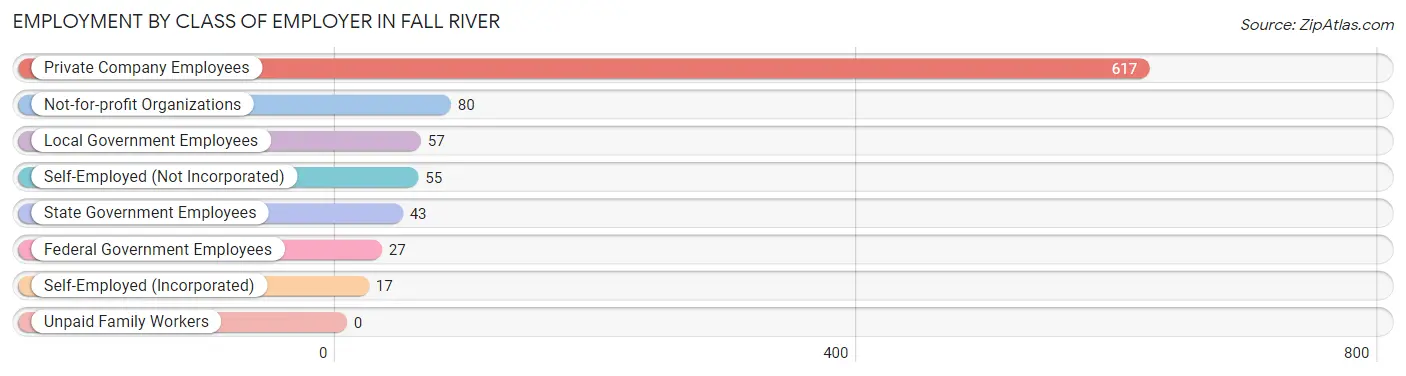
| Employer Class | # Employees | % Employees |
| Private Company Employees | 617 | 68.9% |
| Self-Employed (Incorporated) | 17 | 1.9% |
| Self-Employed (Not Incorporated) | 55 | 6.1% |
| Not-for-profit Organizations | 80 | 8.9% |
| Local Government Employees | 57 | 6.4% |
| State Government Employees | 43 | 4.8% |
| Federal Government Employees | 27 | 3.0% |
| Unpaid Family Workers | 0 | 0.0% |
| Total | 896 | 100.0% |
Employment Status by Age in Fall River
According to the labor force statistics for Fall River, out of the total population over 16 years of age (1,239), 75.6% or 937 individuals are in the labor force, with 3.0% or 28 of them unemployed. The age group with the highest labor force participation rate is 25 to 29 years, with 94.0% or 63 individuals in the labor force. Within the labor force, the 20 to 24 years age range has the highest percentage of unemployed individuals, with 16.0% or 8 of them being unemployed.
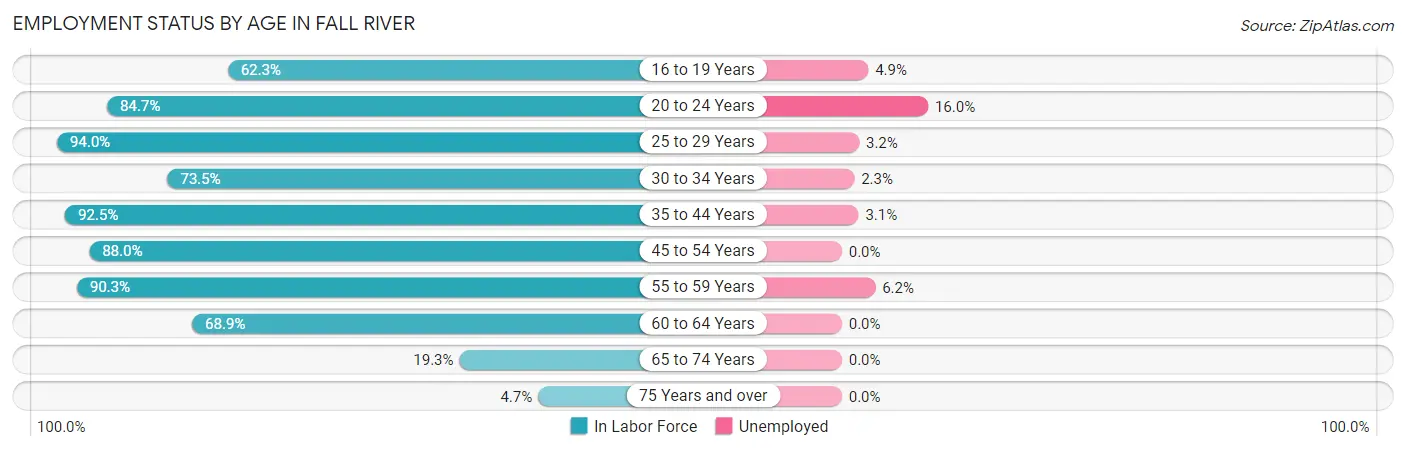
| Age Bracket | In Labor Force | Unemployed |
| 16 to 19 Years | 81 (62.3%) | 4 (4.9%) |
| 20 to 24 Years | 50 (84.7%) | 8 (16.0%) |
| 25 to 29 Years | 63 (94.0%) | 2 (3.2%) |
| 30 to 34 Years | 86 (73.5%) | 2 (2.3%) |
| 35 to 44 Years | 270 (92.5%) | 8 (3.1%) |
| 45 to 54 Years | 219 (88.0%) | 0 (0.0%) |
| 55 to 59 Years | 65 (90.3%) | 4 (6.2%) |
| 60 to 64 Years | 84 (68.9%) | 0 (0.0%) |
| 65 to 74 Years | 17 (19.3%) | 0 (0.0%) |
| 75 Years and over | 2 (4.7%) | 0 (0.0%) |
| Total | 937 (75.6%) | 28 (3.0%) |
Employment Status by Educational Attainment in Fall River
According to labor force statistics for Fall River, 85.6% of individuals (787) out of the total population between 25 and 64 years of age (919) are in the labor force, with 2.1% or 17 of them being unemployed. The group with the highest labor force participation rate are those with the educational attainment of college / associate degree, with 91.9% or 282 individuals in the labor force. Within the labor force, individuals with bachelor's degree or higher education have the highest percentage of unemployment, with 5.4% or 13 of them being unemployed.
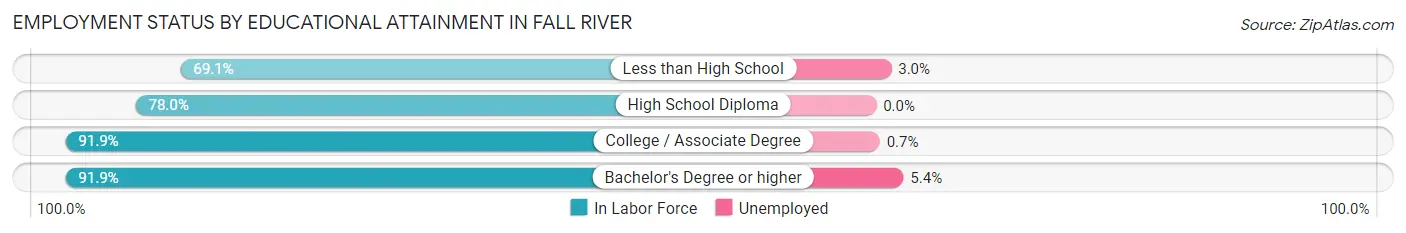
| Educational Attainment | In Labor Force | Unemployed |
| Less than High School | 67 (69.1%) | 3 (3.0%) |
| High School Diploma | 199 (78.0%) | 0 (0.0%) |
| College / Associate Degree | 282 (91.9%) | 2 (0.7%) |
| Bachelor's Degree or higher | 239 (91.9%) | 14 (5.4%) |
| Total | 787 (85.6%) | 19 (2.1%) |
Employment Occupations by Sex in Fall River
Management, Business, Science and Arts Occupations
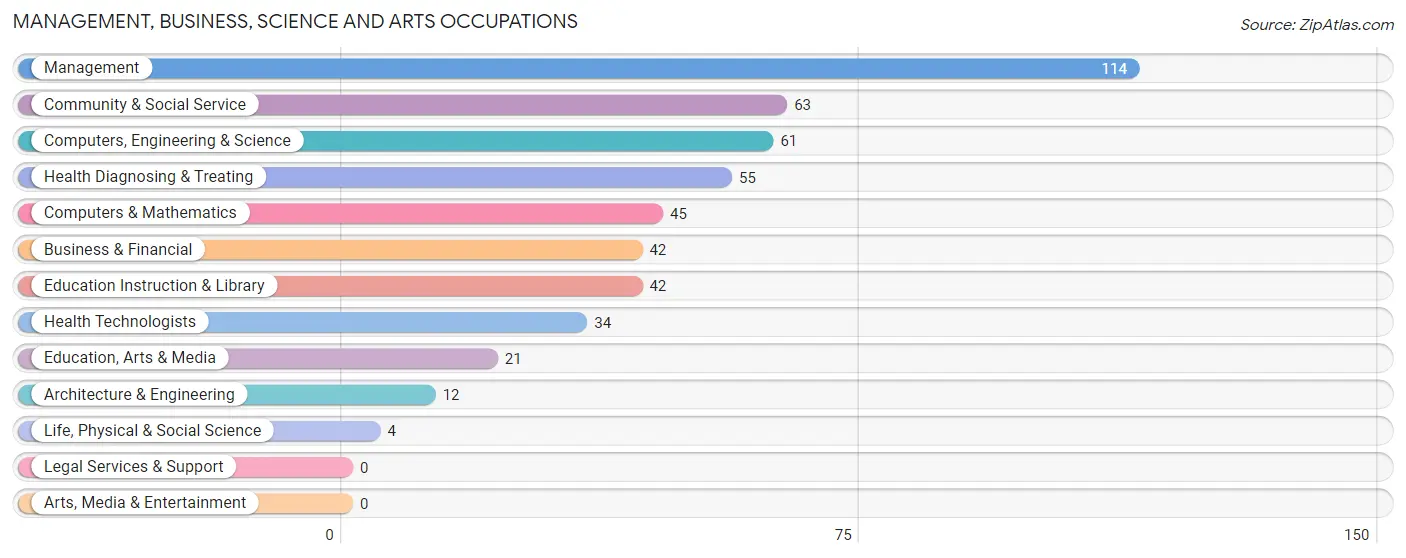
The most common Management, Business, Science and Arts occupations in Fall River are Management (114 | 12.8%), Community & Social Service (63 | 7.0%), Computers, Engineering & Science (61 | 6.8%), Health Diagnosing & Treating (55 | 6.2%), and Computers & Mathematics (45 | 5.0%).
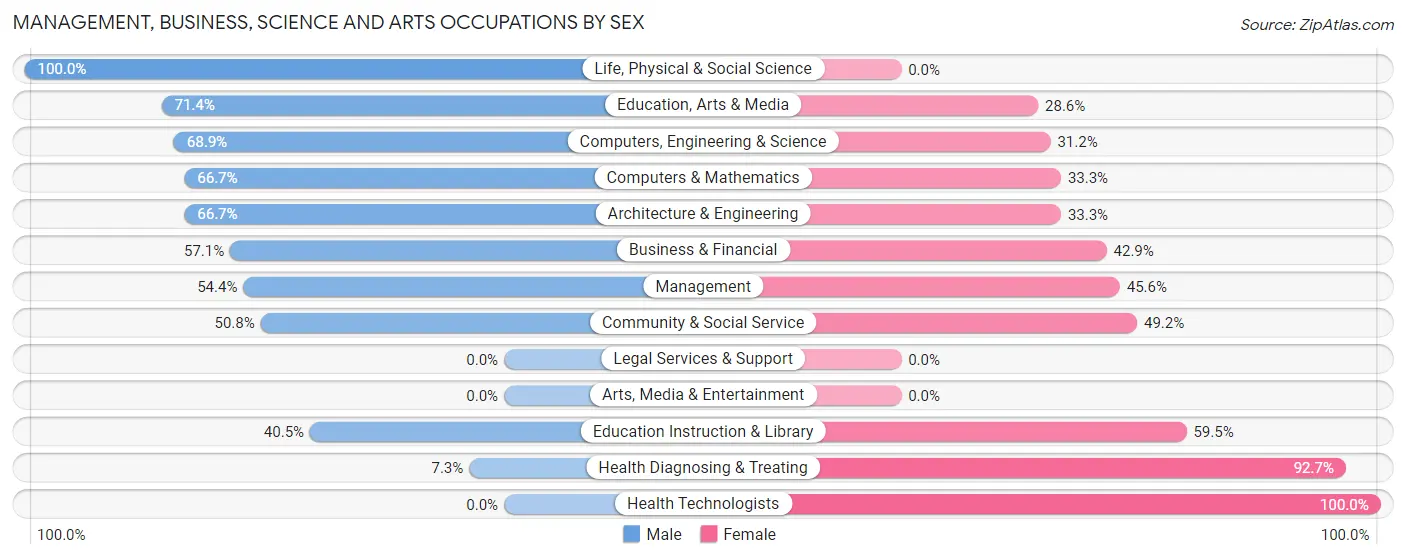
Management, Business, Science and Arts Occupations by Sex
Within the Management, Business, Science and Arts occupations in Fall River, the most male-oriented occupations are Life, Physical & Social Science (100.0%), Education, Arts & Media (71.4%), and Computers, Engineering & Science (68.9%), while the most female-oriented occupations are Health Technologists (100.0%), Health Diagnosing & Treating (92.7%), and Education Instruction & Library (59.5%).
| Occupation | Male | Female |
| Management | 62 (54.4%) | 52 (45.6%) |
| Business & Financial | 24 (57.1%) | 18 (42.9%) |
| Computers, Engineering & Science | 42 (68.9%) | 19 (31.1%) |
| Computers & Mathematics | 30 (66.7%) | 15 (33.3%) |
| Architecture & Engineering | 8 (66.7%) | 4 (33.3%) |
| Life, Physical & Social Science | 4 (100.0%) | 0 (0.0%) |
| Community & Social Service | 32 (50.8%) | 31 (49.2%) |
| Education, Arts & Media | 15 (71.4%) | 6 (28.6%) |
| Legal Services & Support | 0 (0.0%) | 0 (0.0%) |
| Education Instruction & Library | 17 (40.5%) | 25 (59.5%) |
| Arts, Media & Entertainment | 0 (0.0%) | 0 (0.0%) |
| Health Diagnosing & Treating | 4 (7.3%) | 51 (92.7%) |
| Health Technologists | 0 (0.0%) | 34 (100.0%) |
| Total (Category) | 164 (49.0%) | 171 (51.0%) |
| Total (Overall) | 460 (51.5%) | 433 (48.5%) |
Services Occupations
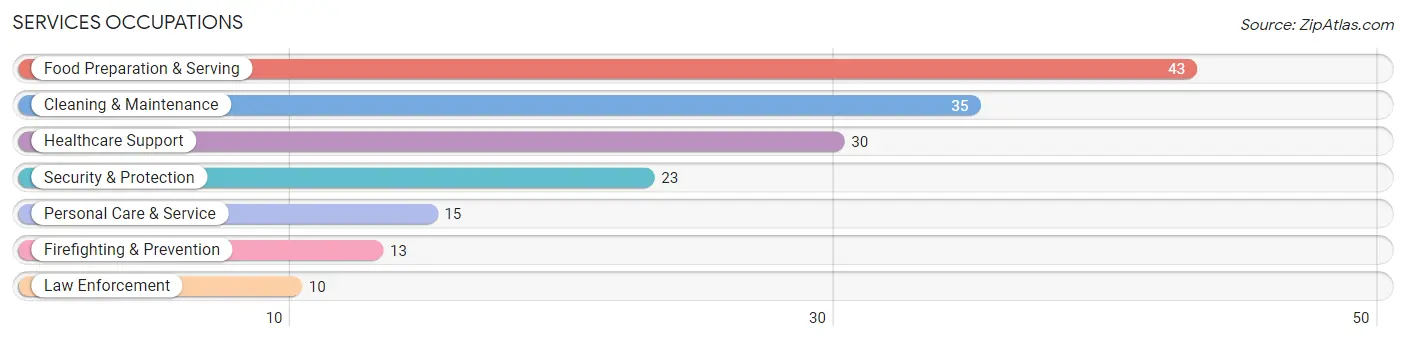
The most common Services occupations in Fall River are Food Preparation & Serving (43 | 4.8%), Cleaning & Maintenance (35 | 3.9%), Healthcare Support (30 | 3.4%), Security & Protection (23 | 2.6%), and Personal Care & Service (15 | 1.7%).
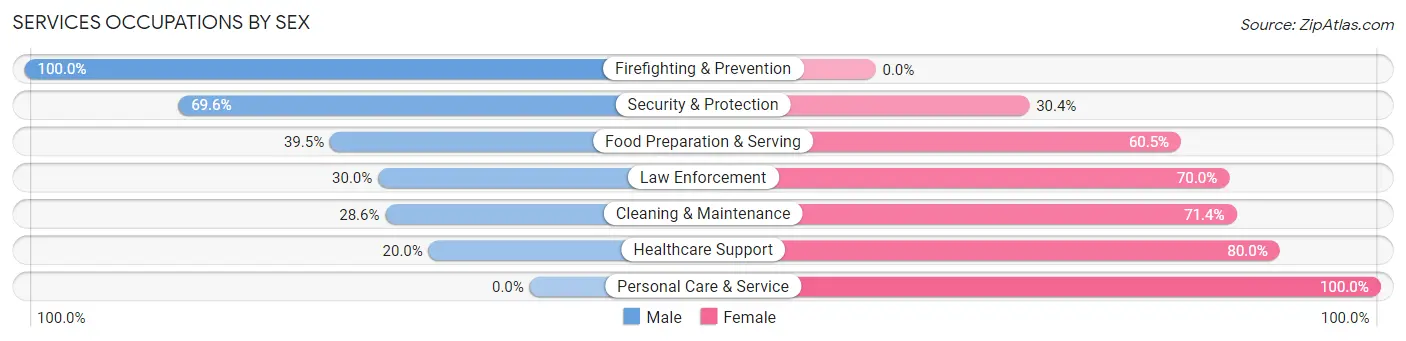
Services Occupations by Sex
Within the Services occupations in Fall River, the most male-oriented occupations are Firefighting & Prevention (100.0%), Security & Protection (69.6%), and Food Preparation & Serving (39.5%), while the most female-oriented occupations are Personal Care & Service (100.0%), Healthcare Support (80.0%), and Cleaning & Maintenance (71.4%).
| Occupation | Male | Female |
| Healthcare Support | 6 (20.0%) | 24 (80.0%) |
| Security & Protection | 16 (69.6%) | 7 (30.4%) |
| Firefighting & Prevention | 13 (100.0%) | 0 (0.0%) |
| Law Enforcement | 3 (30.0%) | 7 (70.0%) |
| Food Preparation & Serving | 17 (39.5%) | 26 (60.5%) |
| Cleaning & Maintenance | 10 (28.6%) | 25 (71.4%) |
| Personal Care & Service | 0 (0.0%) | 15 (100.0%) |
| Total (Category) | 49 (33.6%) | 97 (66.4%) |
| Total (Overall) | 460 (51.5%) | 433 (48.5%) |
Sales and Office Occupations
The most common Sales and Office occupations in Fall River are Office & Administration (87 | 9.7%), and Sales & Related (65 | 7.3%).
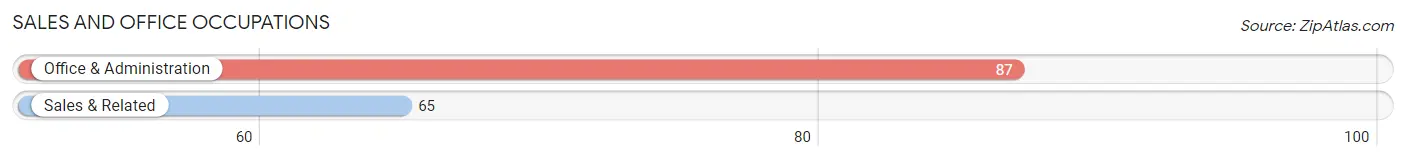
Sales and Office Occupations by Sex

| Occupation | Male | Female |
| Sales & Related | 30 (46.2%) | 35 (53.8%) |
| Office & Administration | 8 (9.2%) | 79 (90.8%) |
| Total (Category) | 38 (25.0%) | 114 (75.0%) |
| Total (Overall) | 460 (51.5%) | 433 (48.5%) |
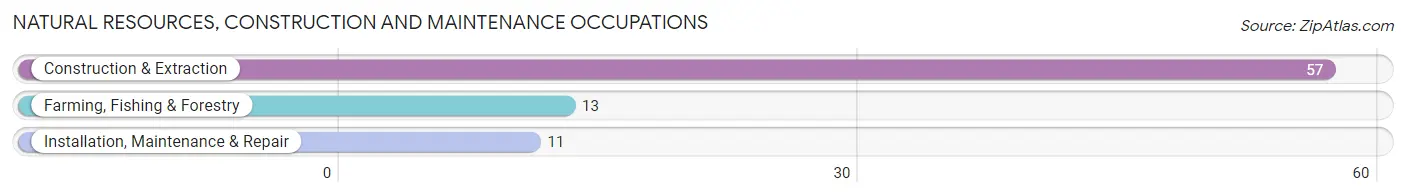
Natural Resources, Construction and Maintenance Occupations
The most common Natural Resources, Construction and Maintenance occupations in Fall River are Construction & Extraction (57 | 6.4%), Farming, Fishing & Forestry (13 | 1.5%), and Installation, Maintenance & Repair (11 | 1.2%).
Natural Resources, Construction and Maintenance Occupations by Sex
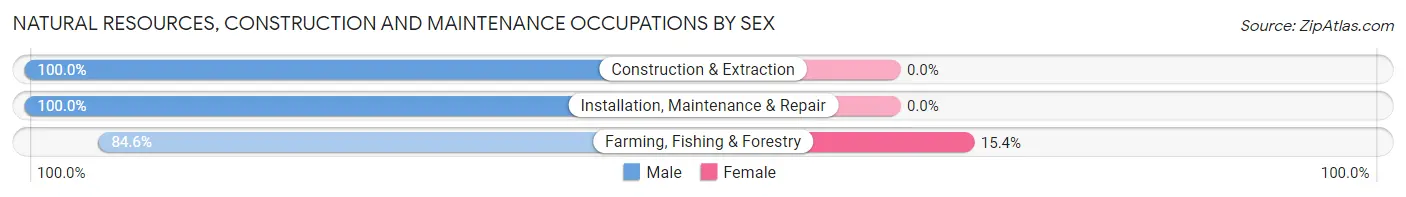
| Occupation | Male | Female |
| Farming, Fishing & Forestry | 11 (84.6%) | 2 (15.4%) |
| Construction & Extraction | 57 (100.0%) | 0 (0.0%) |
| Installation, Maintenance & Repair | 11 (100.0%) | 0 (0.0%) |
| Total (Category) | 79 (97.5%) | 2 (2.5%) |
| Total (Overall) | 460 (51.5%) | 433 (48.5%) |
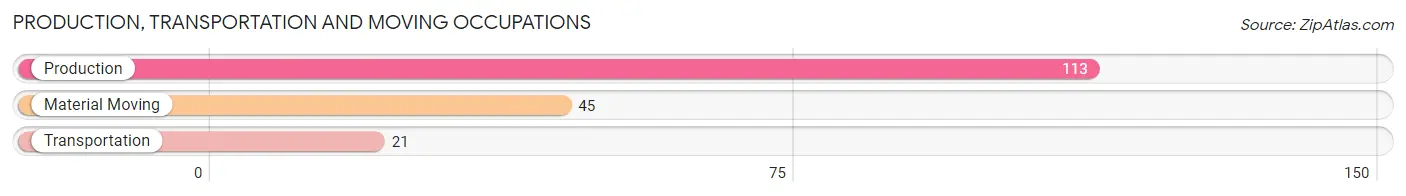
Production, Transportation and Moving Occupations
The most common Production, Transportation and Moving occupations in Fall River are Production (113 | 12.7%), Material Moving (45 | 5.0%), and Transportation (21 | 2.4%).
Production, Transportation and Moving Occupations by Sex
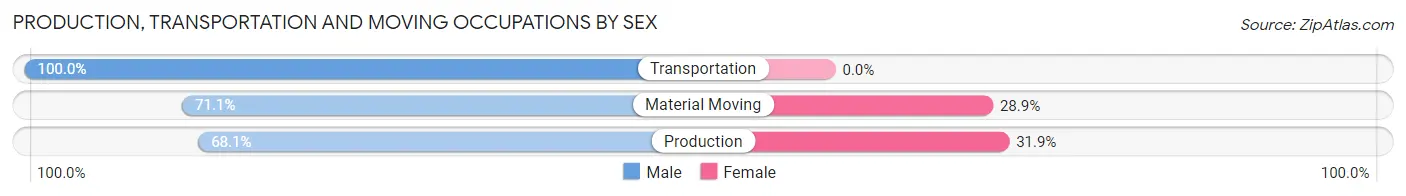
| Occupation | Male | Female |
| Production | 77 (68.1%) | 36 (31.9%) |
| Transportation | 21 (100.0%) | 0 (0.0%) |
| Material Moving | 32 (71.1%) | 13 (28.9%) |
| Total (Category) | 130 (72.6%) | 49 (27.4%) |
| Total (Overall) | 460 (51.5%) | 433 (48.5%) |
Employment Industries by Sex in Fall River
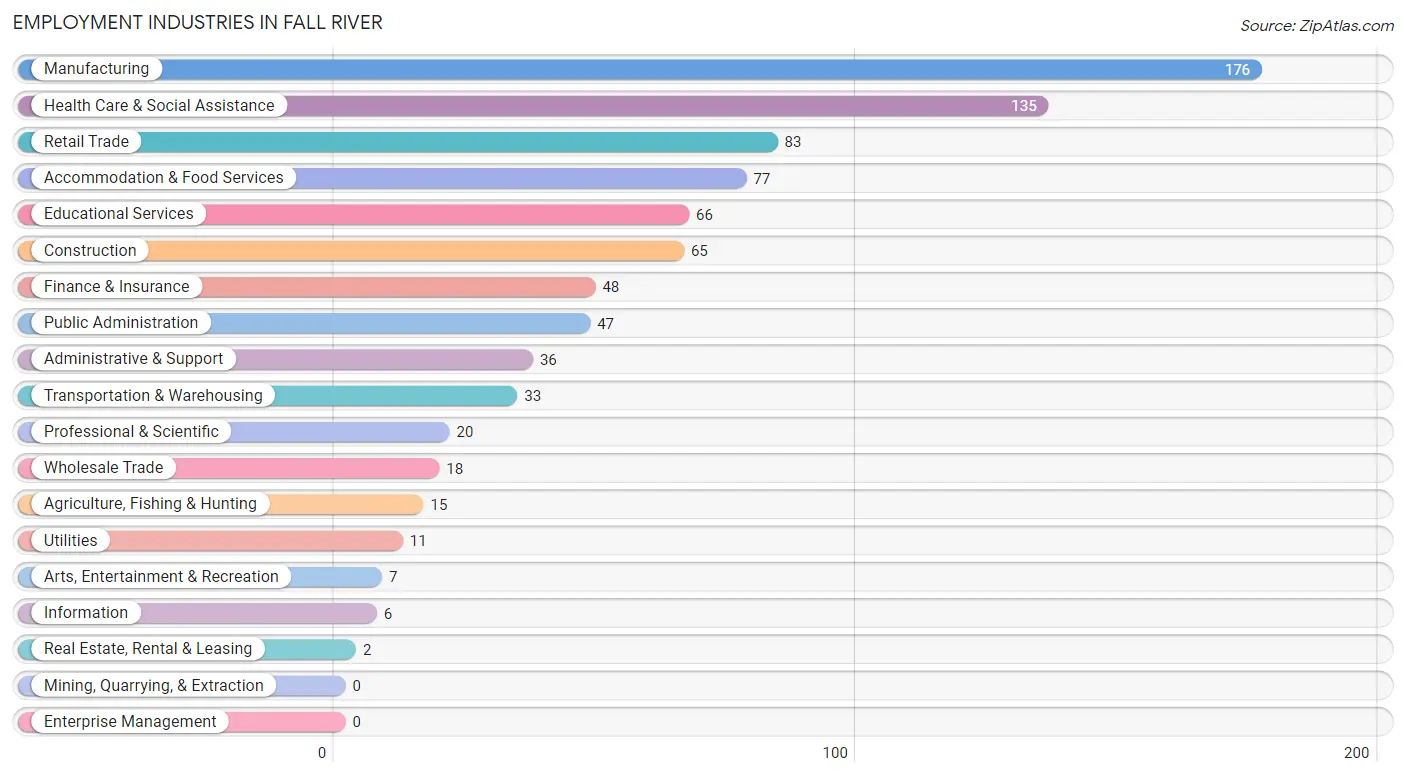
Employment Industries in Fall River
The major employment industries in Fall River include Manufacturing (176 | 19.7%), Health Care & Social Assistance (135 | 15.1%), Retail Trade (83 | 9.3%), Accommodation & Food Services (77 | 8.6%), and Educational Services (66 | 7.4%).
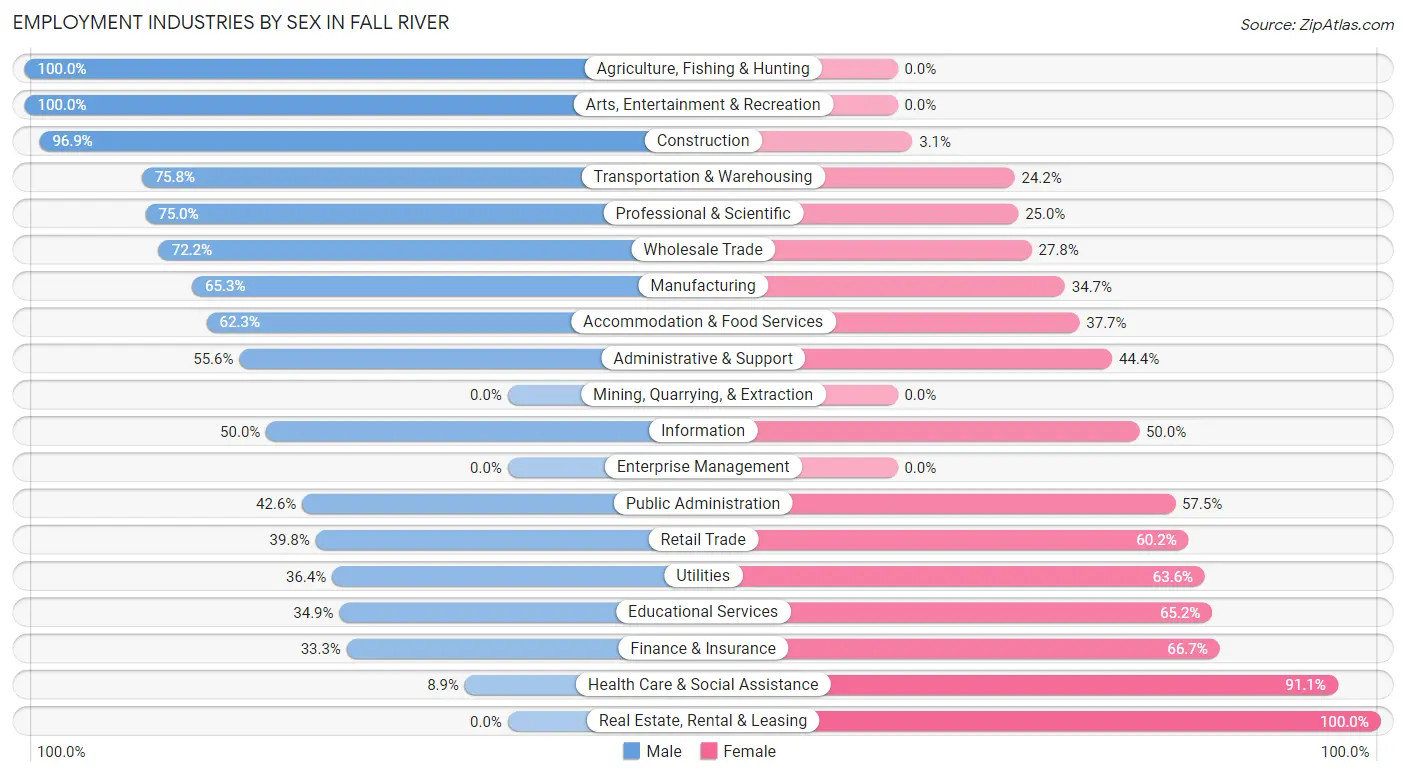
Employment Industries by Sex in Fall River
The Fall River industries that see more men than women are Agriculture, Fishing & Hunting (100.0%), Arts, Entertainment & Recreation (100.0%), and Construction (96.9%), whereas the industries that tend to have a higher number of women are Real Estate, Rental & Leasing (100.0%), Health Care & Social Assistance (91.1%), and Finance & Insurance (66.7%).
| Industry | Male | Female |
| Agriculture, Fishing & Hunting | 15 (100.0%) | 0 (0.0%) |
| Mining, Quarrying, & Extraction | 0 (0.0%) | 0 (0.0%) |
| Construction | 63 (96.9%) | 2 (3.1%) |
| Manufacturing | 115 (65.3%) | 61 (34.7%) |
| Wholesale Trade | 13 (72.2%) | 5 (27.8%) |
| Retail Trade | 33 (39.8%) | 50 (60.2%) |
| Transportation & Warehousing | 25 (75.8%) | 8 (24.2%) |
| Utilities | 4 (36.4%) | 7 (63.6%) |
| Information | 3 (50.0%) | 3 (50.0%) |
| Finance & Insurance | 16 (33.3%) | 32 (66.7%) |
| Real Estate, Rental & Leasing | 0 (0.0%) | 2 (100.0%) |
| Professional & Scientific | 15 (75.0%) | 5 (25.0%) |
| Enterprise Management | 0 (0.0%) | 0 (0.0%) |
| Administrative & Support | 20 (55.6%) | 16 (44.4%) |
| Educational Services | 23 (34.8%) | 43 (65.1%) |
| Health Care & Social Assistance | 12 (8.9%) | 123 (91.1%) |
| Arts, Entertainment & Recreation | 7 (100.0%) | 0 (0.0%) |
| Accommodation & Food Services | 48 (62.3%) | 29 (37.7%) |
| Public Administration | 20 (42.5%) | 27 (57.5%) |
| Total | 460 (51.5%) | 433 (48.5%) |
Education in Fall River
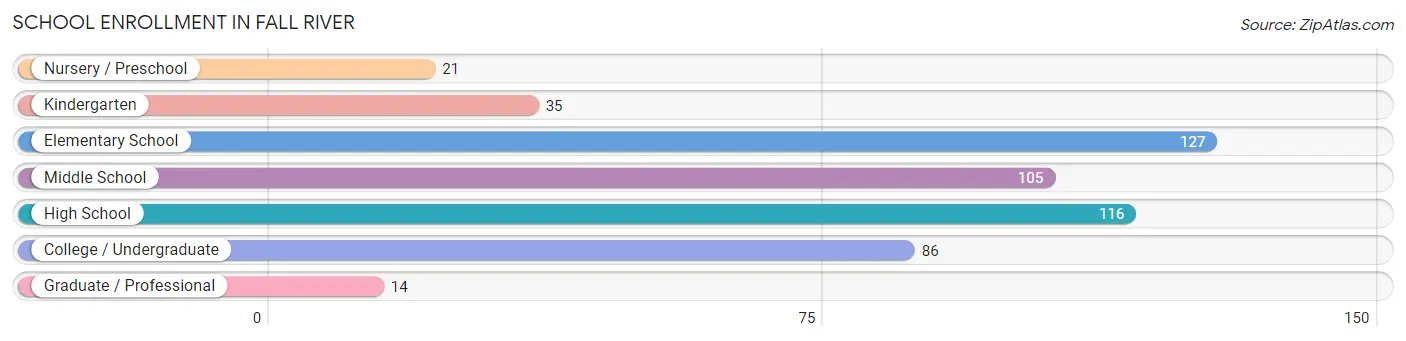
School Enrollment in Fall River
The most common levels of schooling among the 504 students in Fall River are elementary school (127 | 25.2%), high school (116 | 23.0%), and middle school (105 | 20.8%).
| School Level | # Students | % Students |
| Nursery / Preschool | 21 | 4.2% |
| Kindergarten | 35 | 6.9% |
| Elementary School | 127 | 25.2% |
| Middle School | 105 | 20.8% |
| High School | 116 | 23.0% |
| College / Undergraduate | 86 | 17.1% |
| Graduate / Professional | 14 | 2.8% |
| Total | 504 | 100.0% |
School Enrollment by Age by Funding Source in Fall River
Out of a total of 504 students who are enrolled in schools in Fall River, 51 (10.1%) attend a private institution, while the remaining 453 (89.9%) are enrolled in public schools. The age group of 10 to 14 year olds has the highest likelihood of being enrolled in private schools, with 31 (20.9% in the age bracket) enrolled. Conversely, the age group of 18 to 19 year olds has the lowest likelihood of being enrolled in a private school, with 42 (100.0% in the age bracket) attending a public institution.
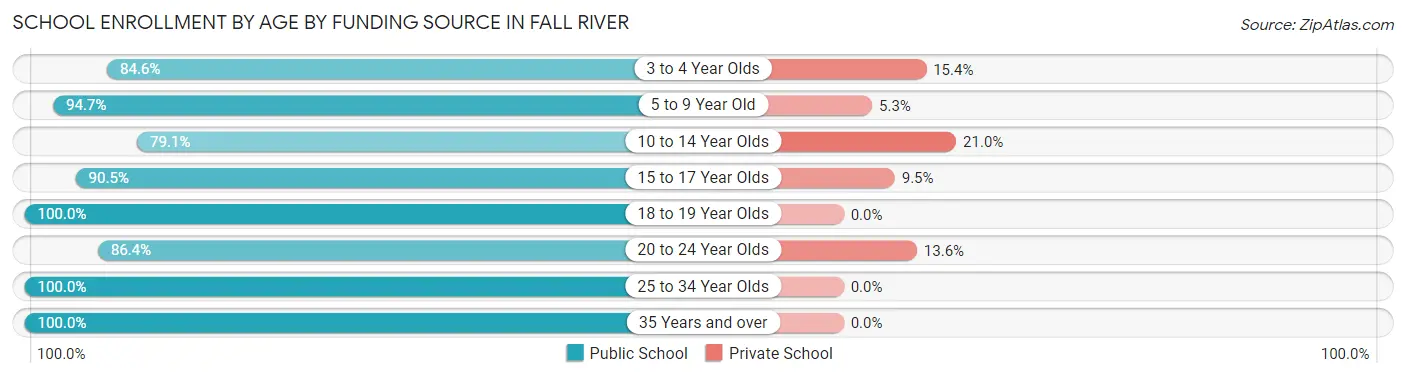
| Age Bracket | Public School | Private School |
| 3 to 4 Year Olds | 11 (84.6%) | 2 (15.4%) |
| 5 to 9 Year Old | 125 (94.7%) | 7 (5.3%) |
| 10 to 14 Year Olds | 117 (79.0%) | 31 (20.9%) |
| 15 to 17 Year Olds | 76 (90.5%) | 8 (9.5%) |
| 18 to 19 Year Olds | 42 (100.0%) | 0 (0.0%) |
| 20 to 24 Year Olds | 19 (86.4%) | 3 (13.6%) |
| 25 to 34 Year Olds | 24 (100.0%) | 0 (0.0%) |
| 35 Years and over | 39 (100.0%) | 0 (0.0%) |
| Total | 453 (89.9%) | 51 (10.1%) |
Educational Attainment by Field of Study in Fall River
Business (122 | 37.3%), education (52 | 15.9%), science & technology (28 | 8.6%), bio, nature & agricultural (27 | 8.3%), and arts & humanities (23 | 7.0%) are the most common fields of study among 327 individuals in Fall River who have obtained a bachelor's degree or higher.
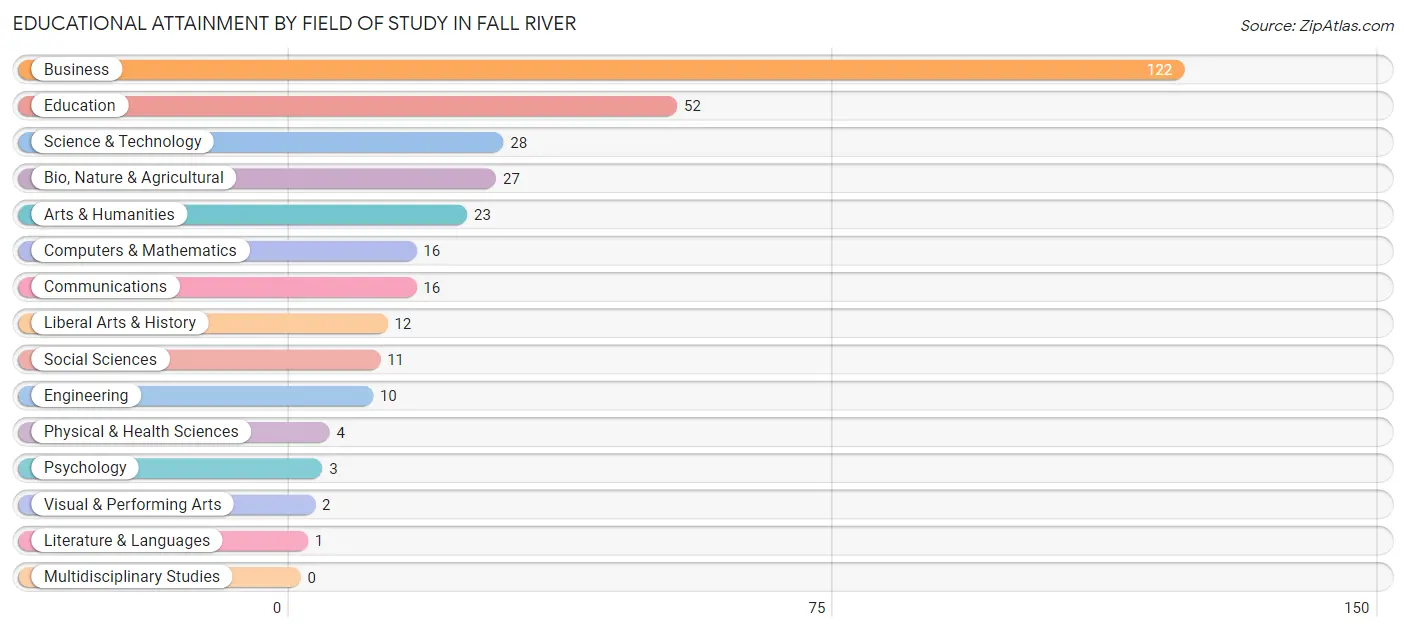
| Field of Study | # Graduates | % Graduates |
| Computers & Mathematics | 16 | 4.9% |
| Bio, Nature & Agricultural | 27 | 8.3% |
| Physical & Health Sciences | 4 | 1.2% |
| Psychology | 3 | 0.9% |
| Social Sciences | 11 | 3.4% |
| Engineering | 10 | 3.1% |
| Multidisciplinary Studies | 0 | 0.0% |
| Science & Technology | 28 | 8.6% |
| Business | 122 | 37.3% |
| Education | 52 | 15.9% |
| Literature & Languages | 1 | 0.3% |
| Liberal Arts & History | 12 | 3.7% |
| Visual & Performing Arts | 2 | 0.6% |
| Communications | 16 | 4.9% |
| Arts & Humanities | 23 | 7.0% |
| Total | 327 | 100.0% |
Transportation & Commute in Fall River
Vehicle Availability by Sex in Fall River
The most prevalent vehicle ownership categories in Fall River are males with 2 vehicles (237, accounting for 50.4%) and females with 2 vehicles (244, making up 55.6%).
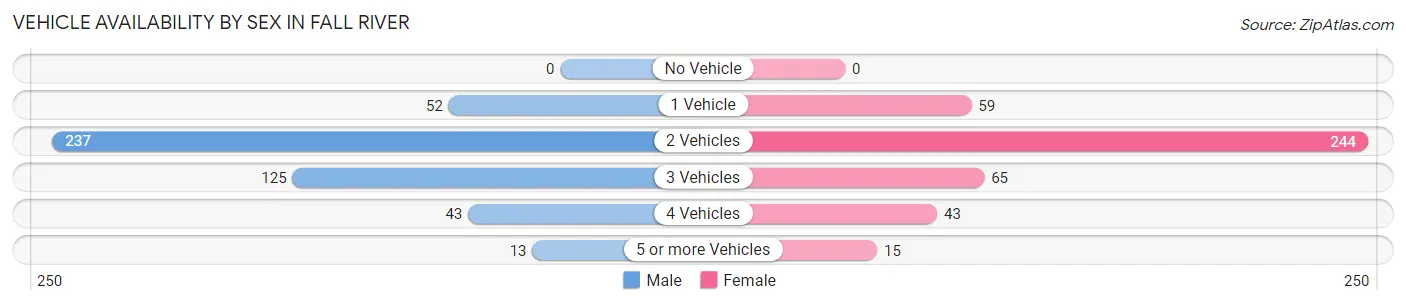
| Vehicles Available | Male | Female |
| No Vehicle | 0 (0.0%) | 0 (0.0%) |
| 1 Vehicle | 52 (11.1%) | 59 (13.9%) |
| 2 Vehicles | 237 (50.4%) | 244 (57.3%) |
| 3 Vehicles | 125 (26.6%) | 65 (15.3%) |
| 4 Vehicles | 43 (9.1%) | 43 (10.1%) |
| 5 or more Vehicles | 13 (2.8%) | 15 (3.5%) |
| Total | 470 (100.0%) | 426 (100.0%) |
Commute Time in Fall River
The most frequently occuring commute durations in Fall River are 5 to 9 minutes (148 commuters, 17.5%), 30 to 34 minutes (98 commuters, 11.6%), and 45 to 59 minutes (92 commuters, 10.9%).
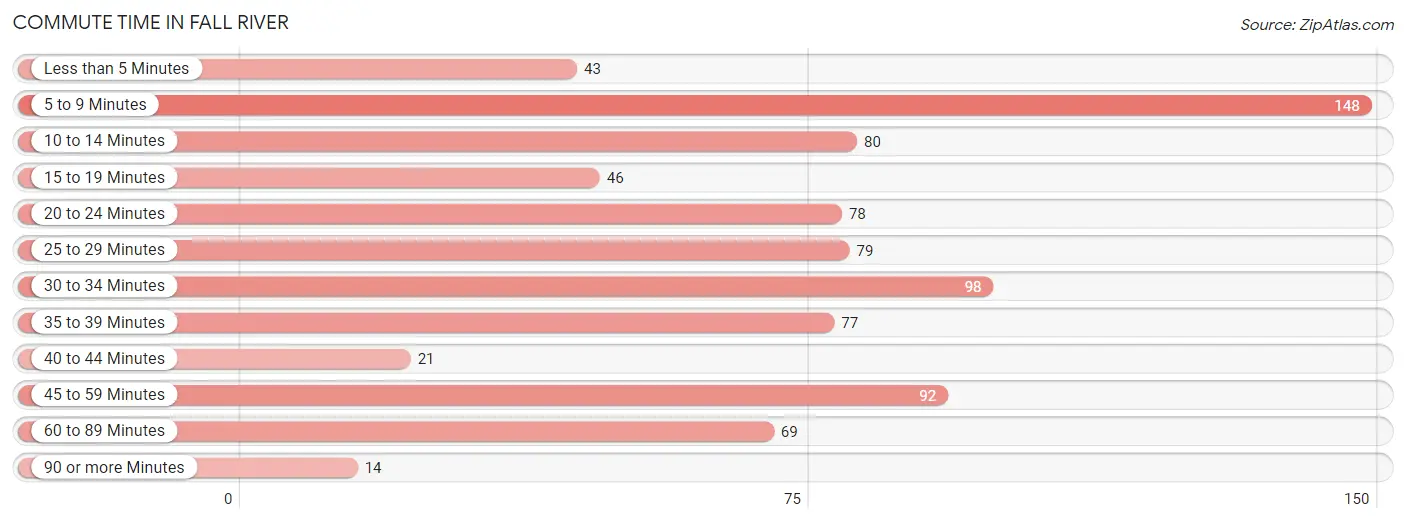
| Commute Time | # Commuters | % Commuters |
| Less than 5 Minutes | 43 | 5.1% |
| 5 to 9 Minutes | 148 | 17.5% |
| 10 to 14 Minutes | 80 | 9.5% |
| 15 to 19 Minutes | 46 | 5.4% |
| 20 to 24 Minutes | 78 | 9.2% |
| 25 to 29 Minutes | 79 | 9.3% |
| 30 to 34 Minutes | 98 | 11.6% |
| 35 to 39 Minutes | 77 | 9.1% |
| 40 to 44 Minutes | 21 | 2.5% |
| 45 to 59 Minutes | 92 | 10.9% |
| 60 to 89 Minutes | 69 | 8.2% |
| 90 or more Minutes | 14 | 1.7% |
Commute Time by Sex in Fall River
The most common commute times in Fall River are 5 to 9 minutes (95 commuters, 21.5%) for males and 5 to 9 minutes (53 commuters, 13.2%) for females.
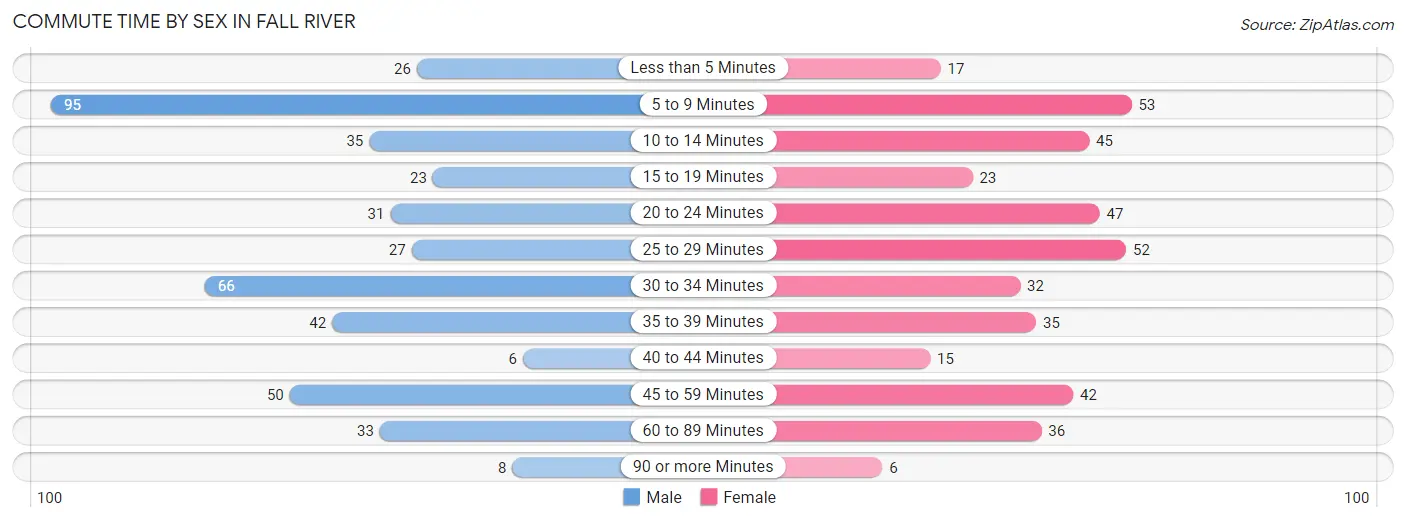
| Commute Time | Male | Female |
| Less than 5 Minutes | 26 (5.9%) | 17 (4.2%) |
| 5 to 9 Minutes | 95 (21.5%) | 53 (13.2%) |
| 10 to 14 Minutes | 35 (7.9%) | 45 (11.2%) |
| 15 to 19 Minutes | 23 (5.2%) | 23 (5.7%) |
| 20 to 24 Minutes | 31 (7.0%) | 47 (11.7%) |
| 25 to 29 Minutes | 27 (6.1%) | 52 (12.9%) |
| 30 to 34 Minutes | 66 (14.9%) | 32 (7.9%) |
| 35 to 39 Minutes | 42 (9.5%) | 35 (8.7%) |
| 40 to 44 Minutes | 6 (1.4%) | 15 (3.7%) |
| 45 to 59 Minutes | 50 (11.3%) | 42 (10.4%) |
| 60 to 89 Minutes | 33 (7.5%) | 36 (8.9%) |
| 90 or more Minutes | 8 (1.8%) | 6 (1.5%) |
Time of Departure to Work by Sex in Fall River
The most frequent times of departure to work in Fall River are 6:30 AM to 6:59 AM (68, 15.4%) for males and 7:30 AM to 7:59 AM (84, 20.8%) for females.
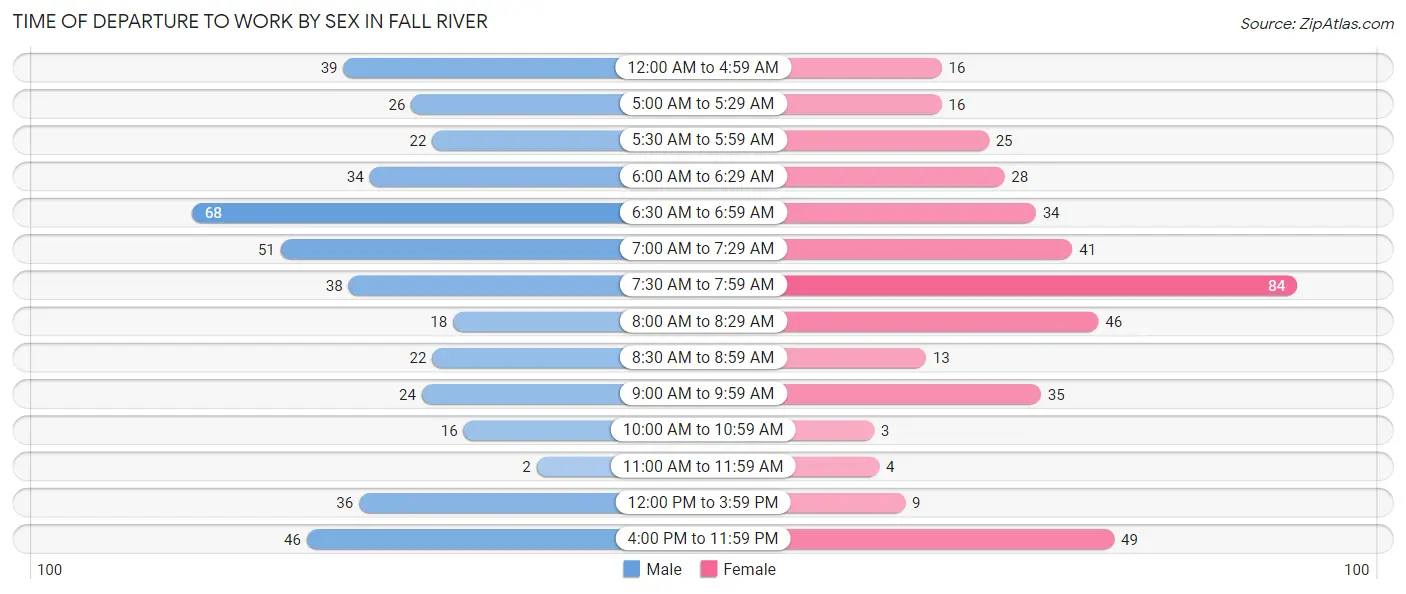
| Time of Departure | Male | Female |
| 12:00 AM to 4:59 AM | 39 (8.8%) | 16 (4.0%) |
| 5:00 AM to 5:29 AM | 26 (5.9%) | 16 (4.0%) |
| 5:30 AM to 5:59 AM | 22 (5.0%) | 25 (6.2%) |
| 6:00 AM to 6:29 AM | 34 (7.7%) | 28 (7.0%) |
| 6:30 AM to 6:59 AM | 68 (15.4%) | 34 (8.4%) |
| 7:00 AM to 7:29 AM | 51 (11.5%) | 41 (10.2%) |
| 7:30 AM to 7:59 AM | 38 (8.6%) | 84 (20.8%) |
| 8:00 AM to 8:29 AM | 18 (4.1%) | 46 (11.4%) |
| 8:30 AM to 8:59 AM | 22 (5.0%) | 13 (3.2%) |
| 9:00 AM to 9:59 AM | 24 (5.4%) | 35 (8.7%) |
| 10:00 AM to 10:59 AM | 16 (3.6%) | 3 (0.7%) |
| 11:00 AM to 11:59 AM | 2 (0.4%) | 4 (1.0%) |
| 12:00 PM to 3:59 PM | 36 (8.1%) | 9 (2.2%) |
| 4:00 PM to 11:59 PM | 46 (10.4%) | 49 (12.2%) |
| Total | 442 (100.0%) | 403 (100.0%) |
Housing Occupancy in Fall River
Occupancy by Ownership in Fall River
Of the total 618 dwellings in Fall River, owner-occupied units account for 411 (66.5%), while renter-occupied units make up 207 (33.5%).
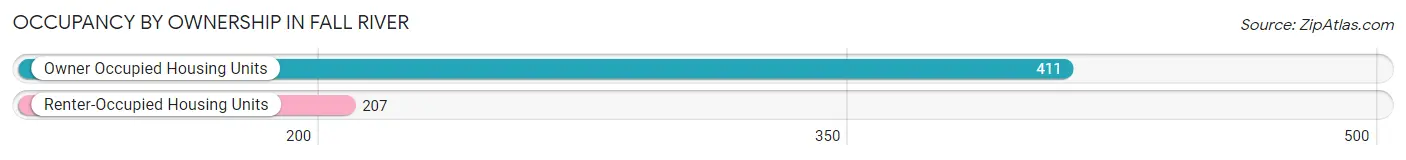
| Occupancy | # Housing Units | % Housing Units |
| Owner Occupied Housing Units | 411 | 66.5% |
| Renter-Occupied Housing Units | 207 | 33.5% |
| Total Occupied Housing Units | 618 | 100.0% |
Occupancy by Household Size in Fall River
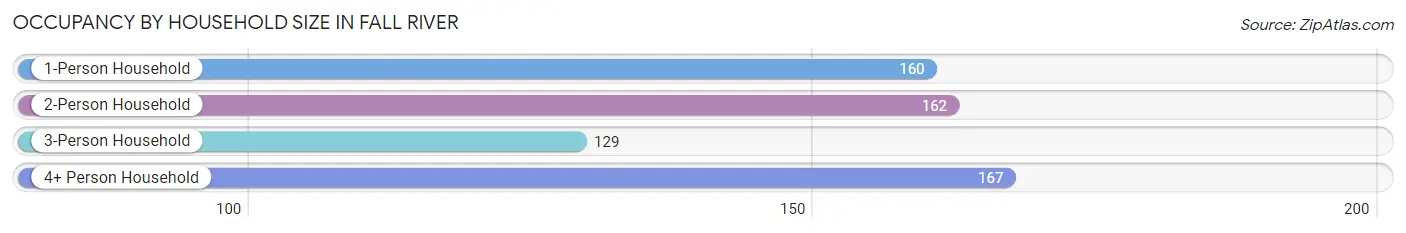
| Household Size | # Housing Units | % Housing Units |
| 1-Person Household | 160 | 25.9% |
| 2-Person Household | 162 | 26.2% |
| 3-Person Household | 129 | 20.9% |
| 4+ Person Household | 167 | 27.0% |
| Total Housing Units | 618 | 100.0% |
Occupancy by Ownership by Household Size in Fall River
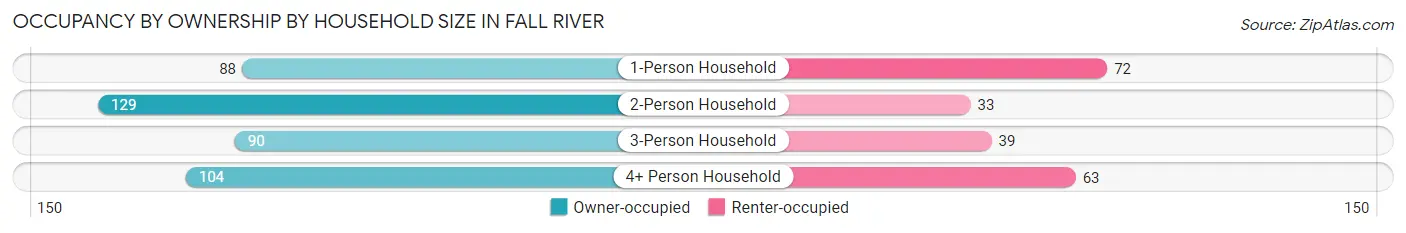
| Household Size | Owner-occupied | Renter-occupied |
| 1-Person Household | 88 (55.0%) | 72 (45.0%) |
| 2-Person Household | 129 (79.6%) | 33 (20.4%) |
| 3-Person Household | 90 (69.8%) | 39 (30.2%) |
| 4+ Person Household | 104 (62.3%) | 63 (37.7%) |
| Total Housing Units | 411 (66.5%) | 207 (33.5%) |
Occupancy by Educational Attainment in Fall River
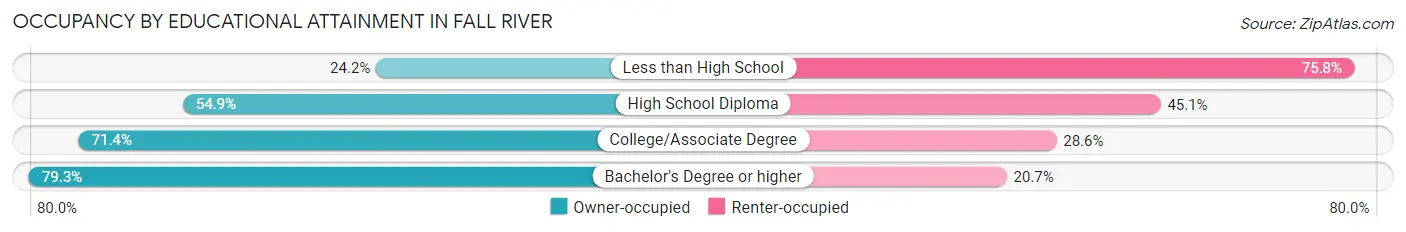
| Household Size | Owner-occupied | Renter-occupied |
| Less than High School | 8 (24.2%) | 25 (75.8%) |
| High School Diploma | 95 (54.9%) | 78 (45.1%) |
| College/Associate Degree | 170 (71.4%) | 68 (28.6%) |
| Bachelor's Degree or higher | 138 (79.3%) | 36 (20.7%) |
Occupancy by Age of Householder in Fall River
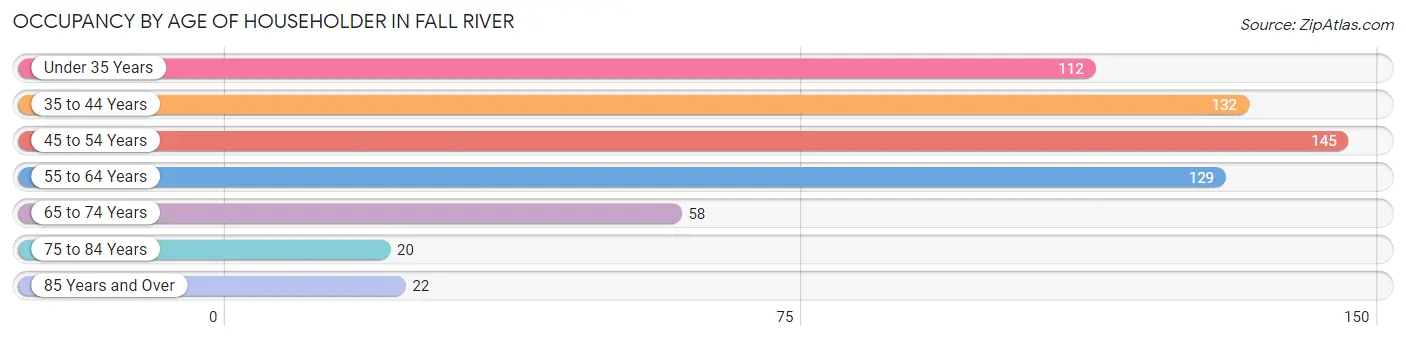
| Age Bracket | # Households | % Households |
| Under 35 Years | 112 | 18.1% |
| 35 to 44 Years | 132 | 21.4% |
| 45 to 54 Years | 145 | 23.5% |
| 55 to 64 Years | 129 | 20.9% |
| 65 to 74 Years | 58 | 9.4% |
| 75 to 84 Years | 20 | 3.2% |
| 85 Years and Over | 22 | 3.6% |
| Total | 618 | 100.0% |
Housing Finances in Fall River
Median Income by Occupancy in Fall River
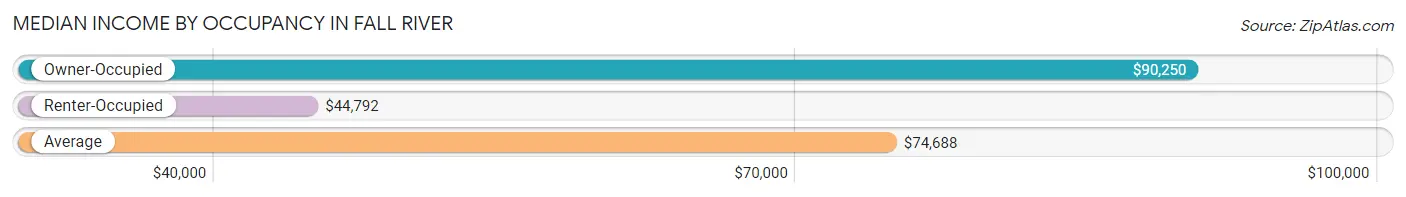
| Occupancy Type | # Households | Median Income |
| Owner-Occupied | 411 (66.5%) | $90,250 |
| Renter-Occupied | 207 (33.5%) | $44,792 |
| Average | 618 (100.0%) | $74,688 |
Occupancy by Householder Income Bracket in Fall River
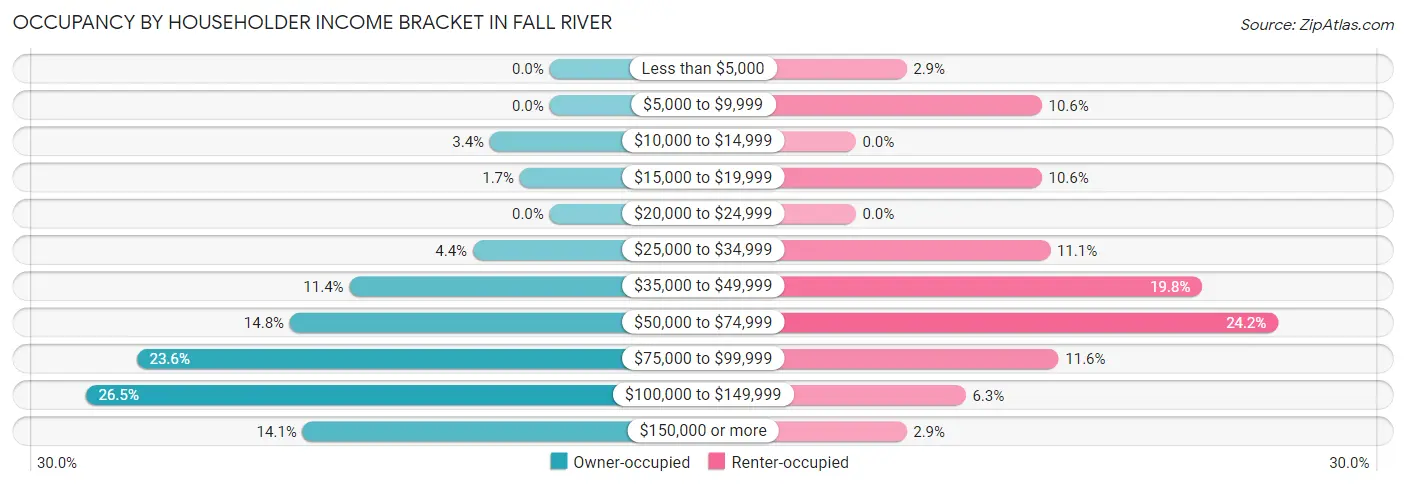
| Income Bracket | Owner-occupied | Renter-occupied |
| Less than $5,000 | 0 (0.0%) | 6 (2.9%) |
| $5,000 to $9,999 | 0 (0.0%) | 22 (10.6%) |
| $10,000 to $14,999 | 14 (3.4%) | 0 (0.0%) |
| $15,000 to $19,999 | 7 (1.7%) | 22 (10.6%) |
| $20,000 to $24,999 | 0 (0.0%) | 0 (0.0%) |
| $25,000 to $34,999 | 18 (4.4%) | 23 (11.1%) |
| $35,000 to $49,999 | 47 (11.4%) | 41 (19.8%) |
| $50,000 to $74,999 | 61 (14.8%) | 50 (24.1%) |
| $75,000 to $99,999 | 97 (23.6%) | 24 (11.6%) |
| $100,000 to $149,999 | 109 (26.5%) | 13 (6.3%) |
| $150,000 or more | 58 (14.1%) | 6 (2.9%) |
| Total | 411 (100.0%) | 207 (100.0%) |
Monthly Housing Cost Tiers in Fall River
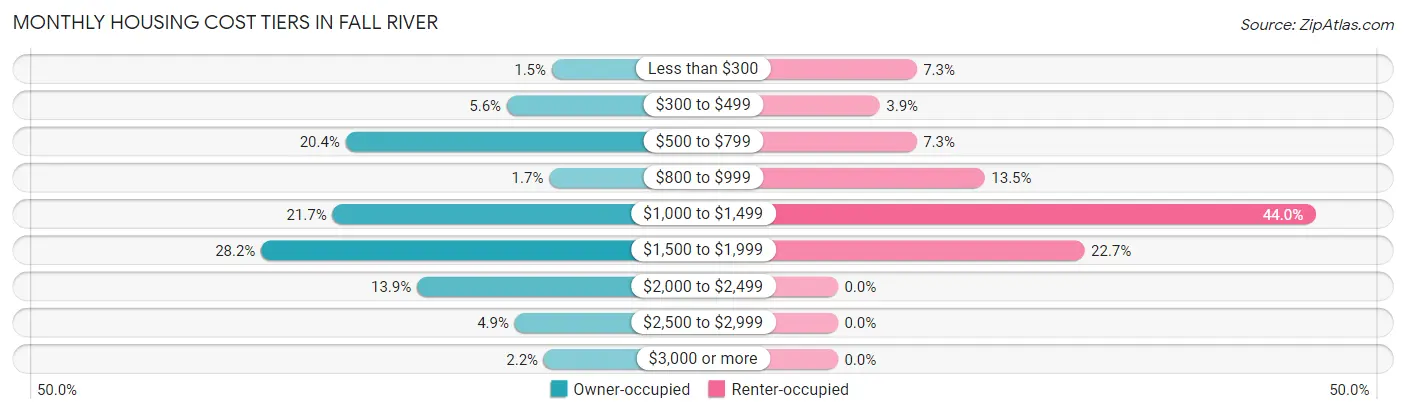
| Monthly Cost | Owner-occupied | Renter-occupied |
| Less than $300 | 6 (1.5%) | 15 (7.2%) |
| $300 to $499 | 23 (5.6%) | 8 (3.9%) |
| $500 to $799 | 84 (20.4%) | 15 (7.2%) |
| $800 to $999 | 7 (1.7%) | 28 (13.5%) |
| $1,000 to $1,499 | 89 (21.6%) | 91 (44.0%) |
| $1,500 to $1,999 | 116 (28.2%) | 47 (22.7%) |
| $2,000 to $2,499 | 57 (13.9%) | 0 (0.0%) |
| $2,500 to $2,999 | 20 (4.9%) | 0 (0.0%) |
| $3,000 or more | 9 (2.2%) | 0 (0.0%) |
| Total | 411 (100.0%) | 207 (100.0%) |
Physical Housing Characteristics in Fall River
Housing Structures in Fall River
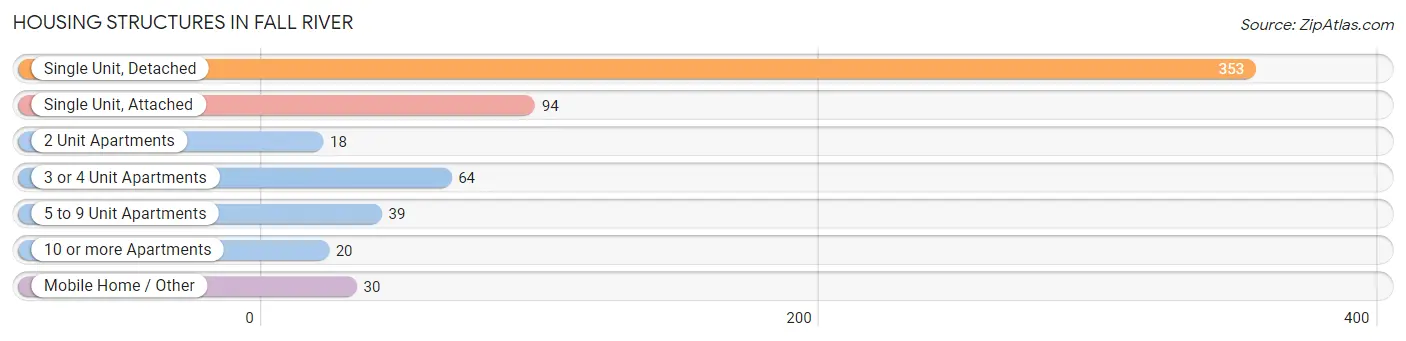
| Structure Type | # Housing Units | % Housing Units |
| Single Unit, Detached | 353 | 57.1% |
| Single Unit, Attached | 94 | 15.2% |
| 2 Unit Apartments | 18 | 2.9% |
| 3 or 4 Unit Apartments | 64 | 10.4% |
| 5 to 9 Unit Apartments | 39 | 6.3% |
| 10 or more Apartments | 20 | 3.2% |
| Mobile Home / Other | 30 | 4.9% |
| Total | 618 | 100.0% |
Housing Structures by Occupancy in Fall River
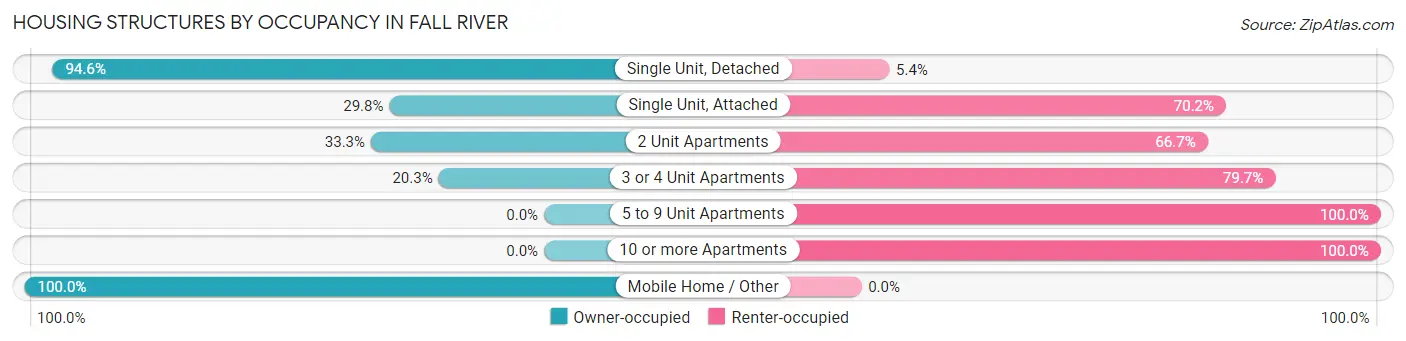
| Structure Type | Owner-occupied | Renter-occupied |
| Single Unit, Detached | 334 (94.6%) | 19 (5.4%) |
| Single Unit, Attached | 28 (29.8%) | 66 (70.2%) |
| 2 Unit Apartments | 6 (33.3%) | 12 (66.7%) |
| 3 or 4 Unit Apartments | 13 (20.3%) | 51 (79.7%) |
| 5 to 9 Unit Apartments | 0 (0.0%) | 39 (100.0%) |
| 10 or more Apartments | 0 (0.0%) | 20 (100.0%) |
| Mobile Home / Other | 30 (100.0%) | 0 (0.0%) |
| Total | 411 (66.5%) | 207 (33.5%) |
Housing Structures by Number of Rooms in Fall River
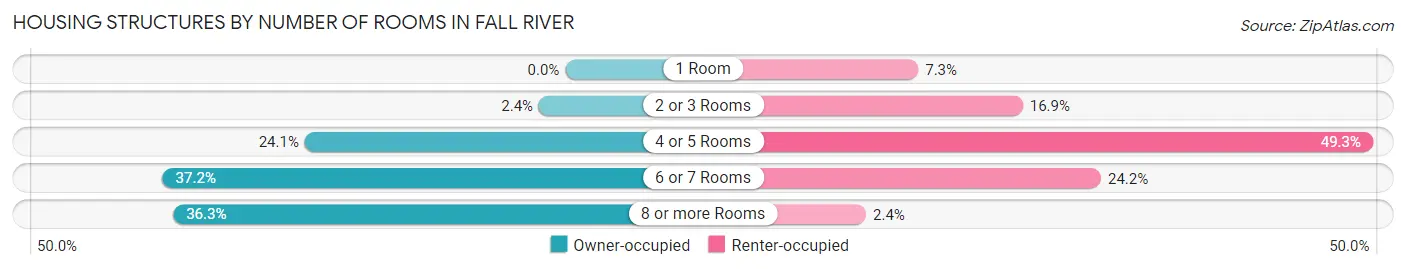
| Number of Rooms | Owner-occupied | Renter-occupied |
| 1 Room | 0 (0.0%) | 15 (7.2%) |
| 2 or 3 Rooms | 10 (2.4%) | 35 (16.9%) |
| 4 or 5 Rooms | 99 (24.1%) | 102 (49.3%) |
| 6 or 7 Rooms | 153 (37.2%) | 50 (24.1%) |
| 8 or more Rooms | 149 (36.2%) | 5 (2.4%) |
| Total | 411 (100.0%) | 207 (100.0%) |
Housing Structure by Heating Type in Fall River
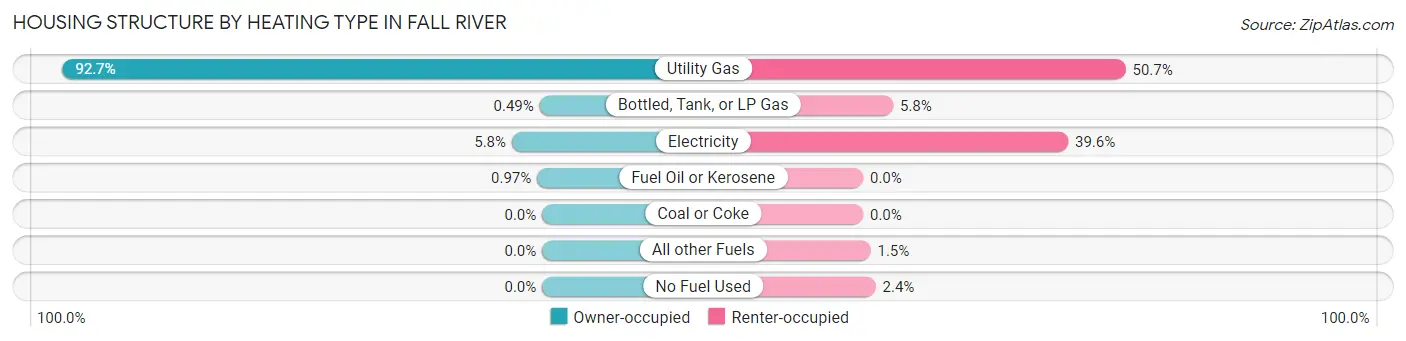
| Heating Type | Owner-occupied | Renter-occupied |
| Utility Gas | 381 (92.7%) | 105 (50.7%) |
| Bottled, Tank, or LP Gas | 2 (0.5%) | 12 (5.8%) |
| Electricity | 24 (5.8%) | 82 (39.6%) |
| Fuel Oil or Kerosene | 4 (1.0%) | 0 (0.0%) |
| Coal or Coke | 0 (0.0%) | 0 (0.0%) |
| All other Fuels | 0 (0.0%) | 3 (1.5%) |
| No Fuel Used | 0 (0.0%) | 5 (2.4%) |
| Total | 411 (100.0%) | 207 (100.0%) |
Household Vehicle Usage in Fall River
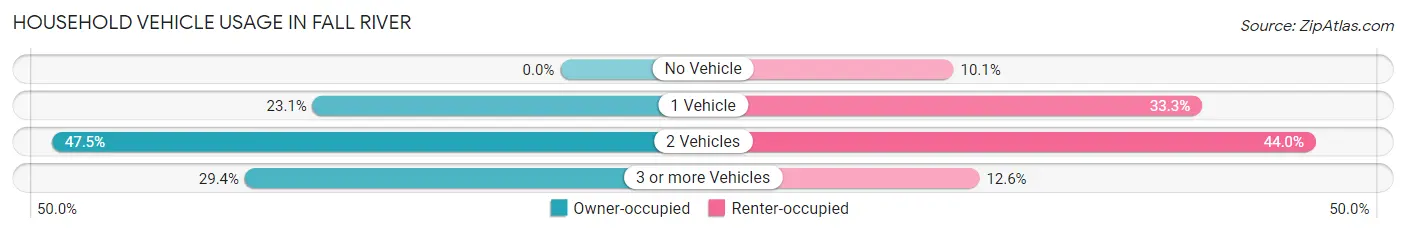
| Vehicles per Household | Owner-occupied | Renter-occupied |
| No Vehicle | 0 (0.0%) | 21 (10.1%) |
| 1 Vehicle | 95 (23.1%) | 69 (33.3%) |
| 2 Vehicles | 195 (47.4%) | 91 (44.0%) |
| 3 or more Vehicles | 121 (29.4%) | 26 (12.6%) |
| Total | 411 (100.0%) | 207 (100.0%) |
Real Estate & Mortgages in Fall River
Real Estate and Mortgage Overview in Fall River
| Characteristic | Without Mortgage | With Mortgage |
| Housing Units | 98 | 313 |
| Median Property Value | $208,900 | $245,500 |
| Median Household Income | $66,250 | $57 |
| Monthly Housing Costs | $613 | $9 |
| Real Estate Taxes | $2,875 | $0 |
Property Value by Mortgage Status in Fall River
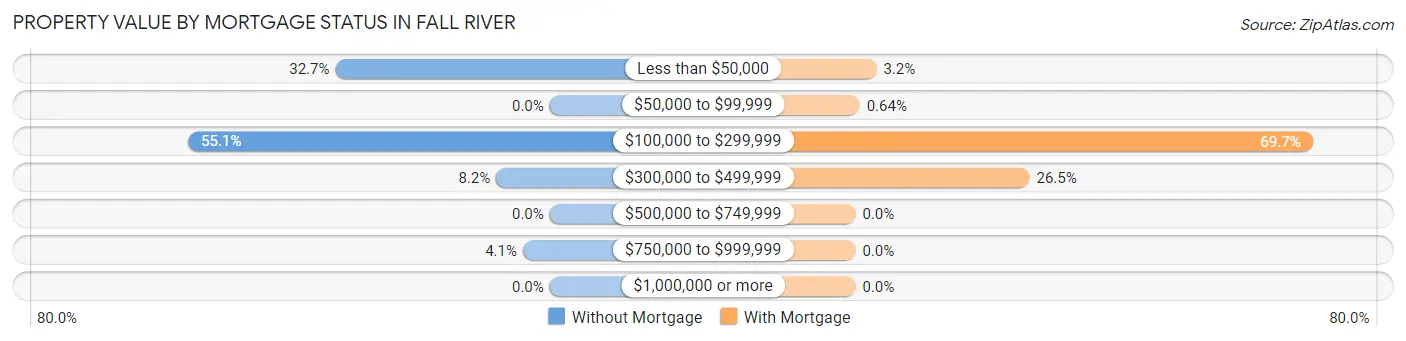
| Property Value | Without Mortgage | With Mortgage |
| Less than $50,000 | 32 (32.7%) | 10 (3.2%) |
| $50,000 to $99,999 | 0 (0.0%) | 2 (0.6%) |
| $100,000 to $299,999 | 54 (55.1%) | 218 (69.7%) |
| $300,000 to $499,999 | 8 (8.2%) | 83 (26.5%) |
| $500,000 to $749,999 | 0 (0.0%) | 0 (0.0%) |
| $750,000 to $999,999 | 4 (4.1%) | 0 (0.0%) |
| $1,000,000 or more | 0 (0.0%) | 0 (0.0%) |
| Total | 98 (100.0%) | 313 (100.0%) |
Household Income by Mortgage Status in Fall River
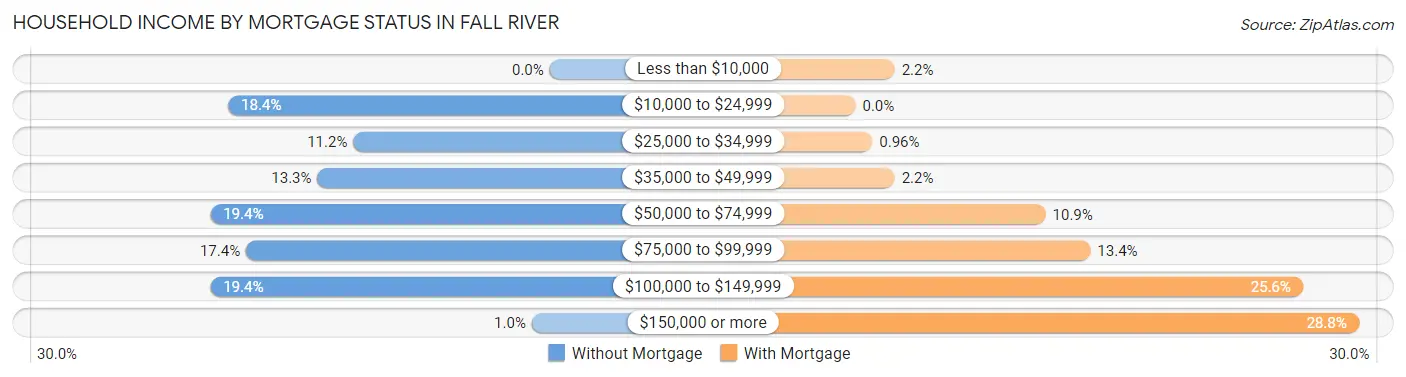
| Household Income | Without Mortgage | With Mortgage |
| Less than $10,000 | 0 (0.0%) | 7 (2.2%) |
| $10,000 to $24,999 | 18 (18.4%) | 0 (0.0%) |
| $25,000 to $34,999 | 11 (11.2%) | 3 (1.0%) |
| $35,000 to $49,999 | 13 (13.3%) | 7 (2.2%) |
| $50,000 to $74,999 | 19 (19.4%) | 34 (10.9%) |
| $75,000 to $99,999 | 17 (17.3%) | 42 (13.4%) |
| $100,000 to $149,999 | 19 (19.4%) | 80 (25.6%) |
| $150,000 or more | 1 (1.0%) | 90 (28.7%) |
| Total | 98 (100.0%) | 313 (100.0%) |
Property Value to Household Income Ratio in Fall River
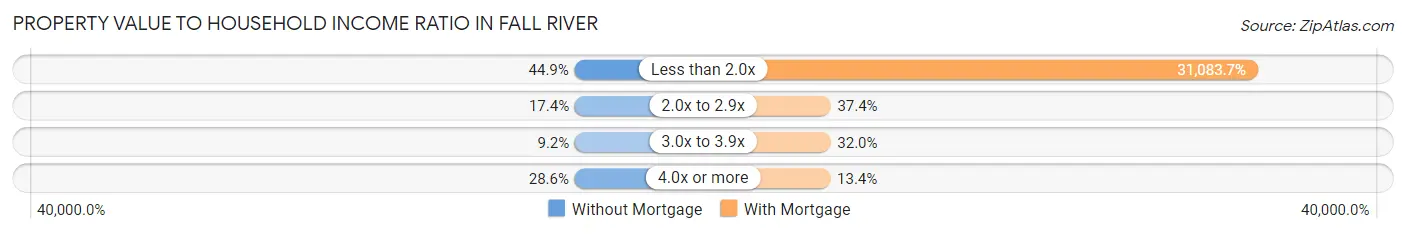
| Value-to-Income Ratio | Without Mortgage | With Mortgage |
| Less than 2.0x | 44 (44.9%) | 97,292 (31,083.7%) |
| 2.0x to 2.9x | 17 (17.3%) | 117 (37.4%) |
| 3.0x to 3.9x | 9 (9.2%) | 100 (32.0%) |
| 4.0x or more | 28 (28.6%) | 42 (13.4%) |
| Total | 98 (100.0%) | 313 (100.0%) |
Real Estate Taxes by Mortgage Status in Fall River
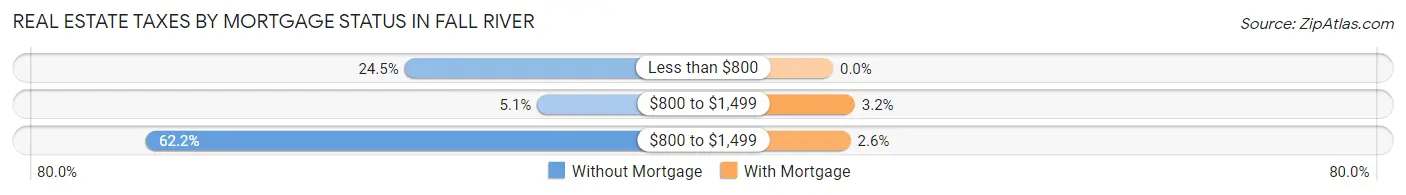
| Property Taxes | Without Mortgage | With Mortgage |
| Less than $800 | 24 (24.5%) | 0 (0.0%) |
| $800 to $1,499 | 5 (5.1%) | 10 (3.2%) |
| $800 to $1,499 | 61 (62.2%) | 8 (2.6%) |
| Total | 98 (100.0%) | 313 (100.0%) |
Health & Disability in Fall River
Health Insurance Coverage by Age in Fall River
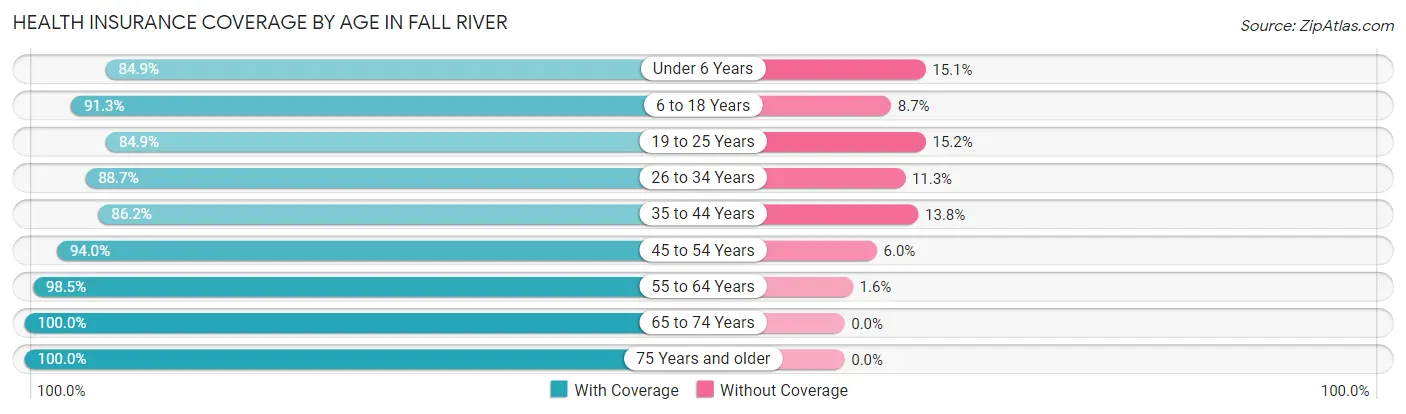
| Age Bracket | With Coverage | Without Coverage |
| Under 6 Years | 146 (84.9%) | 26 (15.1%) |
| 6 to 18 Years | 368 (91.3%) | 35 (8.7%) |
| 19 to 25 Years | 84 (84.9%) | 15 (15.1%) |
| 26 to 34 Years | 149 (88.7%) | 19 (11.3%) |
| 35 to 44 Years | 238 (86.2%) | 38 (13.8%) |
| 45 to 54 Years | 234 (94.0%) | 15 (6.0%) |
| 55 to 64 Years | 191 (98.5%) | 3 (1.5%) |
| 65 to 74 Years | 88 (100.0%) | 0 (0.0%) |
| 75 Years and older | 43 (100.0%) | 0 (0.0%) |
| Total | 1,541 (91.1%) | 151 (8.9%) |
Health Insurance Coverage by Citizenship Status in Fall River
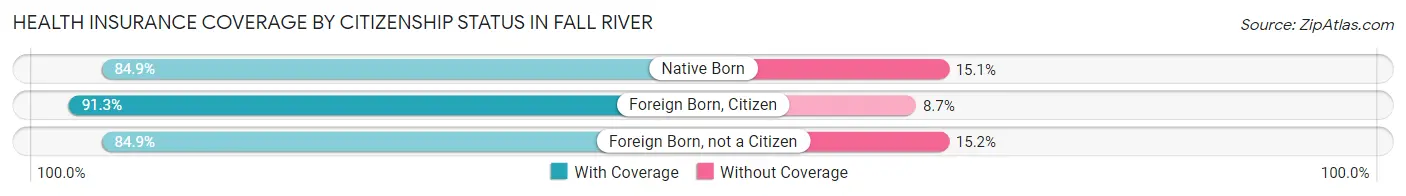
| Citizenship Status | With Coverage | Without Coverage |
| Native Born | 146 (84.9%) | 26 (15.1%) |
| Foreign Born, Citizen | 368 (91.3%) | 35 (8.7%) |
| Foreign Born, not a Citizen | 84 (84.9%) | 15 (15.1%) |
Health Insurance Coverage by Household Income in Fall River
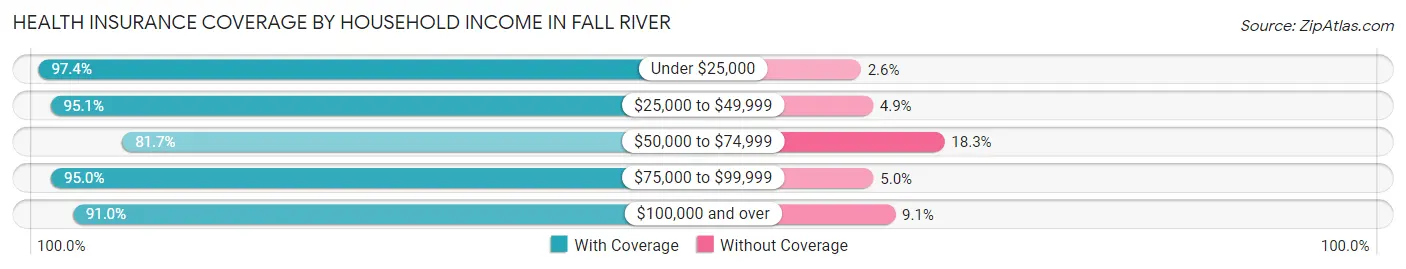
| Household Income | With Coverage | Without Coverage |
| Under $25,000 | 112 (97.4%) | 3 (2.6%) |
| $25,000 to $49,999 | 312 (95.1%) | 16 (4.9%) |
| $50,000 to $74,999 | 277 (81.7%) | 62 (18.3%) |
| $75,000 to $99,999 | 287 (95.0%) | 15 (5.0%) |
| $100,000 and over | 553 (90.9%) | 55 (9.0%) |
Public vs Private Health Insurance Coverage by Age in Fall River
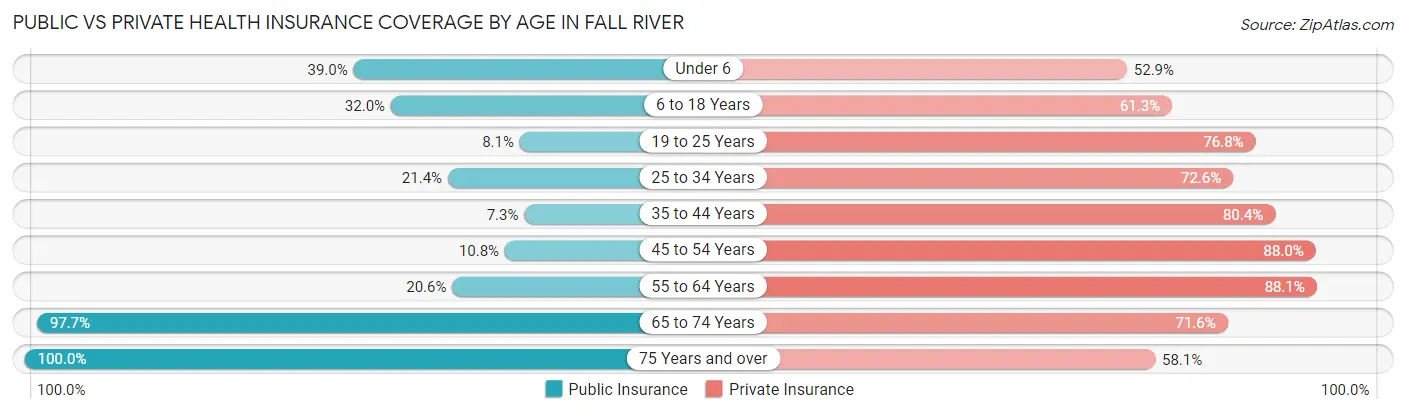
| Age Bracket | Public Insurance | Private Insurance |
| Under 6 | 67 (39.0%) | 91 (52.9%) |
| 6 to 18 Years | 129 (32.0%) | 247 (61.3%) |
| 19 to 25 Years | 8 (8.1%) | 76 (76.8%) |
| 25 to 34 Years | 36 (21.4%) | 122 (72.6%) |
| 35 to 44 Years | 20 (7.2%) | 222 (80.4%) |
| 45 to 54 Years | 27 (10.8%) | 219 (87.9%) |
| 55 to 64 Years | 40 (20.6%) | 171 (88.1%) |
| 65 to 74 Years | 86 (97.7%) | 63 (71.6%) |
| 75 Years and over | 43 (100.0%) | 25 (58.1%) |
| Total | 456 (27.0%) | 1,236 (73.1%) |
Disability Status by Sex by Age in Fall River
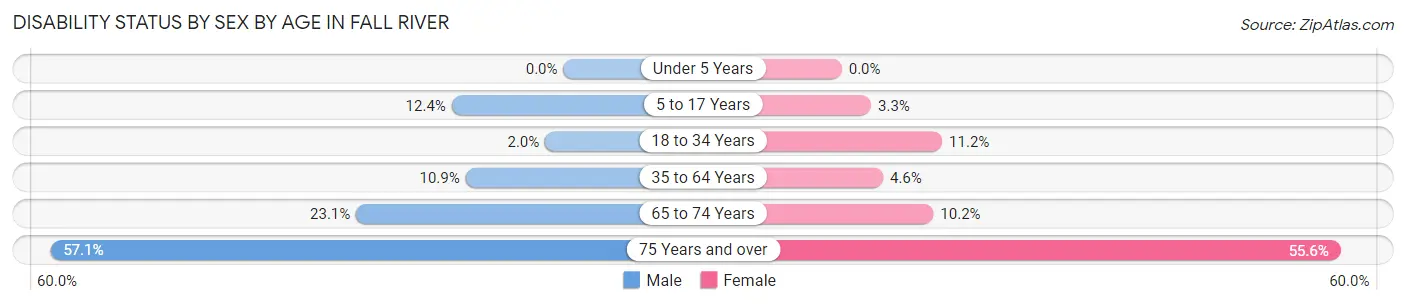
| Age Bracket | Male | Female |
| Under 5 Years | 0 (0.0%) | 0 (0.0%) |
| 5 to 17 Years | 27 (12.4%) | 6 (3.3%) |
| 18 to 34 Years | 3 (2.0%) | 18 (11.2%) |
| 35 to 64 Years | 38 (10.9%) | 17 (4.6%) |
| 65 to 74 Years | 9 (23.1%) | 5 (10.2%) |
| 75 Years and over | 4 (57.1%) | 20 (55.6%) |
Disability Class by Sex by Age in Fall River
Disability Class: Hearing Difficulty
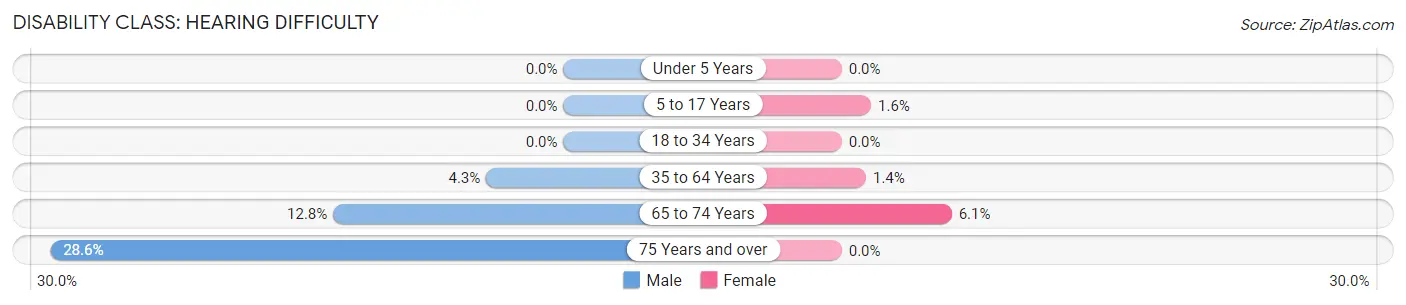
| Age Bracket | Male | Female |
| Under 5 Years | 0 (0.0%) | 0 (0.0%) |
| 5 to 17 Years | 0 (0.0%) | 3 (1.6%) |
| 18 to 34 Years | 0 (0.0%) | 0 (0.0%) |
| 35 to 64 Years | 15 (4.3%) | 5 (1.3%) |
| 65 to 74 Years | 5 (12.8%) | 3 (6.1%) |
| 75 Years and over | 2 (28.6%) | 0 (0.0%) |
Disability Class: Vision Difficulty
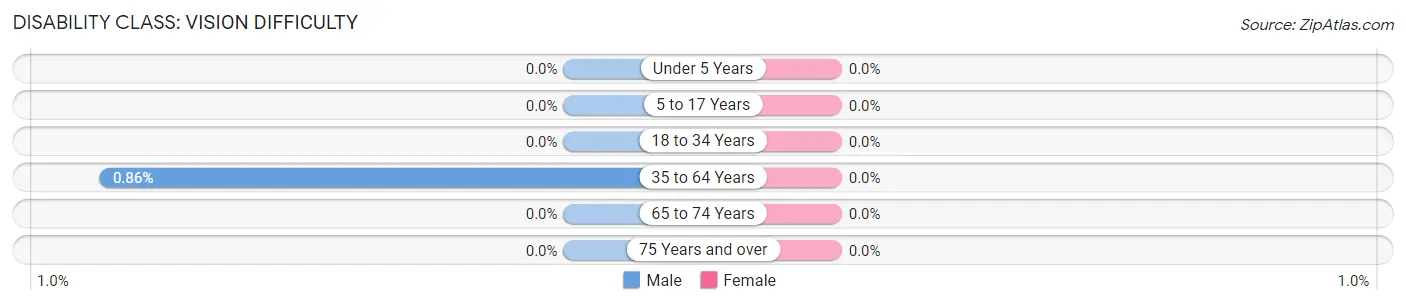
| Age Bracket | Male | Female |
| Under 5 Years | 0 (0.0%) | 0 (0.0%) |
| 5 to 17 Years | 0 (0.0%) | 0 (0.0%) |
| 18 to 34 Years | 0 (0.0%) | 0 (0.0%) |
| 35 to 64 Years | 3 (0.9%) | 0 (0.0%) |
| 65 to 74 Years | 0 (0.0%) | 0 (0.0%) |
| 75 Years and over | 0 (0.0%) | 0 (0.0%) |
Disability Class: Cognitive Difficulty
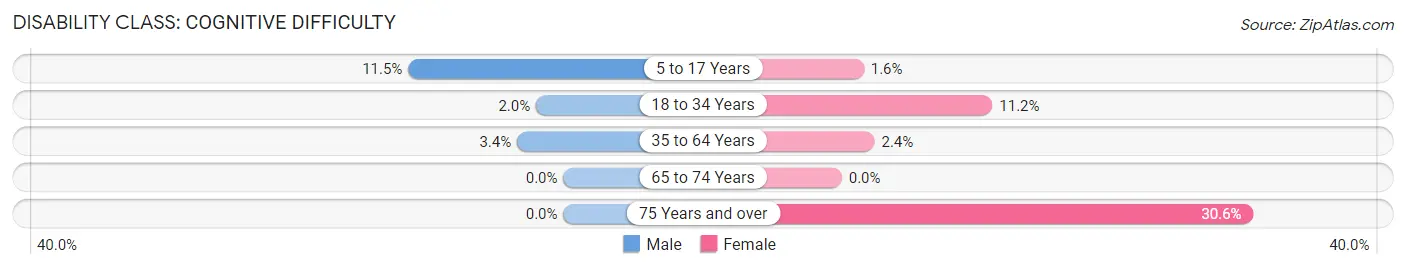
| Age Bracket | Male | Female |
| 5 to 17 Years | 25 (11.5%) | 3 (1.6%) |
| 18 to 34 Years | 3 (2.0%) | 18 (11.2%) |
| 35 to 64 Years | 12 (3.4%) | 9 (2.4%) |
| 65 to 74 Years | 0 (0.0%) | 0 (0.0%) |
| 75 Years and over | 0 (0.0%) | 11 (30.6%) |
Disability Class: Ambulatory Difficulty
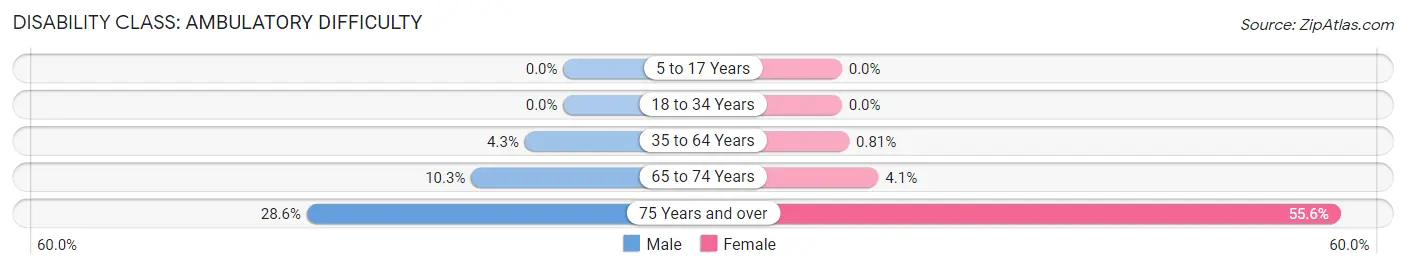
| Age Bracket | Male | Female |
| 5 to 17 Years | 0 (0.0%) | 0 (0.0%) |
| 18 to 34 Years | 0 (0.0%) | 0 (0.0%) |
| 35 to 64 Years | 15 (4.3%) | 3 (0.8%) |
| 65 to 74 Years | 4 (10.3%) | 2 (4.1%) |
| 75 Years and over | 2 (28.6%) | 20 (55.6%) |
Disability Class: Self-Care Difficulty
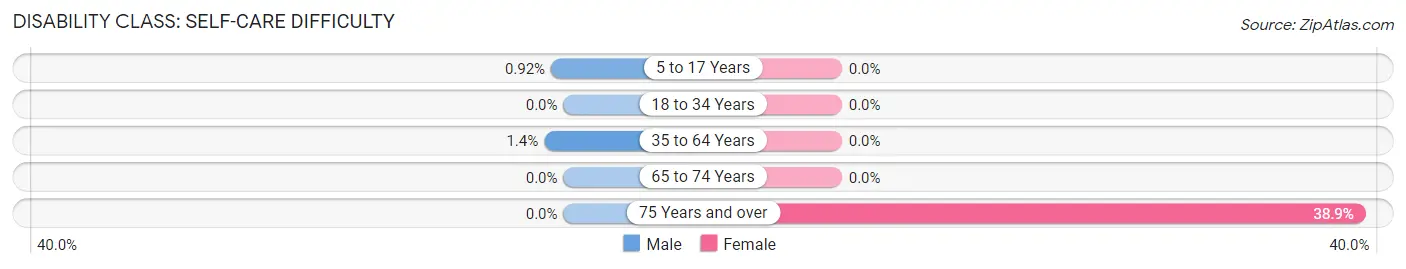
| Age Bracket | Male | Female |
| 5 to 17 Years | 2 (0.9%) | 0 (0.0%) |
| 18 to 34 Years | 0 (0.0%) | 0 (0.0%) |
| 35 to 64 Years | 5 (1.4%) | 0 (0.0%) |
| 65 to 74 Years | 0 (0.0%) | 0 (0.0%) |
| 75 Years and over | 0 (0.0%) | 14 (38.9%) |
Technology Access in Fall River
Computing Device Access in Fall River
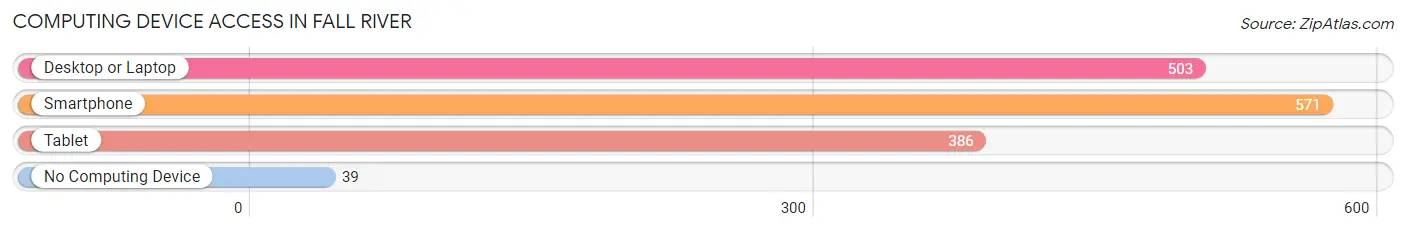
| Device Type | # Households | % Households |
| Desktop or Laptop | 503 | 81.4% |
| Smartphone | 571 | 92.4% |
| Tablet | 386 | 62.5% |
| No Computing Device | 39 | 6.3% |
| Total | 618 | 100.0% |
Internet Access in Fall River
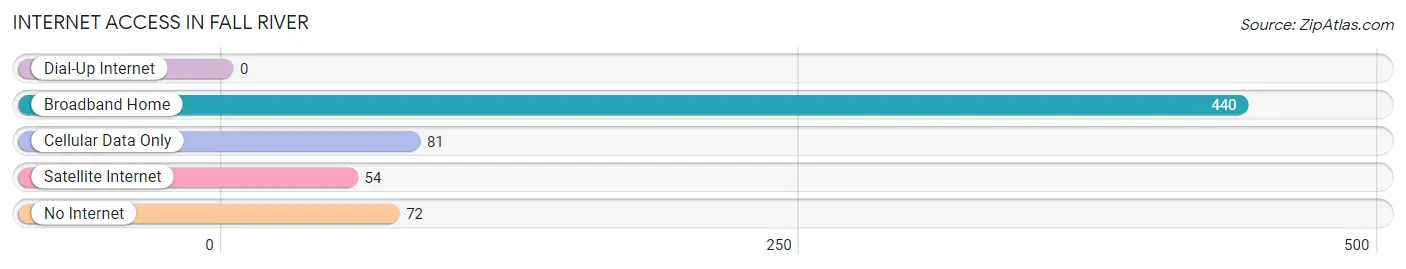
| Internet Type | # Households | % Households |
| Dial-Up Internet | 0 | 0.0% |
| Broadband Home | 440 | 71.2% |
| Cellular Data Only | 81 | 13.1% |
| Satellite Internet | 54 | 8.7% |
| No Internet | 72 | 11.7% |
| Total | 618 | 100.0% |
Fall River Summary
Introduction
Fall River is a small village located in Columbia County, Wisconsin, United States. It is situated on the banks of the Crawfish River, about 25 miles north of Madison. The village has a population of about 1,000 people and is part of the Madison Metropolitan Statistical Area. The village is known for its rural charm and its proximity to the Wisconsin Dells, a popular tourist destination.
History
The area that is now Fall River was first settled in the early 1800s by settlers from New England. The village was originally known as “Crawfish” and was later renamed “Fall River” after the nearby Crawfish River. The village was incorporated in 1856 and was home to a variety of businesses, including a sawmill, a grist mill, a blacksmith shop, and a general store.
In the late 1800s, the village began to grow and prosper. The railroad arrived in 1887, bringing with it new opportunities for commerce and industry. The village also became a popular tourist destination, with visitors coming to enjoy the scenic beauty of the area.
In the early 1900s, the village experienced a period of decline. The railroad was abandoned in the 1920s and the sawmill and grist mill closed in the 1930s. The village was also hit hard by the Great Depression. However, the village began to recover in the 1940s and 1950s, with the opening of a cheese factory and a canning factory.
Geography
Fall River is located in Columbia County, Wisconsin, about 25 miles north of Madison. The village is situated on the banks of the Crawfish River, which flows through the village and is a popular spot for fishing and canoeing. The village is surrounded by rolling hills and farmland, and is home to a variety of wildlife, including deer, foxes, and turkeys.
Economy
The economy of Fall River is largely based on agriculture and tourism. The village is home to several farms, which produce a variety of crops, including corn, soybeans, and hay. The village is also home to a cheese factory, which produces a variety of cheeses for sale in the local area.
Tourism is also an important part of the local economy. The village is located near the Wisconsin Dells, a popular tourist destination. Visitors come to the area to enjoy the scenic beauty of the area, as well as to take part in a variety of outdoor activities, such as fishing, canoeing, and hiking.
Demographics
As of the 2010 census, the population of Fall River was 1,000 people. The racial makeup of the village was 97.2% White, 0.7% African American, 0.2% Native American, 0.2% Asian, 0.2% from other races, and 1.7% from two or more races. Hispanic or Latino of any race were 0.7% of the population.
The median household income in Fall River was $45,000, and the median family income was $50,000. The per capita income for the village was $20,000. About 8.3% of families and 10.2% of the population were below the poverty line, including 11.3% of those under age 18 and 8.3% of those age 65 or over.
Conclusion
Fall River is a small village located in Columbia County, Wisconsin. It is situated on the banks of the Crawfish River and is known for its rural charm and its proximity to the Wisconsin Dells. The village has a population of about 1,000 people and is part of the Madison Metropolitan Statistical Area. The economy of Fall River is largely based on agriculture and tourism, and the village is home to several farms and a cheese factory. The racial makeup of the village is predominantly White, with a small percentage of African American, Native American, and Asian residents. The median household income in Fall River is $45,000, and the per capita income is $20,000.
Common Questions
What is Per Capita Income in Fall River?
Per Capita income in Fall River is $30,793.
What is the Median Family Income in Fall River?
Median Family Income in Fall River is $88,750.
What is the Median Household income in Fall River?
Median Household Income in Fall River is $74,688.
What is Income or Wage Gap in Fall River?
Income or Wage Gap in Fall River is 36.3%.
Women in Fall River earn 63.7 cents for every dollar earned by a man.
What is Inequality or Gini Index in Fall River?
Inequality or Gini Index in Fall River is 0.36.
What is the Total Population of Fall River?
Total Population of Fall River is 1,708.
What is the Total Male Population of Fall River?
Total Male Population of Fall River is 860.
What is the Total Female Population of Fall River?
Total Female Population of Fall River is 848.
What is the Ratio of Males per 100 Females in Fall River?
There are 101.42 Males per 100 Females in Fall River.
What is the Ratio of Females per 100 Males in Fall River?
There are 98.60 Females per 100 Males in Fall River.
What is the Median Population Age in Fall River?
Median Population Age in Fall River is 35.5 Years.
What is the Average Family Size in Fall River
Average Family Size in Fall River is 3.3 People.
What is the Average Household Size in Fall River
Average Household Size in Fall River is 2.8 People.
How Large is the Labor Force in Fall River?
There are 937 People in the Labor Forcein in Fall River.
What is the Percentage of People in the Labor Force in Fall River?
75.6% of People are in the Labor Force in Fall River.
What is the Unemployment Rate in Fall River?
Unemployment Rate in Fall River is 3.0%.