Greendale, WI Map & Demographics
Greendale Map
Greendale Overview
$43,538
PER CAPITA INCOME
$115,038
AVG FAMILY INCOME
$89,684
AVG HOUSEHOLD INCOME
38.4%
WAGE / INCOME GAP [ % ]
61.6¢/ $1
WAGE / INCOME GAP [ $ ]
0.39
INEQUALITY / GINI INDEX
14,722
TOTAL POPULATION
6,999
MALE POPULATION
7,723
FEMALE POPULATION
90.63
MALES / 100 FEMALES
110.34
FEMALES / 100 MALES
41.8
MEDIAN AGE
2.9
AVG FAMILY SIZE
2.4
AVG HOUSEHOLD SIZE
7,393
LABOR FORCE [ PEOPLE ]
64.4%
PERCENT IN LABOR FORCE
2.5%
UNEMPLOYMENT RATE
Greendale Zip Codes
Greendale Area Codes
Income in Greendale
Income Overview in Greendale
Per Capita Income in Greendale is $43,538, while median incomes of families and households are $115,038 and $89,684 respectively.
| Characteristic | Number | Measure |
| Per Capita Income | 14,722 | $43,538 |
| Median Family Income | 4,058 | $115,038 |
| Mean Family Income | 4,058 | $127,101 |
| Median Household Income | 6,140 | $89,684 |
| Mean Household Income | 6,140 | $104,475 |
| Income Deficit | 4,058 | $0 |
| Wage / Income Gap (%) | 14,722 | 38.36% |
| Wage / Income Gap ($) | 14,722 | 61.64¢ per $1 |
| Gini / Inequality Index | 14,722 | 0.39 |
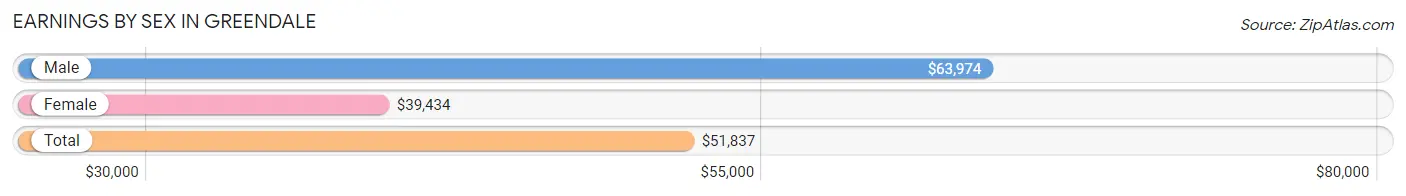
Earnings by Sex in Greendale
Average Earnings in Greendale are $51,837, $63,974 for men and $39,434 for women, a difference of 38.4%.
| Sex | Number | Average Earnings |
| Male | 3,867 (49.0%) | $63,974 |
| Female | 4,028 (51.0%) | $39,434 |
| Total | 7,895 (100.0%) | $51,837 |
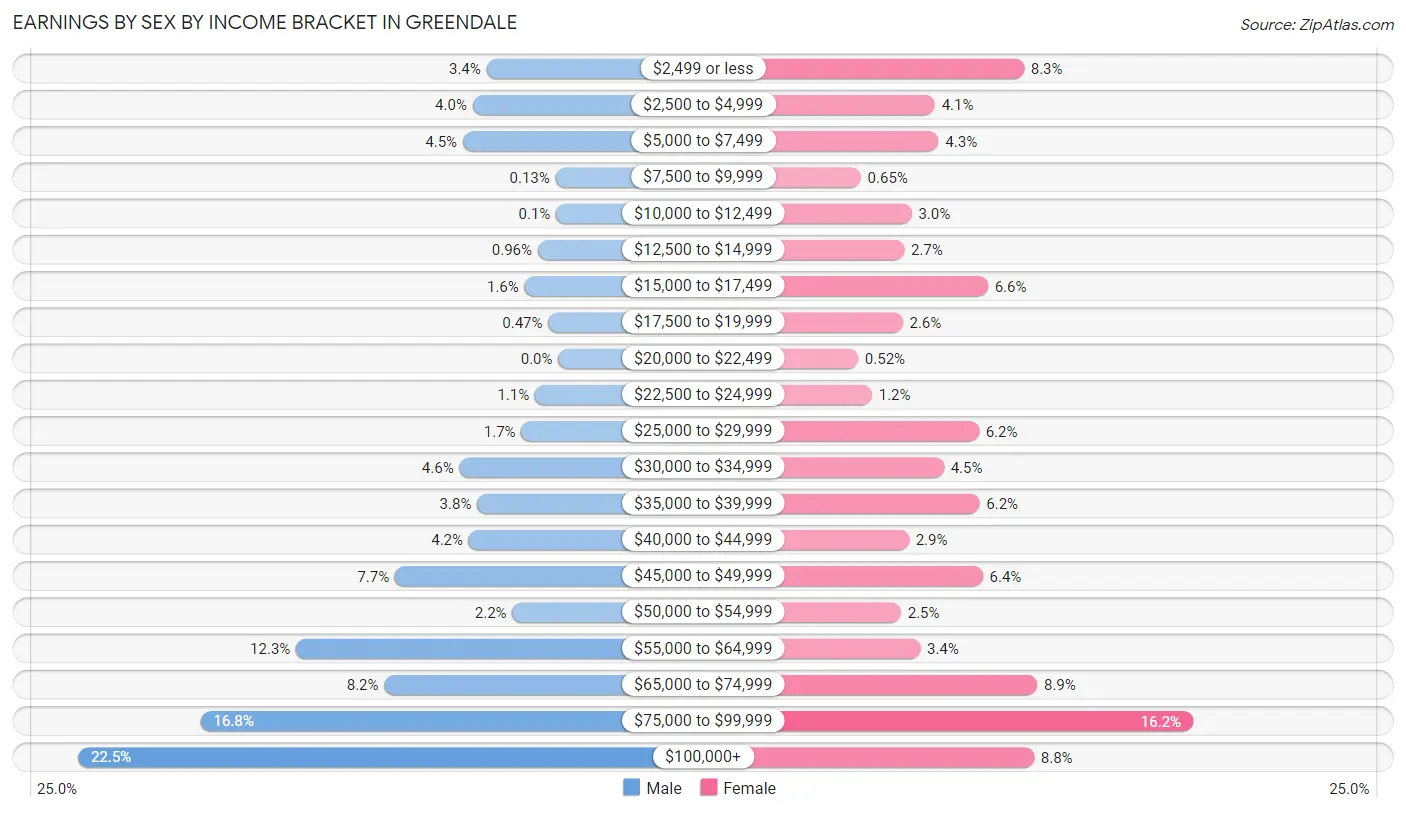
Earnings by Sex by Income Bracket in Greendale
The most common earnings brackets in Greendale are $100,000+ for men (870 | 22.5%) and $75,000 to $99,999 for women (653 | 16.2%).
| Income | Male | Female |
| $2,499 or less | 130 (3.4%) | 334 (8.3%) |
| $2,500 to $4,999 | 155 (4.0%) | 166 (4.1%) |
| $5,000 to $7,499 | 173 (4.5%) | 173 (4.3%) |
| $7,500 to $9,999 | 5 (0.1%) | 26 (0.6%) |
| $10,000 to $12,499 | 4 (0.1%) | 122 (3.0%) |
| $12,500 to $14,999 | 37 (1.0%) | 108 (2.7%) |
| $15,000 to $17,499 | 61 (1.6%) | 266 (6.6%) |
| $17,500 to $19,999 | 18 (0.5%) | 105 (2.6%) |
| $20,000 to $22,499 | 0 (0.0%) | 21 (0.5%) |
| $22,500 to $24,999 | 42 (1.1%) | 47 (1.2%) |
| $25,000 to $29,999 | 67 (1.7%) | 249 (6.2%) |
| $30,000 to $34,999 | 179 (4.6%) | 183 (4.5%) |
| $35,000 to $39,999 | 147 (3.8%) | 250 (6.2%) |
| $40,000 to $44,999 | 162 (4.2%) | 117 (2.9%) |
| $45,000 to $49,999 | 296 (7.6%) | 256 (6.4%) |
| $50,000 to $54,999 | 83 (2.1%) | 102 (2.5%) |
| $55,000 to $64,999 | 475 (12.3%) | 138 (3.4%) |
| $65,000 to $74,999 | 315 (8.2%) | 359 (8.9%) |
| $75,000 to $99,999 | 648 (16.8%) | 653 (16.2%) |
| $100,000+ | 870 (22.5%) | 353 (8.8%) |
| Total | 3,867 (100.0%) | 4,028 (100.0%) |
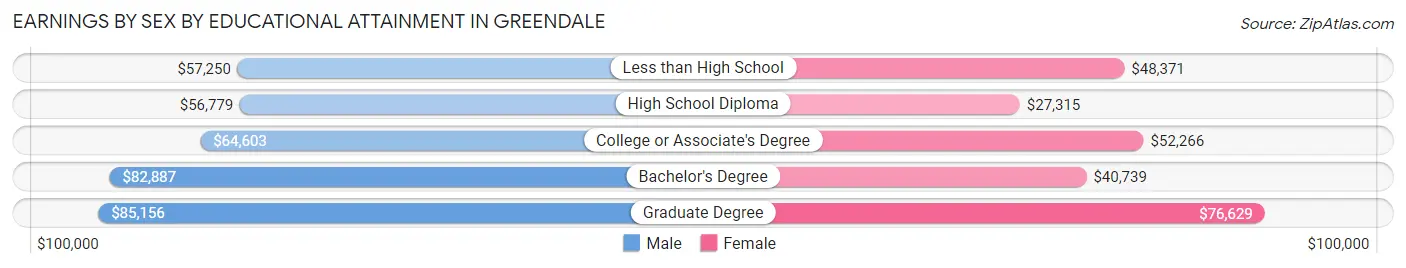
Earnings by Sex by Educational Attainment in Greendale
Average earnings in Greendale are $70,933 for men and $48,402 for women, a difference of 31.8%. Men with an educational attainment of graduate degree enjoy the highest average annual earnings of $85,156, while those with high school diploma education earn the least with $56,779. Women with an educational attainment of graduate degree earn the most with the average annual earnings of $76,629, while those with high school diploma education have the smallest earnings of $27,315.
| Educational Attainment | Male Income | Female Income |
| Less than High School | $57,250 | $48,371 |
| High School Diploma | $56,779 | $27,315 |
| College or Associate's Degree | $64,603 | $52,266 |
| Bachelor's Degree | $82,887 | $40,739 |
| Graduate Degree | $85,156 | $76,629 |
| Total | $70,933 | $48,402 |
Family Income in Greendale
Family Income Brackets in Greendale
According to the Greendale family income data, there are 1,100 families falling into the $100,000 to $149,999 income range, which is the most common income bracket and makes up 27.1% of all families.
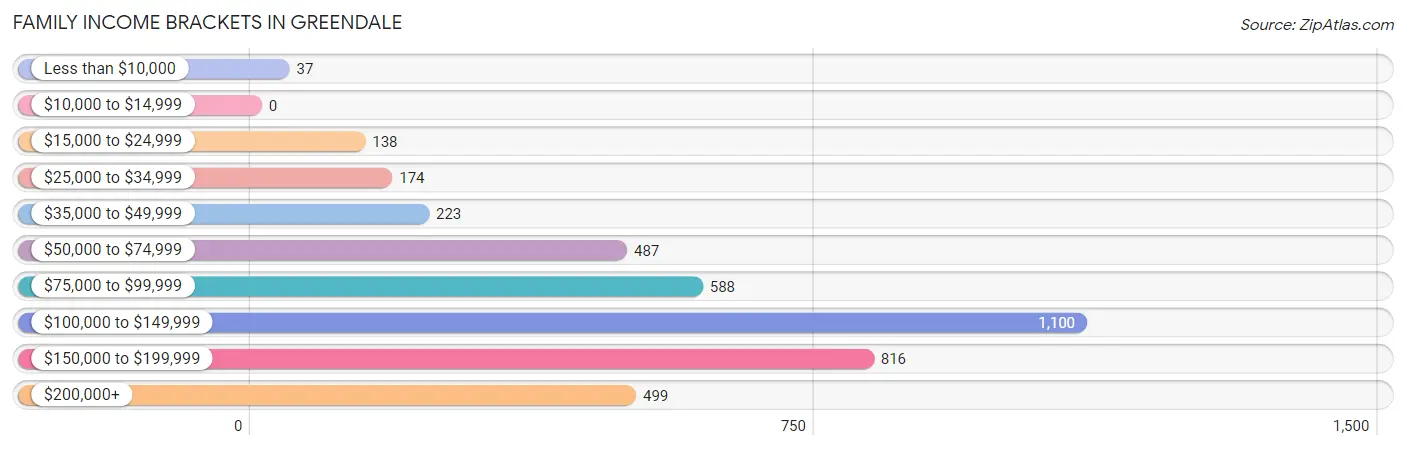
| Income Bracket | # Families | % Families |
| Less than $10,000 | 37 | 0.9% |
| $10,000 to $14,999 | 0 | 0.0% |
| $15,000 to $24,999 | 138 | 3.4% |
| $25,000 to $34,999 | 174 | 4.3% |
| $35,000 to $49,999 | 223 | 5.5% |
| $50,000 to $74,999 | 487 | 12.0% |
| $75,000 to $99,999 | 588 | 14.5% |
| $100,000 to $149,999 | 1,100 | 27.1% |
| $150,000 to $199,999 | 816 | 20.1% |
| $200,000+ | 499 | 12.3% |
Family Income by Famaliy Size in Greendale
5-person families (169 | 4.2%) account for the highest median family income in Greendale with $169,583 per family, while 2-person families (1,947 | 48.0%) have the highest median income of $53,238 per family member.
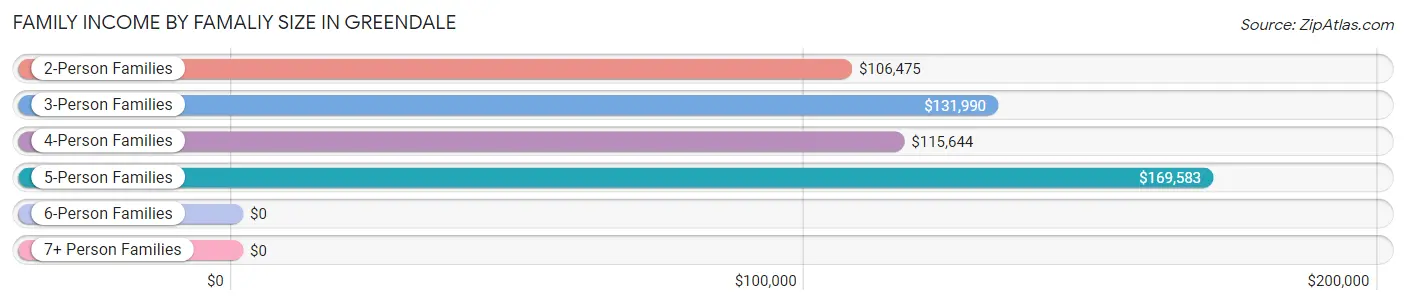
| Income Bracket | # Families | Median Income |
| 2-Person Families | 1,947 (48.0%) | $106,475 |
| 3-Person Families | 996 (24.5%) | $131,990 |
| 4-Person Families | 782 (19.3%) | $115,644 |
| 5-Person Families | 169 (4.2%) | $169,583 |
| 6-Person Families | 145 (3.6%) | $0 |
| 7+ Person Families | 19 (0.5%) | $0 |
| Total | 4,058 (100.0%) | $115,038 |
Family Income by Number of Earners in Greendale
The median family income in Greendale is $115,038, with families comprising 3+ earners (607) having the highest median family income of $158,224, while families with no earners (728) have the lowest median family income of $72,500, accounting for 15.0% and 17.9% of families, respectively.
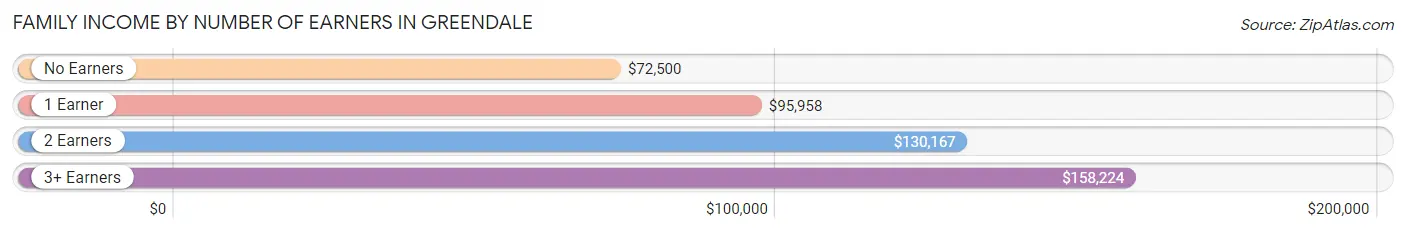
| Number of Earners | # Families | Median Income |
| No Earners | 728 (17.9%) | $72,500 |
| 1 Earner | 1,055 (26.0%) | $95,958 |
| 2 Earners | 1,668 (41.1%) | $130,167 |
| 3+ Earners | 607 (15.0%) | $158,224 |
| Total | 4,058 (100.0%) | $115,038 |
Household Income in Greendale
Household Income Brackets in Greendale
With 1,382 households falling in the category, the $100,000 to $149,999 income range is the most frequent in Greendale, accounting for 22.5% of all households. In contrast, only 55 households (0.9%) fall into the $10,000 to $14,999 income bracket, making it the least populous group.
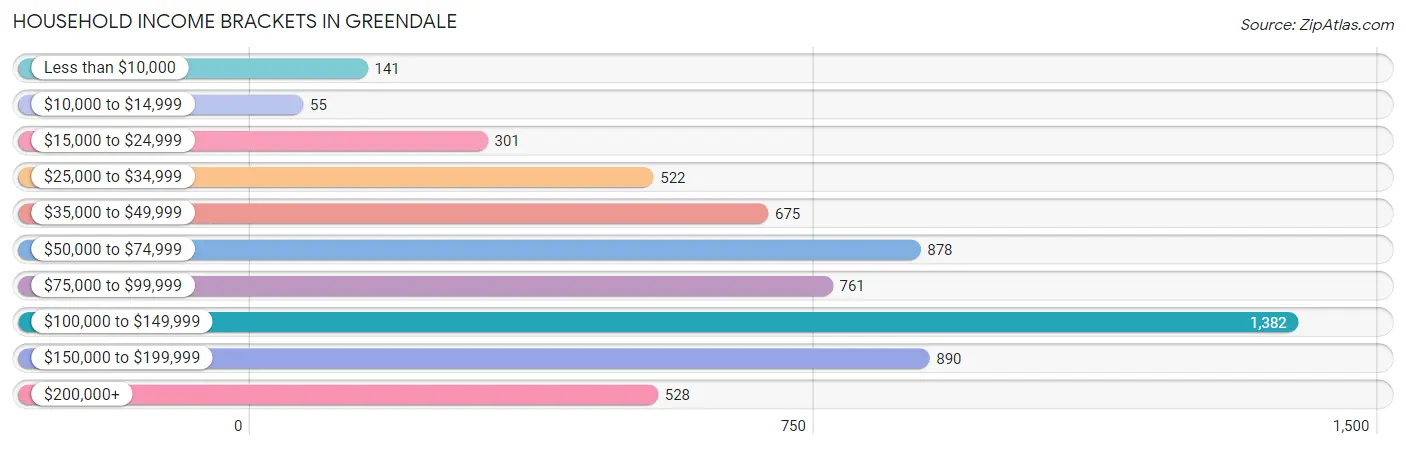
| Income Bracket | # Households | % Households |
| Less than $10,000 | 141 | 2.3% |
| $10,000 to $14,999 | 55 | 0.9% |
| $15,000 to $24,999 | 301 | 4.9% |
| $25,000 to $34,999 | 522 | 8.5% |
| $35,000 to $49,999 | 675 | 11.0% |
| $50,000 to $74,999 | 878 | 14.3% |
| $75,000 to $99,999 | 761 | 12.4% |
| $100,000 to $149,999 | 1,382 | 22.5% |
| $150,000 to $199,999 | 890 | 14.5% |
| $200,000+ | 528 | 8.6% |
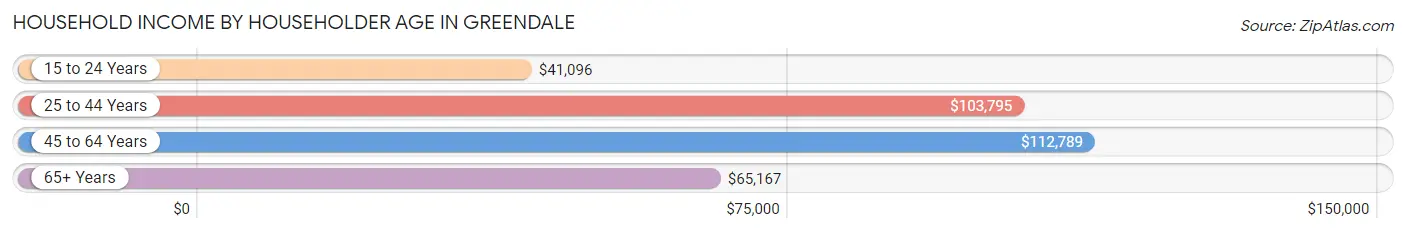
Household Income by Householder Age in Greendale
The median household income in Greendale is $89,684, with the highest median household income of $112,789 found in the 45 to 64 years age bracket for the primary householder. A total of 1,909 households (31.1%) fall into this category. Meanwhile, the 15 to 24 years age bracket for the primary householder has the lowest median household income of $41,096, with 191 households (3.1%) in this group.
| Income Bracket | # Households | Median Income |
| 15 to 24 Years | 191 (3.1%) | $41,096 |
| 25 to 44 Years | 1,848 (30.1%) | $103,795 |
| 45 to 64 Years | 1,909 (31.1%) | $112,789 |
| 65+ Years | 2,192 (35.7%) | $65,167 |
| Total | 6,140 (100.0%) | $89,684 |
Poverty in Greendale
Income Below Poverty by Sex and Age in Greendale
With 3.6% poverty level for males and 9.3% for females among the residents of Greendale, under 5 year old males and 6 to 11 year old females are the most vulnerable to poverty, with 48 males (11.0%) and 216 females (31.4%) in their respective age groups living below the poverty level.
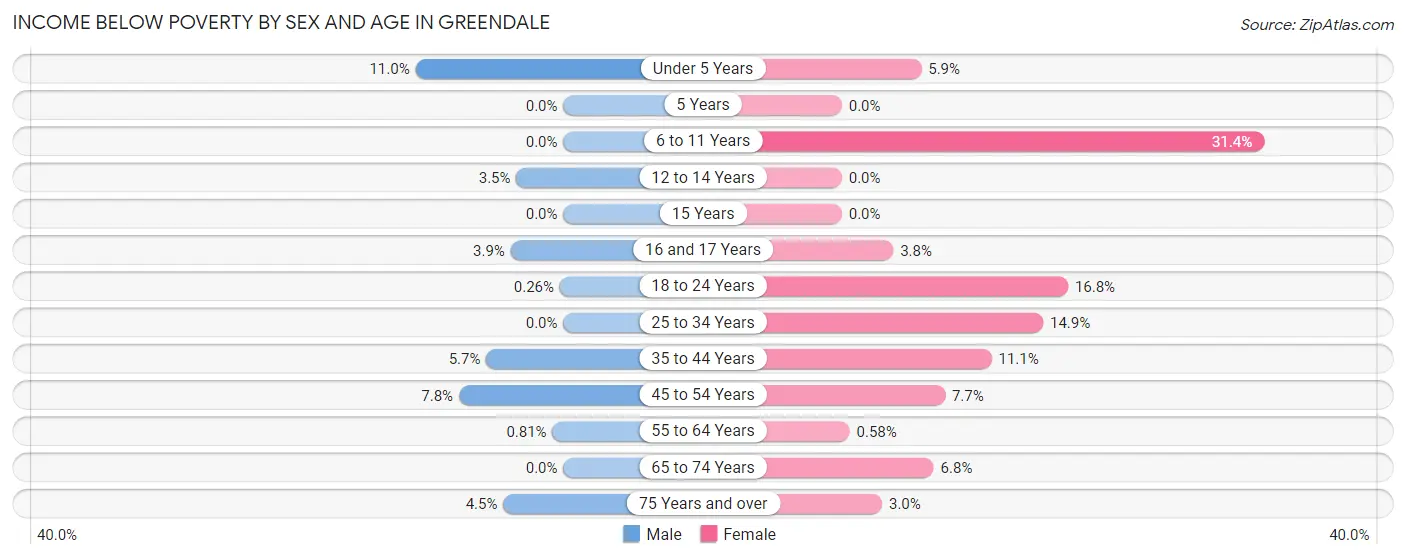
| Age Bracket | Male | Female |
| Under 5 Years | 48 (11.0%) | 22 (5.9%) |
| 5 Years | 0 (0.0%) | 0 (0.0%) |
| 6 to 11 Years | 0 (0.0%) | 216 (31.4%) |
| 12 to 14 Years | 15 (3.5%) | 0 (0.0%) |
| 15 Years | 0 (0.0%) | 0 (0.0%) |
| 16 and 17 Years | 7 (3.9%) | 12 (3.8%) |
| 18 to 24 Years | 1 (0.3%) | 69 (16.8%) |
| 25 to 34 Years | 0 (0.0%) | 107 (14.9%) |
| 35 to 44 Years | 67 (5.7%) | 127 (11.1%) |
| 45 to 54 Years | 76 (7.7%) | 78 (7.7%) |
| 55 to 64 Years | 5 (0.8%) | 4 (0.6%) |
| 65 to 74 Years | 0 (0.0%) | 45 (6.8%) |
| 75 Years and over | 35 (4.5%) | 33 (3.0%) |
| Total | 254 (3.6%) | 713 (9.3%) |
Income Above Poverty by Sex and Age in Greendale
According to the poverty statistics in Greendale, males aged 5 years and females aged 5 years are the age groups that are most secure financially, with 100.0% of males and 100.0% of females in these age groups living above the poverty line.
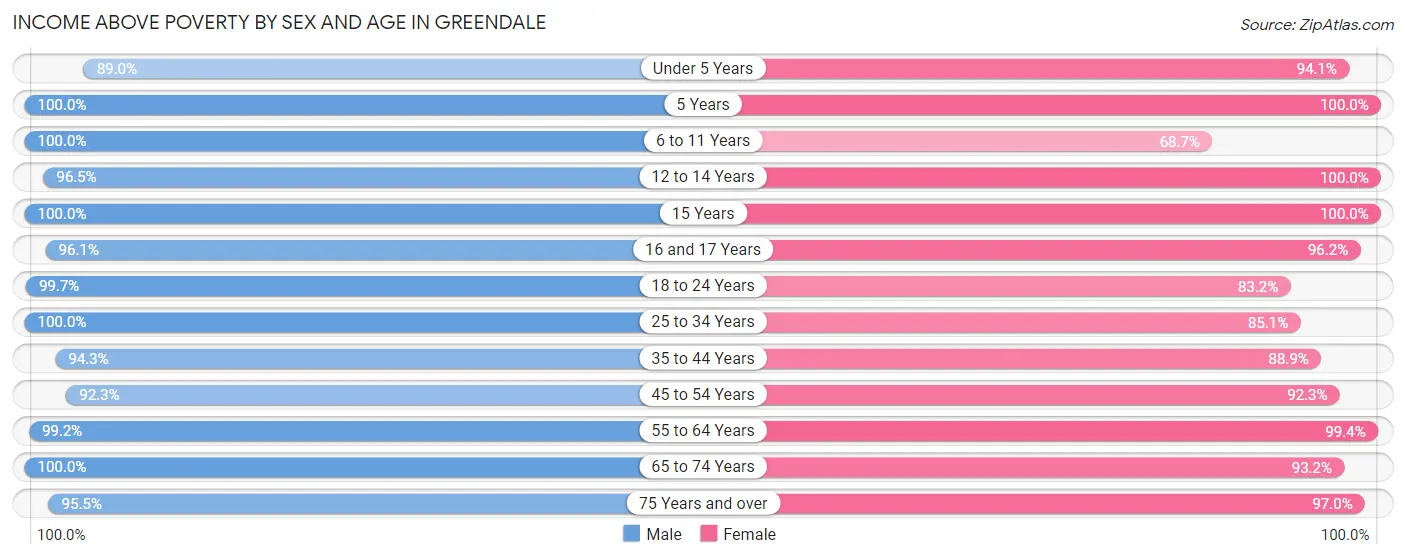
| Age Bracket | Male | Female |
| Under 5 Years | 389 (89.0%) | 351 (94.1%) |
| 5 Years | 133 (100.0%) | 57 (100.0%) |
| 6 to 11 Years | 474 (100.0%) | 473 (68.6%) |
| 12 to 14 Years | 415 (96.5%) | 337 (100.0%) |
| 15 Years | 128 (100.0%) | 121 (100.0%) |
| 16 and 17 Years | 172 (96.1%) | 302 (96.2%) |
| 18 to 24 Years | 383 (99.7%) | 342 (83.2%) |
| 25 to 34 Years | 661 (100.0%) | 609 (85.1%) |
| 35 to 44 Years | 1,104 (94.3%) | 1,015 (88.9%) |
| 45 to 54 Years | 905 (92.2%) | 940 (92.3%) |
| 55 to 64 Years | 610 (99.2%) | 690 (99.4%) |
| 65 to 74 Years | 606 (100.0%) | 615 (93.2%) |
| 75 Years and over | 749 (95.5%) | 1,069 (97.0%) |
| Total | 6,729 (96.4%) | 6,921 (90.7%) |
Income Below Poverty Among Married-Couple Families in Greendale
The poverty statistics for married-couple families in Greendale show that 0.4% or 13 of the total 3,146 families live below the poverty line. Families with 1 or 2 children have the highest poverty rate of 1.2%, comprising of 13 families. On the other hand, families with no children have the lowest poverty rate of 0.0%, which includes 0 families.
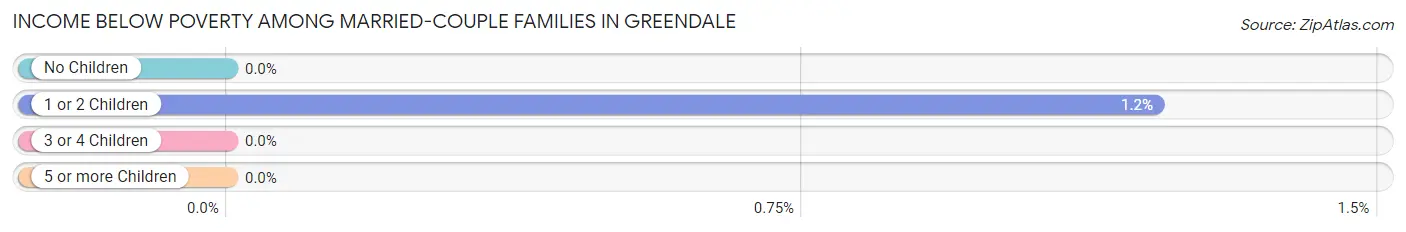
| Children | Above Poverty | Below Poverty |
| No Children | 1,867 (100.0%) | 0 (0.0%) |
| 1 or 2 Children | 1,062 (98.8%) | 13 (1.2%) |
| 3 or 4 Children | 204 (100.0%) | 0 (0.0%) |
| 5 or more Children | 0 (0.0%) | 0 (0.0%) |
| Total | 3,133 (99.6%) | 13 (0.4%) |
Income Below Poverty Among Single-Parent Households in Greendale
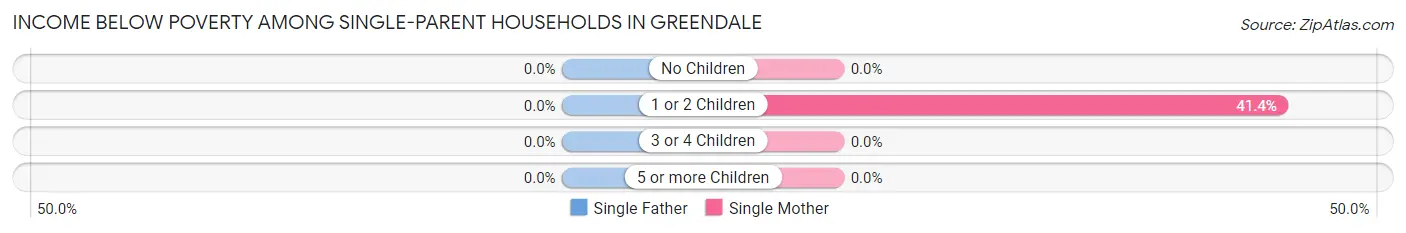
| Children | Single Father | Single Mother |
| No Children | 0 (0.0%) | 0 (0.0%) |
| 1 or 2 Children | 0 (0.0%) | 150 (41.4%) |
| 3 or 4 Children | 0 (0.0%) | 0 (0.0%) |
| 5 or more Children | 0 (0.0%) | 0 (0.0%) |
| Total | 0 (0.0%) | 150 (25.7%) |
Income Below Poverty Among Married-Couple vs Single-Parent Households in Greendale
The poverty data for Greendale shows that 13 of the married-couple family households (0.4%) and 150 of the single-parent households (16.5%) are living below the poverty level. Within the married-couple family households, those with 1 or 2 children have the highest poverty rate, with 13 households (1.2%) falling below the poverty line. Among the single-parent households, those with 1 or 2 children have the highest poverty rate, with 150 household (30.5%) living below poverty.
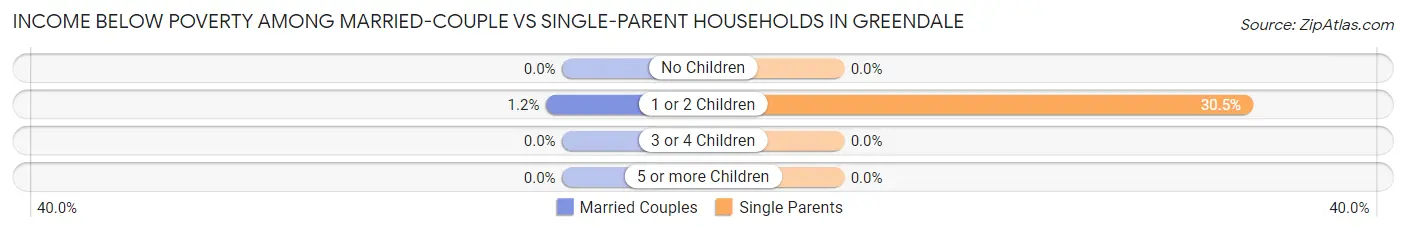
| Children | Married-Couple Families | Single-Parent Households |
| No Children | 0 (0.0%) | 0 (0.0%) |
| 1 or 2 Children | 13 (1.2%) | 150 (30.5%) |
| 3 or 4 Children | 0 (0.0%) | 0 (0.0%) |
| 5 or more Children | 0 (0.0%) | 0 (0.0%) |
| Total | 13 (0.4%) | 150 (16.5%) |
Race in Greendale
The most populous races in Greendale are White / Caucasian (11,987 | 81.4%), Hispanic or Latino (1,403 | 9.5%), and Asian (869 | 5.9%).
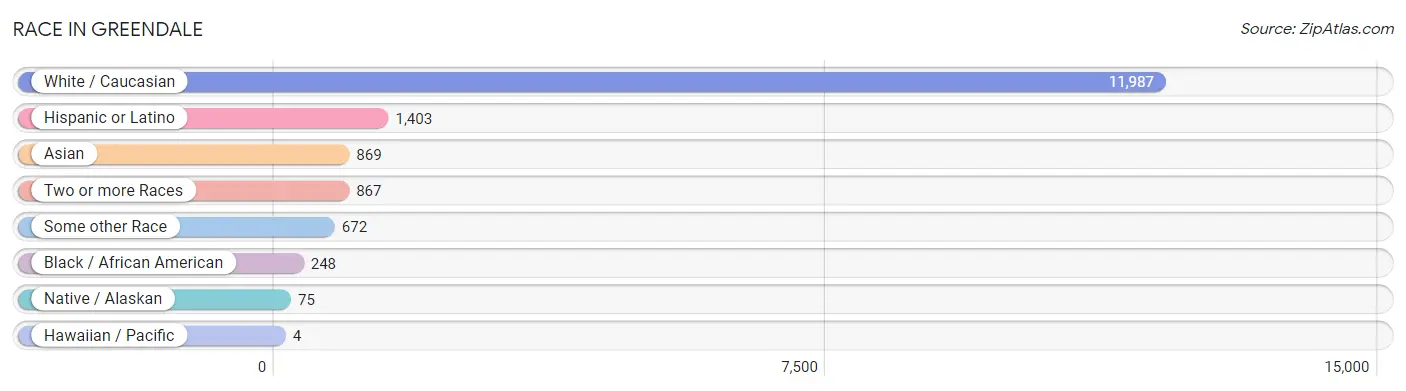
| Race | # Population | % Population |
| Asian | 869 | 5.9% |
| Black / African American | 248 | 1.7% |
| Hawaiian / Pacific | 4 | 0.0% |
| Hispanic or Latino | 1,403 | 9.5% |
| Native / Alaskan | 75 | 0.5% |
| White / Caucasian | 11,987 | 81.4% |
| Two or more Races | 867 | 5.9% |
| Some other Race | 672 | 4.6% |
| Total | 14,722 | 100.0% |
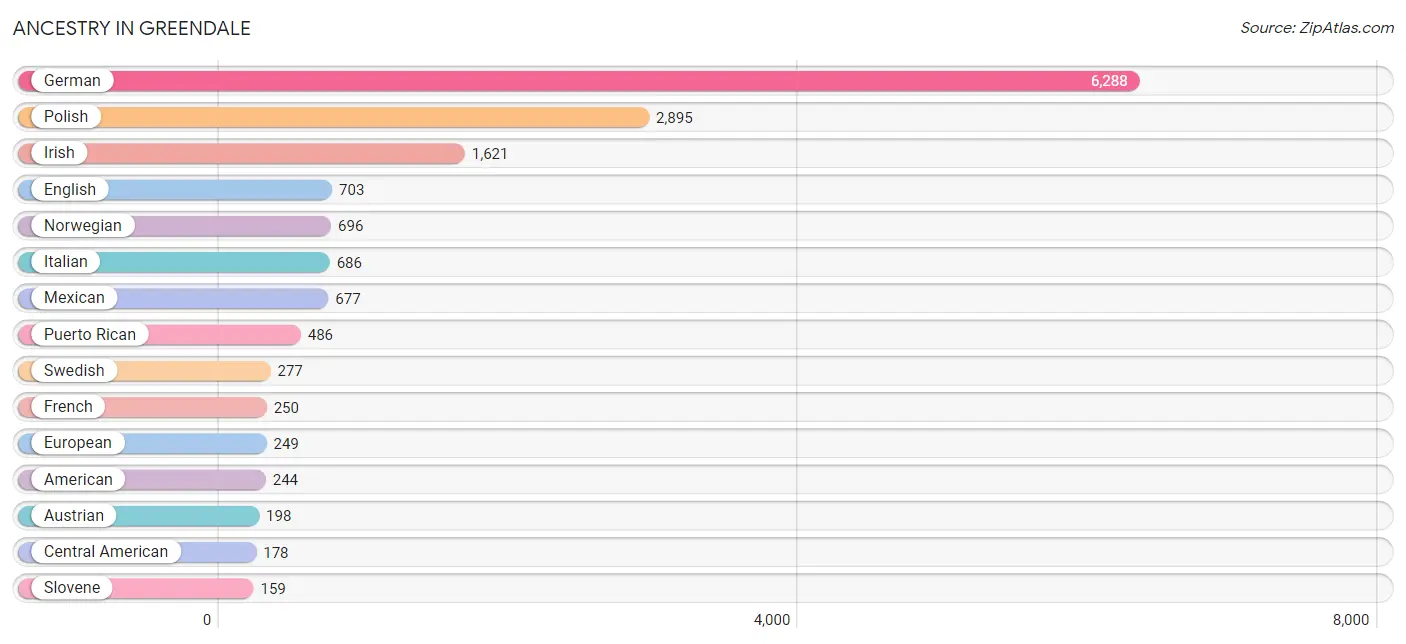
Ancestry in Greendale
The most populous ancestries reported in Greendale are German (6,288 | 42.7%), Polish (2,895 | 19.7%), Irish (1,621 | 11.0%), English (703 | 4.8%), and Norwegian (696 | 4.7%), together accounting for 82.9% of all Greendale residents.
| Ancestry | # Population | % Population |
| African | 91 | 0.6% |
| American | 244 | 1.7% |
| Arab | 28 | 0.2% |
| Austrian | 198 | 1.3% |
| Bangladeshi | 14 | 0.1% |
| Belgian | 82 | 0.6% |
| Bhutanese | 13 | 0.1% |
| Blackfeet | 20 | 0.1% |
| British | 50 | 0.3% |
| Bulgarian | 11 | 0.1% |
| Canadian | 42 | 0.3% |
| Central American | 178 | 1.2% |
| Central American Indian | 19 | 0.1% |
| Colombian | 14 | 0.1% |
| Croatian | 158 | 1.1% |
| Czech | 104 | 0.7% |
| Danish | 143 | 1.0% |
| Dutch | 84 | 0.6% |
| Eastern European | 53 | 0.4% |
| Ecuadorian | 16 | 0.1% |
| English | 703 | 4.8% |
| European | 249 | 1.7% |
| Finnish | 108 | 0.7% |
| French | 250 | 1.7% |
| French Canadian | 50 | 0.3% |
| German | 6,288 | 42.7% |
| Greek | 75 | 0.5% |
| Guamanian / Chamorro | 4 | 0.0% |
| Guatemalan | 66 | 0.4% |
| Honduran | 72 | 0.5% |
| Hungarian | 66 | 0.4% |
| Indian (Asian) | 123 | 0.8% |
| Indonesian | 22 | 0.2% |
| Irish | 1,621 | 11.0% |
| Iroquois | 39 | 0.3% |
| Italian | 686 | 4.7% |
| Jordanian | 25 | 0.2% |
| Korean | 98 | 0.7% |
| Lithuanian | 20 | 0.1% |
| Luxembourger | 10 | 0.1% |
| Mexican | 677 | 4.6% |
| Mexican American Indian | 21 | 0.1% |
| Northern European | 14 | 0.1% |
| Norwegian | 696 | 4.7% |
| Pakistani | 50 | 0.3% |
| Polish | 2,895 | 19.7% |
| Puerto Rican | 486 | 3.3% |
| Romanian | 23 | 0.2% |
| Russian | 30 | 0.2% |
| Salvadoran | 40 | 0.3% |
| Scandinavian | 100 | 0.7% |
| Scotch-Irish | 23 | 0.2% |
| Scottish | 99 | 0.7% |
| Serbian | 11 | 0.1% |
| Sioux | 4 | 0.0% |
| Slavic | 7 | 0.1% |
| Slovak | 29 | 0.2% |
| Slovene | 159 | 1.1% |
| South African | 40 | 0.3% |
| South American | 30 | 0.2% |
| Sri Lankan | 27 | 0.2% |
| Subsaharan African | 131 | 0.9% |
| Swedish | 277 | 1.9% |
| Swiss | 71 | 0.5% |
| Thai | 97 | 0.7% |
| Ukrainian | 101 | 0.7% |
| Vietnamese | 43 | 0.3% |
| Welsh | 64 | 0.4% |
| Yugoslavian | 26 | 0.2% | View All 69 Rows |
Immigrants in Greendale
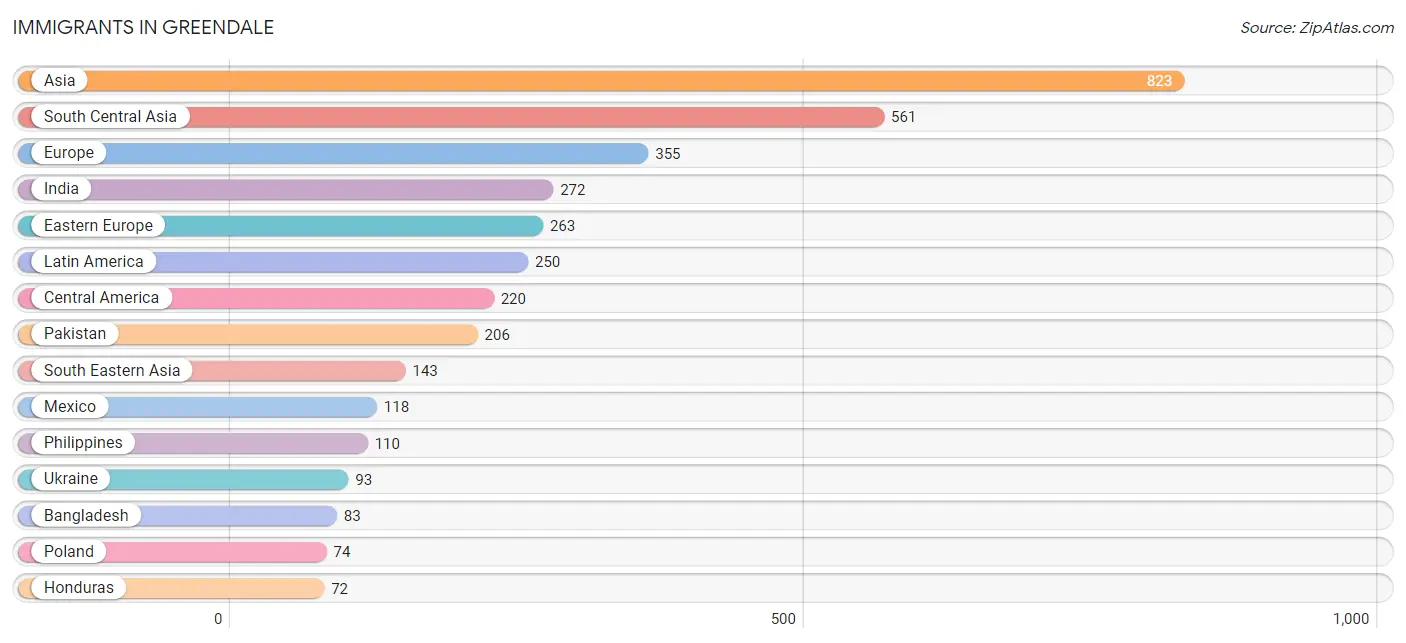
The most numerous immigrant groups reported in Greendale came from Asia (823 | 5.6%), South Central Asia (561 | 3.8%), Europe (355 | 2.4%), India (272 | 1.8%), and Eastern Europe (263 | 1.8%), together accounting for 15.4% of all Greendale residents.
| Immigration Origin | # Population | % Population |
| Africa | 54 | 0.4% |
| Asia | 823 | 5.6% |
| Bangladesh | 83 | 0.6% |
| Belgium | 1 | 0.0% |
| Bulgaria | 11 | 0.1% |
| Canada | 14 | 0.1% |
| Central America | 220 | 1.5% |
| China | 58 | 0.4% |
| Colombia | 14 | 0.1% |
| Croatia | 42 | 0.3% |
| Czechoslovakia | 10 | 0.1% |
| Eastern Africa | 16 | 0.1% |
| Eastern Asia | 65 | 0.4% |
| Eastern Europe | 263 | 1.8% |
| Ecuador | 16 | 0.1% |
| El Salvador | 13 | 0.1% |
| Europe | 355 | 2.4% |
| Germany | 1 | 0.0% |
| Greece | 14 | 0.1% |
| Guatemala | 17 | 0.1% |
| Honduras | 72 | 0.5% |
| India | 272 | 1.8% |
| Ireland | 19 | 0.1% |
| Jordan | 25 | 0.2% |
| Korea | 7 | 0.1% |
| Latin America | 250 | 1.7% |
| Mexico | 118 | 0.8% |
| Netherlands | 23 | 0.2% |
| Northern Europe | 31 | 0.2% |
| Pakistan | 206 | 1.4% |
| Philippines | 110 | 0.7% |
| Poland | 74 | 0.5% |
| Romania | 33 | 0.2% |
| South Africa | 14 | 0.1% |
| South America | 30 | 0.2% |
| South Central Asia | 561 | 3.8% |
| South Eastern Asia | 143 | 1.0% |
| Southern Europe | 14 | 0.1% |
| Thailand | 11 | 0.1% |
| Uganda | 16 | 0.1% |
| Ukraine | 93 | 0.6% |
| Western Asia | 54 | 0.4% |
| Western Europe | 25 | 0.2% | View All 43 Rows |
Sex and Age in Greendale
Sex and Age in Greendale
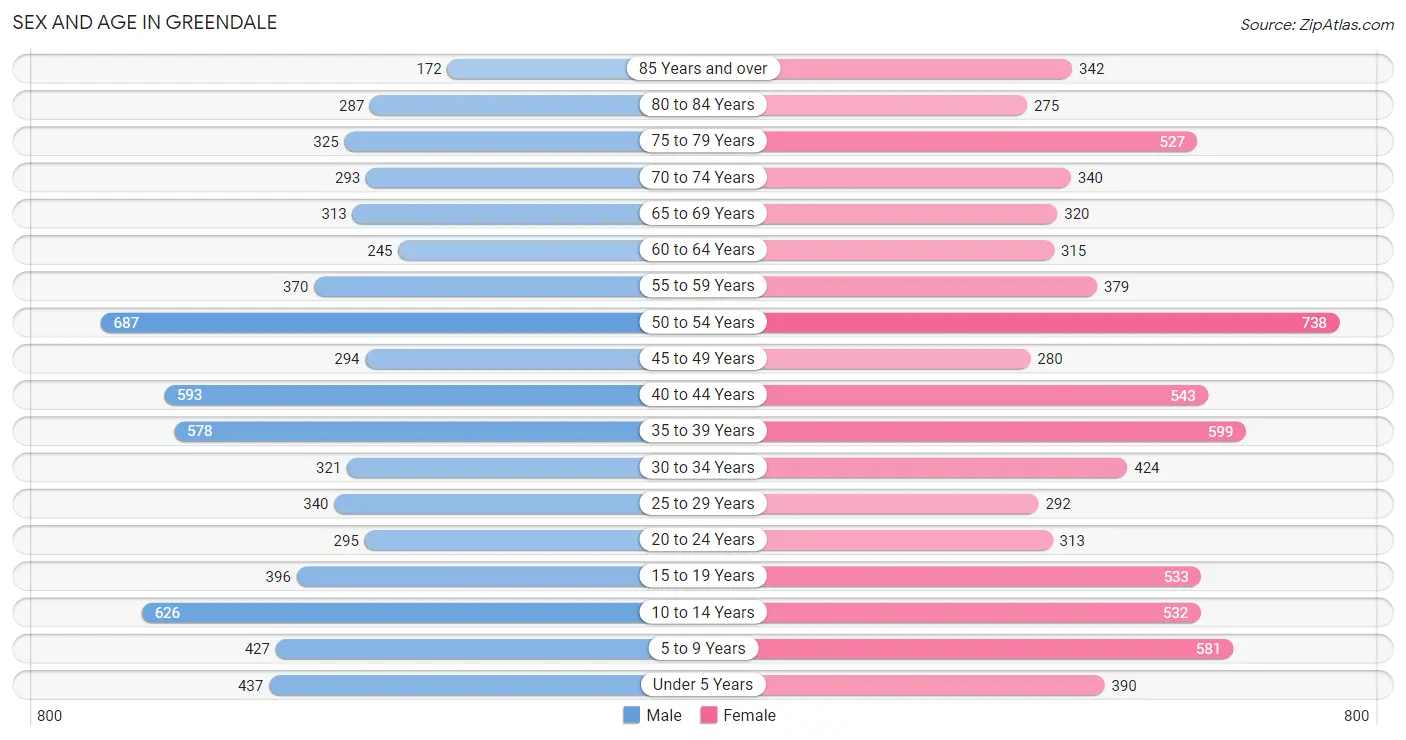
The most populous age groups in Greendale are 50 to 54 Years (687 | 9.8%) for men and 50 to 54 Years (738 | 9.6%) for women.
| Age Bracket | Male | Female |
| Under 5 Years | 437 (6.2%) | 390 (5.1%) |
| 5 to 9 Years | 427 (6.1%) | 581 (7.5%) |
| 10 to 14 Years | 626 (8.9%) | 532 (6.9%) |
| 15 to 19 Years | 396 (5.7%) | 533 (6.9%) |
| 20 to 24 Years | 295 (4.2%) | 313 (4.1%) |
| 25 to 29 Years | 340 (4.9%) | 292 (3.8%) |
| 30 to 34 Years | 321 (4.6%) | 424 (5.5%) |
| 35 to 39 Years | 578 (8.3%) | 599 (7.8%) |
| 40 to 44 Years | 593 (8.5%) | 543 (7.0%) |
| 45 to 49 Years | 294 (4.2%) | 280 (3.6%) |
| 50 to 54 Years | 687 (9.8%) | 738 (9.6%) |
| 55 to 59 Years | 370 (5.3%) | 379 (4.9%) |
| 60 to 64 Years | 245 (3.5%) | 315 (4.1%) |
| 65 to 69 Years | 313 (4.5%) | 320 (4.1%) |
| 70 to 74 Years | 293 (4.2%) | 340 (4.4%) |
| 75 to 79 Years | 325 (4.6%) | 527 (6.8%) |
| 80 to 84 Years | 287 (4.1%) | 275 (3.6%) |
| 85 Years and over | 172 (2.5%) | 342 (4.4%) |
| Total | 6,999 (100.0%) | 7,723 (100.0%) |
Families and Households in Greendale
Median Family Size in Greendale
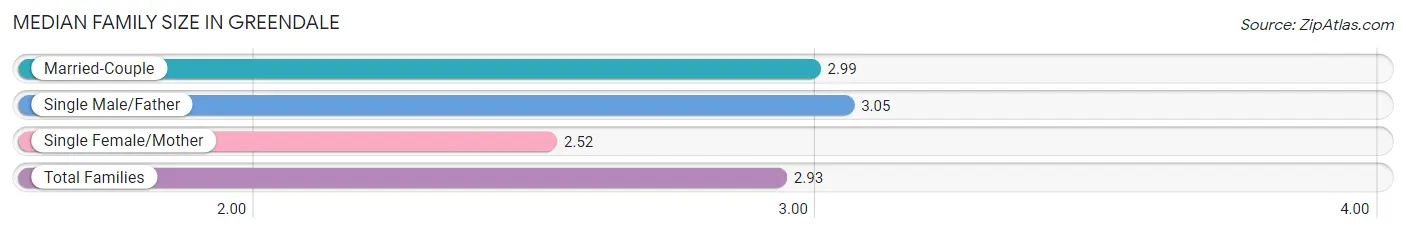
The median family size in Greendale is 2.93 persons per family, with single male/father families (328 | 8.1%) accounting for the largest median family size of 3.05 persons per family. On the other hand, single female/mother families (584 | 14.4%) represent the smallest median family size with 2.52 persons per family.
| Family Type | # Families | Family Size |
| Married-Couple | 3,146 (77.5%) | 2.99 |
| Single Male/Father | 328 (8.1%) | 3.05 |
| Single Female/Mother | 584 (14.4%) | 2.52 |
| Total Families | 4,058 (100.0%) | 2.93 |
Median Household Size in Greendale
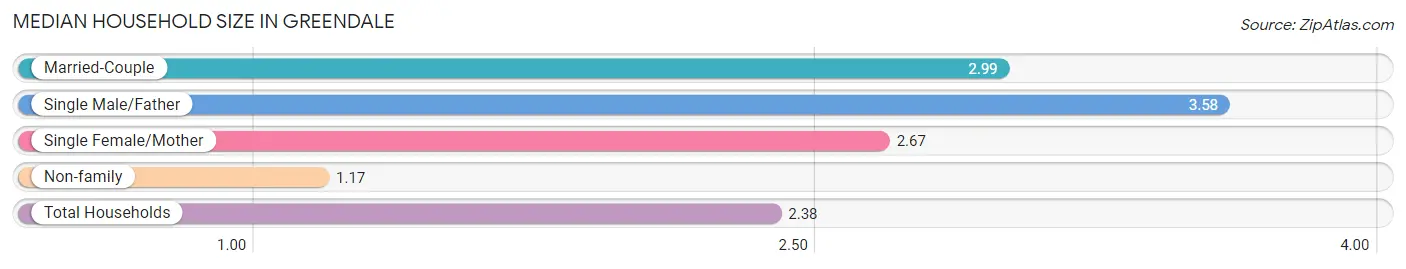
The median household size in Greendale is 2.38 persons per household, with single male/father households (328 | 5.3%) accounting for the largest median household size of 3.58 persons per household. non-family households (2,082 | 33.9%) represent the smallest median household size with 1.17 persons per household.
| Household Type | # Households | Household Size |
| Married-Couple | 3,146 (51.2%) | 2.99 |
| Single Male/Father | 328 (5.3%) | 3.58 |
| Single Female/Mother | 584 (9.5%) | 2.67 |
| Non-family | 2,082 (33.9%) | 1.17 |
| Total Households | 6,140 (100.0%) | 2.38 |
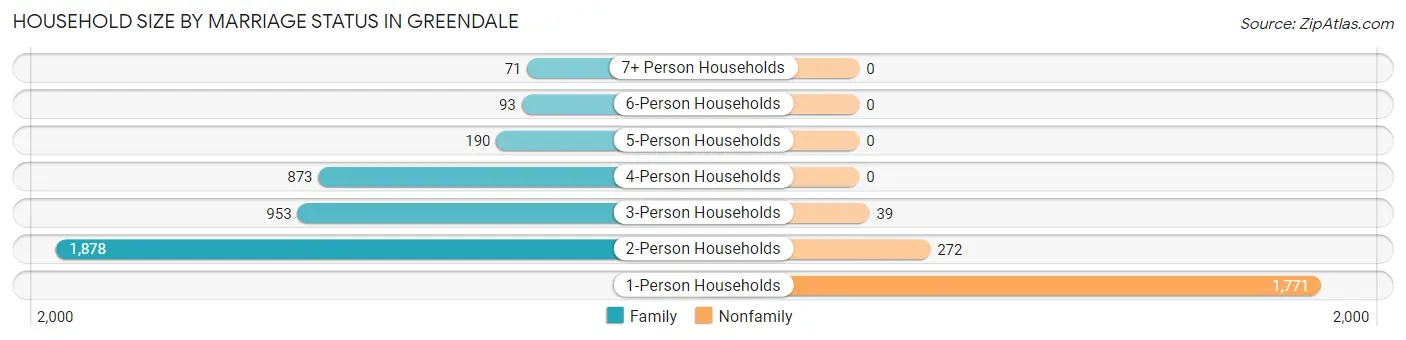
Household Size by Marriage Status in Greendale
Out of a total of 6,140 households in Greendale, 4,058 (66.1%) are family households, while 2,082 (33.9%) are nonfamily households. The most numerous type of family households are 2-person households, comprising 1,878, and the most common type of nonfamily households are 1-person households, comprising 1,771.
| Household Size | Family Households | Nonfamily Households |
| 1-Person Households | - | 1,771 (28.8%) |
| 2-Person Households | 1,878 (30.6%) | 272 (4.4%) |
| 3-Person Households | 953 (15.5%) | 39 (0.6%) |
| 4-Person Households | 873 (14.2%) | 0 (0.0%) |
| 5-Person Households | 190 (3.1%) | 0 (0.0%) |
| 6-Person Households | 93 (1.5%) | 0 (0.0%) |
| 7+ Person Households | 71 (1.2%) | 0 (0.0%) |
| Total | 4,058 (66.1%) | 2,082 (33.9%) |
Female Fertility in Greendale
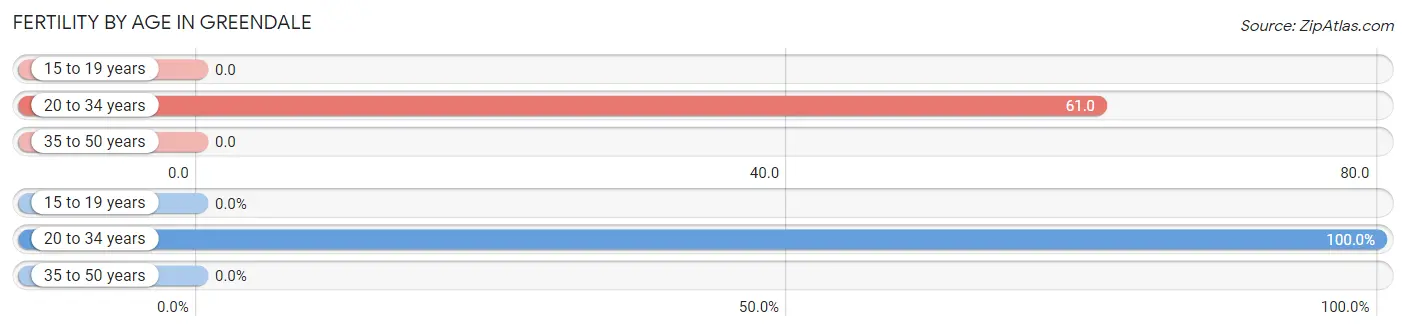
Fertility by Age in Greendale
Average fertility rate in Greendale is 20.0 births per 1,000 women. Women in the age bracket of 20 to 34 years have the highest fertility rate with 61.0 births per 1,000 women. Women in the age bracket of 20 to 34 years acount for 100.0% of all women with births.
| Age Bracket | Women with Births | Births / 1,000 Women |
| 15 to 19 years | 0 (0.0%) | 0.0 |
| 20 to 34 years | 63 (100.0%) | 61.0 |
| 35 to 50 years | 0 (0.0%) | 0.0 |
| Total | 63 (100.0%) | 20.0 |
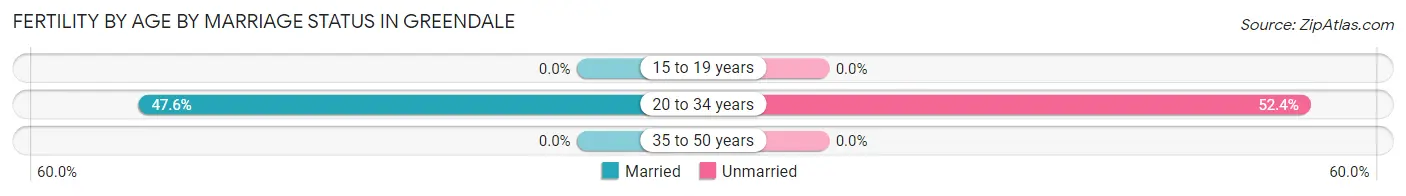
Fertility by Age by Marriage Status in Greendale
47.6% of women with births (63) in Greendale are married. The highest percentage of unmarried women with births falls into 20 to 34 years age bracket with 52.4% of them unmarried at the time of birth, while the lowest percentage of unmarried women with births belong to 20 to 34 years age bracket with 52.4% of them unmarried.
| Age Bracket | Married | Unmarried |
| 15 to 19 years | 0 (0.0%) | 0 (0.0%) |
| 20 to 34 years | 30 (47.6%) | 33 (52.4%) |
| 35 to 50 years | 0 (0.0%) | 0 (0.0%) |
| Total | 30 (47.6%) | 33 (52.4%) |
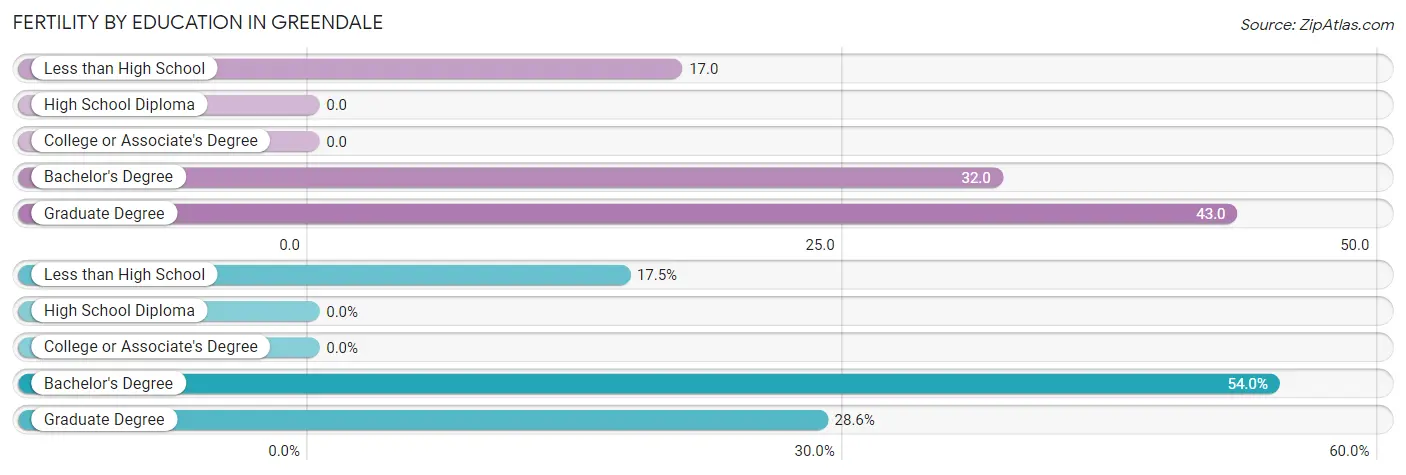
Fertility by Education in Greendale
| Educational Attainment | Women with Births | Births / 1,000 Women |
| Less than High School | 11 (17.5%) | 17.0 |
| High School Diploma | 0 (0.0%) | 0.0 |
| College or Associate's Degree | 0 (0.0%) | 0.0 |
| Bachelor's Degree | 34 (54.0%) | 32.0 |
| Graduate Degree | 18 (28.6%) | 43.0 |
| Total | 63 (100.0%) | 20.0 |
Fertility by Education by Marriage Status in Greendale
52.4% of women with births in Greendale are unmarried. Women with the educational attainment of less than high school are most likely to be married with 100.0% of them married at childbirth, while women with the educational attainment of bachelor's degree are least likely to be married with 97.1% of them unmarried at childbirth.
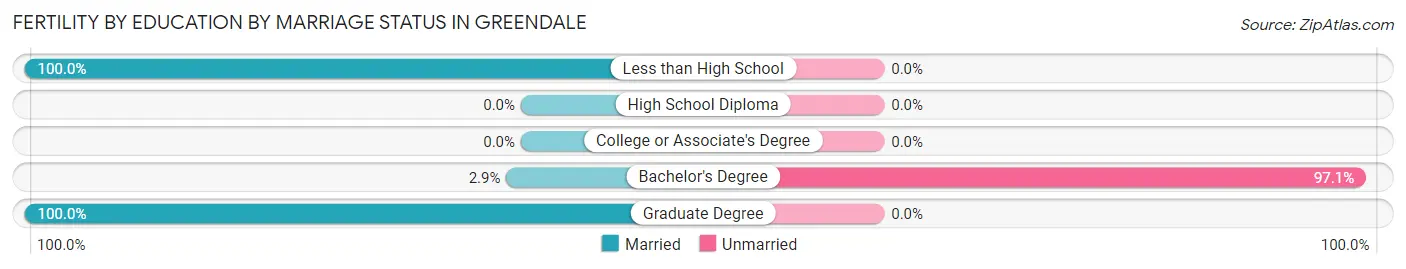
| Educational Attainment | Married | Unmarried |
| Less than High School | 11 (100.0%) | 0 (0.0%) |
| High School Diploma | 0 (0.0%) | 0 (0.0%) |
| College or Associate's Degree | 0 (0.0%) | 0 (0.0%) |
| Bachelor's Degree | 1 (2.9%) | 33 (97.1%) |
| Graduate Degree | 18 (100.0%) | 0 (0.0%) |
| Total | 30 (47.6%) | 33 (52.4%) |
Employment Characteristics in Greendale
Employment by Class of Employer in Greendale
Among the 7,048 employed individuals in Greendale, private company employees (4,815 | 68.3%), not-for-profit organizations (961 | 13.6%), and local government employees (499 | 7.1%) make up the most common classes of employment.
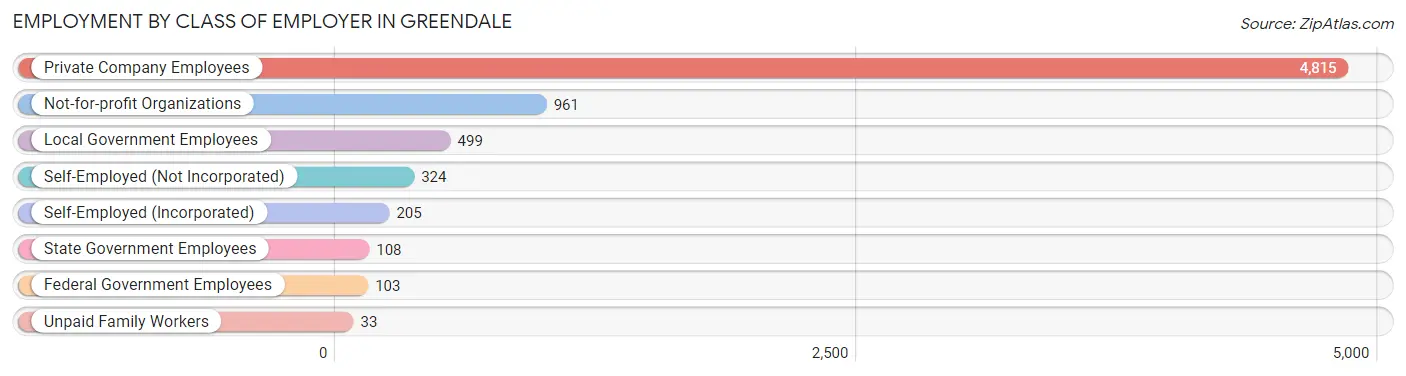
| Employer Class | # Employees | % Employees |
| Private Company Employees | 4,815 | 68.3% |
| Self-Employed (Incorporated) | 205 | 2.9% |
| Self-Employed (Not Incorporated) | 324 | 4.6% |
| Not-for-profit Organizations | 961 | 13.6% |
| Local Government Employees | 499 | 7.1% |
| State Government Employees | 108 | 1.5% |
| Federal Government Employees | 103 | 1.5% |
| Unpaid Family Workers | 33 | 0.5% |
| Total | 7,048 | 100.0% |
Employment Status by Age in Greendale
According to the labor force statistics for Greendale, out of the total population over 16 years of age (11,480), 64.4% or 7,393 individuals are in the labor force, with 2.5% or 185 of them unemployed. The age group with the highest labor force participation rate is 35 to 44 years, with 93.0% or 2,151 individuals in the labor force. Within the labor force, the 16 to 19 years age range has the highest percentage of unemployed individuals, with 11.0% or 35 of them being unemployed.
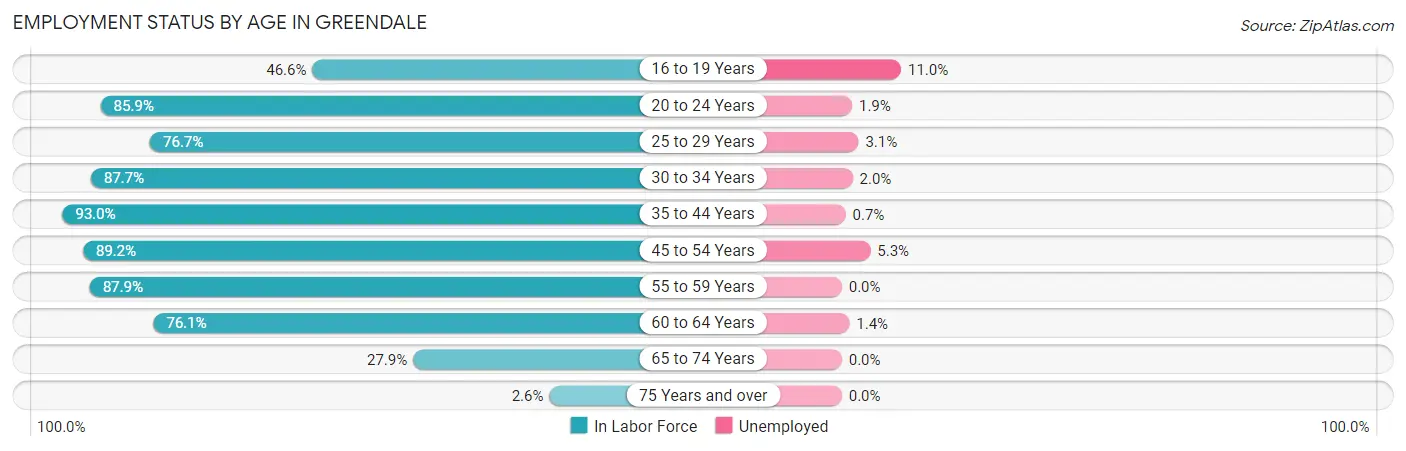
| Age Bracket | In Labor Force | Unemployed |
| 16 to 19 Years | 317 (46.6%) | 35 (11.0%) |
| 20 to 24 Years | 522 (85.9%) | 10 (1.9%) |
| 25 to 29 Years | 485 (76.7%) | 15 (3.1%) |
| 30 to 34 Years | 653 (87.7%) | 13 (2.0%) |
| 35 to 44 Years | 2,151 (93.0%) | 15 (0.7%) |
| 45 to 54 Years | 1,783 (89.2%) | 94 (5.3%) |
| 55 to 59 Years | 658 (87.9%) | 0 (0.0%) |
| 60 to 64 Years | 426 (76.1%) | 6 (1.4%) |
| 65 to 74 Years | 353 (27.9%) | 0 (0.0%) |
| 75 Years and over | 50 (2.6%) | 0 (0.0%) |
| Total | 7,393 (64.4%) | 185 (2.5%) |
Employment Status by Educational Attainment in Greendale
According to labor force statistics for Greendale, 88.0% of individuals (6,158) out of the total population between 25 and 64 years of age (6,998) are in the labor force, with 2.3% or 142 of them being unemployed. The group with the highest labor force participation rate are those with the educational attainment of bachelor's degree or higher, with 90.9% or 3,362 individuals in the labor force. Within the labor force, individuals with high school diploma education have the highest percentage of unemployment, with 7.0% or 62 of them being unemployed.
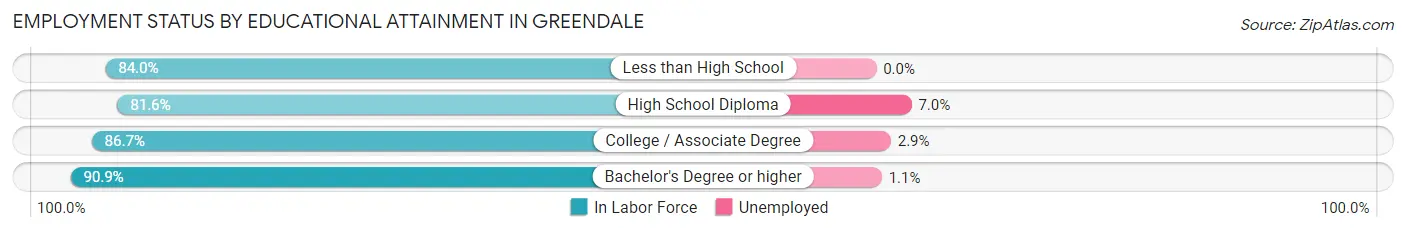
| Educational Attainment | In Labor Force | Unemployed |
| Less than High School | 342 (84.0%) | 0 (0.0%) |
| High School Diploma | 885 (81.6%) | 76 (7.0%) |
| College / Associate Degree | 1,567 (86.7%) | 52 (2.9%) |
| Bachelor's Degree or higher | 3,362 (90.9%) | 41 (1.1%) |
| Total | 6,158 (88.0%) | 161 (2.3%) |
Employment Occupations by Sex in Greendale
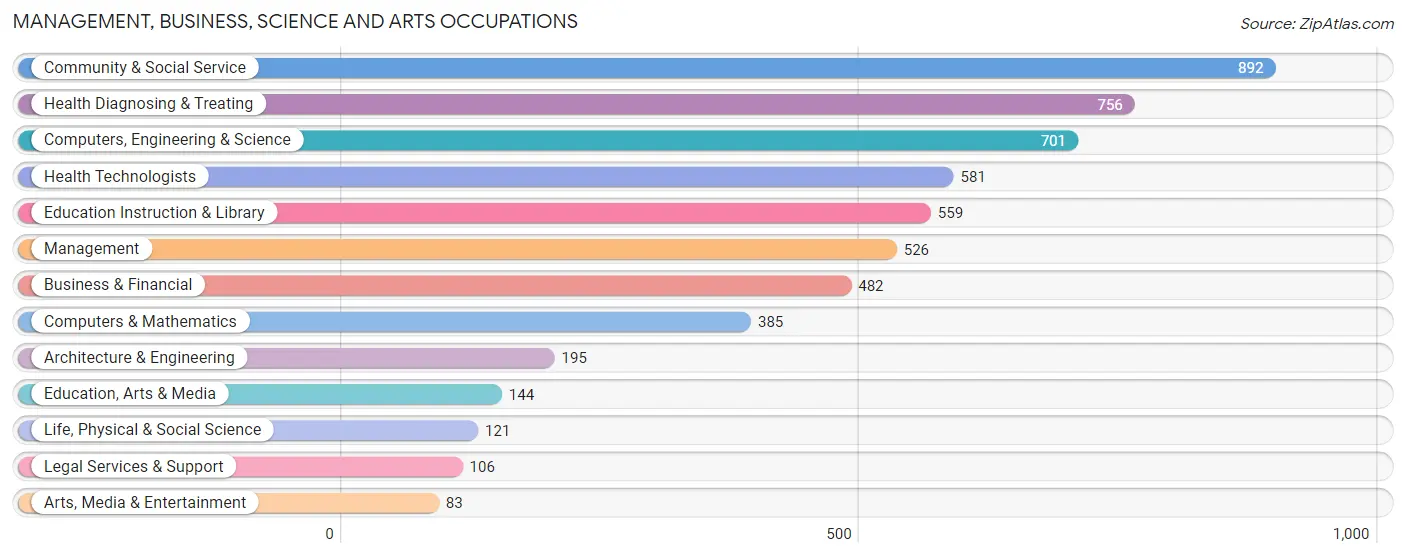
Management, Business, Science and Arts Occupations
The most common Management, Business, Science and Arts occupations in Greendale are Community & Social Service (892 | 12.4%), Health Diagnosing & Treating (756 | 10.5%), Computers, Engineering & Science (701 | 9.7%), Health Technologists (581 | 8.1%), and Education Instruction & Library (559 | 7.8%).
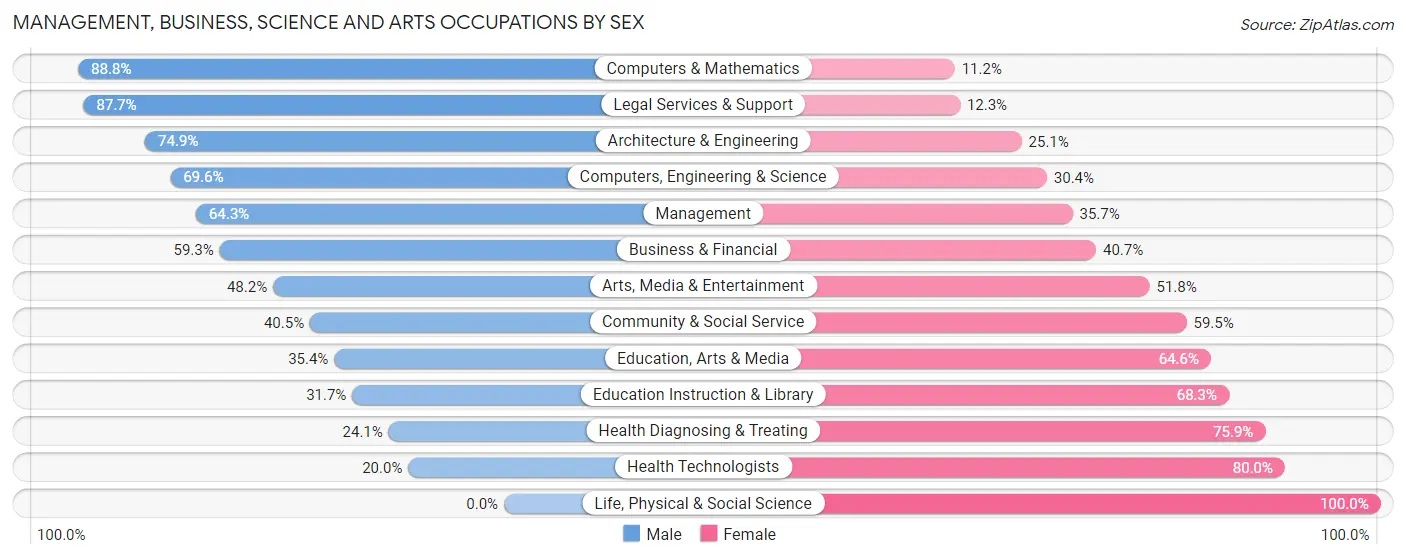
Management, Business, Science and Arts Occupations by Sex
Within the Management, Business, Science and Arts occupations in Greendale, the most male-oriented occupations are Computers & Mathematics (88.8%), Legal Services & Support (87.7%), and Architecture & Engineering (74.9%), while the most female-oriented occupations are Life, Physical & Social Science (100.0%), Health Technologists (80.0%), and Health Diagnosing & Treating (75.9%).
| Occupation | Male | Female |
| Management | 338 (64.3%) | 188 (35.7%) |
| Business & Financial | 286 (59.3%) | 196 (40.7%) |
| Computers, Engineering & Science | 488 (69.6%) | 213 (30.4%) |
| Computers & Mathematics | 342 (88.8%) | 43 (11.2%) |
| Architecture & Engineering | 146 (74.9%) | 49 (25.1%) |
| Life, Physical & Social Science | 0 (0.0%) | 121 (100.0%) |
| Community & Social Service | 361 (40.5%) | 531 (59.5%) |
| Education, Arts & Media | 51 (35.4%) | 93 (64.6%) |
| Legal Services & Support | 93 (87.7%) | 13 (12.3%) |
| Education Instruction & Library | 177 (31.7%) | 382 (68.3%) |
| Arts, Media & Entertainment | 40 (48.2%) | 43 (51.8%) |
| Health Diagnosing & Treating | 182 (24.1%) | 574 (75.9%) |
| Health Technologists | 116 (20.0%) | 465 (80.0%) |
| Total (Category) | 1,655 (49.3%) | 1,702 (50.7%) |
| Total (Overall) | 3,659 (50.8%) | 3,547 (49.2%) |
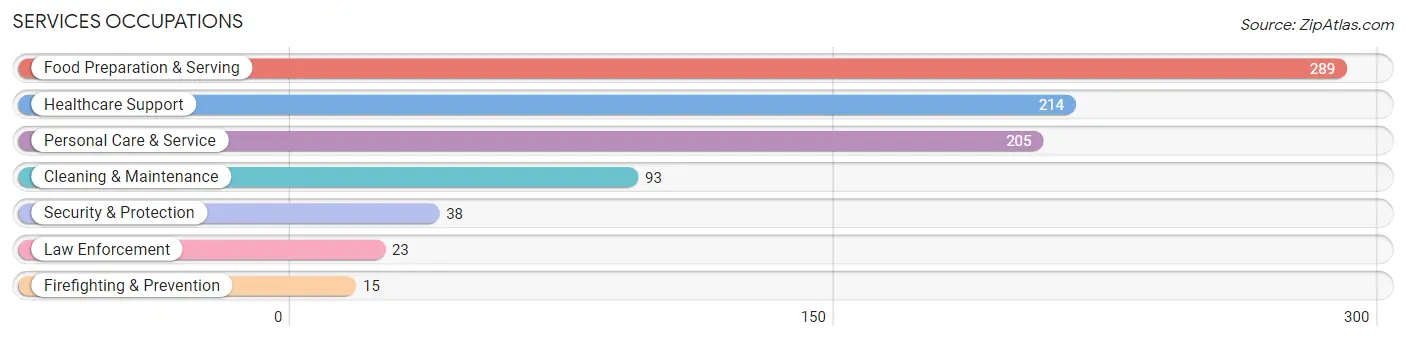
Services Occupations
The most common Services occupations in Greendale are Food Preparation & Serving (289 | 4.0%), Healthcare Support (214 | 3.0%), Personal Care & Service (205 | 2.8%), Cleaning & Maintenance (93 | 1.3%), and Security & Protection (38 | 0.5%).
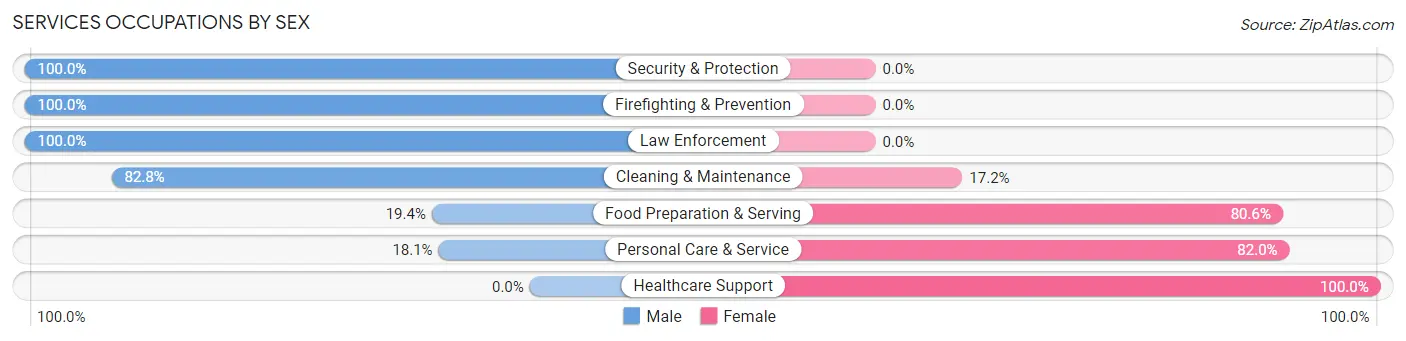
Services Occupations by Sex
Within the Services occupations in Greendale, the most male-oriented occupations are Security & Protection (100.0%), Firefighting & Prevention (100.0%), and Law Enforcement (100.0%), while the most female-oriented occupations are Healthcare Support (100.0%), Personal Care & Service (82.0%), and Food Preparation & Serving (80.6%).
| Occupation | Male | Female |
| Healthcare Support | 0 (0.0%) | 214 (100.0%) |
| Security & Protection | 38 (100.0%) | 0 (0.0%) |
| Firefighting & Prevention | 15 (100.0%) | 0 (0.0%) |
| Law Enforcement | 23 (100.0%) | 0 (0.0%) |
| Food Preparation & Serving | 56 (19.4%) | 233 (80.6%) |
| Cleaning & Maintenance | 77 (82.8%) | 16 (17.2%) |
| Personal Care & Service | 37 (18.0%) | 168 (82.0%) |
| Total (Category) | 208 (24.8%) | 631 (75.2%) |
| Total (Overall) | 3,659 (50.8%) | 3,547 (49.2%) |
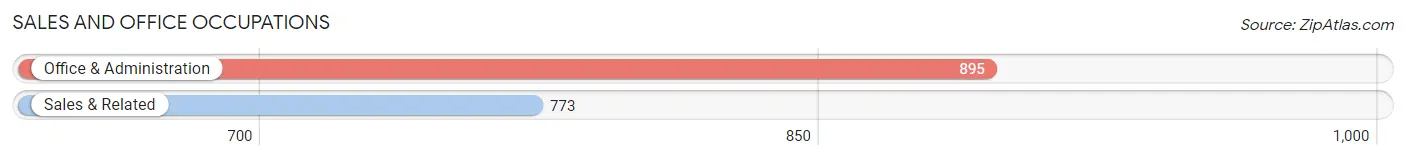
Sales and Office Occupations
The most common Sales and Office occupations in Greendale are Office & Administration (895 | 12.4%), and Sales & Related (773 | 10.7%).
Sales and Office Occupations by Sex
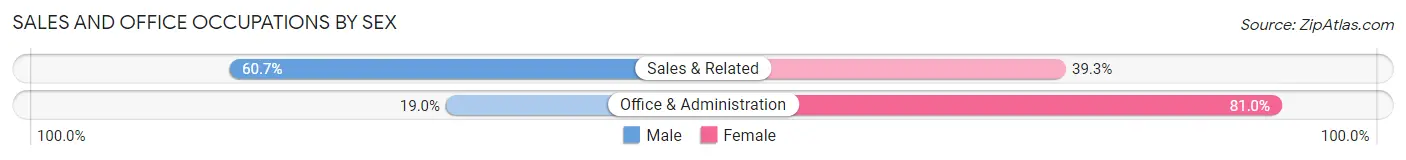
| Occupation | Male | Female |
| Sales & Related | 469 (60.7%) | 304 (39.3%) |
| Office & Administration | 170 (19.0%) | 725 (81.0%) |
| Total (Category) | 639 (38.3%) | 1,029 (61.7%) |
| Total (Overall) | 3,659 (50.8%) | 3,547 (49.2%) |
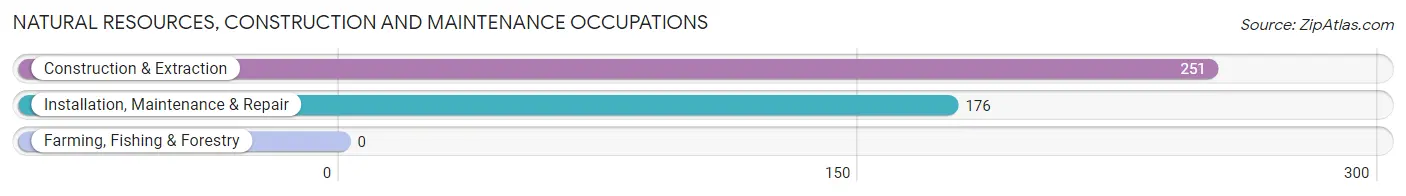
Natural Resources, Construction and Maintenance Occupations
The most common Natural Resources, Construction and Maintenance occupations in Greendale are Construction & Extraction (251 | 3.5%), and Installation, Maintenance & Repair (176 | 2.4%).
Natural Resources, Construction and Maintenance Occupations by Sex
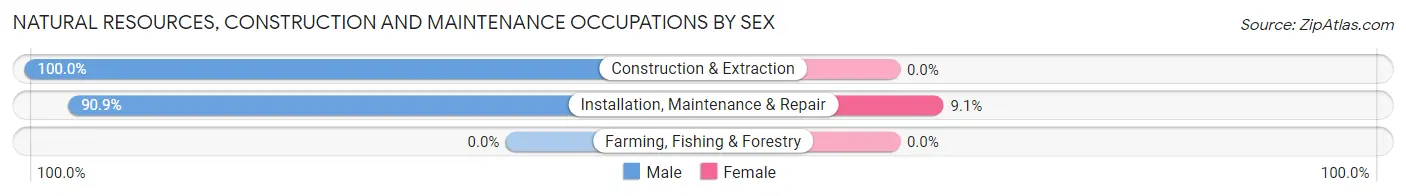
| Occupation | Male | Female |
| Farming, Fishing & Forestry | 0 (0.0%) | 0 (0.0%) |
| Construction & Extraction | 251 (100.0%) | 0 (0.0%) |
| Installation, Maintenance & Repair | 160 (90.9%) | 16 (9.1%) |
| Total (Category) | 411 (96.3%) | 16 (3.7%) |
| Total (Overall) | 3,659 (50.8%) | 3,547 (49.2%) |
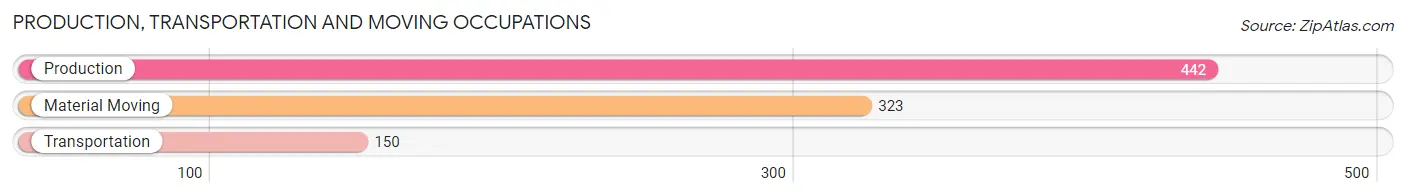
Production, Transportation and Moving Occupations
The most common Production, Transportation and Moving occupations in Greendale are Production (442 | 6.1%), Material Moving (323 | 4.5%), and Transportation (150 | 2.1%).
Production, Transportation and Moving Occupations by Sex
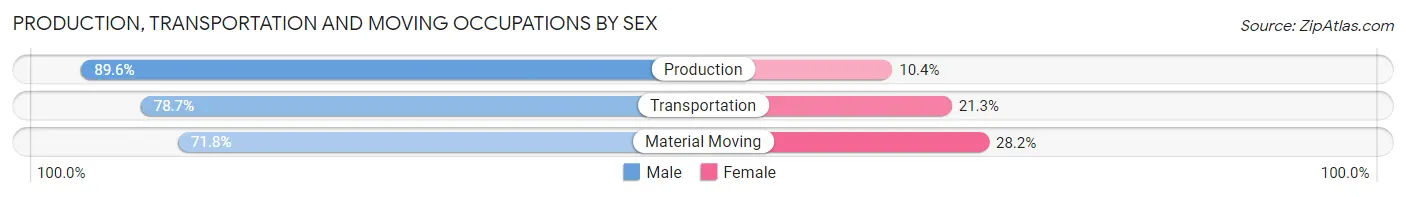
| Occupation | Male | Female |
| Production | 396 (89.6%) | 46 (10.4%) |
| Transportation | 118 (78.7%) | 32 (21.3%) |
| Material Moving | 232 (71.8%) | 91 (28.2%) |
| Total (Category) | 746 (81.5%) | 169 (18.5%) |
| Total (Overall) | 3,659 (50.8%) | 3,547 (49.2%) |
Employment Industries by Sex in Greendale
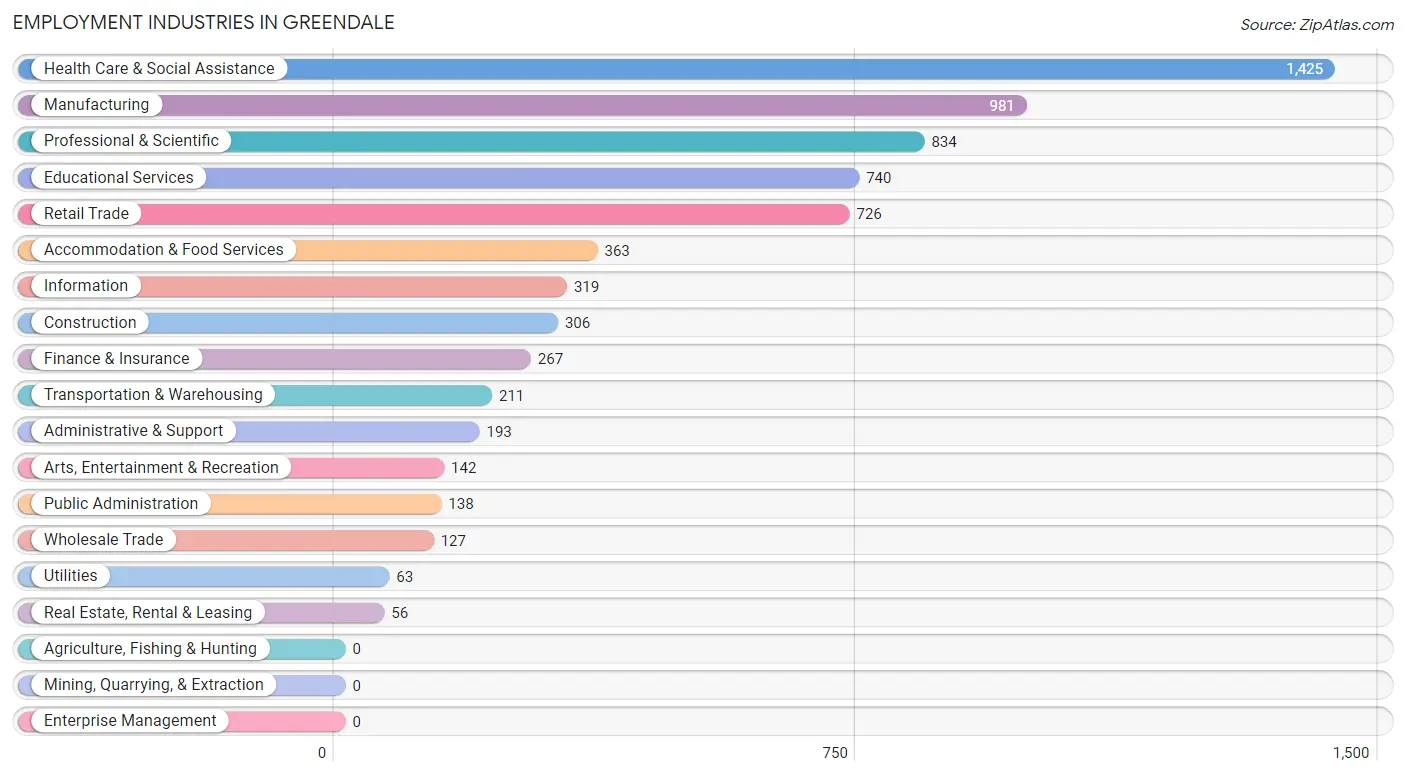
Employment Industries in Greendale
The major employment industries in Greendale include Health Care & Social Assistance (1,425 | 19.8%), Manufacturing (981 | 13.6%), Professional & Scientific (834 | 11.6%), Educational Services (740 | 10.3%), and Retail Trade (726 | 10.1%).
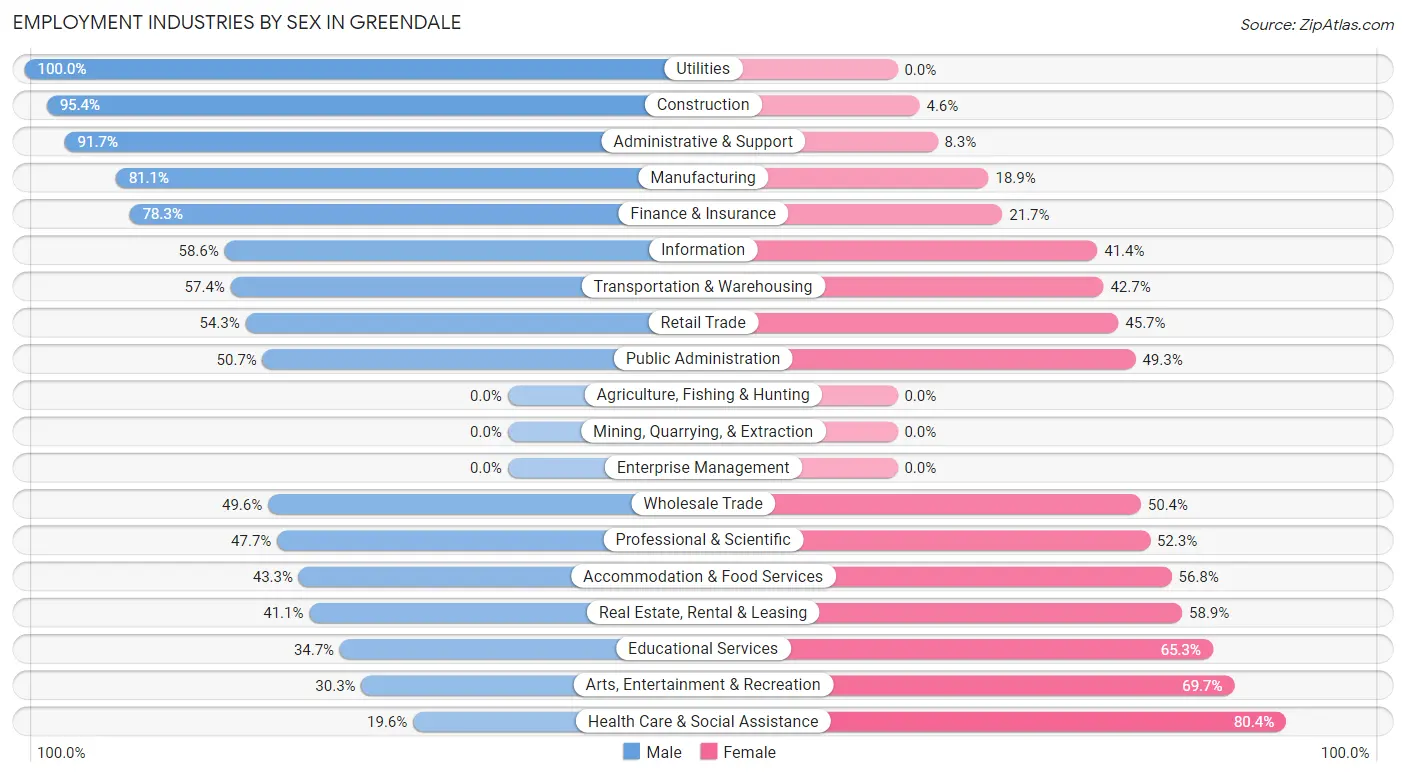
Employment Industries by Sex in Greendale
The Greendale industries that see more men than women are Utilities (100.0%), Construction (95.4%), and Administrative & Support (91.7%), whereas the industries that tend to have a higher number of women are Health Care & Social Assistance (80.4%), Arts, Entertainment & Recreation (69.7%), and Educational Services (65.3%).
| Industry | Male | Female |
| Agriculture, Fishing & Hunting | 0 (0.0%) | 0 (0.0%) |
| Mining, Quarrying, & Extraction | 0 (0.0%) | 0 (0.0%) |
| Construction | 292 (95.4%) | 14 (4.6%) |
| Manufacturing | 796 (81.1%) | 185 (18.9%) |
| Wholesale Trade | 63 (49.6%) | 64 (50.4%) |
| Retail Trade | 394 (54.3%) | 332 (45.7%) |
| Transportation & Warehousing | 121 (57.4%) | 90 (42.6%) |
| Utilities | 63 (100.0%) | 0 (0.0%) |
| Information | 187 (58.6%) | 132 (41.4%) |
| Finance & Insurance | 209 (78.3%) | 58 (21.7%) |
| Real Estate, Rental & Leasing | 23 (41.1%) | 33 (58.9%) |
| Professional & Scientific | 398 (47.7%) | 436 (52.3%) |
| Enterprise Management | 0 (0.0%) | 0 (0.0%) |
| Administrative & Support | 177 (91.7%) | 16 (8.3%) |
| Educational Services | 257 (34.7%) | 483 (65.3%) |
| Health Care & Social Assistance | 279 (19.6%) | 1,146 (80.4%) |
| Arts, Entertainment & Recreation | 43 (30.3%) | 99 (69.7%) |
| Accommodation & Food Services | 157 (43.2%) | 206 (56.8%) |
| Public Administration | 70 (50.7%) | 68 (49.3%) |
| Total | 3,659 (50.8%) | 3,547 (49.2%) |
Education in Greendale
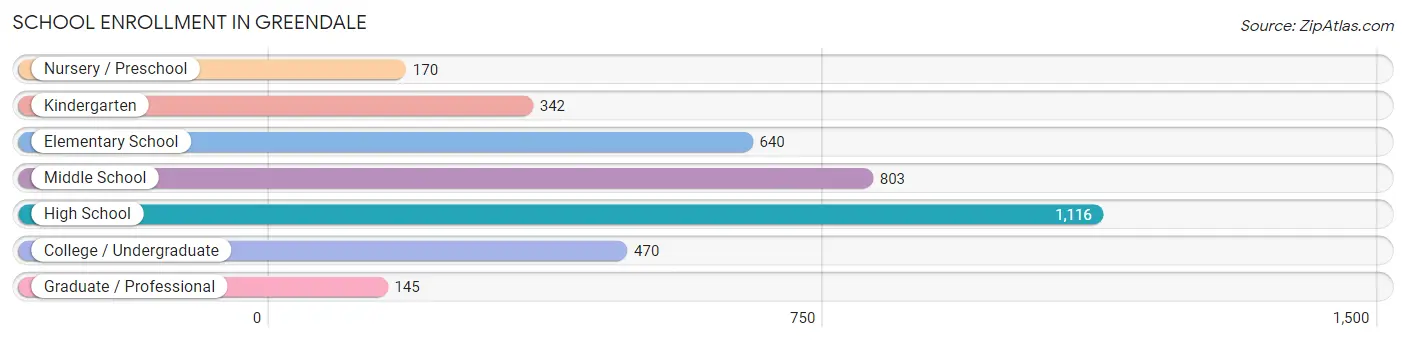
School Enrollment in Greendale
The most common levels of schooling among the 3,686 students in Greendale are high school (1,116 | 30.3%), middle school (803 | 21.8%), and elementary school (640 | 17.4%).
| School Level | # Students | % Students |
| Nursery / Preschool | 170 | 4.6% |
| Kindergarten | 342 | 9.3% |
| Elementary School | 640 | 17.4% |
| Middle School | 803 | 21.8% |
| High School | 1,116 | 30.3% |
| College / Undergraduate | 470 | 12.8% |
| Graduate / Professional | 145 | 3.9% |
| Total | 3,686 | 100.0% |
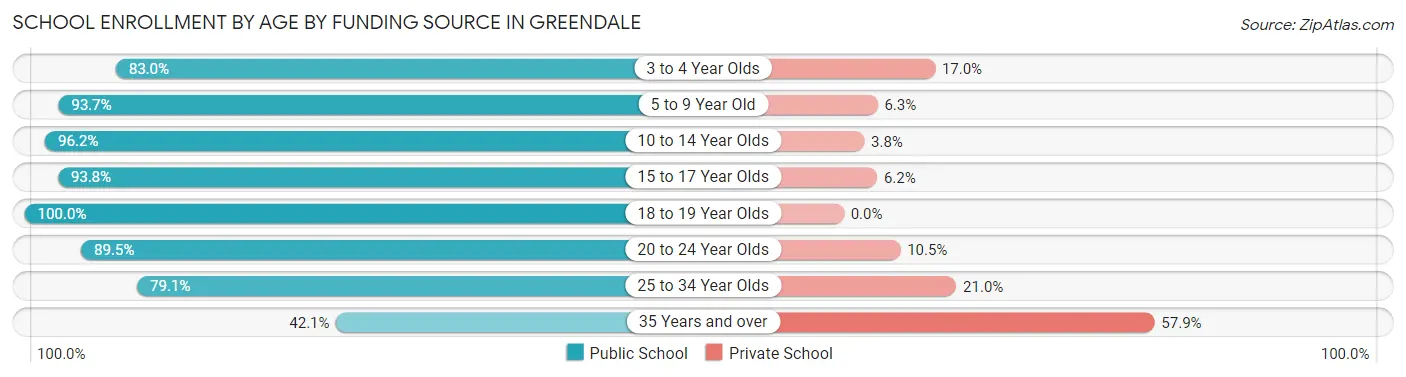
School Enrollment by Age by Funding Source in Greendale
Out of a total of 3,686 students who are enrolled in schools in Greendale, 383 (10.4%) attend a private institution, while the remaining 3,303 (89.6%) are enrolled in public schools. The age group of 35 years and over has the highest likelihood of being enrolled in private schools, with 158 (57.9% in the age bracket) enrolled. Conversely, the age group of 18 to 19 year olds has the lowest likelihood of being enrolled in a private school, with 135 (100.0% in the age bracket) attending a public institution.
| Age Bracket | Public School | Private School |
| 3 to 4 Year Olds | 166 (83.0%) | 34 (17.0%) |
| 5 to 9 Year Old | 849 (93.7%) | 57 (6.3%) |
| 10 to 14 Year Olds | 1,087 (96.2%) | 43 (3.8%) |
| 15 to 17 Year Olds | 696 (93.8%) | 46 (6.2%) |
| 18 to 19 Year Olds | 135 (100.0%) | 0 (0.0%) |
| 20 to 24 Year Olds | 136 (89.5%) | 16 (10.5%) |
| 25 to 34 Year Olds | 117 (79.0%) | 31 (20.9%) |
| 35 Years and over | 115 (42.1%) | 158 (57.9%) |
| Total | 3,303 (89.6%) | 383 (10.4%) |
Educational Attainment by Field of Study in Greendale
Business (1,005 | 18.7%), education (919 | 17.1%), science & technology (701 | 13.1%), bio, nature & agricultural (381 | 7.1%), and engineering (325 | 6.0%) are the most common fields of study among 5,373 individuals in Greendale who have obtained a bachelor's degree or higher.
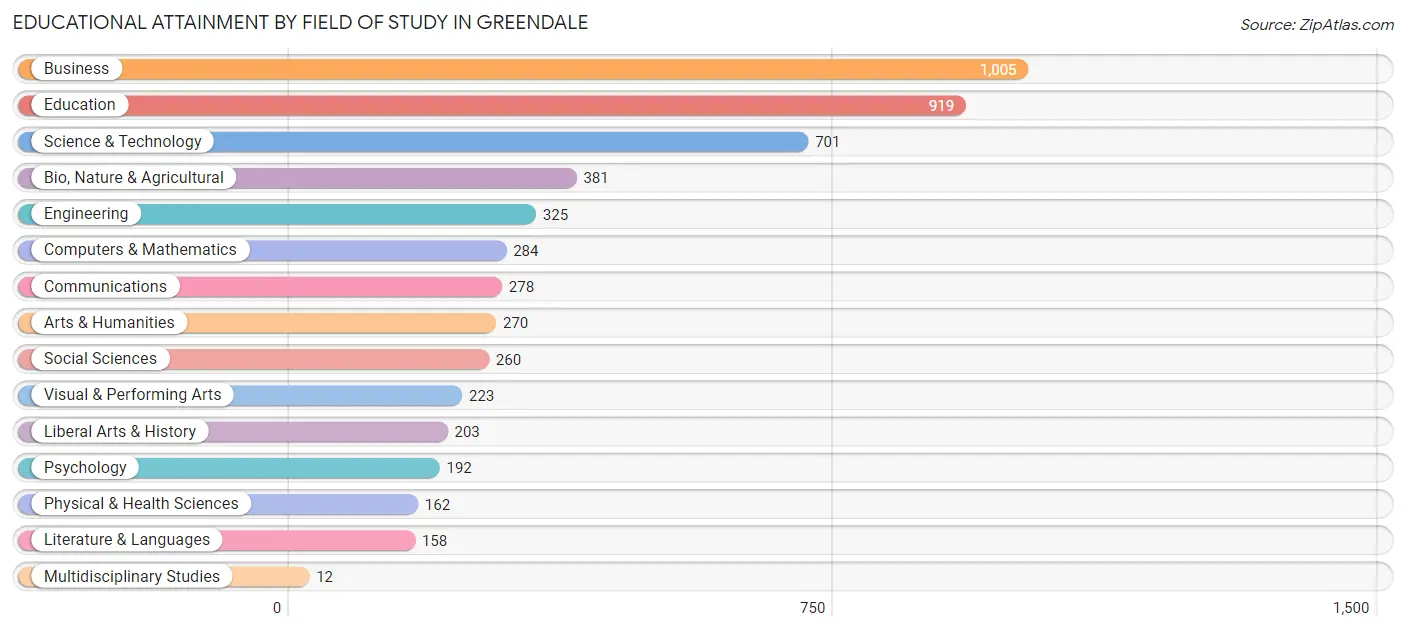
| Field of Study | # Graduates | % Graduates |
| Computers & Mathematics | 284 | 5.3% |
| Bio, Nature & Agricultural | 381 | 7.1% |
| Physical & Health Sciences | 162 | 3.0% |
| Psychology | 192 | 3.6% |
| Social Sciences | 260 | 4.8% |
| Engineering | 325 | 6.0% |
| Multidisciplinary Studies | 12 | 0.2% |
| Science & Technology | 701 | 13.1% |
| Business | 1,005 | 18.7% |
| Education | 919 | 17.1% |
| Literature & Languages | 158 | 2.9% |
| Liberal Arts & History | 203 | 3.8% |
| Visual & Performing Arts | 223 | 4.2% |
| Communications | 278 | 5.2% |
| Arts & Humanities | 270 | 5.0% |
| Total | 5,373 | 100.0% |
Transportation & Commute in Greendale
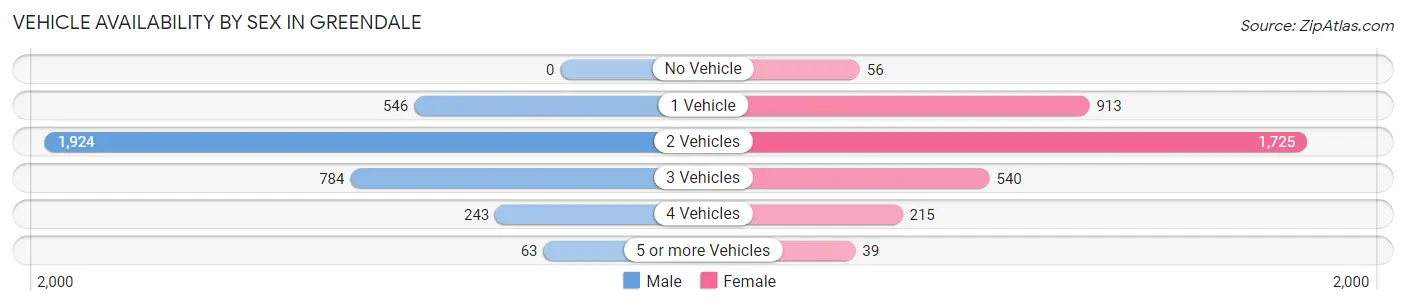
Vehicle Availability by Sex in Greendale
The most prevalent vehicle ownership categories in Greendale are males with 2 vehicles (1,924, accounting for 54.0%) and females with 2 vehicles (1,725, making up 55.2%).
| Vehicles Available | Male | Female |
| No Vehicle | 0 (0.0%) | 56 (1.6%) |
| 1 Vehicle | 546 (15.3%) | 913 (26.2%) |
| 2 Vehicles | 1,924 (54.0%) | 1,725 (49.5%) |
| 3 Vehicles | 784 (22.0%) | 540 (15.5%) |
| 4 Vehicles | 243 (6.8%) | 215 (6.2%) |
| 5 or more Vehicles | 63 (1.8%) | 39 (1.1%) |
| Total | 3,560 (100.0%) | 3,488 (100.0%) |
Commute Time in Greendale
The most frequently occuring commute durations in Greendale are 20 to 24 minutes (1,345 commuters, 21.8%), 15 to 19 minutes (1,320 commuters, 21.4%), and 30 to 34 minutes (836 commuters, 13.6%).
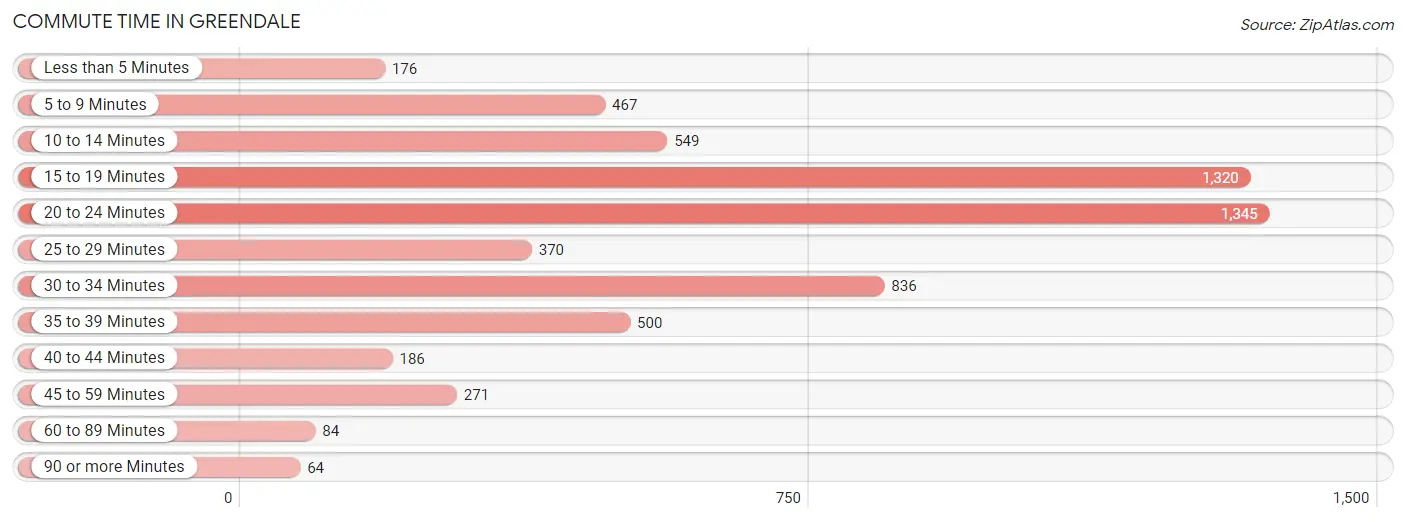
| Commute Time | # Commuters | % Commuters |
| Less than 5 Minutes | 176 | 2.9% |
| 5 to 9 Minutes | 467 | 7.6% |
| 10 to 14 Minutes | 549 | 8.9% |
| 15 to 19 Minutes | 1,320 | 21.4% |
| 20 to 24 Minutes | 1,345 | 21.8% |
| 25 to 29 Minutes | 370 | 6.0% |
| 30 to 34 Minutes | 836 | 13.6% |
| 35 to 39 Minutes | 500 | 8.1% |
| 40 to 44 Minutes | 186 | 3.0% |
| 45 to 59 Minutes | 271 | 4.4% |
| 60 to 89 Minutes | 84 | 1.4% |
| 90 or more Minutes | 64 | 1.0% |
Commute Time by Sex in Greendale
The most common commute times in Greendale are 20 to 24 minutes (876 commuters, 28.7%) for males and 15 to 19 minutes (802 commuters, 25.8%) for females.
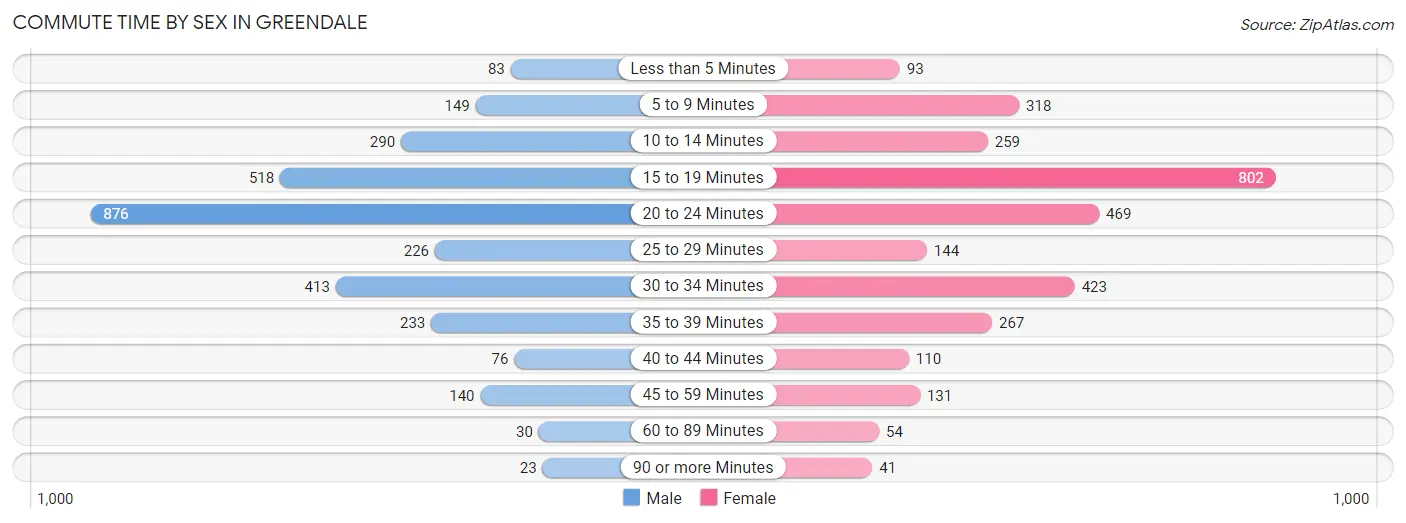
| Commute Time | Male | Female |
| Less than 5 Minutes | 83 (2.7%) | 93 (3.0%) |
| 5 to 9 Minutes | 149 (4.9%) | 318 (10.2%) |
| 10 to 14 Minutes | 290 (9.5%) | 259 (8.3%) |
| 15 to 19 Minutes | 518 (16.9%) | 802 (25.8%) |
| 20 to 24 Minutes | 876 (28.7%) | 469 (15.1%) |
| 25 to 29 Minutes | 226 (7.4%) | 144 (4.6%) |
| 30 to 34 Minutes | 413 (13.5%) | 423 (13.6%) |
| 35 to 39 Minutes | 233 (7.6%) | 267 (8.6%) |
| 40 to 44 Minutes | 76 (2.5%) | 110 (3.5%) |
| 45 to 59 Minutes | 140 (4.6%) | 131 (4.2%) |
| 60 to 89 Minutes | 30 (1.0%) | 54 (1.7%) |
| 90 or more Minutes | 23 (0.7%) | 41 (1.3%) |
Time of Departure to Work by Sex in Greendale
The most frequent times of departure to work in Greendale are 12:00 PM to 3:59 PM (388, 12.7%) for males and 7:00 AM to 7:29 AM (742, 23.8%) for females.
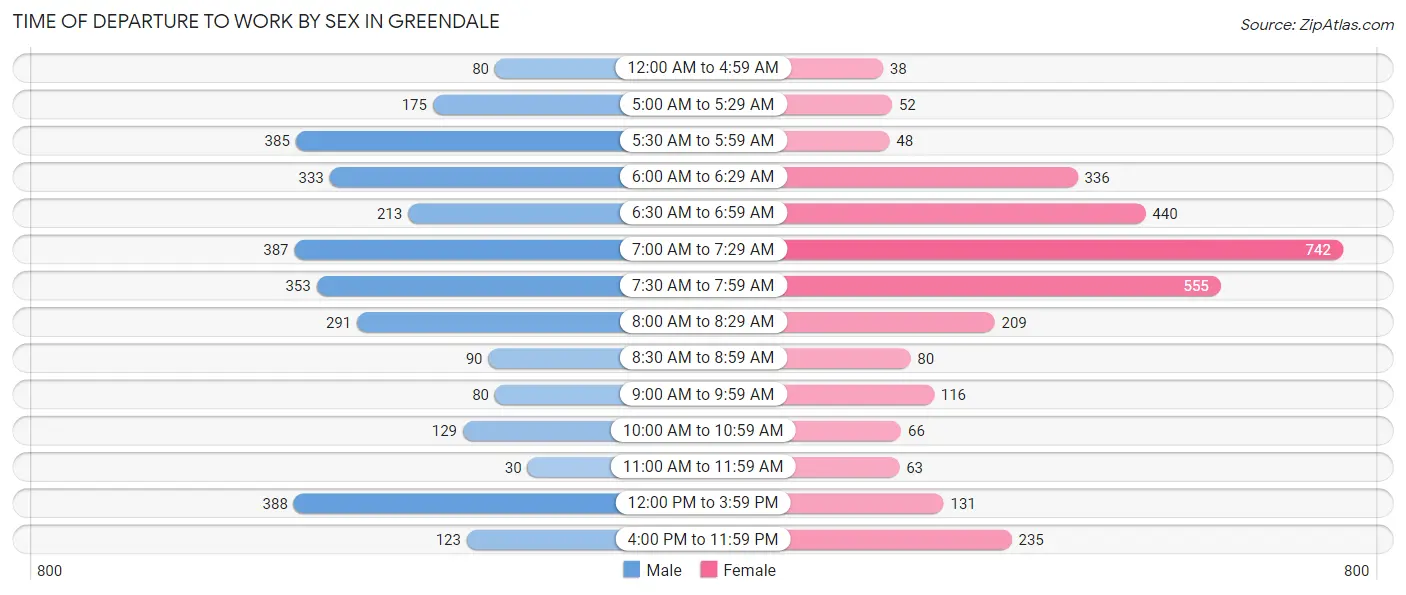
| Time of Departure | Male | Female |
| 12:00 AM to 4:59 AM | 80 (2.6%) | 38 (1.2%) |
| 5:00 AM to 5:29 AM | 175 (5.7%) | 52 (1.7%) |
| 5:30 AM to 5:59 AM | 385 (12.6%) | 48 (1.5%) |
| 6:00 AM to 6:29 AM | 333 (10.9%) | 336 (10.8%) |
| 6:30 AM to 6:59 AM | 213 (7.0%) | 440 (14.1%) |
| 7:00 AM to 7:29 AM | 387 (12.7%) | 742 (23.8%) |
| 7:30 AM to 7:59 AM | 353 (11.6%) | 555 (17.8%) |
| 8:00 AM to 8:29 AM | 291 (9.5%) | 209 (6.7%) |
| 8:30 AM to 8:59 AM | 90 (2.9%) | 80 (2.6%) |
| 9:00 AM to 9:59 AM | 80 (2.6%) | 116 (3.7%) |
| 10:00 AM to 10:59 AM | 129 (4.2%) | 66 (2.1%) |
| 11:00 AM to 11:59 AM | 30 (1.0%) | 63 (2.0%) |
| 12:00 PM to 3:59 PM | 388 (12.7%) | 131 (4.2%) |
| 4:00 PM to 11:59 PM | 123 (4.0%) | 235 (7.5%) |
| Total | 3,057 (100.0%) | 3,111 (100.0%) |
Housing Occupancy in Greendale
Occupancy by Ownership in Greendale
Of the total 6,140 dwellings in Greendale, owner-occupied units account for 4,231 (68.9%), while renter-occupied units make up 1,909 (31.1%).
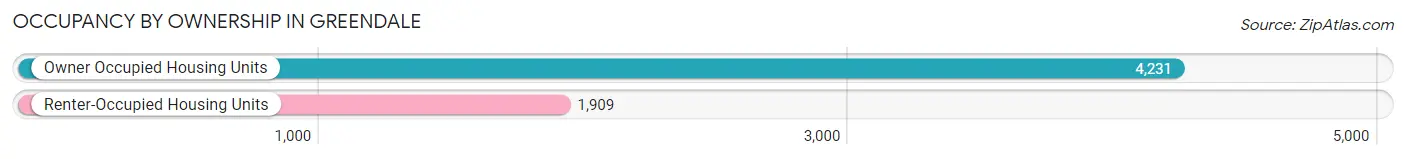
| Occupancy | # Housing Units | % Housing Units |
| Owner Occupied Housing Units | 4,231 | 68.9% |
| Renter-Occupied Housing Units | 1,909 | 31.1% |
| Total Occupied Housing Units | 6,140 | 100.0% |
Occupancy by Household Size in Greendale
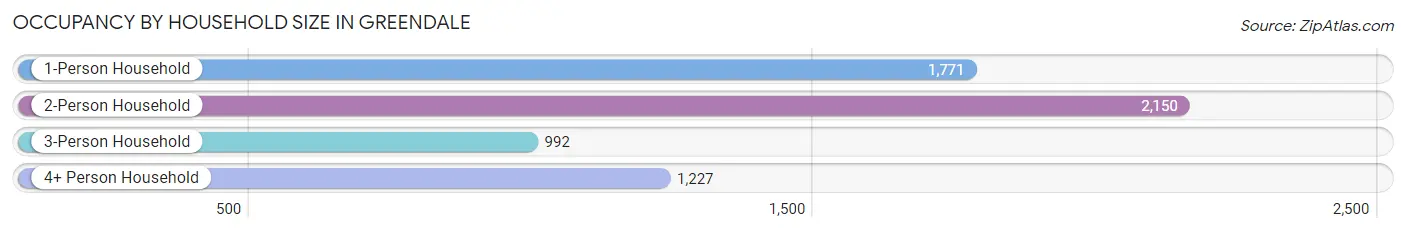
| Household Size | # Housing Units | % Housing Units |
| 1-Person Household | 1,771 | 28.8% |
| 2-Person Household | 2,150 | 35.0% |
| 3-Person Household | 992 | 16.2% |
| 4+ Person Household | 1,227 | 20.0% |
| Total Housing Units | 6,140 | 100.0% |
Occupancy by Ownership by Household Size in Greendale
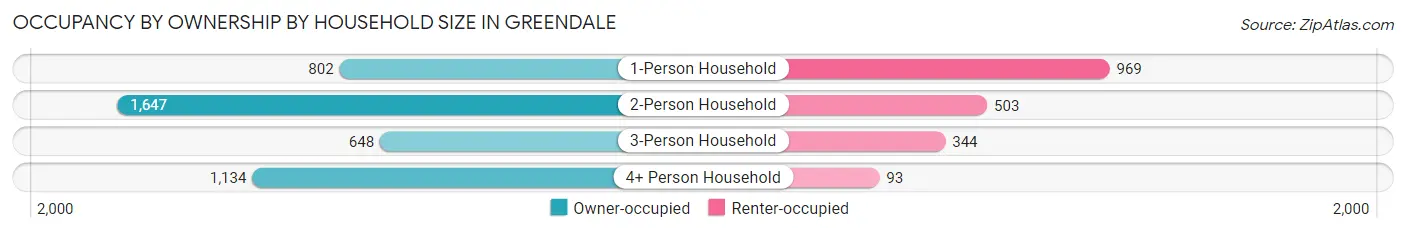
| Household Size | Owner-occupied | Renter-occupied |
| 1-Person Household | 802 (45.3%) | 969 (54.7%) |
| 2-Person Household | 1,647 (76.6%) | 503 (23.4%) |
| 3-Person Household | 648 (65.3%) | 344 (34.7%) |
| 4+ Person Household | 1,134 (92.4%) | 93 (7.6%) |
| Total Housing Units | 4,231 (68.9%) | 1,909 (31.1%) |
Occupancy by Educational Attainment in Greendale
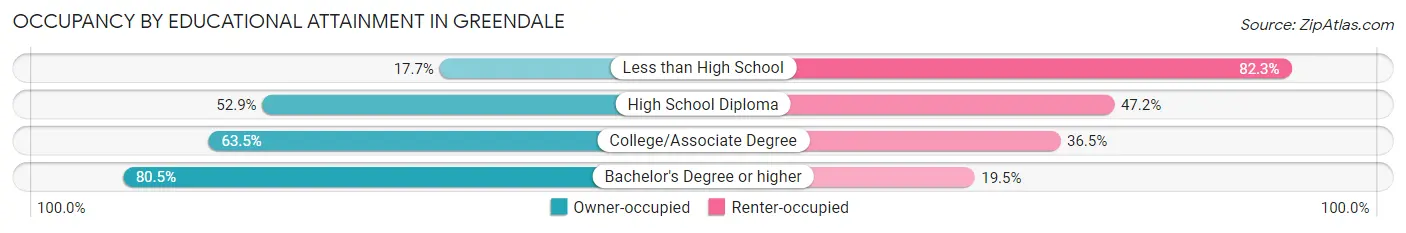
| Household Size | Owner-occupied | Renter-occupied |
| Less than High School | 20 (17.7%) | 93 (82.3%) |
| High School Diploma | 687 (52.8%) | 613 (47.1%) |
| College/Associate Degree | 1,058 (63.5%) | 607 (36.5%) |
| Bachelor's Degree or higher | 2,466 (80.5%) | 596 (19.5%) |
Occupancy by Age of Householder in Greendale
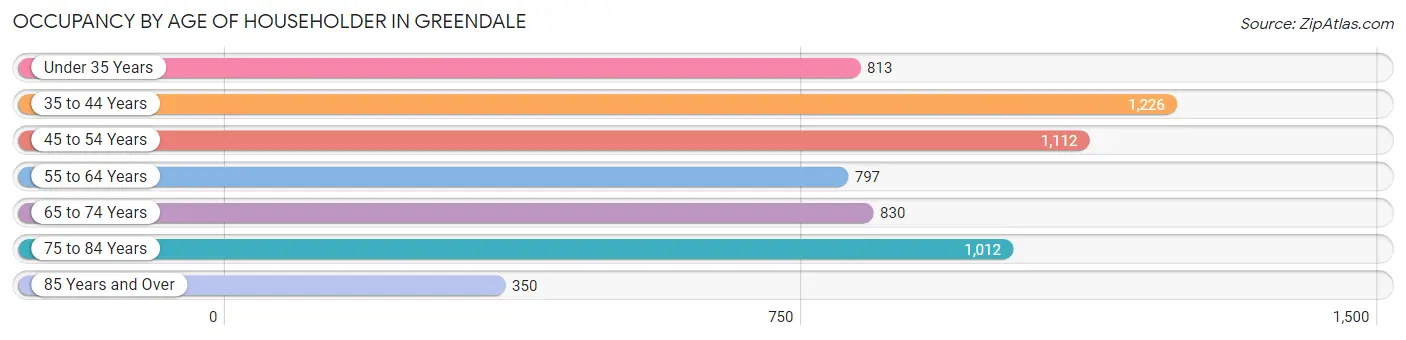
| Age Bracket | # Households | % Households |
| Under 35 Years | 813 | 13.2% |
| 35 to 44 Years | 1,226 | 20.0% |
| 45 to 54 Years | 1,112 | 18.1% |
| 55 to 64 Years | 797 | 13.0% |
| 65 to 74 Years | 830 | 13.5% |
| 75 to 84 Years | 1,012 | 16.5% |
| 85 Years and Over | 350 | 5.7% |
| Total | 6,140 | 100.0% |
Housing Finances in Greendale
Median Income by Occupancy in Greendale
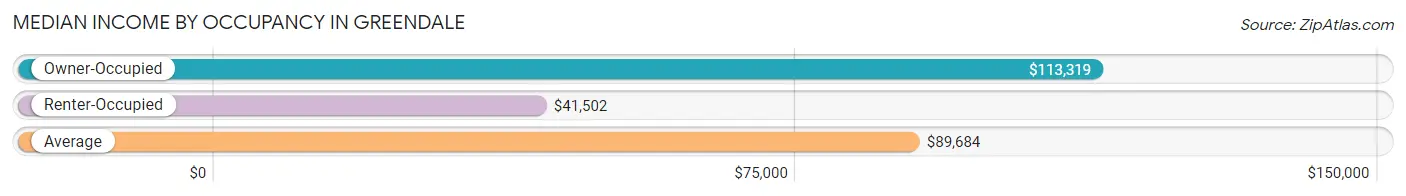
| Occupancy Type | # Households | Median Income |
| Owner-Occupied | 4,231 (68.9%) | $113,319 |
| Renter-Occupied | 1,909 (31.1%) | $41,502 |
| Average | 6,140 (100.0%) | $89,684 |
Occupancy by Householder Income Bracket in Greendale
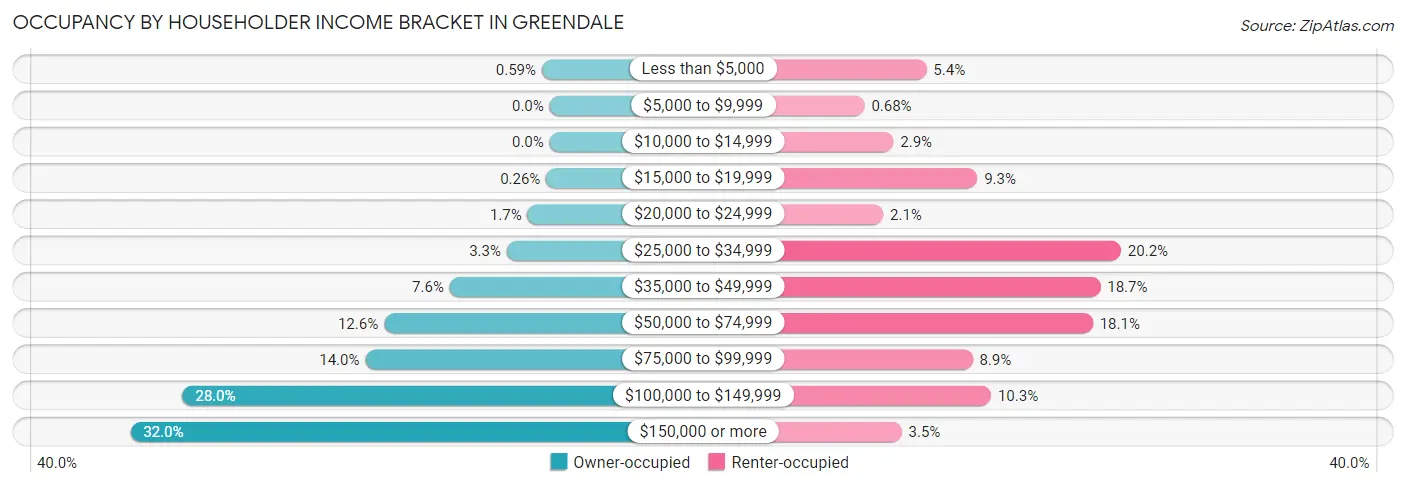
| Income Bracket | Owner-occupied | Renter-occupied |
| Less than $5,000 | 25 (0.6%) | 103 (5.4%) |
| $5,000 to $9,999 | 0 (0.0%) | 13 (0.7%) |
| $10,000 to $14,999 | 0 (0.0%) | 55 (2.9%) |
| $15,000 to $19,999 | 11 (0.3%) | 177 (9.3%) |
| $20,000 to $24,999 | 71 (1.7%) | 40 (2.1%) |
| $25,000 to $34,999 | 138 (3.3%) | 386 (20.2%) |
| $35,000 to $49,999 | 322 (7.6%) | 356 (18.6%) |
| $50,000 to $74,999 | 534 (12.6%) | 345 (18.1%) |
| $75,000 to $99,999 | 594 (14.0%) | 170 (8.9%) |
| $100,000 to $149,999 | 1,184 (28.0%) | 197 (10.3%) |
| $150,000 or more | 1,352 (32.0%) | 67 (3.5%) |
| Total | 4,231 (100.0%) | 1,909 (100.0%) |
Monthly Housing Cost Tiers in Greendale
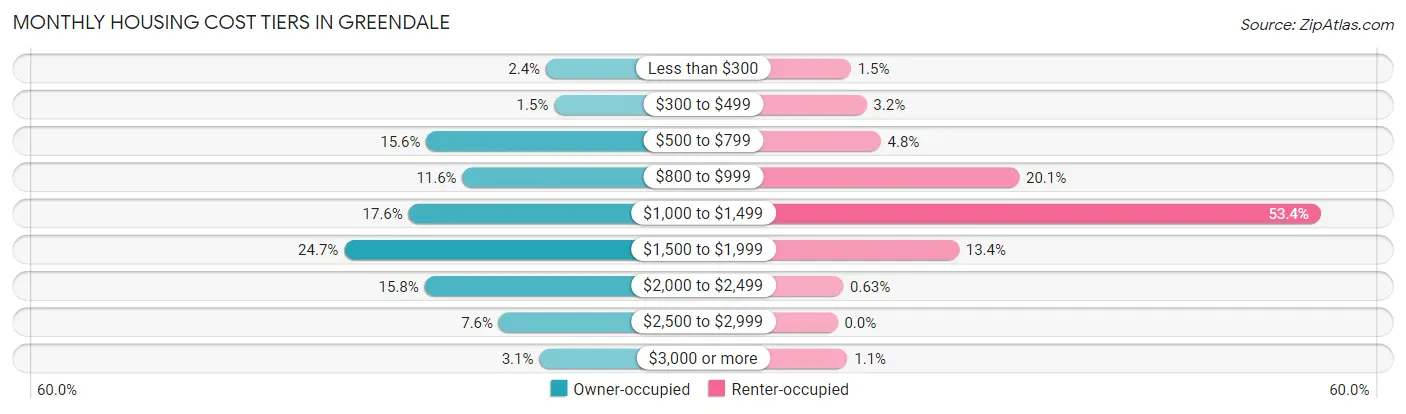
| Monthly Cost | Owner-occupied | Renter-occupied |
| Less than $300 | 102 (2.4%) | 28 (1.5%) |
| $300 to $499 | 63 (1.5%) | 61 (3.2%) |
| $500 to $799 | 661 (15.6%) | 91 (4.8%) |
| $800 to $999 | 492 (11.6%) | 383 (20.1%) |
| $1,000 to $1,499 | 744 (17.6%) | 1,019 (53.4%) |
| $1,500 to $1,999 | 1,045 (24.7%) | 256 (13.4%) |
| $2,000 to $2,499 | 669 (15.8%) | 12 (0.6%) |
| $2,500 to $2,999 | 322 (7.6%) | 0 (0.0%) |
| $3,000 or more | 133 (3.1%) | 21 (1.1%) |
| Total | 4,231 (100.0%) | 1,909 (100.0%) |
Physical Housing Characteristics in Greendale
Housing Structures in Greendale
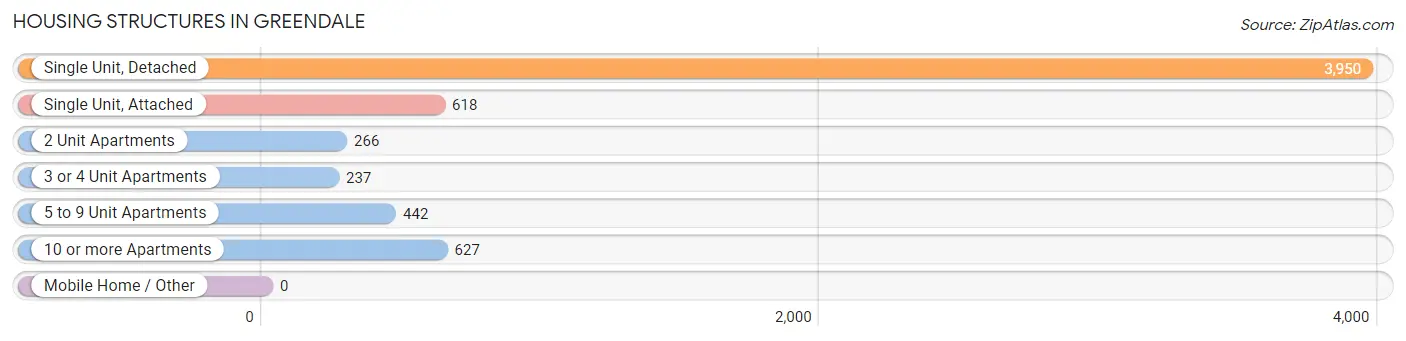
| Structure Type | # Housing Units | % Housing Units |
| Single Unit, Detached | 3,950 | 64.3% |
| Single Unit, Attached | 618 | 10.1% |
| 2 Unit Apartments | 266 | 4.3% |
| 3 or 4 Unit Apartments | 237 | 3.9% |
| 5 to 9 Unit Apartments | 442 | 7.2% |
| 10 or more Apartments | 627 | 10.2% |
| Mobile Home / Other | 0 | 0.0% |
| Total | 6,140 | 100.0% |
Housing Structures by Occupancy in Greendale
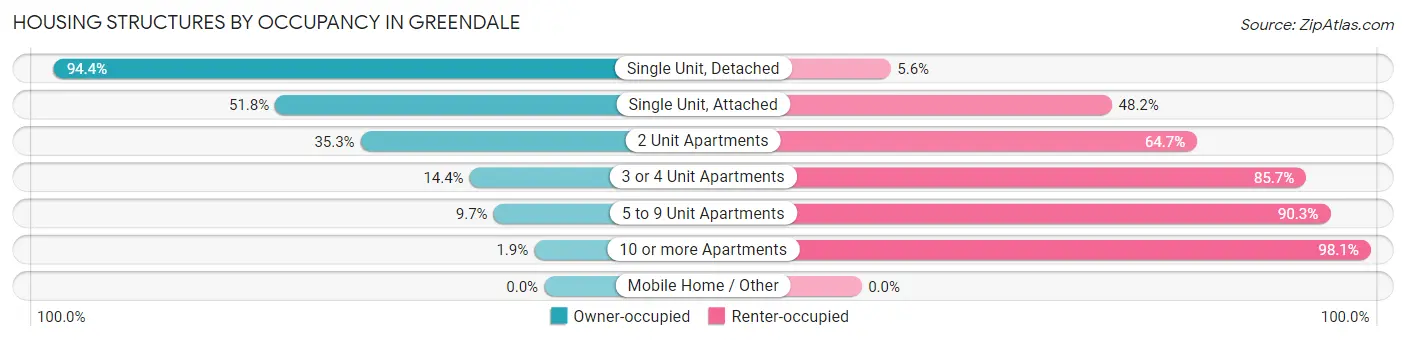
| Structure Type | Owner-occupied | Renter-occupied |
| Single Unit, Detached | 3,728 (94.4%) | 222 (5.6%) |
| Single Unit, Attached | 320 (51.8%) | 298 (48.2%) |
| 2 Unit Apartments | 94 (35.3%) | 172 (64.7%) |
| 3 or 4 Unit Apartments | 34 (14.3%) | 203 (85.7%) |
| 5 to 9 Unit Apartments | 43 (9.7%) | 399 (90.3%) |
| 10 or more Apartments | 12 (1.9%) | 615 (98.1%) |
| Mobile Home / Other | 0 (0.0%) | 0 (0.0%) |
| Total | 4,231 (68.9%) | 1,909 (31.1%) |
Housing Structures by Number of Rooms in Greendale
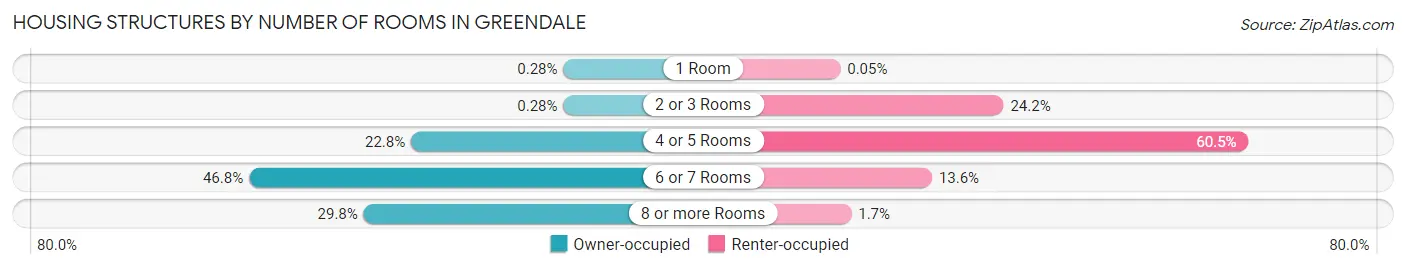
| Number of Rooms | Owner-occupied | Renter-occupied |
| 1 Room | 12 (0.3%) | 1 (0.1%) |
| 2 or 3 Rooms | 12 (0.3%) | 462 (24.2%) |
| 4 or 5 Rooms | 965 (22.8%) | 1,154 (60.5%) |
| 6 or 7 Rooms | 1,980 (46.8%) | 260 (13.6%) |
| 8 or more Rooms | 1,262 (29.8%) | 32 (1.7%) |
| Total | 4,231 (100.0%) | 1,909 (100.0%) |
Housing Structure by Heating Type in Greendale
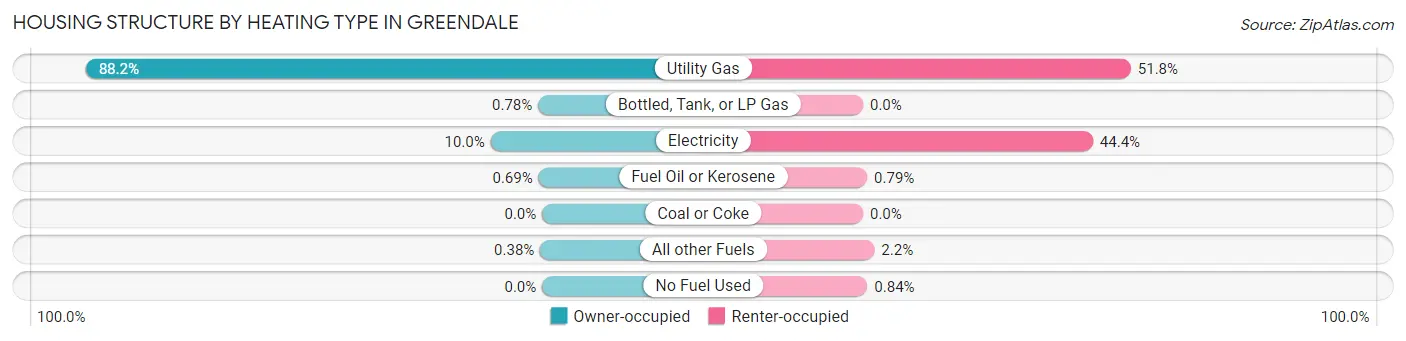
| Heating Type | Owner-occupied | Renter-occupied |
| Utility Gas | 3,731 (88.2%) | 988 (51.7%) |
| Bottled, Tank, or LP Gas | 33 (0.8%) | 0 (0.0%) |
| Electricity | 422 (10.0%) | 848 (44.4%) |
| Fuel Oil or Kerosene | 29 (0.7%) | 15 (0.8%) |
| Coal or Coke | 0 (0.0%) | 0 (0.0%) |
| All other Fuels | 16 (0.4%) | 42 (2.2%) |
| No Fuel Used | 0 (0.0%) | 16 (0.8%) |
| Total | 4,231 (100.0%) | 1,909 (100.0%) |
Household Vehicle Usage in Greendale
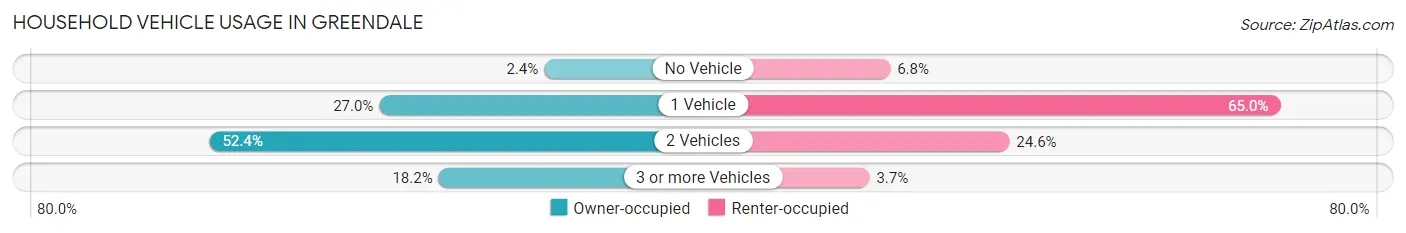
| Vehicles per Household | Owner-occupied | Renter-occupied |
| No Vehicle | 102 (2.4%) | 129 (6.8%) |
| 1 Vehicle | 1,144 (27.0%) | 1,241 (65.0%) |
| 2 Vehicles | 2,216 (52.4%) | 469 (24.6%) |
| 3 or more Vehicles | 769 (18.2%) | 70 (3.7%) |
| Total | 4,231 (100.0%) | 1,909 (100.0%) |
Real Estate & Mortgages in Greendale
Real Estate and Mortgage Overview in Greendale
| Characteristic | Without Mortgage | With Mortgage |
| Housing Units | 1,595 | 2,636 |
| Median Property Value | $265,800 | $278,600 |
| Median Household Income | $91,661 | $1,009 |
| Monthly Housing Costs | $790 | $133 |
| Real Estate Taxes | $5,711 | $0 |
Property Value by Mortgage Status in Greendale
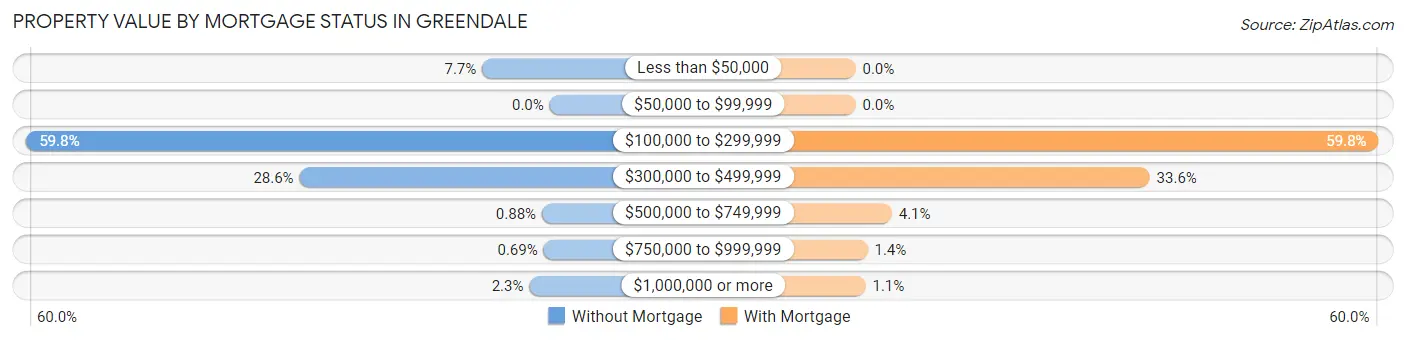
| Property Value | Without Mortgage | With Mortgage |
| Less than $50,000 | 123 (7.7%) | 0 (0.0%) |
| $50,000 to $99,999 | 0 (0.0%) | 0 (0.0%) |
| $100,000 to $299,999 | 954 (59.8%) | 1,575 (59.8%) |
| $300,000 to $499,999 | 456 (28.6%) | 886 (33.6%) |
| $500,000 to $749,999 | 14 (0.9%) | 109 (4.1%) |
| $750,000 to $999,999 | 11 (0.7%) | 36 (1.4%) |
| $1,000,000 or more | 37 (2.3%) | 30 (1.1%) |
| Total | 1,595 (100.0%) | 2,636 (100.0%) |
Household Income by Mortgage Status in Greendale
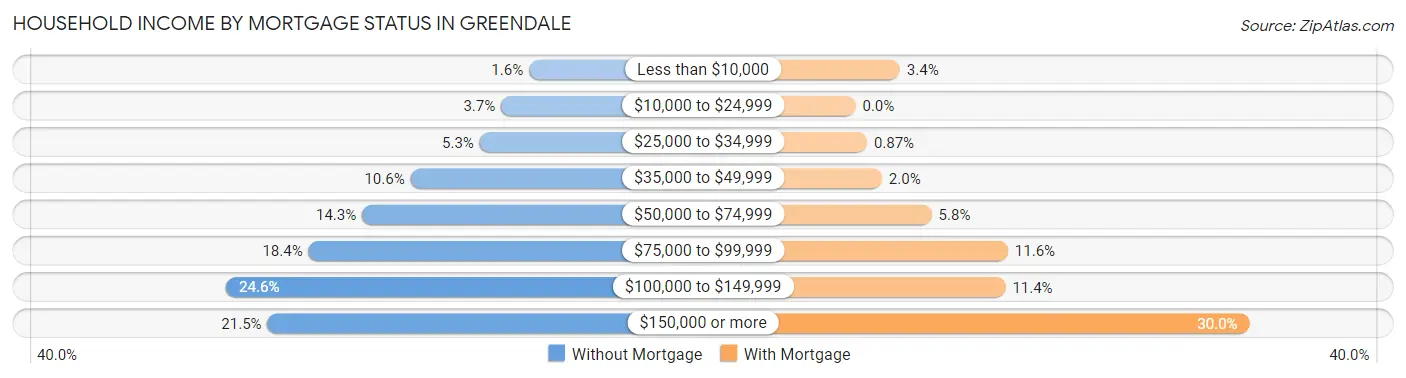
| Household Income | Without Mortgage | With Mortgage |
| Less than $10,000 | 25 (1.6%) | 89 (3.4%) |
| $10,000 to $24,999 | 59 (3.7%) | 0 (0.0%) |
| $25,000 to $34,999 | 85 (5.3%) | 23 (0.9%) |
| $35,000 to $49,999 | 169 (10.6%) | 53 (2.0%) |
| $50,000 to $74,999 | 228 (14.3%) | 153 (5.8%) |
| $75,000 to $99,999 | 293 (18.4%) | 306 (11.6%) |
| $100,000 to $149,999 | 393 (24.6%) | 301 (11.4%) |
| $150,000 or more | 343 (21.5%) | 791 (30.0%) |
| Total | 1,595 (100.0%) | 2,636 (100.0%) |
Property Value to Household Income Ratio in Greendale
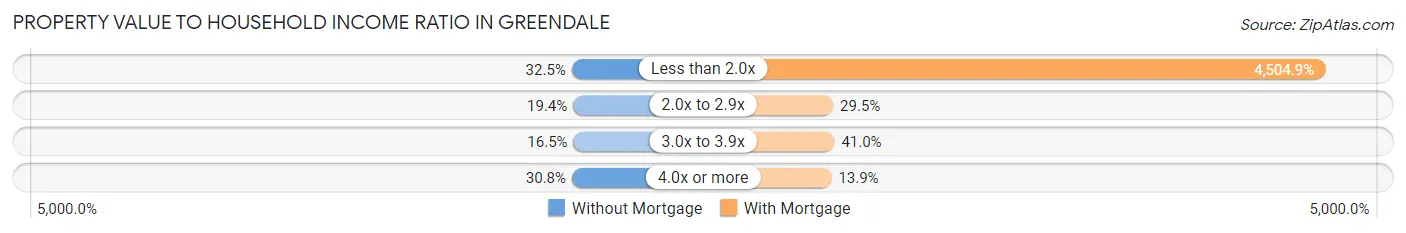
| Value-to-Income Ratio | Without Mortgage | With Mortgage |
| Less than 2.0x | 519 (32.5%) | 118,750 (4,504.9%) |
| 2.0x to 2.9x | 310 (19.4%) | 777 (29.5%) |
| 3.0x to 3.9x | 263 (16.5%) | 1,081 (41.0%) |
| 4.0x or more | 491 (30.8%) | 366 (13.9%) |
| Total | 1,595 (100.0%) | 2,636 (100.0%) |
Real Estate Taxes by Mortgage Status in Greendale
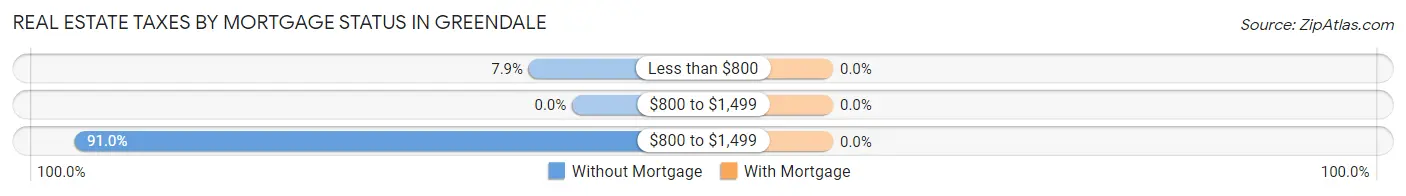
| Property Taxes | Without Mortgage | With Mortgage |
| Less than $800 | 126 (7.9%) | 0 (0.0%) |
| $800 to $1,499 | 0 (0.0%) | 0 (0.0%) |
| $800 to $1,499 | 1,451 (91.0%) | 0 (0.0%) |
| Total | 1,595 (100.0%) | 2,636 (100.0%) |
Health & Disability in Greendale
Health Insurance Coverage by Age in Greendale
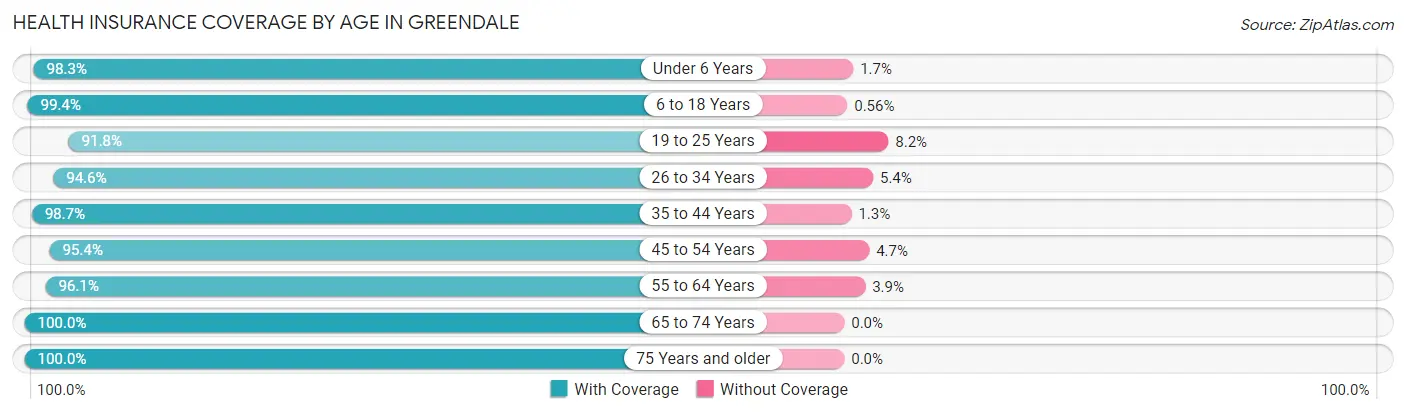
| Age Bracket | With Coverage | Without Coverage |
| Under 6 Years | 1,000 (98.3%) | 17 (1.7%) |
| 6 to 18 Years | 2,840 (99.4%) | 16 (0.6%) |
| 19 to 25 Years | 716 (91.8%) | 64 (8.2%) |
| 26 to 34 Years | 1,183 (94.6%) | 67 (5.4%) |
| 35 to 44 Years | 2,282 (98.7%) | 31 (1.3%) |
| 45 to 54 Years | 1,906 (95.4%) | 93 (4.6%) |
| 55 to 64 Years | 1,258 (96.1%) | 51 (3.9%) |
| 65 to 74 Years | 1,266 (100.0%) | 0 (0.0%) |
| 75 Years and older | 1,886 (100.0%) | 0 (0.0%) |
| Total | 14,337 (97.7%) | 339 (2.3%) |
Health Insurance Coverage by Citizenship Status in Greendale
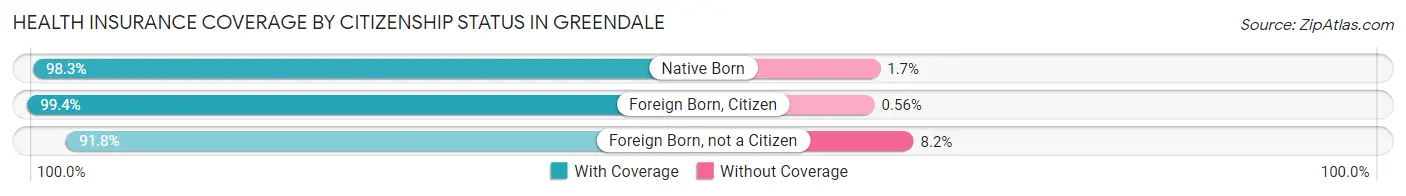
| Citizenship Status | With Coverage | Without Coverage |
| Native Born | 1,000 (98.3%) | 17 (1.7%) |
| Foreign Born, Citizen | 2,840 (99.4%) | 16 (0.6%) |
| Foreign Born, not a Citizen | 716 (91.8%) | 64 (8.2%) |
Health Insurance Coverage by Household Income in Greendale
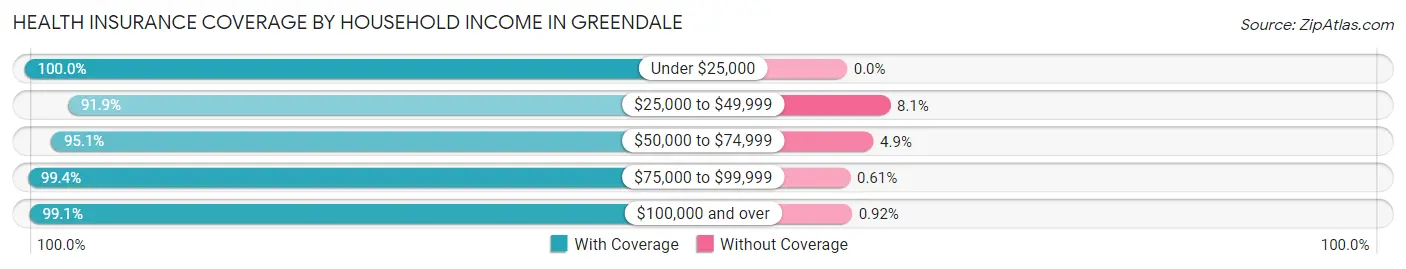
| Household Income | With Coverage | Without Coverage |
| Under $25,000 | 754 (100.0%) | 0 (0.0%) |
| $25,000 to $49,999 | 1,861 (91.9%) | 164 (8.1%) |
| $50,000 to $74,999 | 1,692 (95.1%) | 88 (4.9%) |
| $75,000 to $99,999 | 1,789 (99.4%) | 11 (0.6%) |
| $100,000 and over | 8,156 (99.1%) | 76 (0.9%) |
Public vs Private Health Insurance Coverage by Age in Greendale
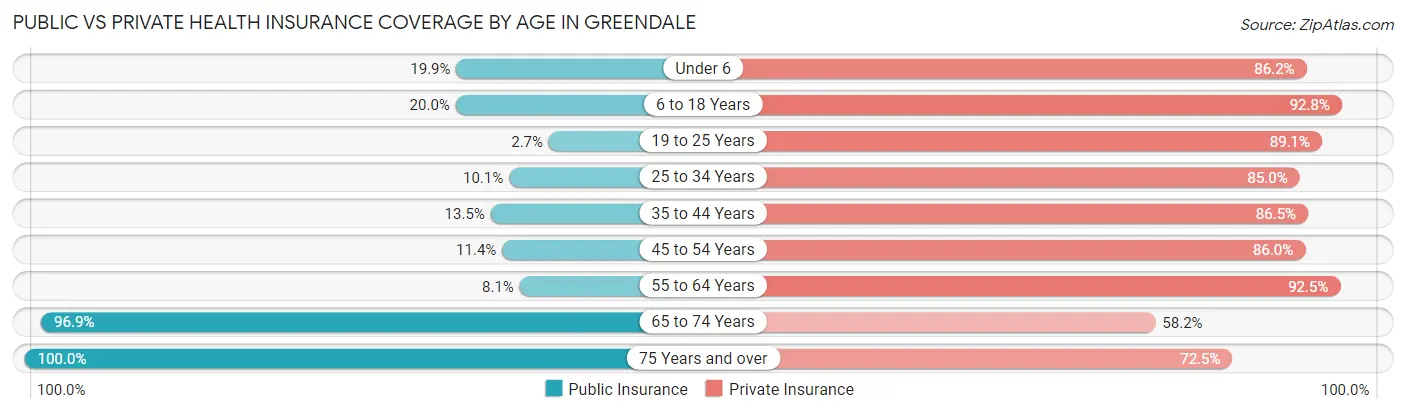
| Age Bracket | Public Insurance | Private Insurance |
| Under 6 | 202 (19.9%) | 877 (86.2%) |
| 6 to 18 Years | 571 (20.0%) | 2,650 (92.8%) |
| 19 to 25 Years | 21 (2.7%) | 695 (89.1%) |
| 25 to 34 Years | 126 (10.1%) | 1,062 (85.0%) |
| 35 to 44 Years | 312 (13.5%) | 2,001 (86.5%) |
| 45 to 54 Years | 227 (11.4%) | 1,719 (86.0%) |
| 55 to 64 Years | 106 (8.1%) | 1,211 (92.5%) |
| 65 to 74 Years | 1,227 (96.9%) | 737 (58.2%) |
| 75 Years and over | 1,886 (100.0%) | 1,367 (72.5%) |
| Total | 4,678 (31.9%) | 12,319 (83.9%) |
Disability Status by Sex by Age in Greendale
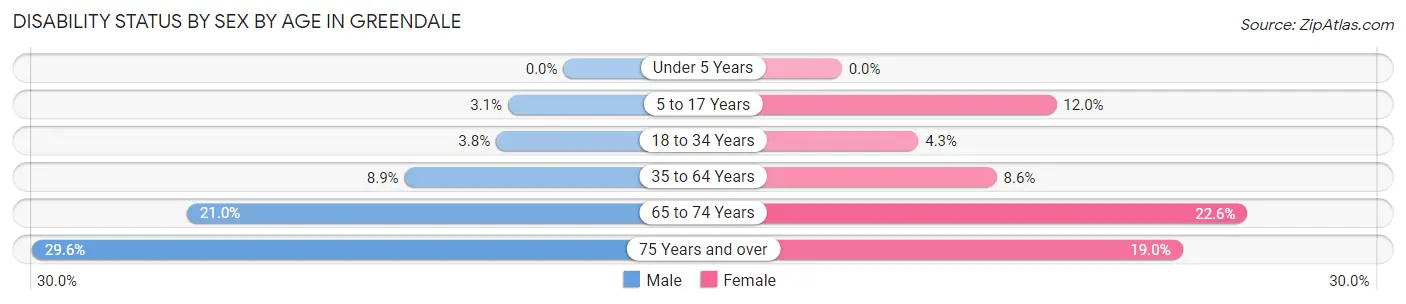
| Age Bracket | Male | Female |
| Under 5 Years | 0 (0.0%) | 0 (0.0%) |
| 5 to 17 Years | 42 (3.1%) | 185 (11.9%) |
| 18 to 34 Years | 39 (3.7%) | 48 (4.3%) |
| 35 to 64 Years | 245 (8.8%) | 246 (8.6%) |
| 65 to 74 Years | 127 (21.0%) | 149 (22.6%) |
| 75 Years and over | 232 (29.6%) | 209 (19.0%) |
Disability Class by Sex by Age in Greendale
Disability Class: Hearing Difficulty
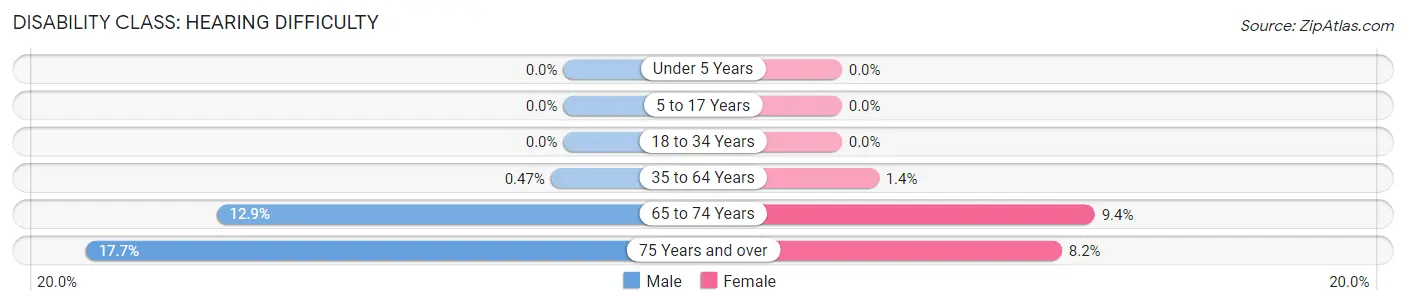
| Age Bracket | Male | Female |
| Under 5 Years | 0 (0.0%) | 0 (0.0%) |
| 5 to 17 Years | 0 (0.0%) | 0 (0.0%) |
| 18 to 34 Years | 0 (0.0%) | 0 (0.0%) |
| 35 to 64 Years | 13 (0.5%) | 39 (1.4%) |
| 65 to 74 Years | 78 (12.9%) | 62 (9.4%) |
| 75 Years and over | 139 (17.7%) | 90 (8.2%) |
Disability Class: Vision Difficulty
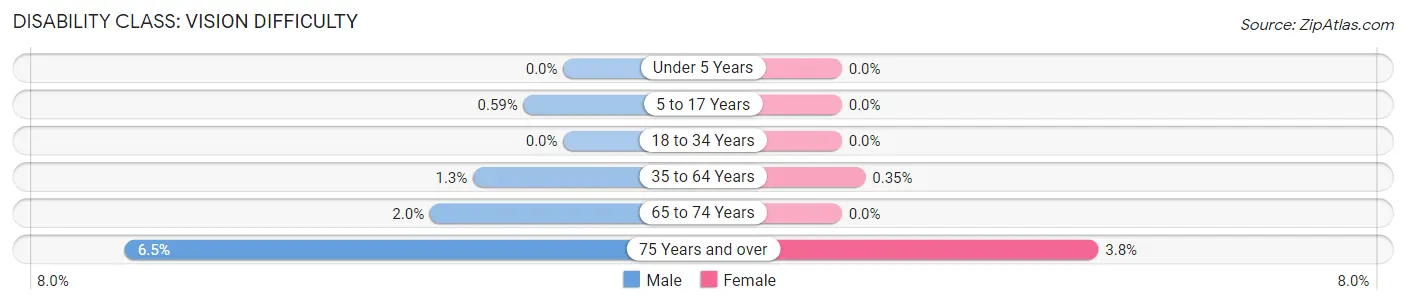
| Age Bracket | Male | Female |
| Under 5 Years | 0 (0.0%) | 0 (0.0%) |
| 5 to 17 Years | 8 (0.6%) | 0 (0.0%) |
| 18 to 34 Years | 0 (0.0%) | 0 (0.0%) |
| 35 to 64 Years | 37 (1.3%) | 10 (0.4%) |
| 65 to 74 Years | 12 (2.0%) | 0 (0.0%) |
| 75 Years and over | 51 (6.5%) | 42 (3.8%) |
Disability Class: Cognitive Difficulty
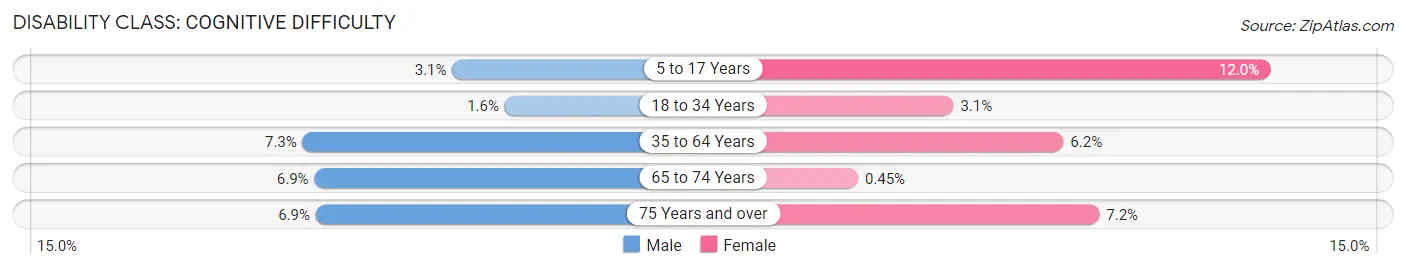
| Age Bracket | Male | Female |
| 5 to 17 Years | 42 (3.1%) | 185 (11.9%) |
| 18 to 34 Years | 17 (1.6%) | 35 (3.1%) |
| 35 to 64 Years | 201 (7.3%) | 176 (6.2%) |
| 65 to 74 Years | 42 (6.9%) | 3 (0.4%) |
| 75 Years and over | 54 (6.9%) | 79 (7.2%) |
Disability Class: Ambulatory Difficulty
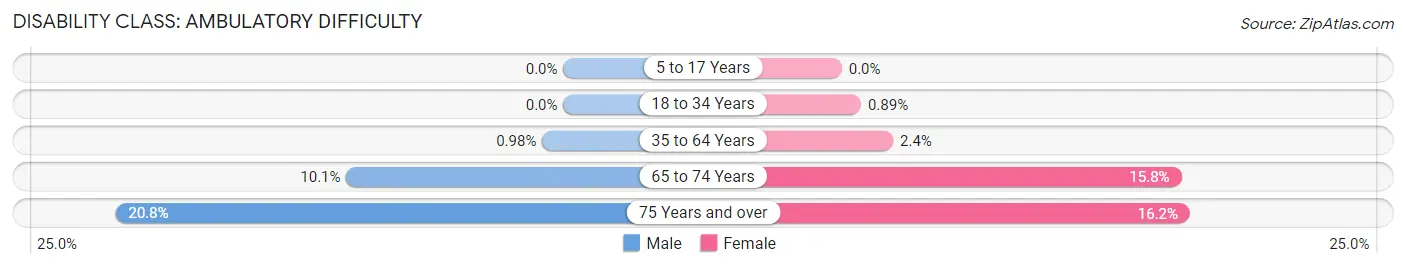
| Age Bracket | Male | Female |
| 5 to 17 Years | 0 (0.0%) | 0 (0.0%) |
| 18 to 34 Years | 0 (0.0%) | 10 (0.9%) |
| 35 to 64 Years | 27 (1.0%) | 68 (2.4%) |
| 65 to 74 Years | 61 (10.1%) | 104 (15.8%) |
| 75 Years and over | 163 (20.8%) | 178 (16.2%) |
Disability Class: Self-Care Difficulty
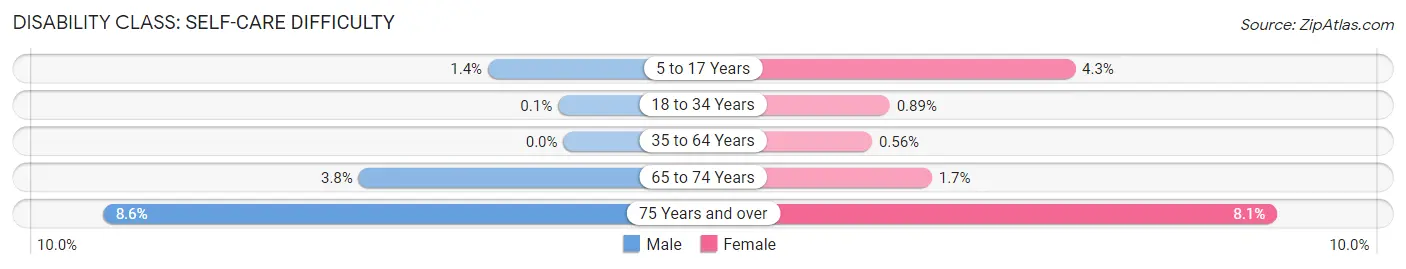
| Age Bracket | Male | Female |
| 5 to 17 Years | 19 (1.4%) | 67 (4.3%) |
| 18 to 34 Years | 1 (0.1%) | 10 (0.9%) |
| 35 to 64 Years | 0 (0.0%) | 16 (0.6%) |
| 65 to 74 Years | 23 (3.8%) | 11 (1.7%) |
| 75 Years and over | 67 (8.6%) | 89 (8.1%) |
Technology Access in Greendale
Computing Device Access in Greendale
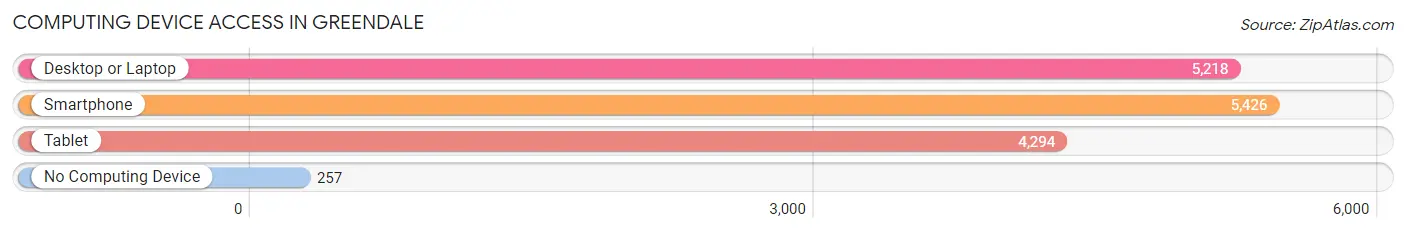
| Device Type | # Households | % Households |
| Desktop or Laptop | 5,218 | 85.0% |
| Smartphone | 5,426 | 88.4% |
| Tablet | 4,294 | 69.9% |
| No Computing Device | 257 | 4.2% |
| Total | 6,140 | 100.0% |
Internet Access in Greendale
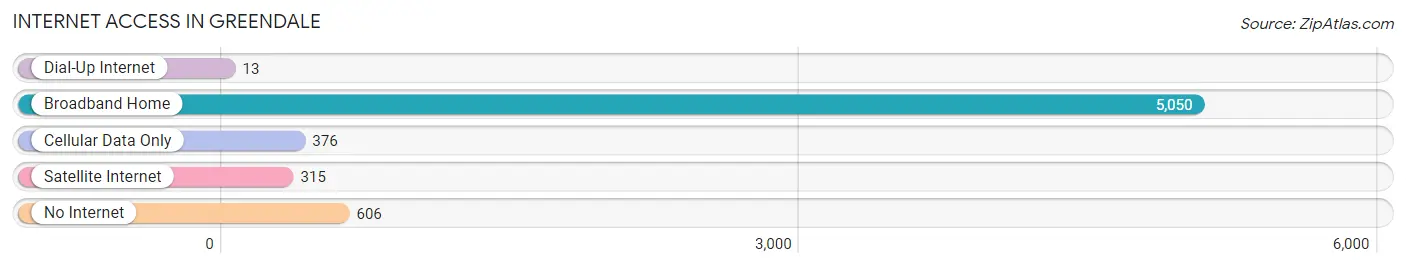
| Internet Type | # Households | % Households |
| Dial-Up Internet | 13 | 0.2% |
| Broadband Home | 5,050 | 82.3% |
| Cellular Data Only | 376 | 6.1% |
| Satellite Internet | 315 | 5.1% |
| No Internet | 606 | 9.9% |
| Total | 6,140 | 100.0% |
Greendale Summary
Greendale, Wisconsin is a village located in Milwaukee County, Wisconsin, United States. The population was 14,046 at the 2010 census. Greendale is located approximately 10 miles (16 km) southwest of downtown Milwaukee and is part of the Milwaukee metropolitan area.
History
Greendale was founded in 1938 as a planned community by the Federal Government's Resettlement Administration. The village was designed to be a self-sustaining community, with a mix of residential, commercial, and industrial areas. The village was named after the greenery of the area, which was a stark contrast to the industrial city of Milwaukee. Greendale was the first of three "greenbelt" towns built in the United States.
The village was designed by the famous landscape architect, Frederick Law Olmsted, Jr. Olmsted designed the village to be a self-contained community, with a mix of residential, commercial, and industrial areas. The village was laid out in a radial pattern, with the village center located at the intersection of Broad Street and Northway. The village center was designed to be the focal point of the community, with a park, a library, a post office, and a variety of shops and businesses.
Geography
Greendale is located at 43°14′N 88°1′W (43.23, -88.02). According to the United States Census Bureau, the village has a total area of 4.2 square miles (10.8 km2), all of it land.
Economy
Greendale is home to a variety of businesses, including manufacturing, retail, and service industries. The village is home to several large employers, including the Southridge Mall, which is the largest shopping center in the Milwaukee area. Other major employers include the Greendale School District, the Greendale Public Library, and the Greendale Historical Society.
Demographics
As of the census of 2010, there were 14,046 people, 5,845 households, and 3,717 families residing in the village. The population density was 3,346.2 people per square mile (1,293.2/km2). There were 6,093 housing units at an average density of 1,457.2 per square mile (563.3/km2). The racial makeup of the village was 94.2% White, 1.2% African American, 0.2% Native American, 1.7% Asian, 0.7% from other races, and 2.0% from two or more races. Hispanic or Latino of any race were 3.2% of the population.
There were 5,845 households, out of which 28.2% had children under the age of 18 living with them, 48.2% were married couples living together, 10.3% had a female householder with no husband present, and 37.3% were non-families. 32.2% of all households were made up of individuals, and 13.2% had someone living alone who was 65 years of age or older. The average household size was 2.37 and the average family size was 3.02.
In the village, the population was spread out, with 22.7% under the age of 18, 7.2% from 18 to 24, 28.2% from 25 to 44, 24.3% from 45 to 64, and 17.6% who were 65 years of age or older. The median age was 40 years. For every 100 females, there were 91.2 males. For every 100 females age 18 and over, there were 87.7 males.
The median income for a household in the village was $50,945, and the median income for a family was $63,945. Males had a median income of $45,945 versus $32,945 for females. The per capita income for the village was $25,945. About 3.2% of families and 5.2% of the population were below the poverty line, including 6.2% of those under age 18 and 5.2% of those age 65 or over.
Common Questions
What is Per Capita Income in Greendale?
Per Capita income in Greendale is $43,538.
What is the Median Family Income in Greendale?
Median Family Income in Greendale is $115,038.
What is the Median Household income in Greendale?
Median Household Income in Greendale is $89,684.
What is Income or Wage Gap in Greendale?
Income or Wage Gap in Greendale is 38.4%.
Women in Greendale earn 61.6 cents for every dollar earned by a man.
What is Inequality or Gini Index in Greendale?
Inequality or Gini Index in Greendale is 0.39.
What is the Total Population of Greendale?
Total Population of Greendale is 14,722.
What is the Total Male Population of Greendale?
Total Male Population of Greendale is 6,999.
What is the Total Female Population of Greendale?
Total Female Population of Greendale is 7,723.
What is the Ratio of Males per 100 Females in Greendale?
There are 90.63 Males per 100 Females in Greendale.
What is the Ratio of Females per 100 Males in Greendale?
There are 110.34 Females per 100 Males in Greendale.
What is the Median Population Age in Greendale?
Median Population Age in Greendale is 41.8 Years.
What is the Average Family Size in Greendale
Average Family Size in Greendale is 2.9 People.
What is the Average Household Size in Greendale
Average Household Size in Greendale is 2.4 People.
How Large is the Labor Force in Greendale?
There are 7,393 People in the Labor Forcein in Greendale.
What is the Percentage of People in the Labor Force in Greendale?
64.4% of People are in the Labor Force in Greendale.
What is the Unemployment Rate in Greendale?
Unemployment Rate in Greendale is 2.5%.