Tunnel City, WI Map & Demographics
Tunnel City Map
Tunnel City Overview
$67,326
PER CAPITA INCOME
0.41
INEQUALITY / GINI INDEX
128
TOTAL POPULATION
78
MALE POPULATION
50
FEMALE POPULATION
156.00
MALES / 100 FEMALES
64.10
FEMALES / 100 MALES
45.4
MEDIAN AGE
1.9
AVG FAMILY SIZE
1.8
AVG HOUSEHOLD SIZE
57
LABOR FORCE [ PEOPLE ]
52.8%
PERCENT IN LABOR FORCE
Tunnel City Area Codes
Income in Tunnel City
Income Overview in Tunnel City
| Characteristic | Number | Measure |
| Per Capita Income | 128 | $67,326 |
| Median Family Income | 55 | $0 |
| Mean Family Income | 55 | $179,762 |
| Median Household Income | 71 | $0 |
| Mean Household Income | 71 | $150,368 |
| Income Deficit | 55 | $0 |
| Wage / Income Gap (%) | 128 | 0.00% |
| Wage / Income Gap ($) | 128 | 100.00¢ per $1 |
| Gini / Inequality Index | 128 | 0.41 |
Earnings by Sex in Tunnel City
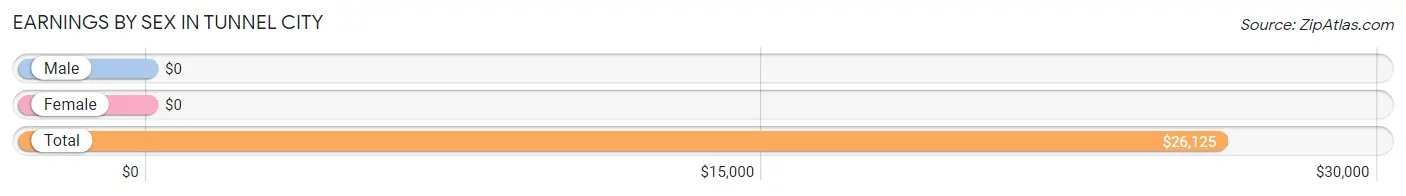
| Sex | Number | Average Earnings |
| Male | 28 (49.1%) | $0 |
| Female | 29 (50.9%) | $0 |
| Total | 57 (100.0%) | $26,125 |
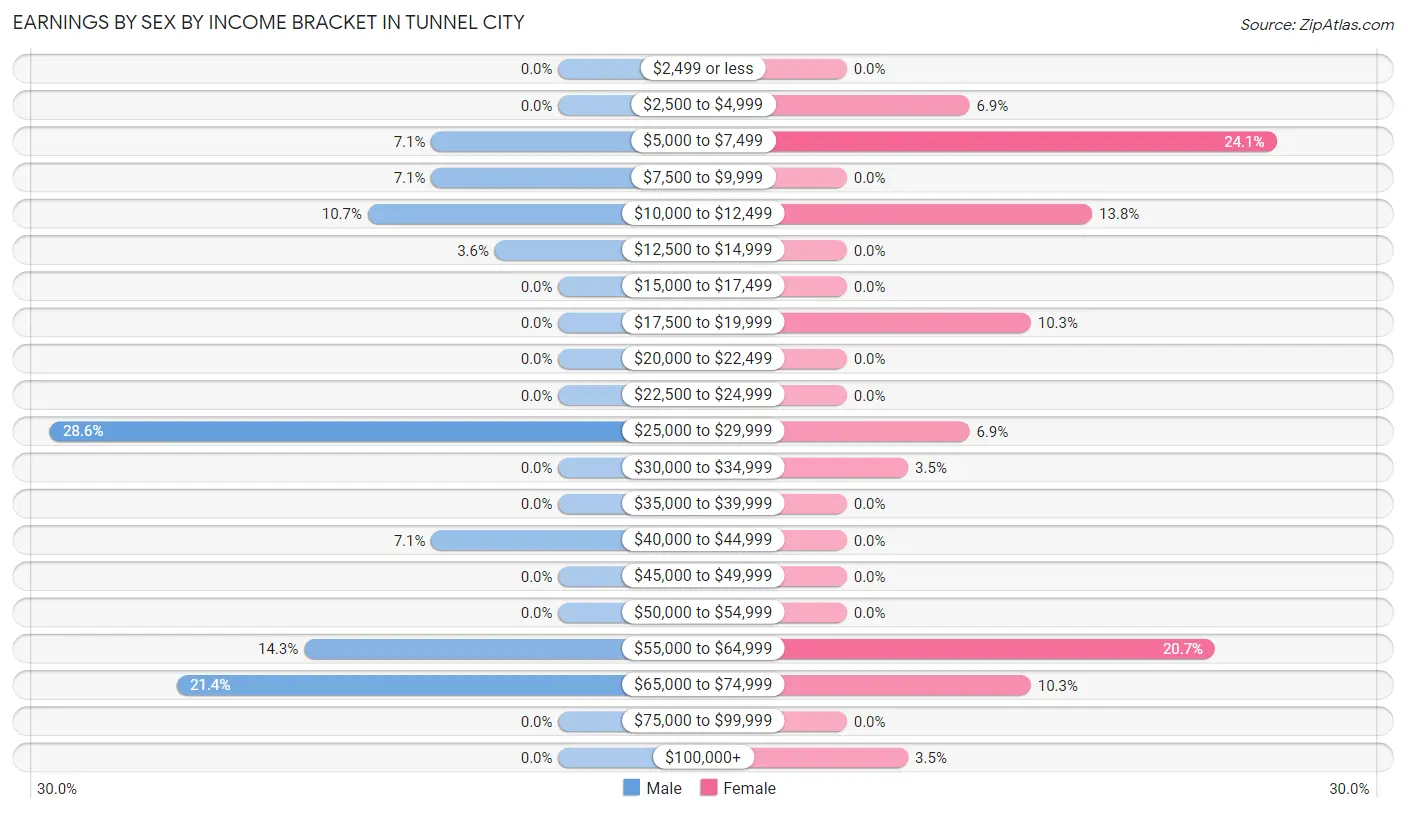
Earnings by Sex by Income Bracket in Tunnel City
The most common earnings brackets in Tunnel City are $25,000 to $29,999 for men (8 | 28.6%) and $5,000 to $7,499 for women (7 | 24.1%).
| Income | Male | Female |
| $2,499 or less | 0 (0.0%) | 0 (0.0%) |
| $2,500 to $4,999 | 0 (0.0%) | 2 (6.9%) |
| $5,000 to $7,499 | 2 (7.1%) | 7 (24.1%) |
| $7,500 to $9,999 | 2 (7.1%) | 0 (0.0%) |
| $10,000 to $12,499 | 3 (10.7%) | 4 (13.8%) |
| $12,500 to $14,999 | 1 (3.6%) | 0 (0.0%) |
| $15,000 to $17,499 | 0 (0.0%) | 0 (0.0%) |
| $17,500 to $19,999 | 0 (0.0%) | 3 (10.3%) |
| $20,000 to $22,499 | 0 (0.0%) | 0 (0.0%) |
| $22,500 to $24,999 | 0 (0.0%) | 0 (0.0%) |
| $25,000 to $29,999 | 8 (28.6%) | 2 (6.9%) |
| $30,000 to $34,999 | 0 (0.0%) | 1 (3.5%) |
| $35,000 to $39,999 | 0 (0.0%) | 0 (0.0%) |
| $40,000 to $44,999 | 2 (7.1%) | 0 (0.0%) |
| $45,000 to $49,999 | 0 (0.0%) | 0 (0.0%) |
| $50,000 to $54,999 | 0 (0.0%) | 0 (0.0%) |
| $55,000 to $64,999 | 4 (14.3%) | 6 (20.7%) |
| $65,000 to $74,999 | 6 (21.4%) | 3 (10.3%) |
| $75,000 to $99,999 | 0 (0.0%) | 0 (0.0%) |
| $100,000+ | 0 (0.0%) | 1 (3.5%) |
| Total | 28 (100.0%) | 29 (100.0%) |
Earnings by Sex by Educational Attainment in Tunnel City
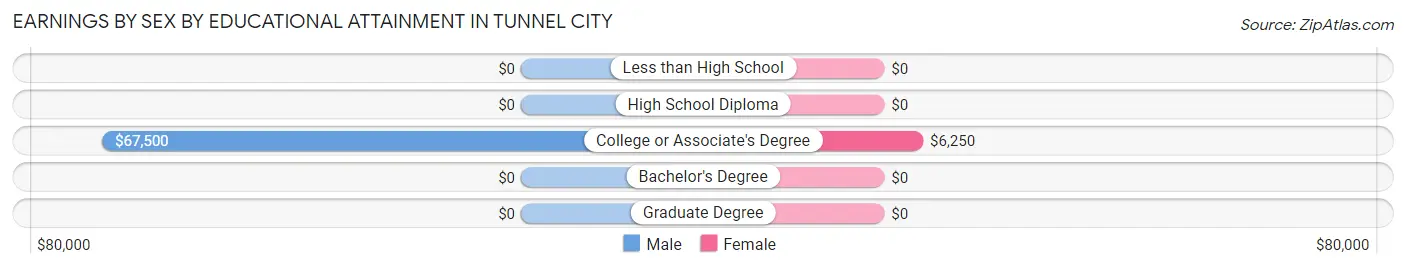
| Educational Attainment | Male Income | Female Income |
| Less than High School | - | - |
| High School Diploma | - | - |
| College or Associate's Degree | $67,500 | $6,250 |
| Bachelor's Degree | - | - |
| Graduate Degree | - | - |
| Total | - | - |
Family Income in Tunnel City
Family Income Brackets in Tunnel City
According to the Tunnel City family income data, there are 31 families falling into the $200,000+ income range, which is the most common income bracket and makes up 56.4% of all families.
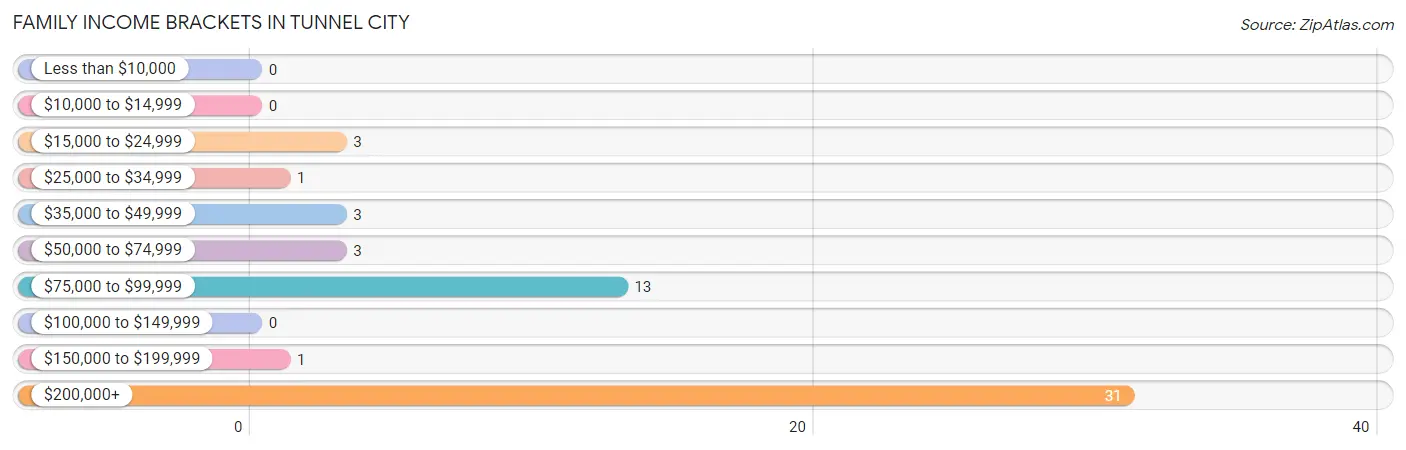
| Income Bracket | # Families | % Families |
| Less than $10,000 | 0 | 0.0% |
| $10,000 to $14,999 | 0 | 0.0% |
| $15,000 to $24,999 | 3 | 5.5% |
| $25,000 to $34,999 | 1 | 1.8% |
| $35,000 to $49,999 | 3 | 5.5% |
| $50,000 to $74,999 | 3 | 5.5% |
| $75,000 to $99,999 | 13 | 23.6% |
| $100,000 to $149,999 | 0 | 0.0% |
| $150,000 to $199,999 | 1 | 1.8% |
| $200,000+ | 31 | 56.4% |
Family Income by Famaliy Size in Tunnel City
2-person families (42 | 76.4%) account for the highest median family income in Tunnel City with $235,833 per family, while 2-person families (42 | 76.4%) have the highest median income of $117,916 per family member.
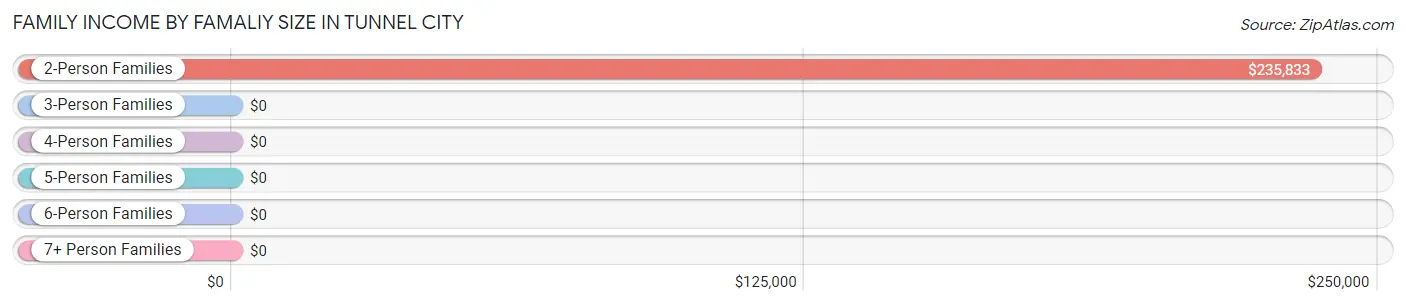
| Income Bracket | # Families | Median Income |
| 2-Person Families | 42 (76.4%) | $235,833 |
| 3-Person Families | 5 (9.1%) | $0 |
| 4-Person Families | 7 (12.7%) | $0 |
| 5-Person Families | 1 (1.8%) | $0 |
| 6-Person Families | 0 (0.0%) | $0 |
| 7+ Person Families | 0 (0.0%) | $0 |
| Total | 55 (100.0%) | $0 |
Family Income by Number of Earners in Tunnel City
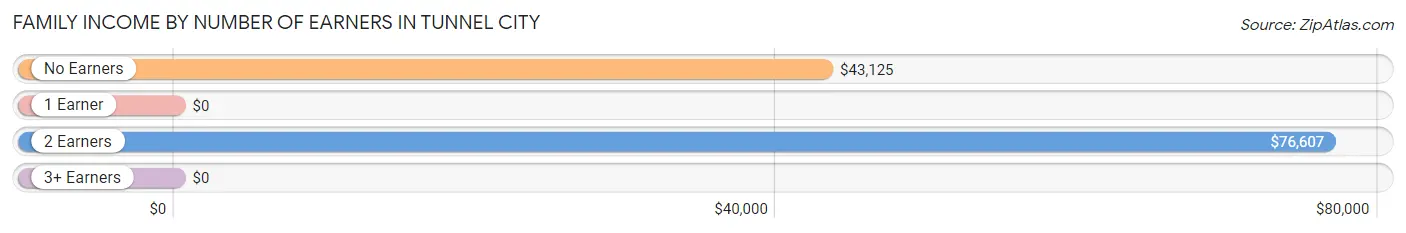
| Number of Earners | # Families | Median Income |
| No Earners | 5 (9.1%) | $43,125 |
| 1 Earner | 30 (54.5%) | $0 |
| 2 Earners | 19 (34.5%) | $76,607 |
| 3+ Earners | 1 (1.8%) | $0 |
| Total | 55 (100.0%) | $0 |
Household Income in Tunnel City
Household Income Brackets in Tunnel City
With 31 households falling in the category, the $200,000+ income range is the most frequent in Tunnel City, accounting for 43.7% of all households. In contrast, only 1 households (1.4%) fall into the $10,000 to $14,999 income bracket, making it the least populous group.
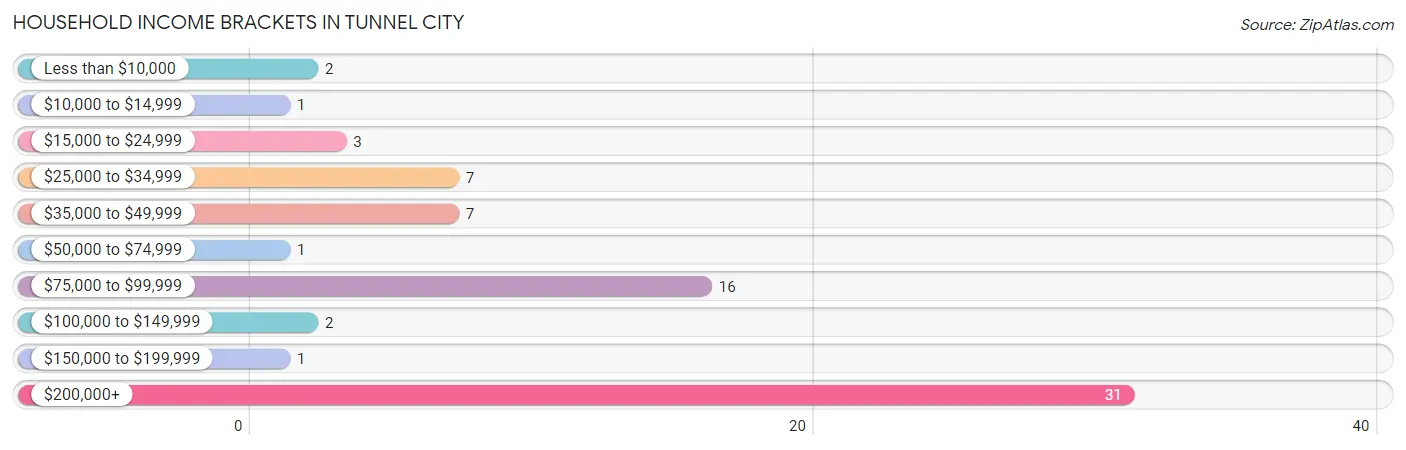
| Income Bracket | # Households | % Households |
| Less than $10,000 | 2 | 2.8% |
| $10,000 to $14,999 | 1 | 1.4% |
| $15,000 to $24,999 | 3 | 4.2% |
| $25,000 to $34,999 | 7 | 9.9% |
| $35,000 to $49,999 | 7 | 9.9% |
| $50,000 to $74,999 | 1 | 1.4% |
| $75,000 to $99,999 | 16 | 22.5% |
| $100,000 to $149,999 | 2 | 2.8% |
| $150,000 to $199,999 | 1 | 1.4% |
| $200,000+ | 31 | 43.7% |
Household Income by Householder Age in Tunnel City
The median household income in Tunnel City is $0, with the highest median household income of $76,786 found in the 25 to 44 years age bracket for the primary householder. A total of 20 households (28.2%) fall into this category. Meanwhile, the 15 to 24 years age bracket for the primary householder has the lowest median household income of $0, with 2 households (2.8%) in this group.
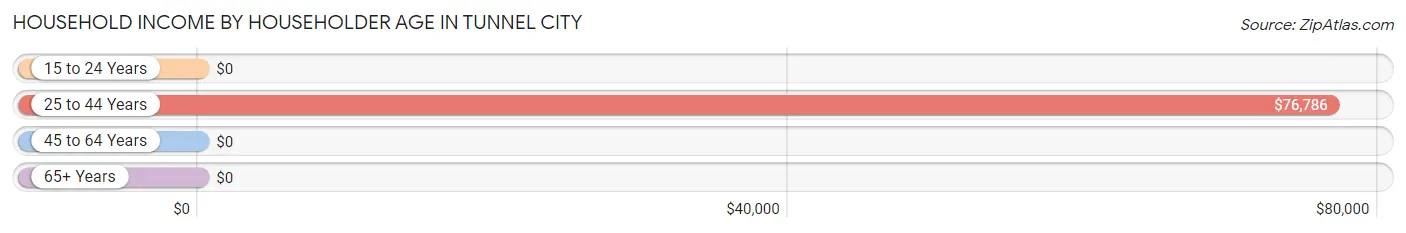
| Income Bracket | # Households | Median Income |
| 15 to 24 Years | 2 (2.8%) | $0 |
| 25 to 44 Years | 20 (28.2%) | $76,786 |
| 45 to 64 Years | 4 (5.6%) | $0 |
| 65+ Years | 45 (63.4%) | $0 |
| Total | 71 (100.0%) | $0 |
Poverty in Tunnel City
Income Below Poverty by Sex and Age in Tunnel City
With 5.1% poverty level for males and 12.0% for females among the residents of Tunnel City, 18 to 24 year old males and under 5 year old females are the most vulnerable to poverty, with 3 males (60.0%) and 1 females (100.0%) in their respective age groups living below the poverty level.
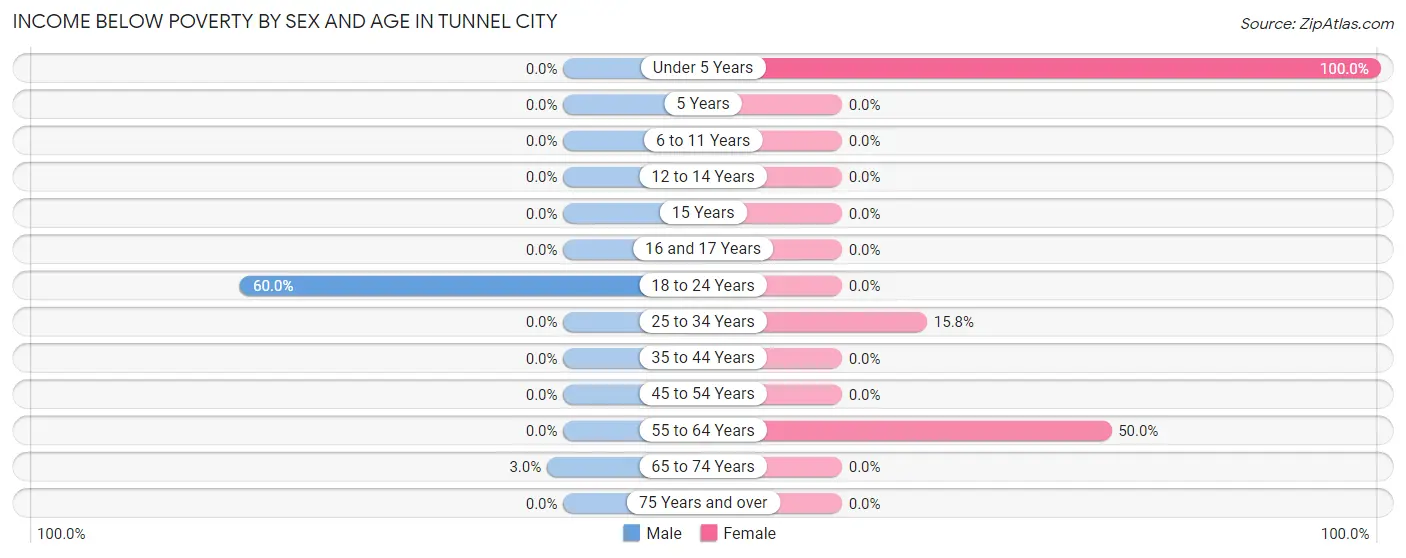
| Age Bracket | Male | Female |
| Under 5 Years | 0 (0.0%) | 1 (100.0%) |
| 5 Years | 0 (0.0%) | 0 (0.0%) |
| 6 to 11 Years | 0 (0.0%) | 0 (0.0%) |
| 12 to 14 Years | 0 (0.0%) | 0 (0.0%) |
| 15 Years | 0 (0.0%) | 0 (0.0%) |
| 16 and 17 Years | 0 (0.0%) | 0 (0.0%) |
| 18 to 24 Years | 3 (60.0%) | 0 (0.0%) |
| 25 to 34 Years | 0 (0.0%) | 3 (15.8%) |
| 35 to 44 Years | 0 (0.0%) | 0 (0.0%) |
| 45 to 54 Years | 0 (0.0%) | 0 (0.0%) |
| 55 to 64 Years | 0 (0.0%) | 2 (50.0%) |
| 65 to 74 Years | 1 (3.0%) | 0 (0.0%) |
| 75 Years and over | 0 (0.0%) | 0 (0.0%) |
| Total | 4 (5.1%) | 6 (12.0%) |
Income Above Poverty by Sex and Age in Tunnel City
According to the poverty statistics in Tunnel City, males aged under 5 years and females aged 6 to 11 years are the age groups that are most secure financially, with 100.0% of males and 100.0% of females in these age groups living above the poverty line.
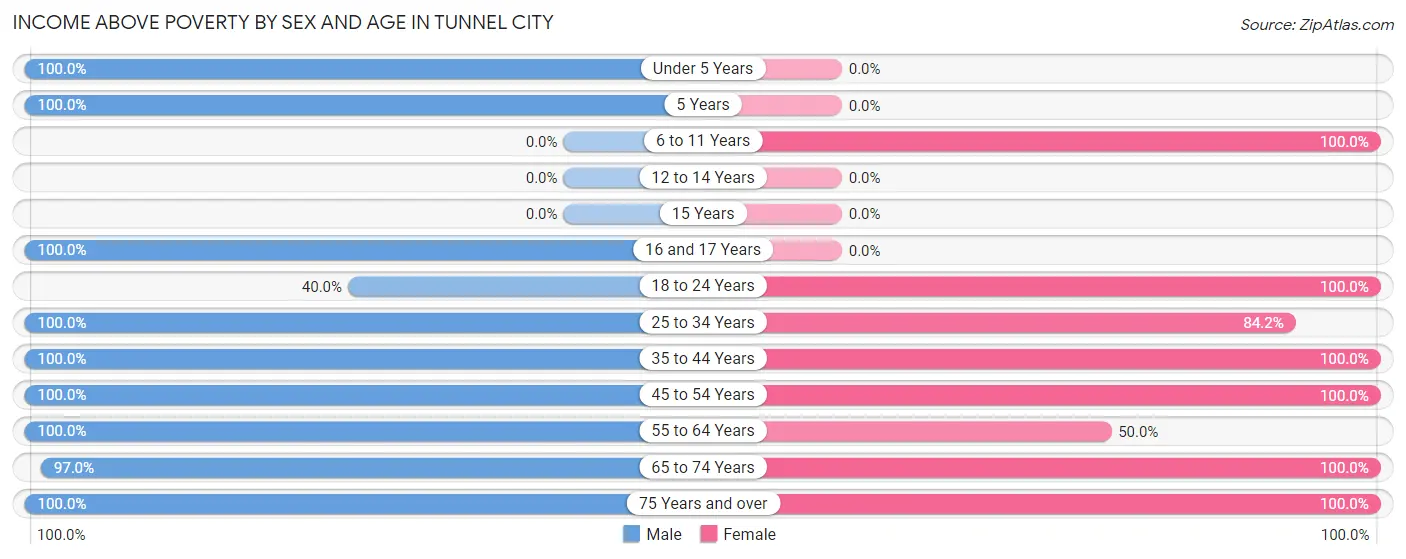
| Age Bracket | Male | Female |
| Under 5 Years | 8 (100.0%) | 0 (0.0%) |
| 5 Years | 1 (100.0%) | 0 (0.0%) |
| 6 to 11 Years | 0 (0.0%) | 10 (100.0%) |
| 12 to 14 Years | 0 (0.0%) | 0 (0.0%) |
| 15 Years | 0 (0.0%) | 0 (0.0%) |
| 16 and 17 Years | 2 (100.0%) | 0 (0.0%) |
| 18 to 24 Years | 2 (40.0%) | 3 (100.0%) |
| 25 to 34 Years | 6 (100.0%) | 16 (84.2%) |
| 35 to 44 Years | 4 (100.0%) | 2 (100.0%) |
| 45 to 54 Years | 8 (100.0%) | 1 (100.0%) |
| 55 to 64 Years | 3 (100.0%) | 2 (50.0%) |
| 65 to 74 Years | 32 (97.0%) | 4 (100.0%) |
| 75 Years and over | 8 (100.0%) | 6 (100.0%) |
| Total | 74 (94.9%) | 44 (88.0%) |
Income Below Poverty Among Married-Couple Families in Tunnel City
The poverty statistics for married-couple families in Tunnel City show that 5.7% or 3 of the total 53 families live below the poverty line. Families with 1 or 2 children have the highest poverty rate of 27.3%, comprising of 3 families. On the other hand, families with no children have the lowest poverty rate of 0.0%, which includes 0 families.
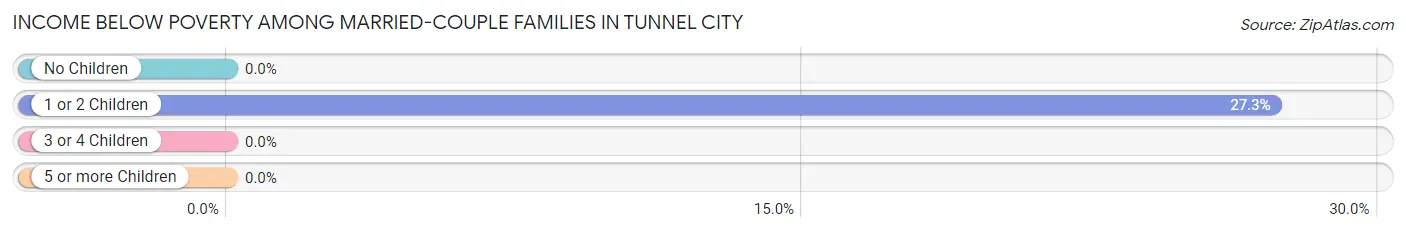
| Children | Above Poverty | Below Poverty |
| No Children | 42 (100.0%) | 0 (0.0%) |
| 1 or 2 Children | 8 (72.7%) | 3 (27.3%) |
| 3 or 4 Children | 0 (0.0%) | 0 (0.0%) |
| 5 or more Children | 0 (0.0%) | 0 (0.0%) |
| Total | 50 (94.3%) | 3 (5.7%) |
Income Below Poverty Among Single-Parent Households in Tunnel City
| Children | Single Father | Single Mother |
| No Children | 0 (0.0%) | 0 (0.0%) |
| 1 or 2 Children | 0 (0.0%) | 0 (0.0%) |
| 3 or 4 Children | 0 (0.0%) | 0 (0.0%) |
| 5 or more Children | 0 (0.0%) | 0 (0.0%) |
| Total | 0 (0.0%) | 0 (0.0%) |
Income Below Poverty Among Married-Couple vs Single-Parent Households in Tunnel City
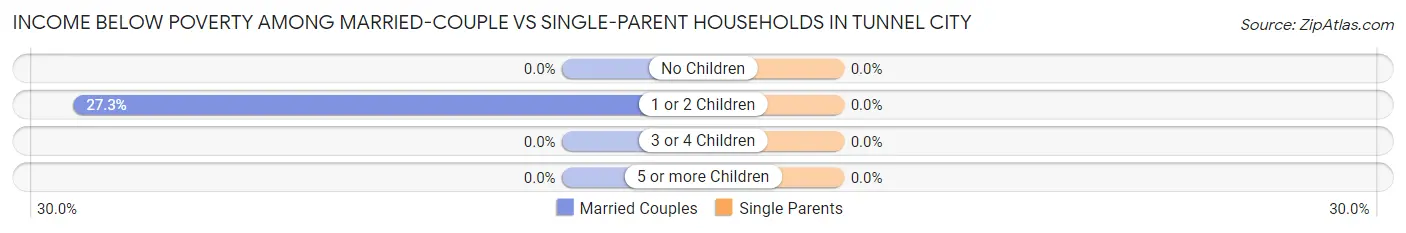
| Children | Married-Couple Families | Single-Parent Households |
| No Children | 0 (0.0%) | 0 (0.0%) |
| 1 or 2 Children | 3 (27.3%) | 0 (0.0%) |
| 3 or 4 Children | 0 (0.0%) | 0 (0.0%) |
| 5 or more Children | 0 (0.0%) | 0 (0.0%) |
| Total | 3 (5.7%) | 0 (0.0%) |
Race in Tunnel City
The most populous races in Tunnel City are White / Caucasian (121 | 94.5%), Two or more Races (5 | 3.9%), and Black / African American (2 | 1.6%).
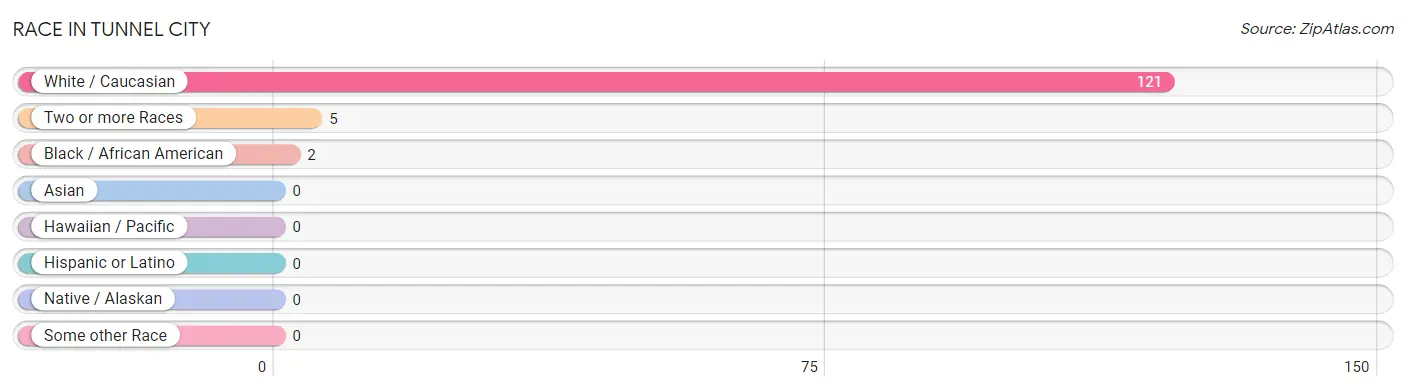
| Race | # Population | % Population |
| Asian | 0 | 0.0% |
| Black / African American | 2 | 1.6% |
| Hawaiian / Pacific | 0 | 0.0% |
| Hispanic or Latino | 0 | 0.0% |
| Native / Alaskan | 0 | 0.0% |
| White / Caucasian | 121 | 94.5% |
| Two or more Races | 5 | 3.9% |
| Some other Race | 0 | 0.0% |
| Total | 128 | 100.0% |
Ancestry in Tunnel City
The most populous ancestries reported in Tunnel City are Irish (34 | 26.6%), German (20 | 15.6%), American (7 | 5.5%), Danish (6 | 4.7%), and Norwegian (5 | 3.9%), together accounting for 56.3% of all Tunnel City residents.
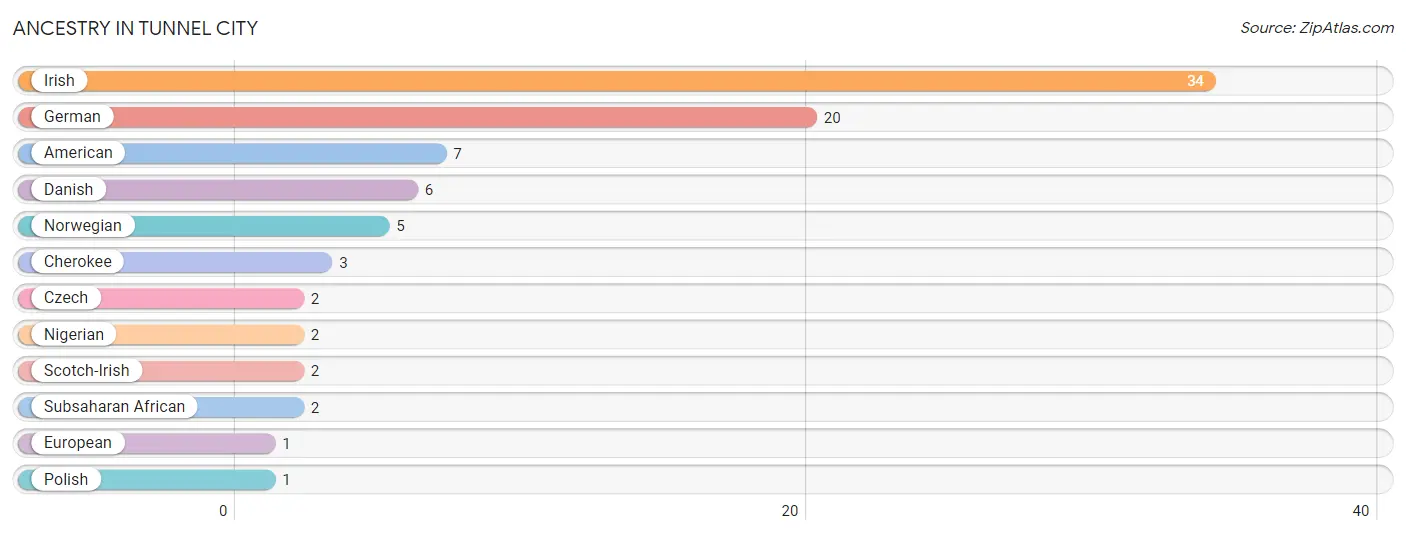
| Ancestry | # Population | % Population |
| American | 7 | 5.5% |
| Cherokee | 3 | 2.3% |
| Czech | 2 | 1.6% |
| Danish | 6 | 4.7% |
| European | 1 | 0.8% |
| German | 20 | 15.6% |
| Irish | 34 | 26.6% |
| Nigerian | 2 | 1.6% |
| Norwegian | 5 | 3.9% |
| Polish | 1 | 0.8% |
| Scotch-Irish | 2 | 1.6% |
| Subsaharan African | 2 | 1.6% | View All 12 Rows |
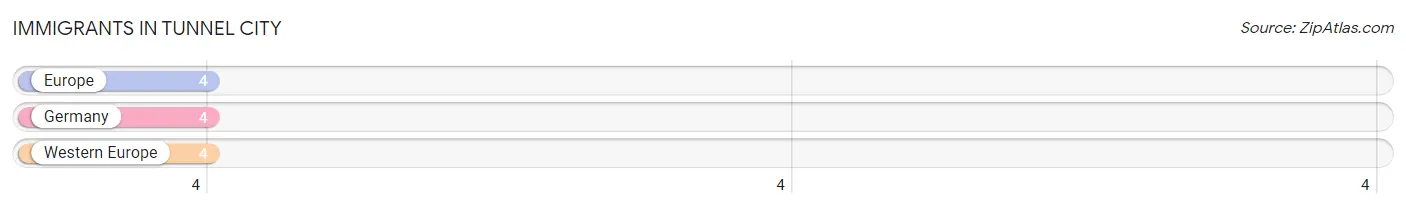
Immigrants in Tunnel City
The most numerous immigrant groups reported in Tunnel City came from Europe (4 | 3.1%), Germany (4 | 3.1%), and Western Europe (4 | 3.1%), together accounting for 9.4% of all Tunnel City residents.
| Immigration Origin | # Population | % Population |
| Europe | 4 | 3.1% |
| Germany | 4 | 3.1% |
| Western Europe | 4 | 3.1% | View All 3 Rows |
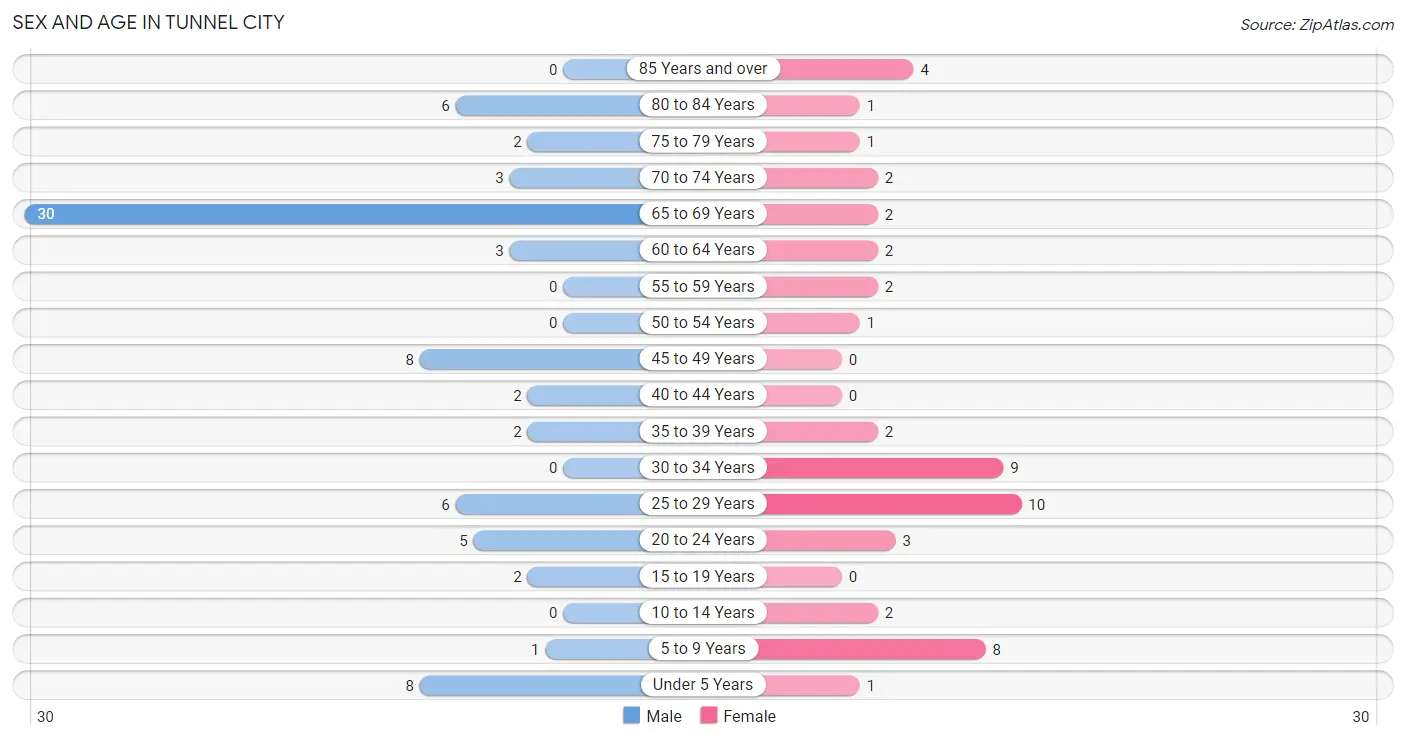
Sex and Age in Tunnel City
Sex and Age in Tunnel City
The most populous age groups in Tunnel City are 65 to 69 Years (30 | 38.5%) for men and 25 to 29 Years (10 | 20.0%) for women.
| Age Bracket | Male | Female |
| Under 5 Years | 8 (10.3%) | 1 (2.0%) |
| 5 to 9 Years | 1 (1.3%) | 8 (16.0%) |
| 10 to 14 Years | 0 (0.0%) | 2 (4.0%) |
| 15 to 19 Years | 2 (2.6%) | 0 (0.0%) |
| 20 to 24 Years | 5 (6.4%) | 3 (6.0%) |
| 25 to 29 Years | 6 (7.7%) | 10 (20.0%) |
| 30 to 34 Years | 0 (0.0%) | 9 (18.0%) |
| 35 to 39 Years | 2 (2.6%) | 2 (4.0%) |
| 40 to 44 Years | 2 (2.6%) | 0 (0.0%) |
| 45 to 49 Years | 8 (10.3%) | 0 (0.0%) |
| 50 to 54 Years | 0 (0.0%) | 1 (2.0%) |
| 55 to 59 Years | 0 (0.0%) | 2 (4.0%) |
| 60 to 64 Years | 3 (3.8%) | 2 (4.0%) |
| 65 to 69 Years | 30 (38.5%) | 2 (4.0%) |
| 70 to 74 Years | 3 (3.8%) | 2 (4.0%) |
| 75 to 79 Years | 2 (2.6%) | 1 (2.0%) |
| 80 to 84 Years | 6 (7.7%) | 1 (2.0%) |
| 85 Years and over | 0 (0.0%) | 4 (8.0%) |
| Total | 78 (100.0%) | 50 (100.0%) |
Families and Households in Tunnel City
Median Family Size in Tunnel City
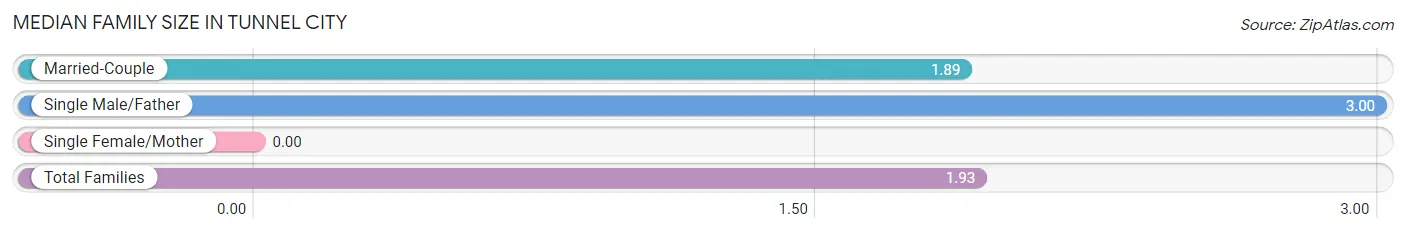
| Family Type | # Families | Family Size |
| Married-Couple | 53 (96.4%) | 1.89 |
| Single Male/Father | 2 (3.6%) | 3.00 |
| Single Female/Mother | 0 (0.0%) | - |
| Total Families | 55 (100.0%) | 1.93 |
Median Household Size in Tunnel City
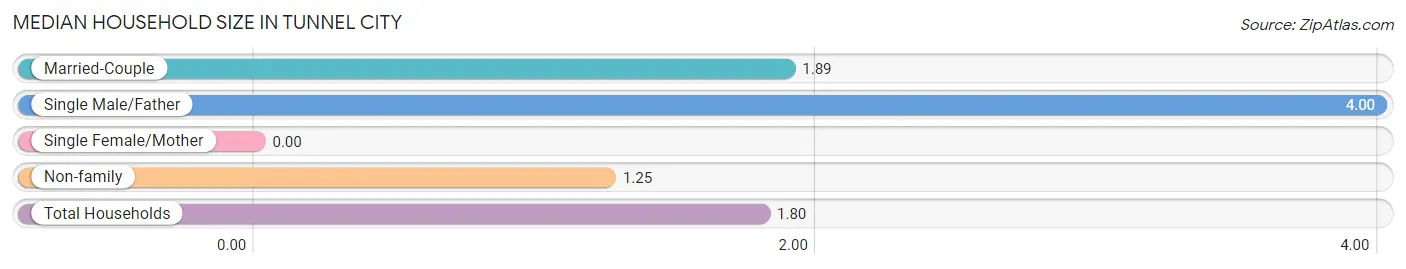
| Household Type | # Households | Household Size |
| Married-Couple | 53 (74.7%) | 1.89 |
| Single Male/Father | 2 (2.8%) | 4.00 |
| Single Female/Mother | 0 (0.0%) | - |
| Non-family | 16 (22.5%) | 1.25 |
| Total Households | 71 (100.0%) | 1.80 |
Household Size by Marriage Status in Tunnel City
Out of a total of 71 households in Tunnel City, 55 (77.5%) are family households, while 16 (22.5%) are nonfamily households. The most numerous type of family households are 2-person households, comprising 42, and the most common type of nonfamily households are 1-person households, comprising 13.
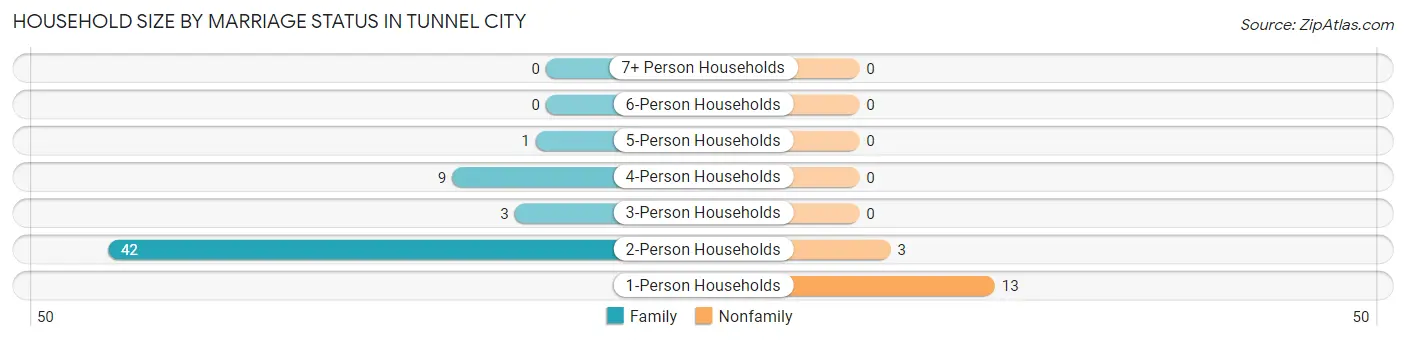
| Household Size | Family Households | Nonfamily Households |
| 1-Person Households | - | 13 (18.3%) |
| 2-Person Households | 42 (59.2%) | 3 (4.2%) |
| 3-Person Households | 3 (4.2%) | 0 (0.0%) |
| 4-Person Households | 9 (12.7%) | 0 (0.0%) |
| 5-Person Households | 1 (1.4%) | 0 (0.0%) |
| 6-Person Households | 0 (0.0%) | 0 (0.0%) |
| 7+ Person Households | 0 (0.0%) | 0 (0.0%) |
| Total | 55 (77.5%) | 16 (22.5%) |
Female Fertility in Tunnel City
Fertility by Age in Tunnel City
Average fertility rate in Tunnel City is 125.0 births per 1,000 women. Women in the age bracket of 20 to 34 years have the highest fertility rate with 136.0 births per 1,000 women. Women in the age bracket of 20 to 34 years acount for 100.0% of all women with births.
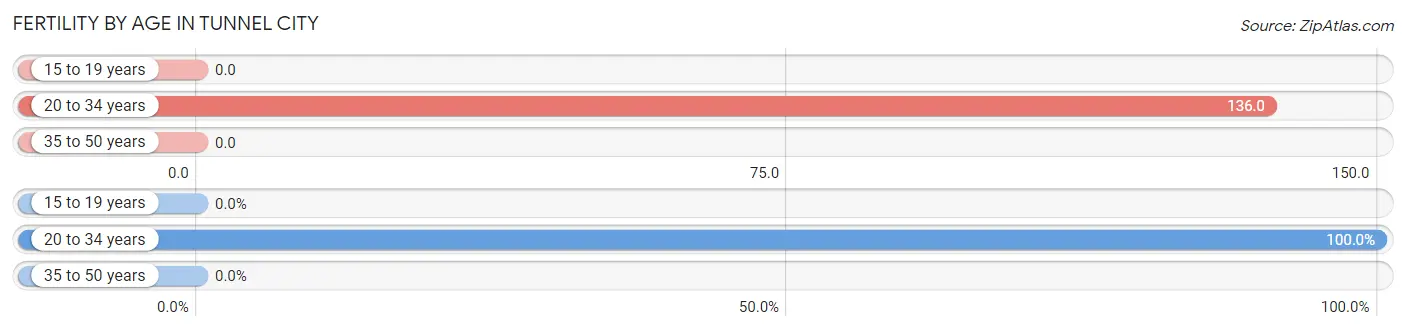
| Age Bracket | Women with Births | Births / 1,000 Women |
| 15 to 19 years | 0 (0.0%) | 0.0 |
| 20 to 34 years | 3 (100.0%) | 136.0 |
| 35 to 50 years | 0 (0.0%) | 0.0 |
| Total | 3 (100.0%) | 125.0 |
Fertility by Age by Marriage Status in Tunnel City
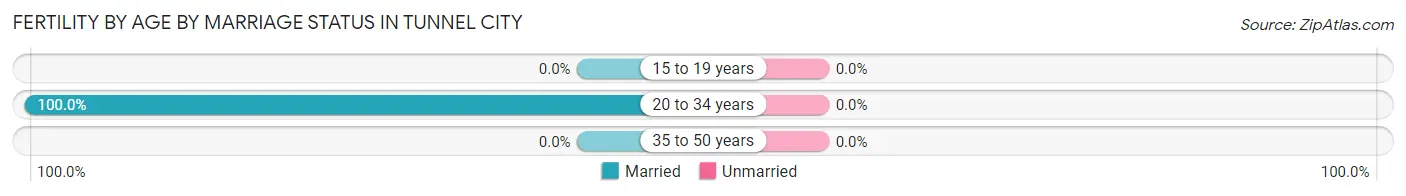
| Age Bracket | Married | Unmarried |
| 15 to 19 years | 0 (0.0%) | 0 (0.0%) |
| 20 to 34 years | 3 (100.0%) | 0 (0.0%) |
| 35 to 50 years | 0 (0.0%) | 0 (0.0%) |
| Total | 3 (100.0%) | 0 (0.0%) |
Fertility by Education in Tunnel City
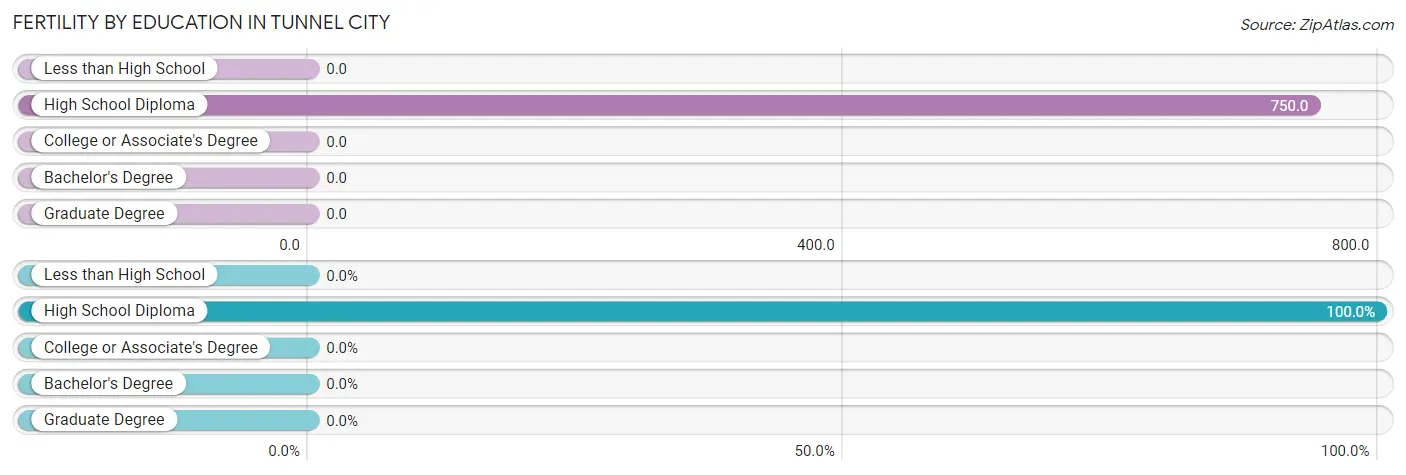
| Educational Attainment | Women with Births | Births / 1,000 Women |
| Less than High School | 0 (0.0%) | 0.0 |
| High School Diploma | 3 (100.0%) | 750.0 |
| College or Associate's Degree | 0 (0.0%) | 0.0 |
| Bachelor's Degree | 0 (0.0%) | 0.0 |
| Graduate Degree | 0 (0.0%) | 0.0 |
| Total | 3 (100.0%) | 125.0 |
Fertility by Education by Marriage Status in Tunnel City
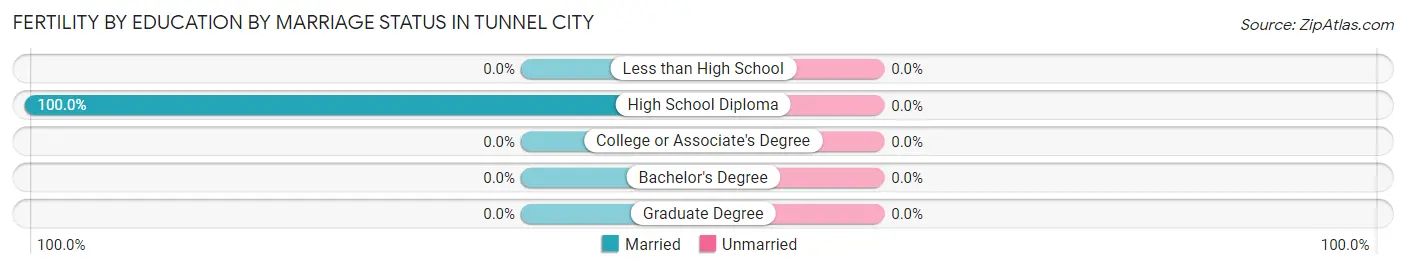
| Educational Attainment | Married | Unmarried |
| Less than High School | 0 (0.0%) | 0 (0.0%) |
| High School Diploma | 3 (100.0%) | 0 (0.0%) |
| College or Associate's Degree | 0 (0.0%) | 0 (0.0%) |
| Bachelor's Degree | 0 (0.0%) | 0 (0.0%) |
| Graduate Degree | 0 (0.0%) | 0 (0.0%) |
| Total | 3 (100.0%) | 0 (0.0%) |
Employment Characteristics in Tunnel City
Employment by Class of Employer in Tunnel City
Among the 57 employed individuals in Tunnel City, private company employees (35 | 61.4%), self-employed (not incorporated) (9 | 15.8%), and not-for-profit organizations (6 | 10.5%) make up the most common classes of employment.
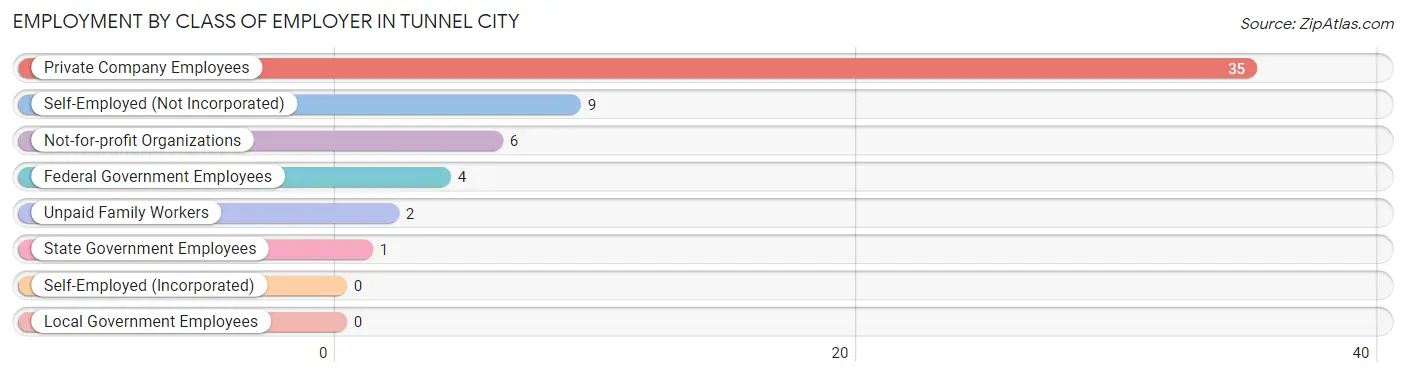
| Employer Class | # Employees | % Employees |
| Private Company Employees | 35 | 61.4% |
| Self-Employed (Incorporated) | 0 | 0.0% |
| Self-Employed (Not Incorporated) | 9 | 15.8% |
| Not-for-profit Organizations | 6 | 10.5% |
| Local Government Employees | 0 | 0.0% |
| State Government Employees | 1 | 1.8% |
| Federal Government Employees | 4 | 7.0% |
| Unpaid Family Workers | 2 | 3.5% |
| Total | 57 | 100.0% |
Employment Status by Age in Tunnel City
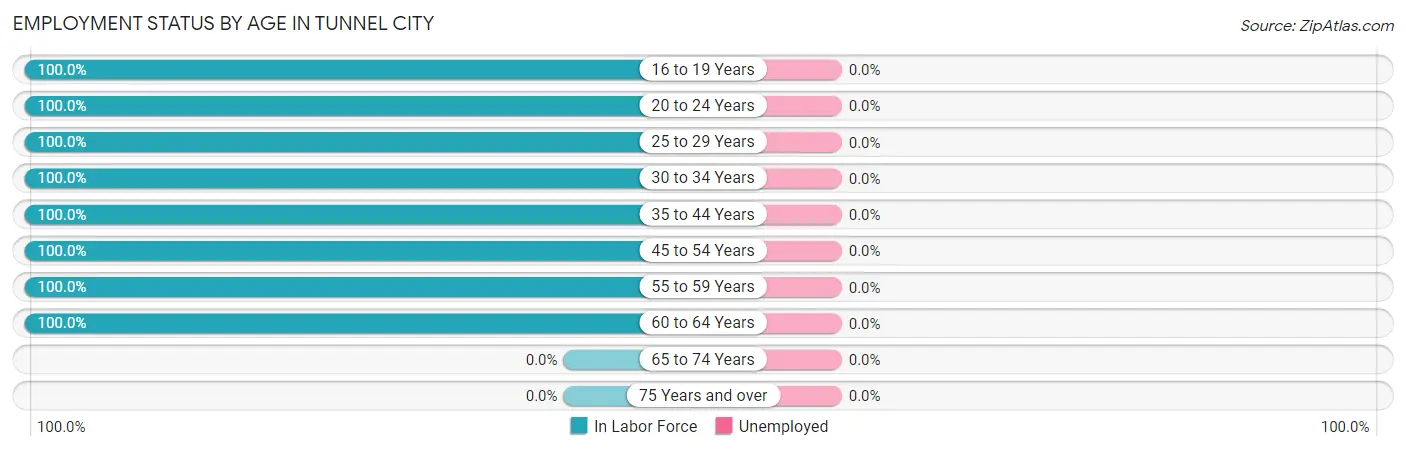
| Age Bracket | In Labor Force | Unemployed |
| 16 to 19 Years | 2 (100.0%) | 0 (0.0%) |
| 20 to 24 Years | 8 (100.0%) | 0 (0.0%) |
| 25 to 29 Years | 16 (100.0%) | 0 (0.0%) |
| 30 to 34 Years | 9 (100.0%) | 0 (0.0%) |
| 35 to 44 Years | 6 (100.0%) | 0 (0.0%) |
| 45 to 54 Years | 9 (100.0%) | 0 (0.0%) |
| 55 to 59 Years | 2 (100.0%) | 0 (0.0%) |
| 60 to 64 Years | 5 (100.0%) | 0 (0.0%) |
| 65 to 74 Years | 0 (0.0%) | 0 (0.0%) |
| 75 Years and over | 0 (0.0%) | 0 (0.0%) |
| Total | 57 (52.8%) | 0 (0.0%) |
Employment Status by Educational Attainment in Tunnel City
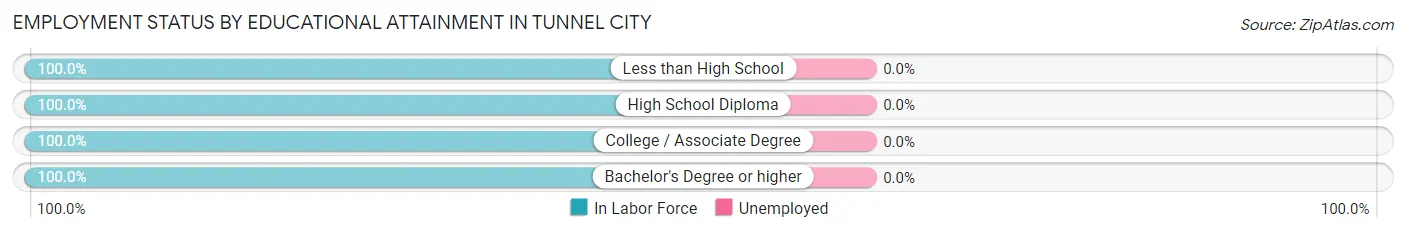
| Educational Attainment | In Labor Force | Unemployed |
| Less than High School | 7 (100.0%) | 0 (0.0%) |
| High School Diploma | 14 (100.0%) | 0 (0.0%) |
| College / Associate Degree | 23 (100.0%) | 0 (0.0%) |
| Bachelor's Degree or higher | 3 (100.0%) | 0 (0.0%) |
| Total | 47 (100.0%) | 0 (0.0%) |
Employment Occupations by Sex in Tunnel City
Management, Business, Science and Arts Occupations
The most common Management, Business, Science and Arts occupations in Tunnel City are Health Diagnosing & Treating (6 | 10.5%), Business & Financial (2 | 3.5%), and Management (1 | 1.8%).
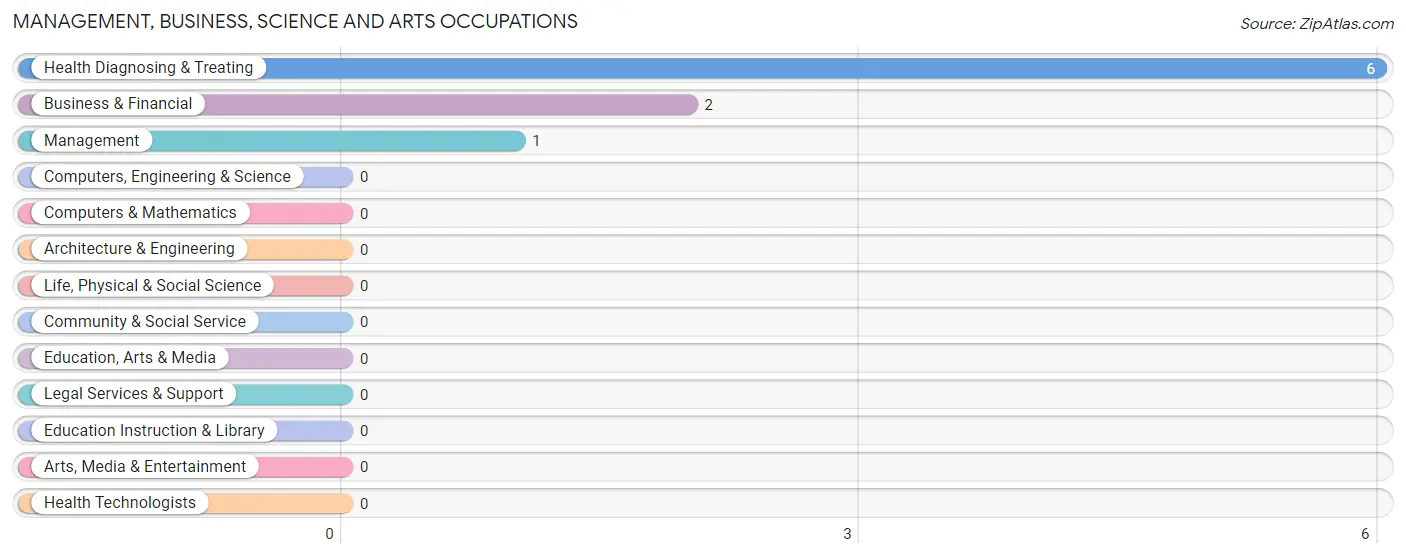
Management, Business, Science and Arts Occupations by Sex
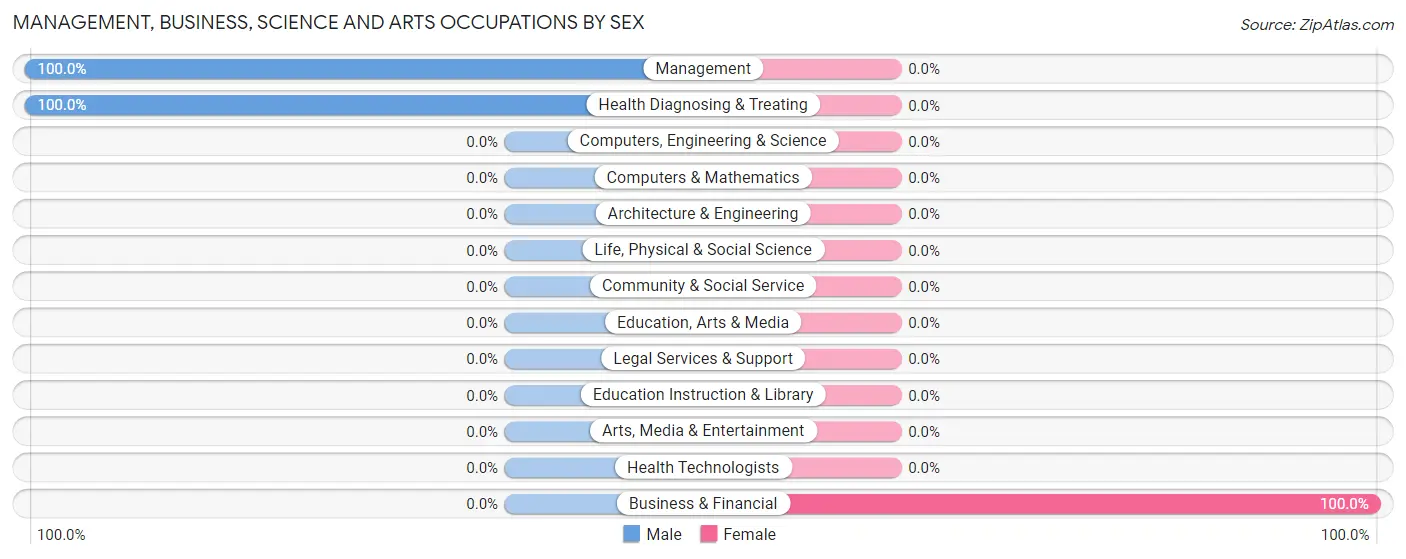
| Occupation | Male | Female |
| Management | 1 (100.0%) | 0 (0.0%) |
| Business & Financial | 0 (0.0%) | 2 (100.0%) |
| Computers, Engineering & Science | 0 (0.0%) | 0 (0.0%) |
| Computers & Mathematics | 0 (0.0%) | 0 (0.0%) |
| Architecture & Engineering | 0 (0.0%) | 0 (0.0%) |
| Life, Physical & Social Science | 0 (0.0%) | 0 (0.0%) |
| Community & Social Service | 0 (0.0%) | 0 (0.0%) |
| Education, Arts & Media | 0 (0.0%) | 0 (0.0%) |
| Legal Services & Support | 0 (0.0%) | 0 (0.0%) |
| Education Instruction & Library | 0 (0.0%) | 0 (0.0%) |
| Arts, Media & Entertainment | 0 (0.0%) | 0 (0.0%) |
| Health Diagnosing & Treating | 6 (100.0%) | 0 (0.0%) |
| Health Technologists | 0 (0.0%) | 0 (0.0%) |
| Total (Category) | 7 (77.8%) | 2 (22.2%) |
| Total (Overall) | 28 (49.1%) | 29 (50.9%) |
Services Occupations
The most common Services occupations in Tunnel City are Personal Care & Service (7 | 12.3%), Food Preparation & Serving (3 | 5.3%), and Healthcare Support (2 | 3.5%).
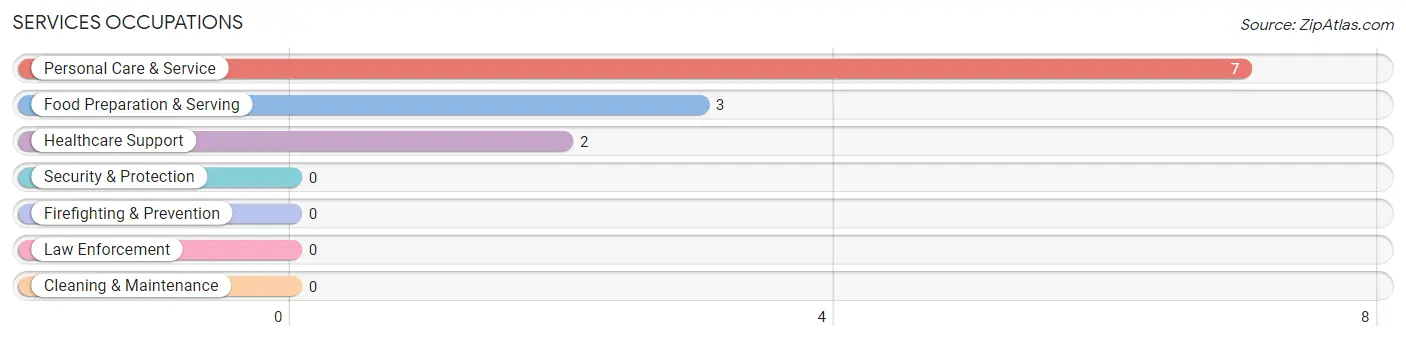
Services Occupations by Sex
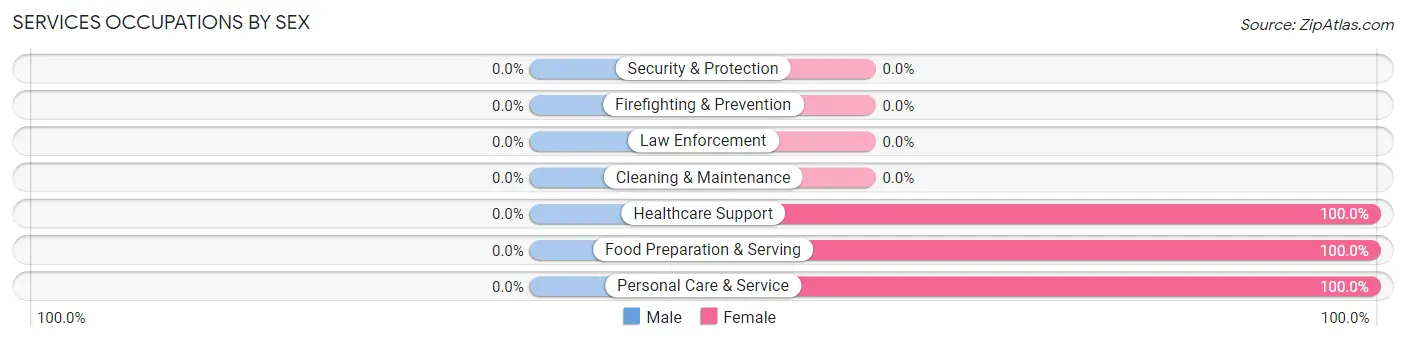
| Occupation | Male | Female |
| Healthcare Support | 0 (0.0%) | 2 (100.0%) |
| Security & Protection | 0 (0.0%) | 0 (0.0%) |
| Firefighting & Prevention | 0 (0.0%) | 0 (0.0%) |
| Law Enforcement | 0 (0.0%) | 0 (0.0%) |
| Food Preparation & Serving | 0 (0.0%) | 3 (100.0%) |
| Cleaning & Maintenance | 0 (0.0%) | 0 (0.0%) |
| Personal Care & Service | 0 (0.0%) | 7 (100.0%) |
| Total (Category) | 0 (0.0%) | 12 (100.0%) |
| Total (Overall) | 28 (49.1%) | 29 (50.9%) |
Sales and Office Occupations
The most common Sales and Office occupations in Tunnel City are Sales & Related (3 | 5.3%), and Office & Administration (3 | 5.3%).
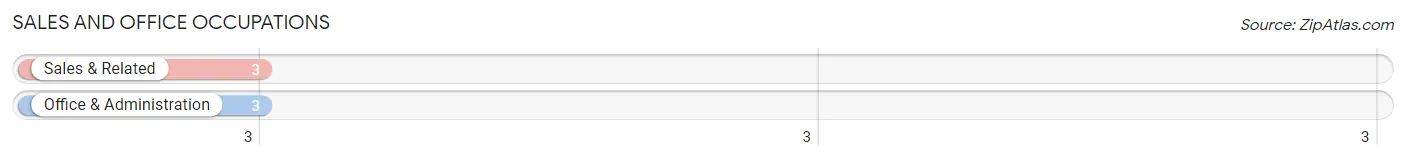
Sales and Office Occupations by Sex
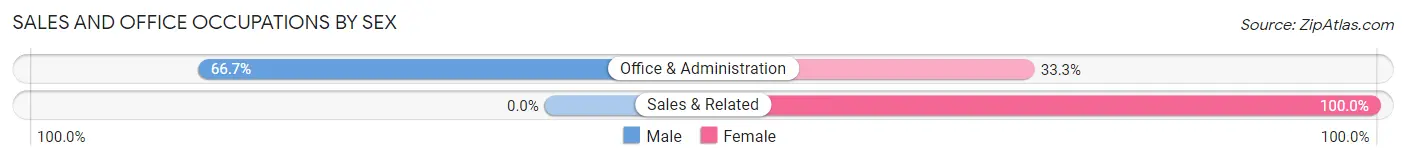
| Occupation | Male | Female |
| Sales & Related | 0 (0.0%) | 3 (100.0%) |
| Office & Administration | 2 (66.7%) | 1 (33.3%) |
| Total (Category) | 2 (33.3%) | 4 (66.7%) |
| Total (Overall) | 28 (49.1%) | 29 (50.9%) |
Natural Resources, Construction and Maintenance Occupations
The most common Natural Resources, Construction and Maintenance occupations in Tunnel City are Installation, Maintenance & Repair (3 | 5.3%), Construction & Extraction (2 | 3.5%), and Farming, Fishing & Forestry (1 | 1.8%).
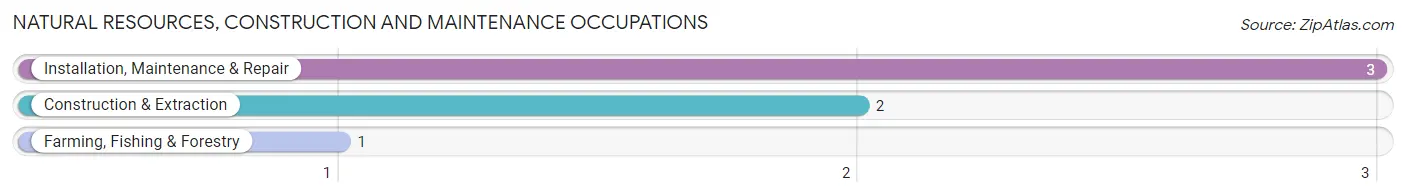
Natural Resources, Construction and Maintenance Occupations by Sex
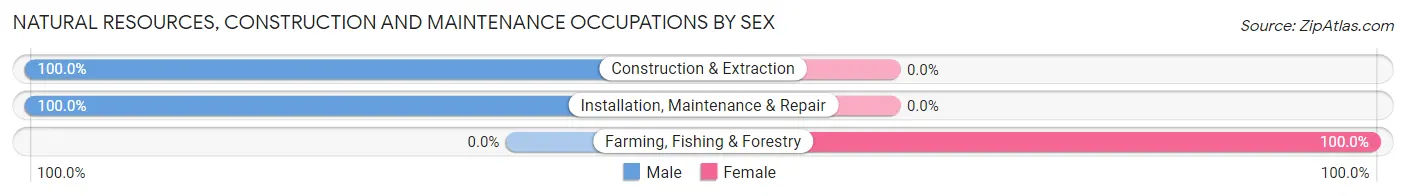
| Occupation | Male | Female |
| Farming, Fishing & Forestry | 0 (0.0%) | 1 (100.0%) |
| Construction & Extraction | 2 (100.0%) | 0 (0.0%) |
| Installation, Maintenance & Repair | 3 (100.0%) | 0 (0.0%) |
| Total (Category) | 5 (83.3%) | 1 (16.7%) |
| Total (Overall) | 28 (49.1%) | 29 (50.9%) |
Production, Transportation and Moving Occupations
The most common Production, Transportation and Moving occupations in Tunnel City are Transportation (14 | 24.6%), Production (6 | 10.5%), and Material Moving (4 | 7.0%).
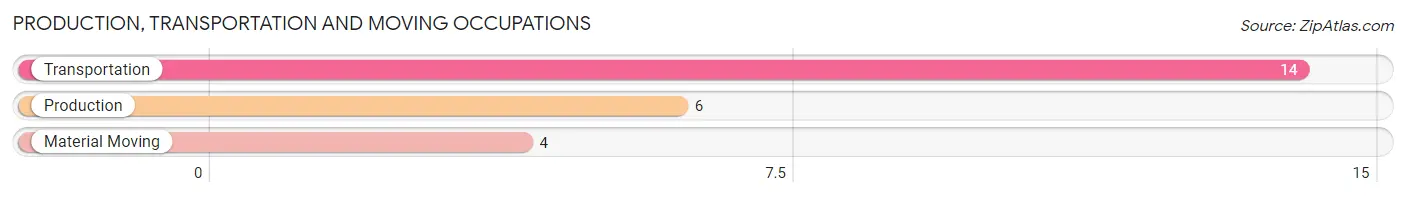
Production, Transportation and Moving Occupations by Sex
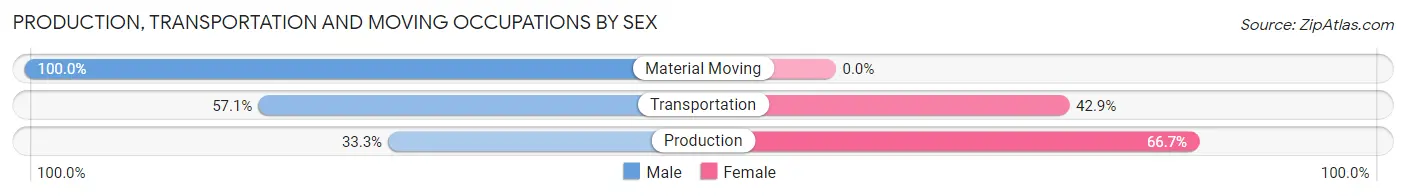
| Occupation | Male | Female |
| Production | 2 (33.3%) | 4 (66.7%) |
| Transportation | 8 (57.1%) | 6 (42.9%) |
| Material Moving | 4 (100.0%) | 0 (0.0%) |
| Total (Category) | 14 (58.3%) | 10 (41.7%) |
| Total (Overall) | 28 (49.1%) | 29 (50.9%) |
Employment Industries by Sex in Tunnel City
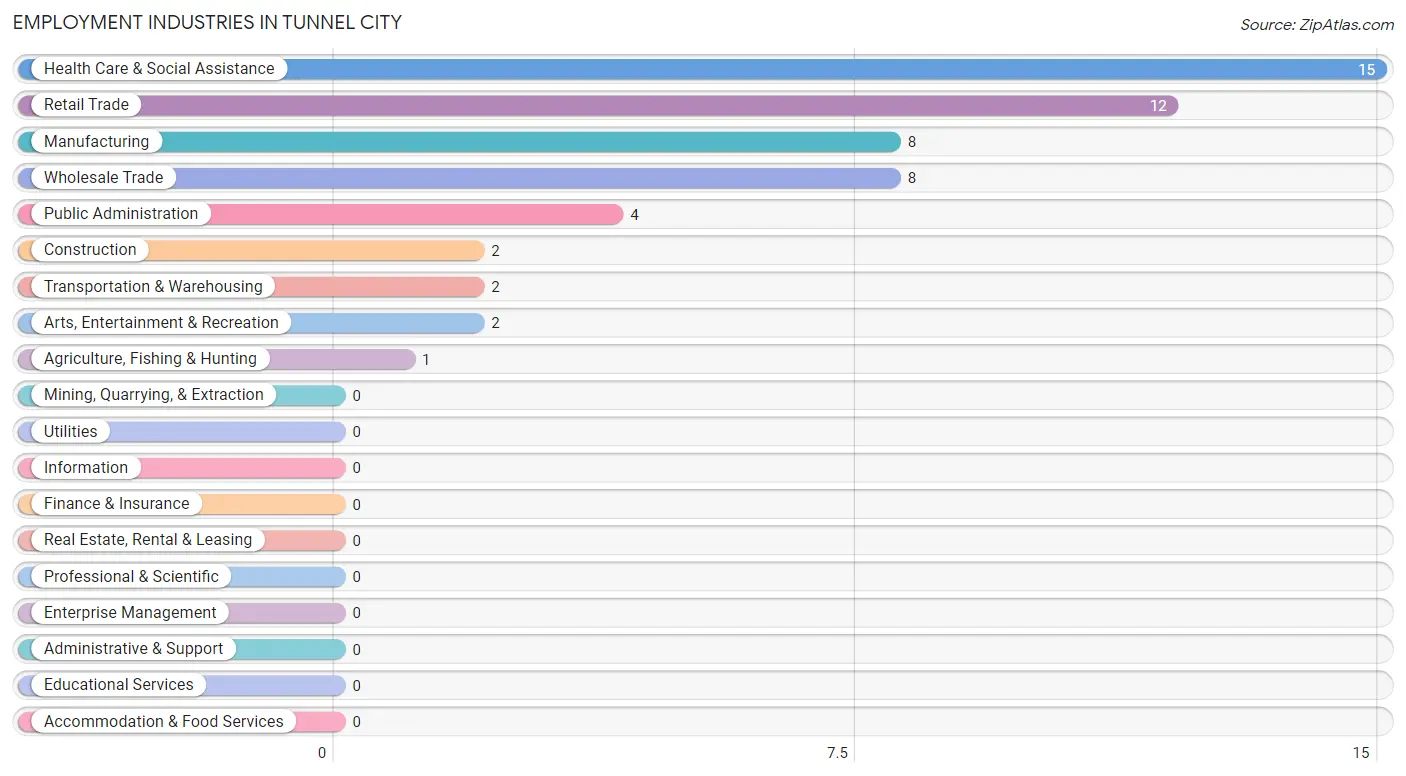
Employment Industries in Tunnel City
The major employment industries in Tunnel City include Health Care & Social Assistance (15 | 26.3%), Retail Trade (12 | 21.0%), Manufacturing (8 | 14.0%), Wholesale Trade (8 | 14.0%), and Public Administration (4 | 7.0%).
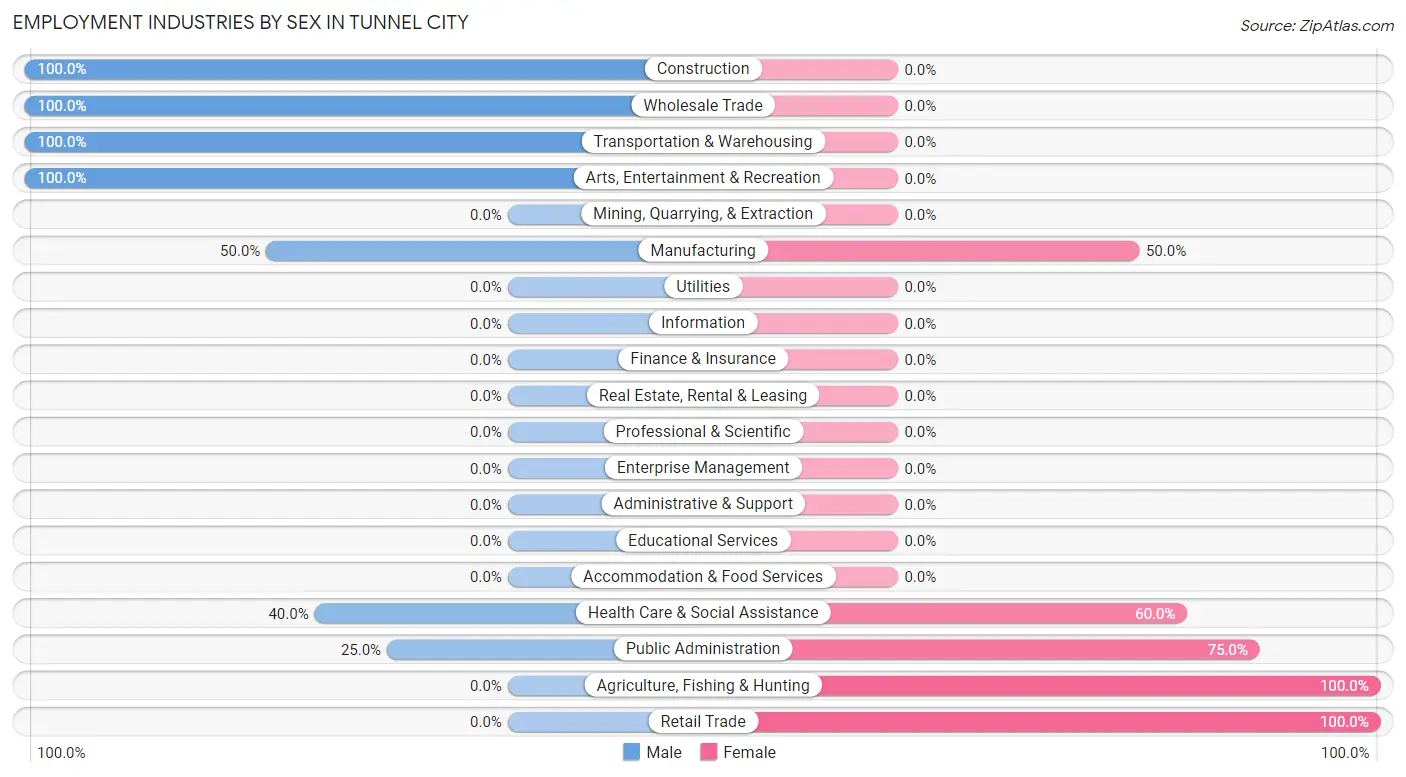
Employment Industries by Sex in Tunnel City
The Tunnel City industries that see more men than women are Construction (100.0%), Wholesale Trade (100.0%), and Transportation & Warehousing (100.0%), whereas the industries that tend to have a higher number of women are Agriculture, Fishing & Hunting (100.0%), Retail Trade (100.0%), and Public Administration (75.0%).
| Industry | Male | Female |
| Agriculture, Fishing & Hunting | 0 (0.0%) | 1 (100.0%) |
| Mining, Quarrying, & Extraction | 0 (0.0%) | 0 (0.0%) |
| Construction | 2 (100.0%) | 0 (0.0%) |
| Manufacturing | 4 (50.0%) | 4 (50.0%) |
| Wholesale Trade | 8 (100.0%) | 0 (0.0%) |
| Retail Trade | 0 (0.0%) | 12 (100.0%) |
| Transportation & Warehousing | 2 (100.0%) | 0 (0.0%) |
| Utilities | 0 (0.0%) | 0 (0.0%) |
| Information | 0 (0.0%) | 0 (0.0%) |
| Finance & Insurance | 0 (0.0%) | 0 (0.0%) |
| Real Estate, Rental & Leasing | 0 (0.0%) | 0 (0.0%) |
| Professional & Scientific | 0 (0.0%) | 0 (0.0%) |
| Enterprise Management | 0 (0.0%) | 0 (0.0%) |
| Administrative & Support | 0 (0.0%) | 0 (0.0%) |
| Educational Services | 0 (0.0%) | 0 (0.0%) |
| Health Care & Social Assistance | 6 (40.0%) | 9 (60.0%) |
| Arts, Entertainment & Recreation | 2 (100.0%) | 0 (0.0%) |
| Accommodation & Food Services | 0 (0.0%) | 0 (0.0%) |
| Public Administration | 1 (25.0%) | 3 (75.0%) |
| Total | 28 (49.1%) | 29 (50.9%) |
Education in Tunnel City
School Enrollment in Tunnel City
The most common levels of schooling among the 13 students in Tunnel City are elementary school (10 | 76.9%), high school (2 | 15.4%), and nursery / preschool (1 | 7.7%).
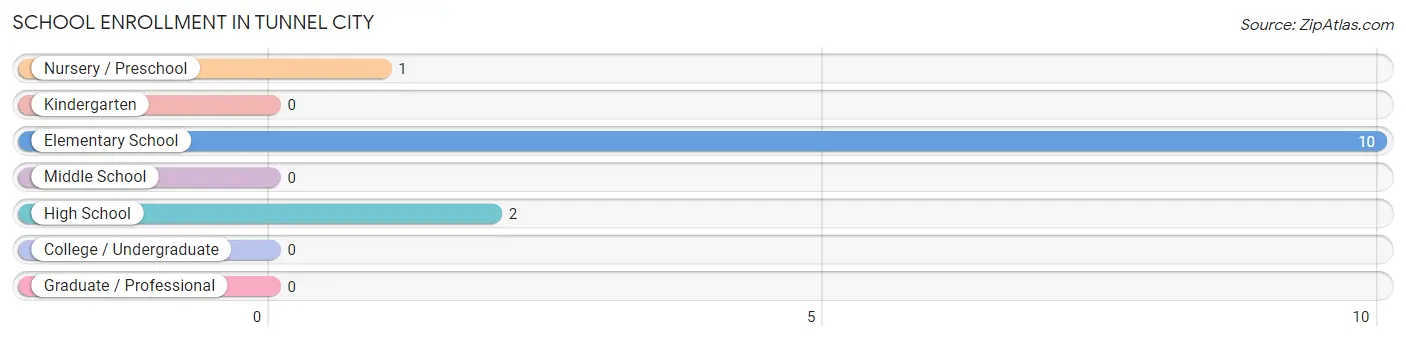
| School Level | # Students | % Students |
| Nursery / Preschool | 1 | 7.7% |
| Kindergarten | 0 | 0.0% |
| Elementary School | 10 | 76.9% |
| Middle School | 0 | 0.0% |
| High School | 2 | 15.4% |
| College / Undergraduate | 0 | 0.0% |
| Graduate / Professional | 0 | 0.0% |
| Total | 13 | 100.0% |
School Enrollment by Age by Funding Source in Tunnel City
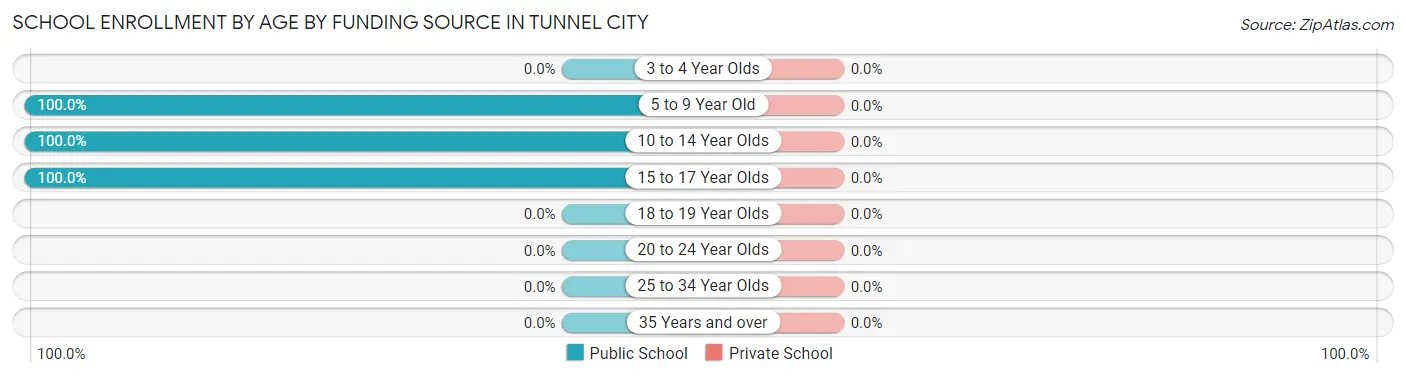
| Age Bracket | Public School | Private School |
| 3 to 4 Year Olds | 0 (0.0%) | 0 (0.0%) |
| 5 to 9 Year Old | 9 (100.0%) | 0 (0.0%) |
| 10 to 14 Year Olds | 2 (100.0%) | 0 (0.0%) |
| 15 to 17 Year Olds | 2 (100.0%) | 0 (0.0%) |
| 18 to 19 Year Olds | 0 (0.0%) | 0 (0.0%) |
| 20 to 24 Year Olds | 0 (0.0%) | 0 (0.0%) |
| 25 to 34 Year Olds | 0 (0.0%) | 0 (0.0%) |
| 35 Years and over | 0 (0.0%) | 0 (0.0%) |
| Total | 13 (100.0%) | 0 (0.0%) |
Educational Attainment by Field of Study in Tunnel City
, and business (3 | 100.0%) are the most common fields of study among 3 individuals in Tunnel City who have obtained a bachelor's degree or higher.
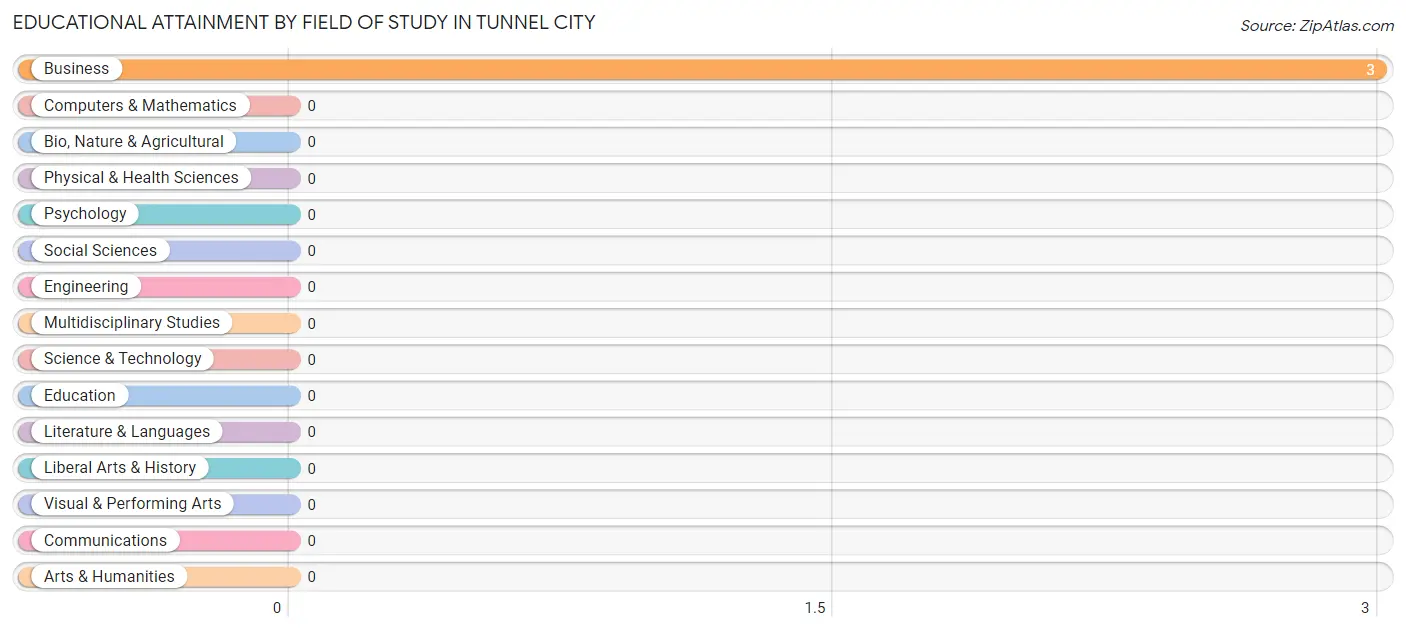
| Field of Study | # Graduates | % Graduates |
| Computers & Mathematics | 0 | 0.0% |
| Bio, Nature & Agricultural | 0 | 0.0% |
| Physical & Health Sciences | 0 | 0.0% |
| Psychology | 0 | 0.0% |
| Social Sciences | 0 | 0.0% |
| Engineering | 0 | 0.0% |
| Multidisciplinary Studies | 0 | 0.0% |
| Science & Technology | 0 | 0.0% |
| Business | 3 | 100.0% |
| Education | 0 | 0.0% |
| Literature & Languages | 0 | 0.0% |
| Liberal Arts & History | 0 | 0.0% |
| Visual & Performing Arts | 0 | 0.0% |
| Communications | 0 | 0.0% |
| Arts & Humanities | 0 | 0.0% |
| Total | 3 | 100.0% |
Transportation & Commute in Tunnel City
Vehicle Availability by Sex in Tunnel City
The most prevalent vehicle ownership categories in Tunnel City are males with 2 vehicles (11, accounting for 39.3%) and females with 2 vehicles (14, making up 37.9%).
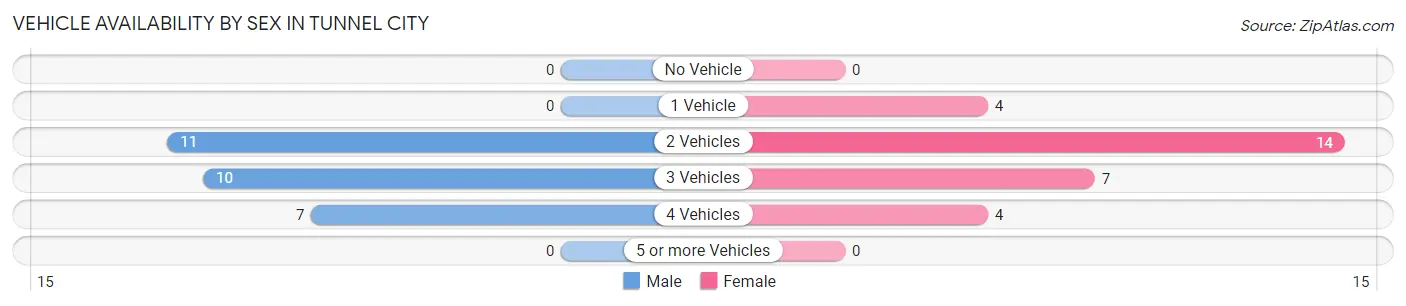
| Vehicles Available | Male | Female |
| No Vehicle | 0 (0.0%) | 0 (0.0%) |
| 1 Vehicle | 0 (0.0%) | 4 (13.8%) |
| 2 Vehicles | 11 (39.3%) | 14 (48.3%) |
| 3 Vehicles | 10 (35.7%) | 7 (24.1%) |
| 4 Vehicles | 7 (25.0%) | 4 (13.8%) |
| 5 or more Vehicles | 0 (0.0%) | 0 (0.0%) |
| Total | 28 (100.0%) | 29 (100.0%) |
Commute Time in Tunnel City
The most frequently occuring commute durations in Tunnel City are 15 to 19 minutes (16 commuters, 28.1%), 5 to 9 minutes (12 commuters, 21.0%), and 10 to 14 minutes (10 commuters, 17.5%).
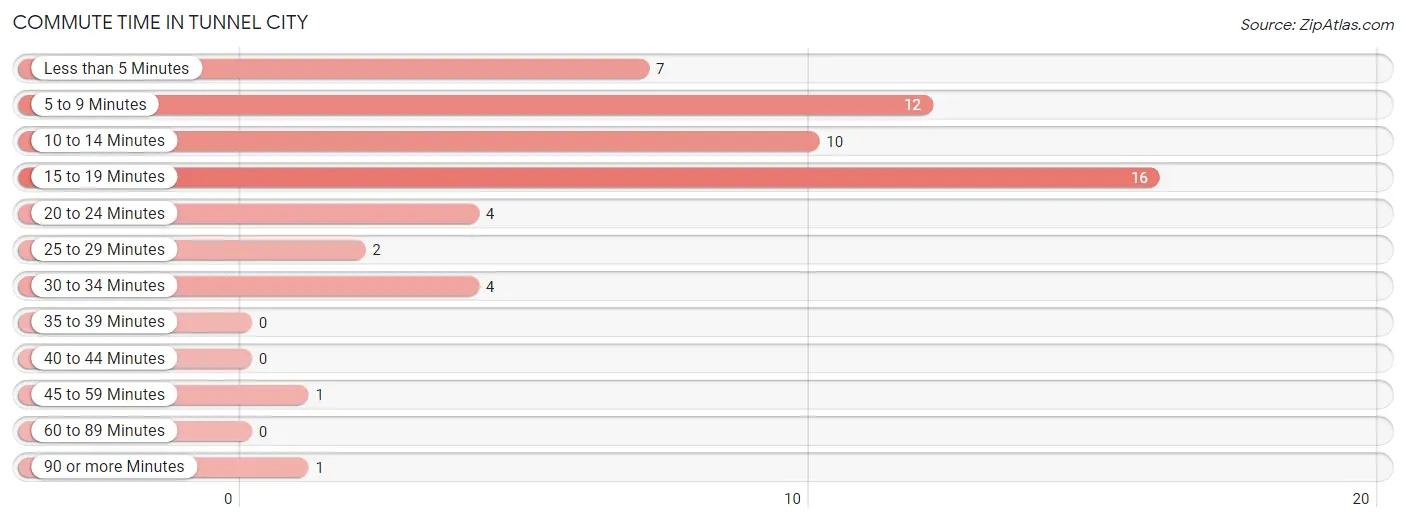
| Commute Time | # Commuters | % Commuters |
| Less than 5 Minutes | 7 | 12.3% |
| 5 to 9 Minutes | 12 | 21.0% |
| 10 to 14 Minutes | 10 | 17.5% |
| 15 to 19 Minutes | 16 | 28.1% |
| 20 to 24 Minutes | 4 | 7.0% |
| 25 to 29 Minutes | 2 | 3.5% |
| 30 to 34 Minutes | 4 | 7.0% |
| 35 to 39 Minutes | 0 | 0.0% |
| 40 to 44 Minutes | 0 | 0.0% |
| 45 to 59 Minutes | 1 | 1.8% |
| 60 to 89 Minutes | 0 | 0.0% |
| 90 or more Minutes | 1 | 1.8% |
Commute Time by Sex in Tunnel City
The most common commute times in Tunnel City are 15 to 19 minutes (13 commuters, 46.4%) for males and 5 to 9 minutes (12 commuters, 41.4%) for females.
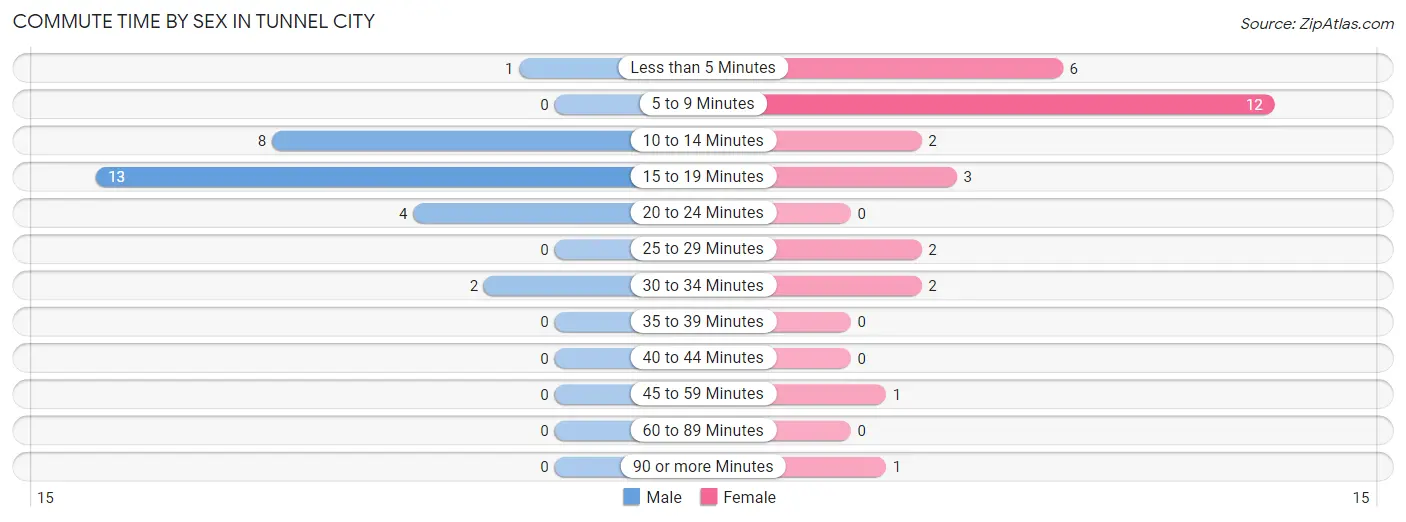
| Commute Time | Male | Female |
| Less than 5 Minutes | 1 (3.6%) | 6 (20.7%) |
| 5 to 9 Minutes | 0 (0.0%) | 12 (41.4%) |
| 10 to 14 Minutes | 8 (28.6%) | 2 (6.9%) |
| 15 to 19 Minutes | 13 (46.4%) | 3 (10.3%) |
| 20 to 24 Minutes | 4 (14.3%) | 0 (0.0%) |
| 25 to 29 Minutes | 0 (0.0%) | 2 (6.9%) |
| 30 to 34 Minutes | 2 (7.1%) | 2 (6.9%) |
| 35 to 39 Minutes | 0 (0.0%) | 0 (0.0%) |
| 40 to 44 Minutes | 0 (0.0%) | 0 (0.0%) |
| 45 to 59 Minutes | 0 (0.0%) | 1 (3.5%) |
| 60 to 89 Minutes | 0 (0.0%) | 0 (0.0%) |
| 90 or more Minutes | 0 (0.0%) | 1 (3.5%) |
Time of Departure to Work by Sex in Tunnel City
The most frequent times of departure to work in Tunnel City are 12:00 AM to 4:59 AM (11, 39.3%) for males and 7:30 AM to 7:59 AM (8, 27.6%) for females.
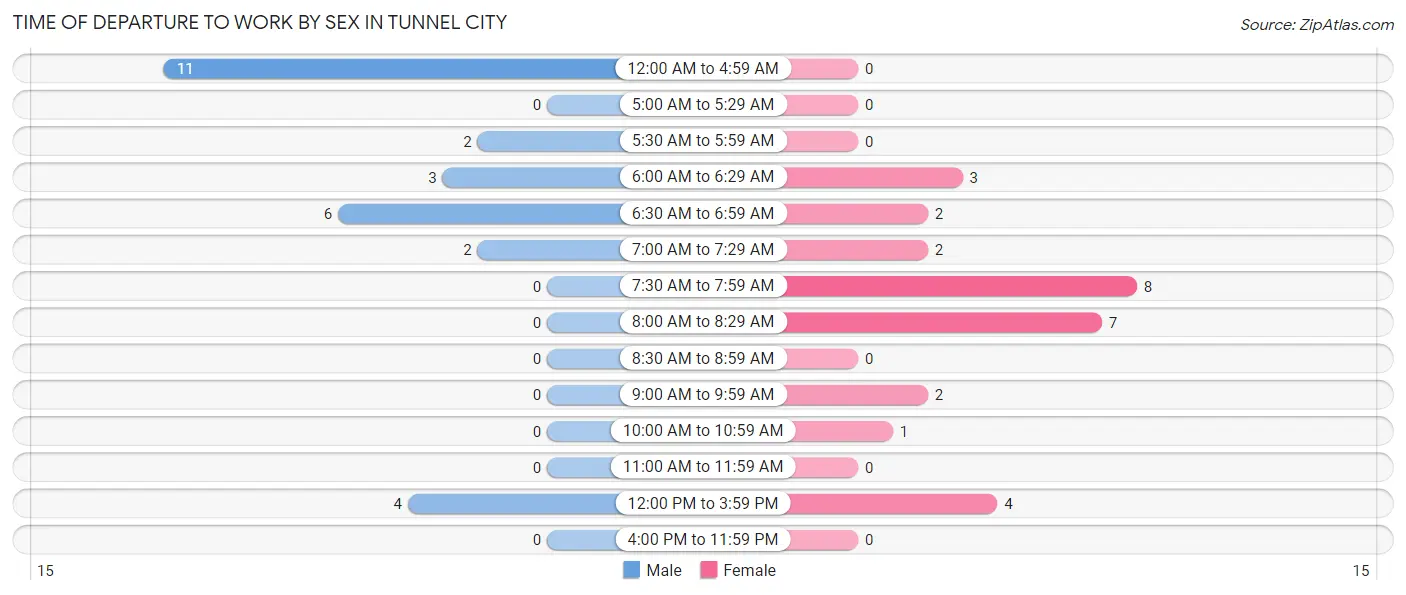
| Time of Departure | Male | Female |
| 12:00 AM to 4:59 AM | 11 (39.3%) | 0 (0.0%) |
| 5:00 AM to 5:29 AM | 0 (0.0%) | 0 (0.0%) |
| 5:30 AM to 5:59 AM | 2 (7.1%) | 0 (0.0%) |
| 6:00 AM to 6:29 AM | 3 (10.7%) | 3 (10.3%) |
| 6:30 AM to 6:59 AM | 6 (21.4%) | 2 (6.9%) |
| 7:00 AM to 7:29 AM | 2 (7.1%) | 2 (6.9%) |
| 7:30 AM to 7:59 AM | 0 (0.0%) | 8 (27.6%) |
| 8:00 AM to 8:29 AM | 0 (0.0%) | 7 (24.1%) |
| 8:30 AM to 8:59 AM | 0 (0.0%) | 0 (0.0%) |
| 9:00 AM to 9:59 AM | 0 (0.0%) | 2 (6.9%) |
| 10:00 AM to 10:59 AM | 0 (0.0%) | 1 (3.5%) |
| 11:00 AM to 11:59 AM | 0 (0.0%) | 0 (0.0%) |
| 12:00 PM to 3:59 PM | 4 (14.3%) | 4 (13.8%) |
| 4:00 PM to 11:59 PM | 0 (0.0%) | 0 (0.0%) |
| Total | 28 (100.0%) | 29 (100.0%) |
Housing Occupancy in Tunnel City
Occupancy by Ownership in Tunnel City
Of the total 71 dwellings in Tunnel City, owner-occupied units account for 61 (85.9%), while renter-occupied units make up 10 (14.1%).
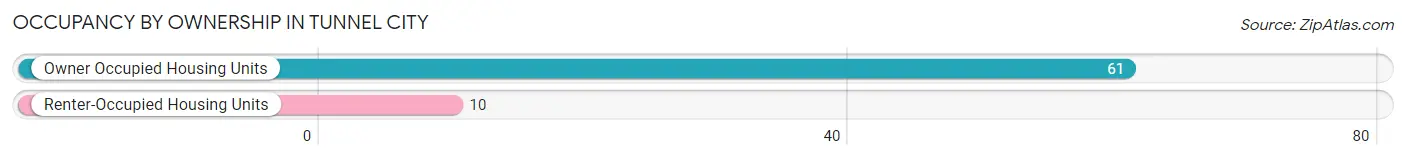
| Occupancy | # Housing Units | % Housing Units |
| Owner Occupied Housing Units | 61 | 85.9% |
| Renter-Occupied Housing Units | 10 | 14.1% |
| Total Occupied Housing Units | 71 | 100.0% |
Occupancy by Household Size in Tunnel City
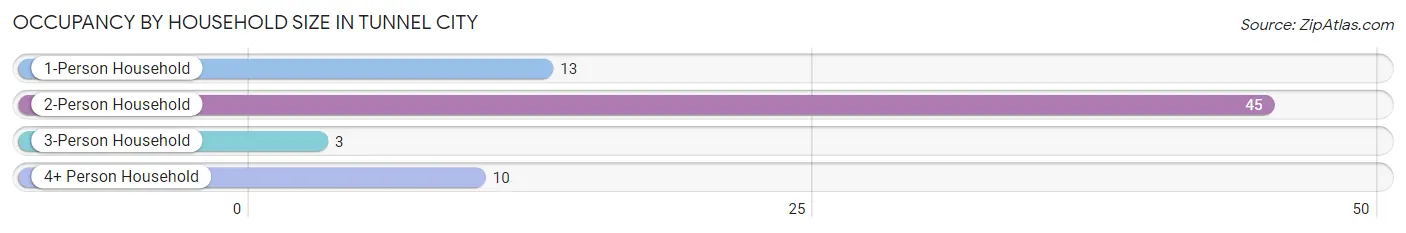
| Household Size | # Housing Units | % Housing Units |
| 1-Person Household | 13 | 18.3% |
| 2-Person Household | 45 | 63.4% |
| 3-Person Household | 3 | 4.2% |
| 4+ Person Household | 10 | 14.1% |
| Total Housing Units | 71 | 100.0% |
Occupancy by Ownership by Household Size in Tunnel City
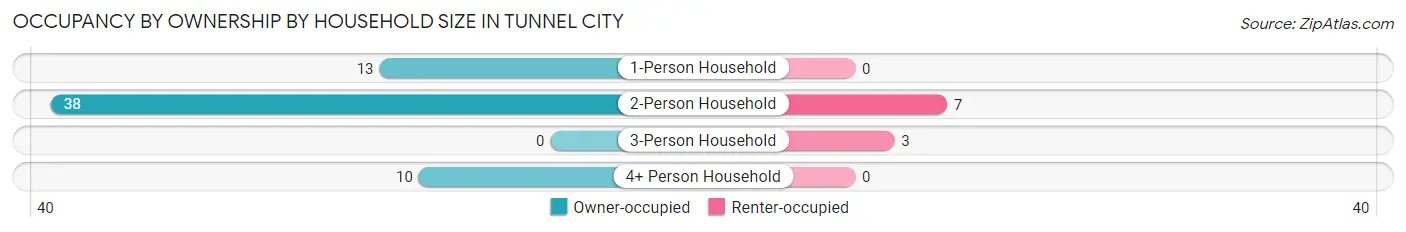
| Household Size | Owner-occupied | Renter-occupied |
| 1-Person Household | 13 (100.0%) | 0 (0.0%) |
| 2-Person Household | 38 (84.4%) | 7 (15.6%) |
| 3-Person Household | 0 (0.0%) | 3 (100.0%) |
| 4+ Person Household | 10 (100.0%) | 0 (0.0%) |
| Total Housing Units | 61 (85.9%) | 10 (14.1%) |
Occupancy by Educational Attainment in Tunnel City
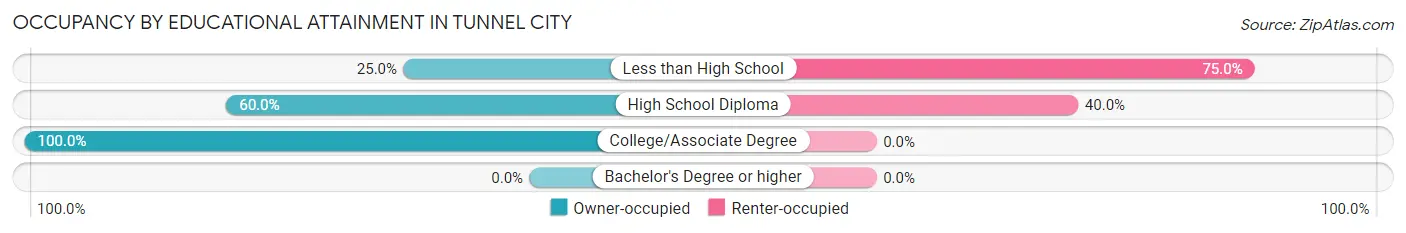
| Household Size | Owner-occupied | Renter-occupied |
| Less than High School | 2 (25.0%) | 6 (75.0%) |
| High School Diploma | 6 (60.0%) | 4 (40.0%) |
| College/Associate Degree | 53 (100.0%) | 0 (0.0%) |
| Bachelor's Degree or higher | 0 (0.0%) | 0 (0.0%) |
Occupancy by Age of Householder in Tunnel City
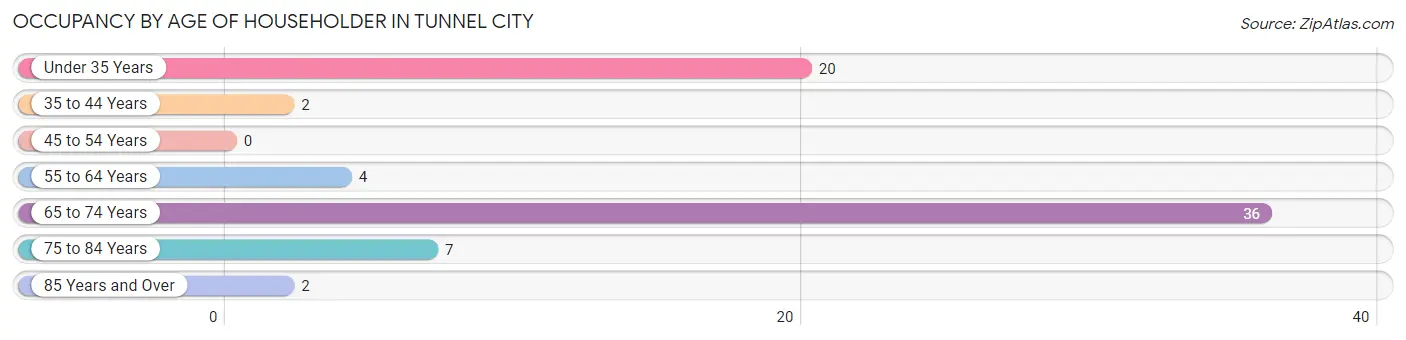
| Age Bracket | # Households | % Households |
| Under 35 Years | 20 | 28.2% |
| 35 to 44 Years | 2 | 2.8% |
| 45 to 54 Years | 0 | 0.0% |
| 55 to 64 Years | 4 | 5.6% |
| 65 to 74 Years | 36 | 50.7% |
| 75 to 84 Years | 7 | 9.9% |
| 85 Years and Over | 2 | 2.8% |
| Total | 71 | 100.0% |
Housing Finances in Tunnel City
Median Income by Occupancy in Tunnel City
| Occupancy Type | # Households | Median Income |
| Owner-Occupied | 61 (85.9%) | $0 |
| Renter-Occupied | 10 (14.1%) | $0 |
| Average | 71 (100.0%) | $0 |
Occupancy by Householder Income Bracket in Tunnel City
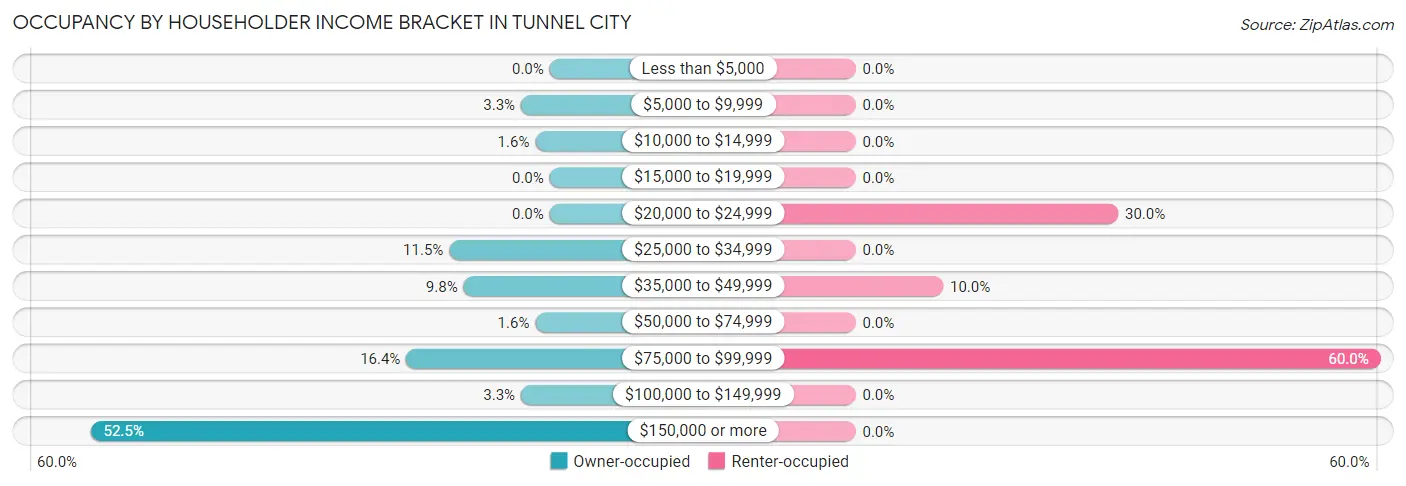
| Income Bracket | Owner-occupied | Renter-occupied |
| Less than $5,000 | 0 (0.0%) | 0 (0.0%) |
| $5,000 to $9,999 | 2 (3.3%) | 0 (0.0%) |
| $10,000 to $14,999 | 1 (1.6%) | 0 (0.0%) |
| $15,000 to $19,999 | 0 (0.0%) | 0 (0.0%) |
| $20,000 to $24,999 | 0 (0.0%) | 3 (30.0%) |
| $25,000 to $34,999 | 7 (11.5%) | 0 (0.0%) |
| $35,000 to $49,999 | 6 (9.8%) | 1 (10.0%) |
| $50,000 to $74,999 | 1 (1.6%) | 0 (0.0%) |
| $75,000 to $99,999 | 10 (16.4%) | 6 (60.0%) |
| $100,000 to $149,999 | 2 (3.3%) | 0 (0.0%) |
| $150,000 or more | 32 (52.5%) | 0 (0.0%) |
| Total | 61 (100.0%) | 10 (100.0%) |
Monthly Housing Cost Tiers in Tunnel City
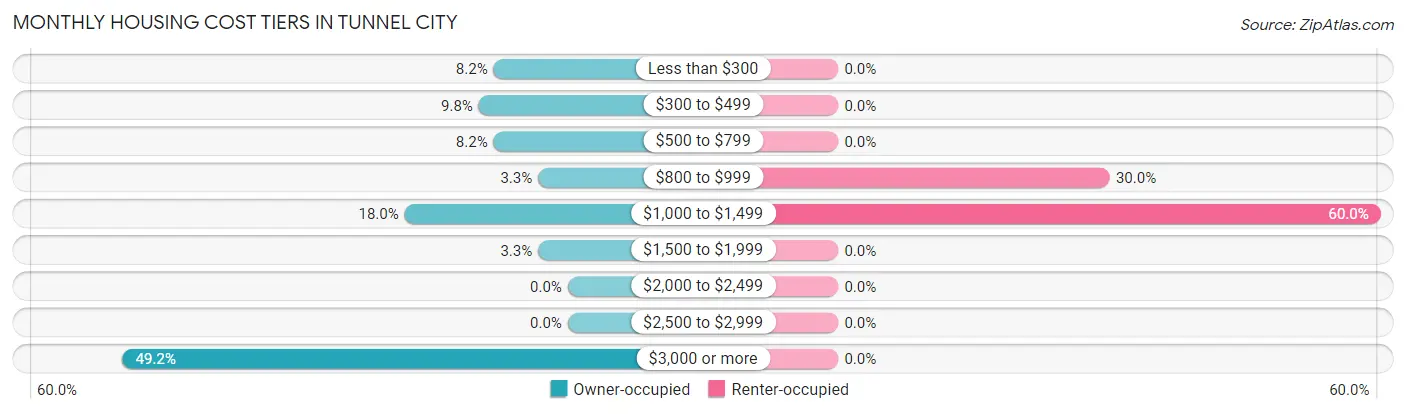
| Monthly Cost | Owner-occupied | Renter-occupied |
| Less than $300 | 5 (8.2%) | 0 (0.0%) |
| $300 to $499 | 6 (9.8%) | 0 (0.0%) |
| $500 to $799 | 5 (8.2%) | 0 (0.0%) |
| $800 to $999 | 2 (3.3%) | 3 (30.0%) |
| $1,000 to $1,499 | 11 (18.0%) | 6 (60.0%) |
| $1,500 to $1,999 | 2 (3.3%) | 0 (0.0%) |
| $2,000 to $2,499 | 0 (0.0%) | 0 (0.0%) |
| $2,500 to $2,999 | 0 (0.0%) | 0 (0.0%) |
| $3,000 or more | 30 (49.2%) | 0 (0.0%) |
| Total | 61 (100.0%) | 10 (100.0%) |
Physical Housing Characteristics in Tunnel City
Housing Structures in Tunnel City
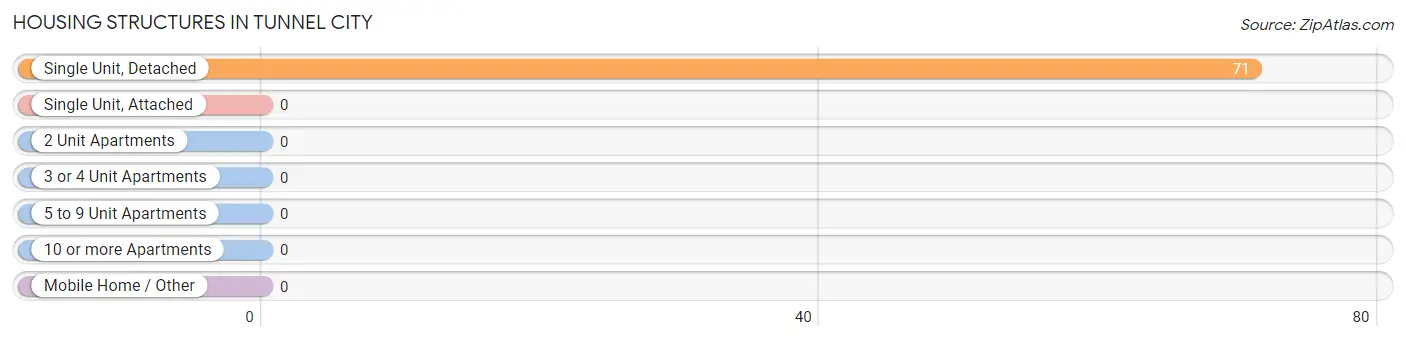
| Structure Type | # Housing Units | % Housing Units |
| Single Unit, Detached | 71 | 100.0% |
| Single Unit, Attached | 0 | 0.0% |
| 2 Unit Apartments | 0 | 0.0% |
| 3 or 4 Unit Apartments | 0 | 0.0% |
| 5 to 9 Unit Apartments | 0 | 0.0% |
| 10 or more Apartments | 0 | 0.0% |
| Mobile Home / Other | 0 | 0.0% |
| Total | 71 | 100.0% |
Housing Structures by Occupancy in Tunnel City
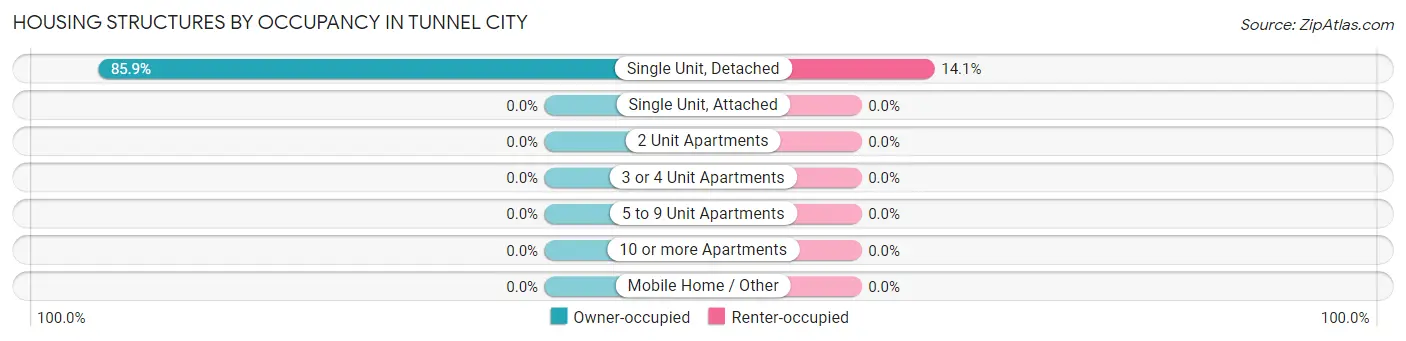
| Structure Type | Owner-occupied | Renter-occupied |
| Single Unit, Detached | 61 (85.9%) | 10 (14.1%) |
| Single Unit, Attached | 0 (0.0%) | 0 (0.0%) |
| 2 Unit Apartments | 0 (0.0%) | 0 (0.0%) |
| 3 or 4 Unit Apartments | 0 (0.0%) | 0 (0.0%) |
| 5 to 9 Unit Apartments | 0 (0.0%) | 0 (0.0%) |
| 10 or more Apartments | 0 (0.0%) | 0 (0.0%) |
| Mobile Home / Other | 0 (0.0%) | 0 (0.0%) |
| Total | 61 (85.9%) | 10 (14.1%) |
Housing Structures by Number of Rooms in Tunnel City
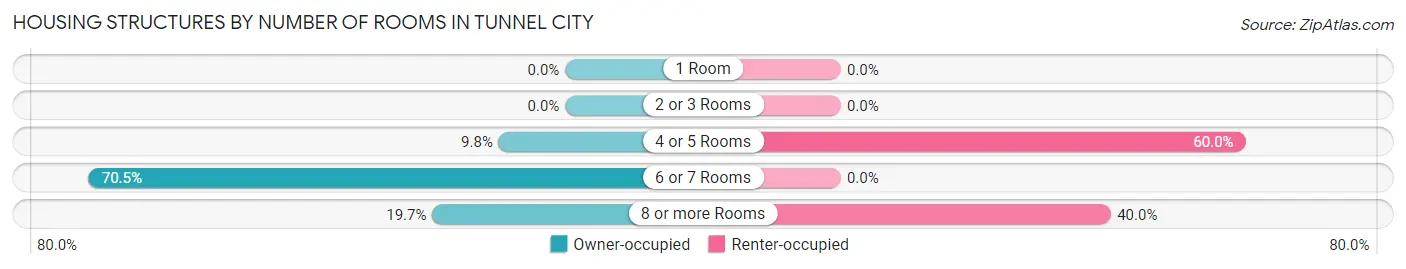
| Number of Rooms | Owner-occupied | Renter-occupied |
| 1 Room | 0 (0.0%) | 0 (0.0%) |
| 2 or 3 Rooms | 0 (0.0%) | 0 (0.0%) |
| 4 or 5 Rooms | 6 (9.8%) | 6 (60.0%) |
| 6 or 7 Rooms | 43 (70.5%) | 0 (0.0%) |
| 8 or more Rooms | 12 (19.7%) | 4 (40.0%) |
| Total | 61 (100.0%) | 10 (100.0%) |
Housing Structure by Heating Type in Tunnel City
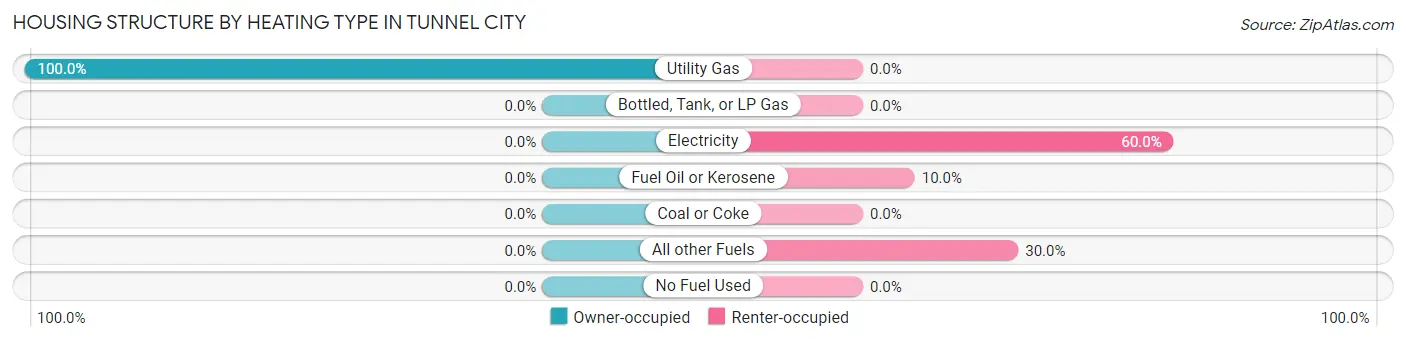
| Heating Type | Owner-occupied | Renter-occupied |
| Utility Gas | 61 (100.0%) | 0 (0.0%) |
| Bottled, Tank, or LP Gas | 0 (0.0%) | 0 (0.0%) |
| Electricity | 0 (0.0%) | 6 (60.0%) |
| Fuel Oil or Kerosene | 0 (0.0%) | 1 (10.0%) |
| Coal or Coke | 0 (0.0%) | 0 (0.0%) |
| All other Fuels | 0 (0.0%) | 3 (30.0%) |
| No Fuel Used | 0 (0.0%) | 0 (0.0%) |
| Total | 61 (100.0%) | 10 (100.0%) |
Household Vehicle Usage in Tunnel City
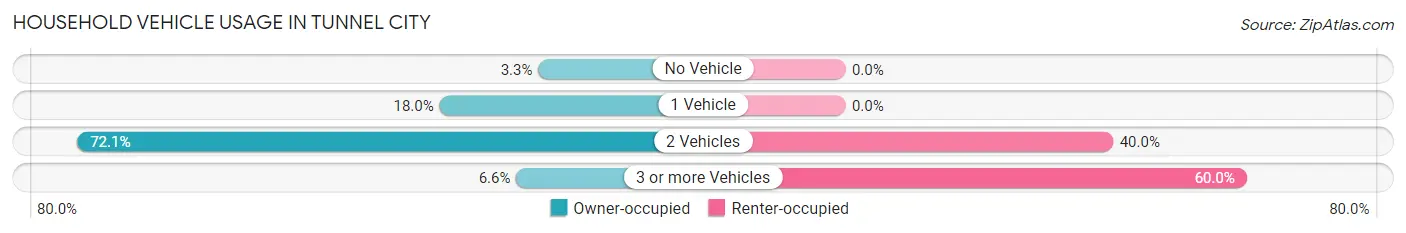
| Vehicles per Household | Owner-occupied | Renter-occupied |
| No Vehicle | 2 (3.3%) | 0 (0.0%) |
| 1 Vehicle | 11 (18.0%) | 0 (0.0%) |
| 2 Vehicles | 44 (72.1%) | 4 (40.0%) |
| 3 or more Vehicles | 4 (6.6%) | 6 (60.0%) |
| Total | 61 (100.0%) | 10 (100.0%) |
Real Estate & Mortgages in Tunnel City
Real Estate and Mortgage Overview in Tunnel City
| Characteristic | Without Mortgage | With Mortgage |
| Housing Units | 12 | 49 |
| Median Property Value | $118,800 | $182,900 |
| Median Household Income | $46,250 | $30 |
| Monthly Housing Costs | $417 | $30 |
| Real Estate Taxes | $1,500 | $0 |
Property Value by Mortgage Status in Tunnel City
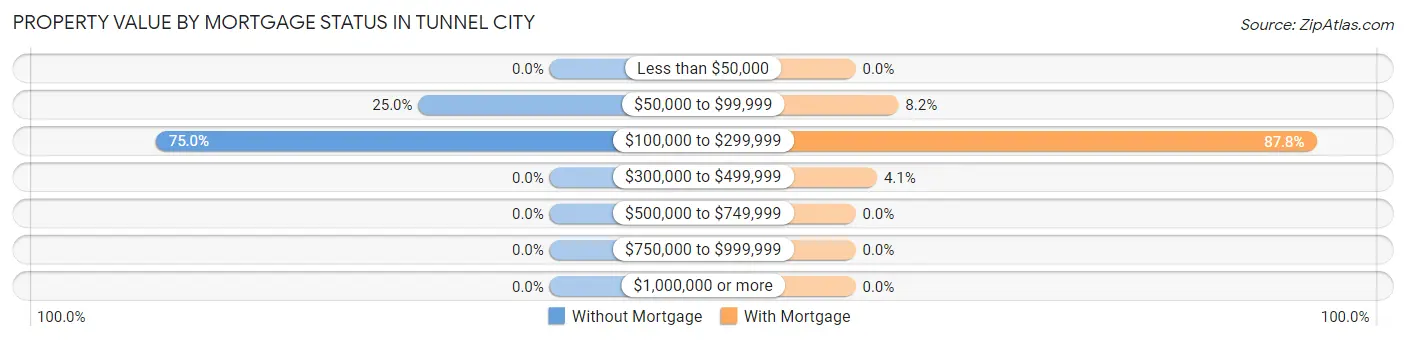
| Property Value | Without Mortgage | With Mortgage |
| Less than $50,000 | 0 (0.0%) | 0 (0.0%) |
| $50,000 to $99,999 | 3 (25.0%) | 4 (8.2%) |
| $100,000 to $299,999 | 9 (75.0%) | 43 (87.8%) |
| $300,000 to $499,999 | 0 (0.0%) | 2 (4.1%) |
| $500,000 to $749,999 | 0 (0.0%) | 0 (0.0%) |
| $750,000 to $999,999 | 0 (0.0%) | 0 (0.0%) |
| $1,000,000 or more | 0 (0.0%) | 0 (0.0%) |
| Total | 12 (100.0%) | 49 (100.0%) |
Household Income by Mortgage Status in Tunnel City
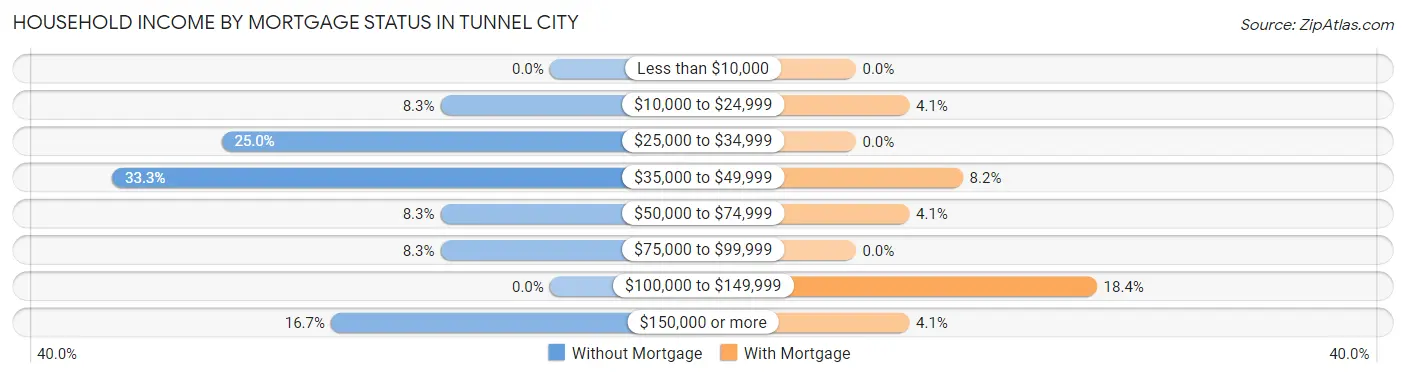
| Household Income | Without Mortgage | With Mortgage |
| Less than $10,000 | 0 (0.0%) | 0 (0.0%) |
| $10,000 to $24,999 | 1 (8.3%) | 2 (4.1%) |
| $25,000 to $34,999 | 3 (25.0%) | 0 (0.0%) |
| $35,000 to $49,999 | 4 (33.3%) | 4 (8.2%) |
| $50,000 to $74,999 | 1 (8.3%) | 2 (4.1%) |
| $75,000 to $99,999 | 1 (8.3%) | 0 (0.0%) |
| $100,000 to $149,999 | 0 (0.0%) | 9 (18.4%) |
| $150,000 or more | 2 (16.7%) | 2 (4.1%) |
| Total | 12 (100.0%) | 49 (100.0%) |
Property Value to Household Income Ratio in Tunnel City
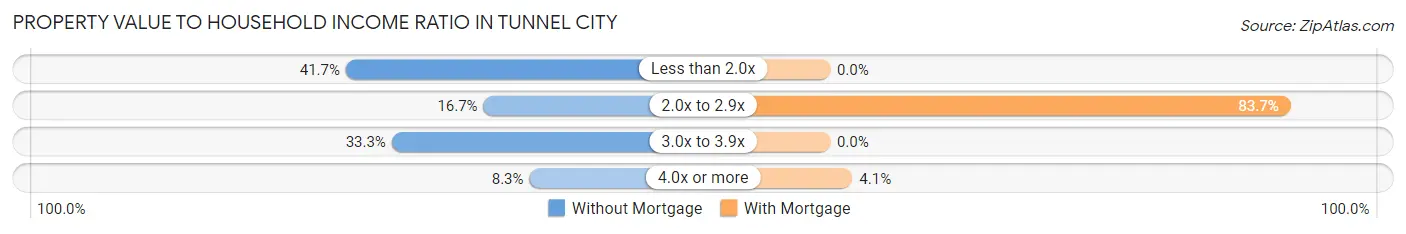
| Value-to-Income Ratio | Without Mortgage | With Mortgage |
| Less than 2.0x | 5 (41.7%) | 0 (0.0%) |
| 2.0x to 2.9x | 2 (16.7%) | 41 (83.7%) |
| 3.0x to 3.9x | 4 (33.3%) | 0 (0.0%) |
| 4.0x or more | 1 (8.3%) | 2 (4.1%) |
| Total | 12 (100.0%) | 49 (100.0%) |
Real Estate Taxes by Mortgage Status in Tunnel City
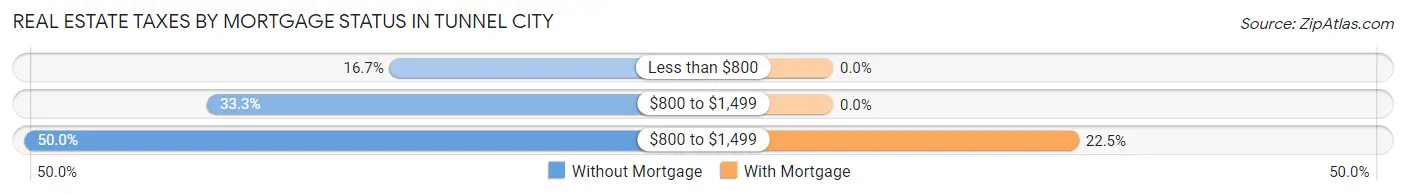
| Property Taxes | Without Mortgage | With Mortgage |
| Less than $800 | 2 (16.7%) | 0 (0.0%) |
| $800 to $1,499 | 4 (33.3%) | 0 (0.0%) |
| $800 to $1,499 | 6 (50.0%) | 11 (22.5%) |
| Total | 12 (100.0%) | 49 (100.0%) |
Health & Disability in Tunnel City
Health Insurance Coverage by Age in Tunnel City
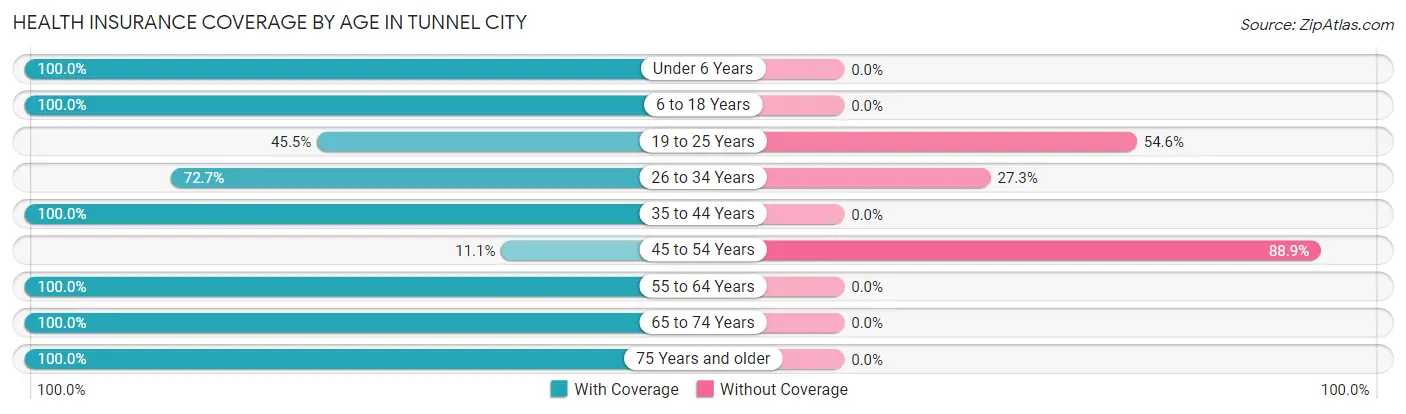
| Age Bracket | With Coverage | Without Coverage |
| Under 6 Years | 10 (100.0%) | 0 (0.0%) |
| 6 to 18 Years | 12 (100.0%) | 0 (0.0%) |
| 19 to 25 Years | 5 (45.5%) | 6 (54.5%) |
| 26 to 34 Years | 16 (72.7%) | 6 (27.3%) |
| 35 to 44 Years | 6 (100.0%) | 0 (0.0%) |
| 45 to 54 Years | 1 (11.1%) | 8 (88.9%) |
| 55 to 64 Years | 7 (100.0%) | 0 (0.0%) |
| 65 to 74 Years | 37 (100.0%) | 0 (0.0%) |
| 75 Years and older | 14 (100.0%) | 0 (0.0%) |
| Total | 108 (84.4%) | 20 (15.6%) |
Health Insurance Coverage by Citizenship Status in Tunnel City
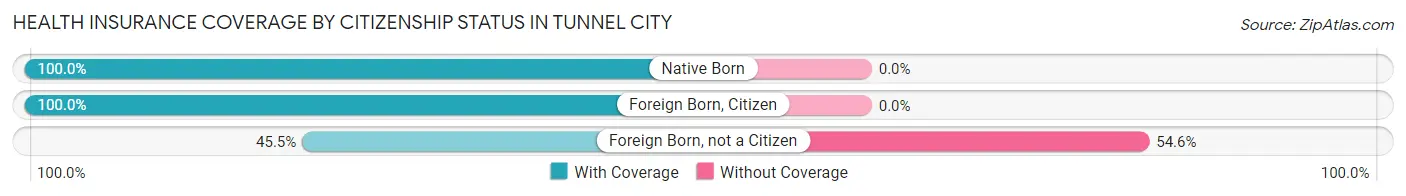
| Citizenship Status | With Coverage | Without Coverage |
| Native Born | 10 (100.0%) | 0 (0.0%) |
| Foreign Born, Citizen | 12 (100.0%) | 0 (0.0%) |
| Foreign Born, not a Citizen | 5 (45.5%) | 6 (54.5%) |
Health Insurance Coverage by Household Income in Tunnel City
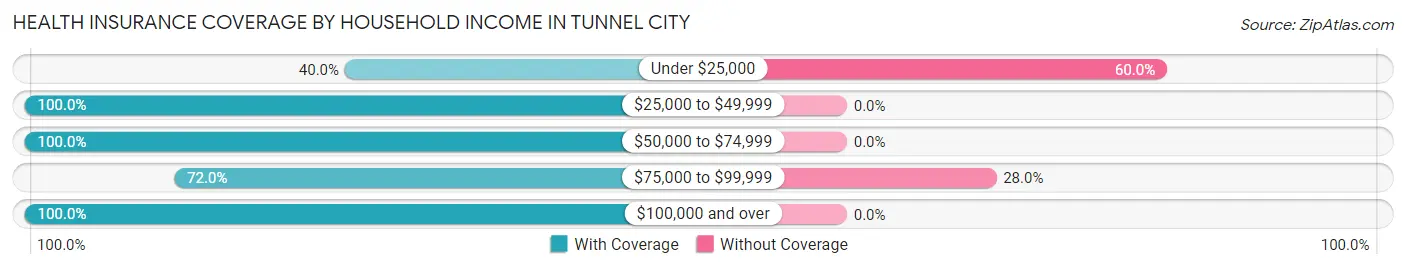
| Household Income | With Coverage | Without Coverage |
| Under $25,000 | 4 (40.0%) | 6 (60.0%) |
| $25,000 to $49,999 | 18 (100.0%) | 0 (0.0%) |
| $50,000 to $74,999 | 2 (100.0%) | 0 (0.0%) |
| $75,000 to $99,999 | 36 (72.0%) | 14 (28.0%) |
| $100,000 and over | 48 (100.0%) | 0 (0.0%) |
Public vs Private Health Insurance Coverage by Age in Tunnel City
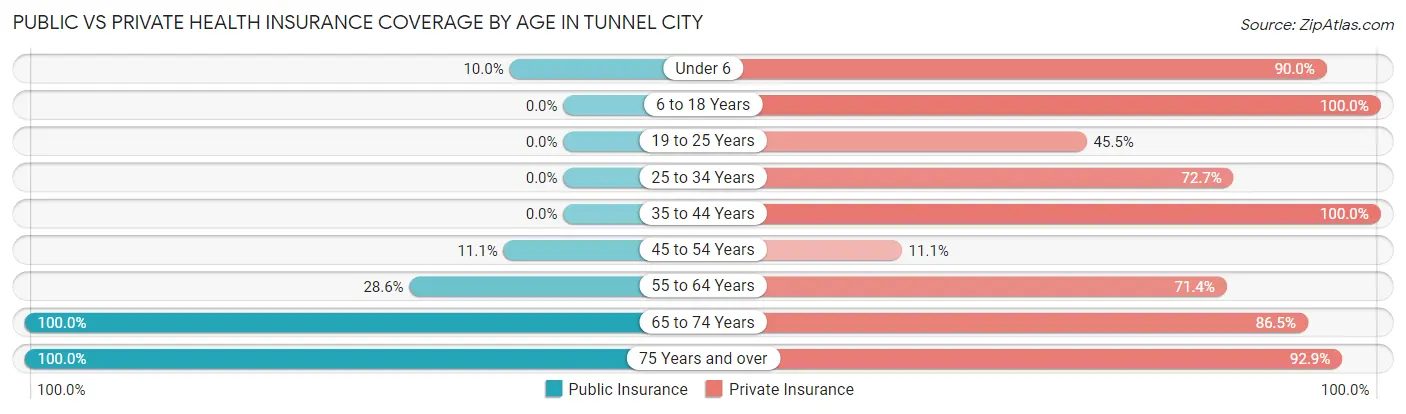
| Age Bracket | Public Insurance | Private Insurance |
| Under 6 | 1 (10.0%) | 9 (90.0%) |
| 6 to 18 Years | 0 (0.0%) | 12 (100.0%) |
| 19 to 25 Years | 0 (0.0%) | 5 (45.5%) |
| 25 to 34 Years | 0 (0.0%) | 16 (72.7%) |
| 35 to 44 Years | 0 (0.0%) | 6 (100.0%) |
| 45 to 54 Years | 1 (11.1%) | 1 (11.1%) |
| 55 to 64 Years | 2 (28.6%) | 5 (71.4%) |
| 65 to 74 Years | 37 (100.0%) | 32 (86.5%) |
| 75 Years and over | 14 (100.0%) | 13 (92.9%) |
| Total | 55 (43.0%) | 99 (77.3%) |
Disability Status by Sex by Age in Tunnel City
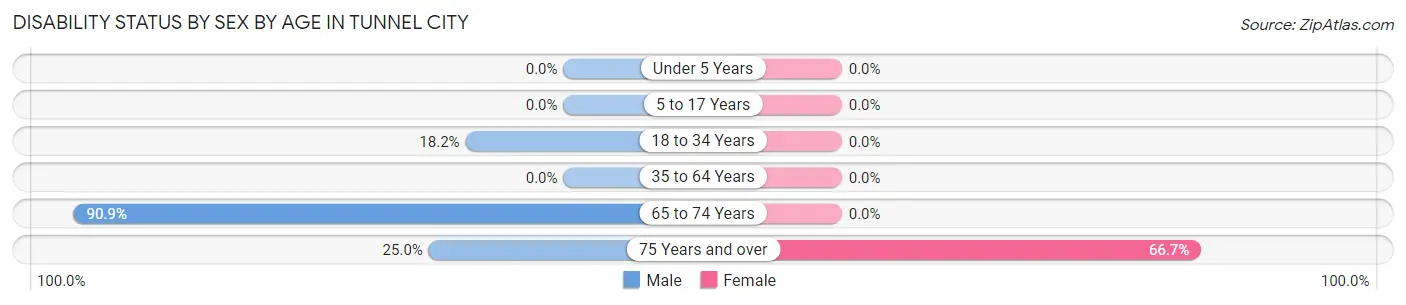
| Age Bracket | Male | Female |
| Under 5 Years | 0 (0.0%) | 0 (0.0%) |
| 5 to 17 Years | 0 (0.0%) | 0 (0.0%) |
| 18 to 34 Years | 2 (18.2%) | 0 (0.0%) |
| 35 to 64 Years | 0 (0.0%) | 0 (0.0%) |
| 65 to 74 Years | 30 (90.9%) | 0 (0.0%) |
| 75 Years and over | 2 (25.0%) | 4 (66.7%) |
Disability Class by Sex by Age in Tunnel City
Disability Class: Hearing Difficulty
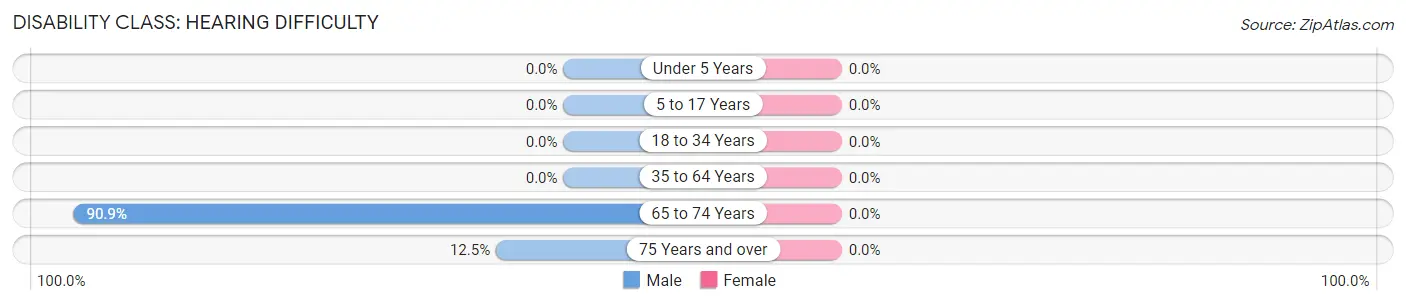
| Age Bracket | Male | Female |
| Under 5 Years | 0 (0.0%) | 0 (0.0%) |
| 5 to 17 Years | 0 (0.0%) | 0 (0.0%) |
| 18 to 34 Years | 0 (0.0%) | 0 (0.0%) |
| 35 to 64 Years | 0 (0.0%) | 0 (0.0%) |
| 65 to 74 Years | 30 (90.9%) | 0 (0.0%) |
| 75 Years and over | 1 (12.5%) | 0 (0.0%) |
Disability Class: Vision Difficulty
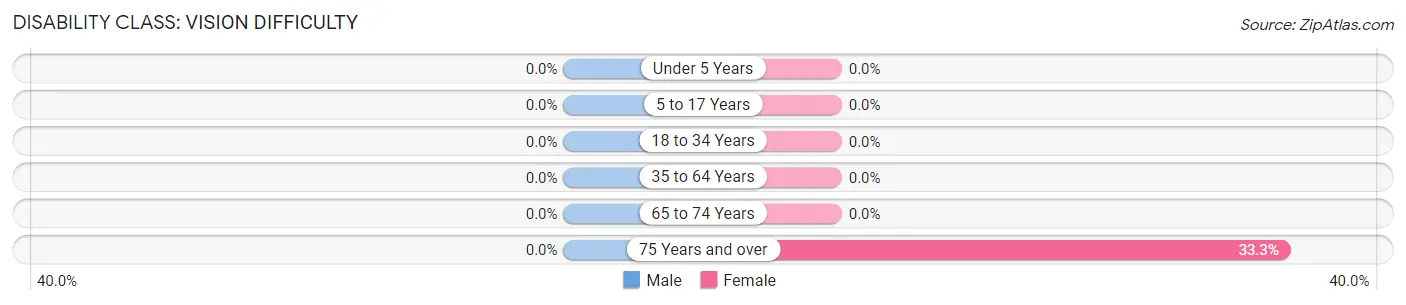
| Age Bracket | Male | Female |
| Under 5 Years | 0 (0.0%) | 0 (0.0%) |
| 5 to 17 Years | 0 (0.0%) | 0 (0.0%) |
| 18 to 34 Years | 0 (0.0%) | 0 (0.0%) |
| 35 to 64 Years | 0 (0.0%) | 0 (0.0%) |
| 65 to 74 Years | 0 (0.0%) | 0 (0.0%) |
| 75 Years and over | 0 (0.0%) | 2 (33.3%) |
Disability Class: Cognitive Difficulty
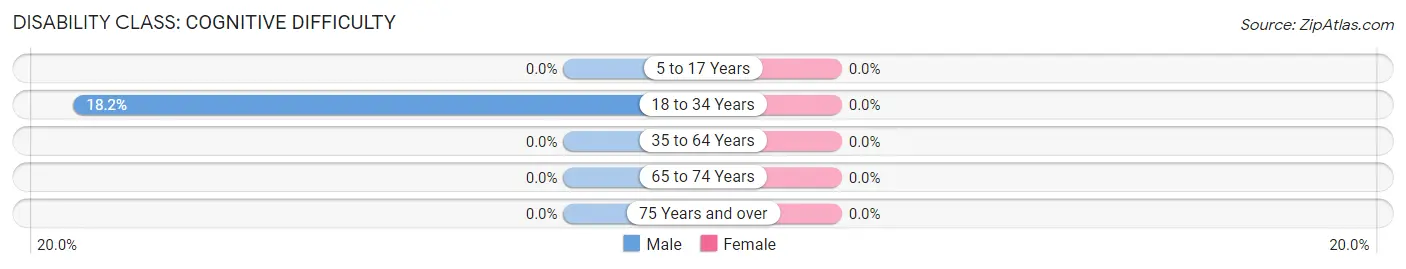
| Age Bracket | Male | Female |
| 5 to 17 Years | 0 (0.0%) | 0 (0.0%) |
| 18 to 34 Years | 2 (18.2%) | 0 (0.0%) |
| 35 to 64 Years | 0 (0.0%) | 0 (0.0%) |
| 65 to 74 Years | 0 (0.0%) | 0 (0.0%) |
| 75 Years and over | 0 (0.0%) | 0 (0.0%) |
Disability Class: Ambulatory Difficulty
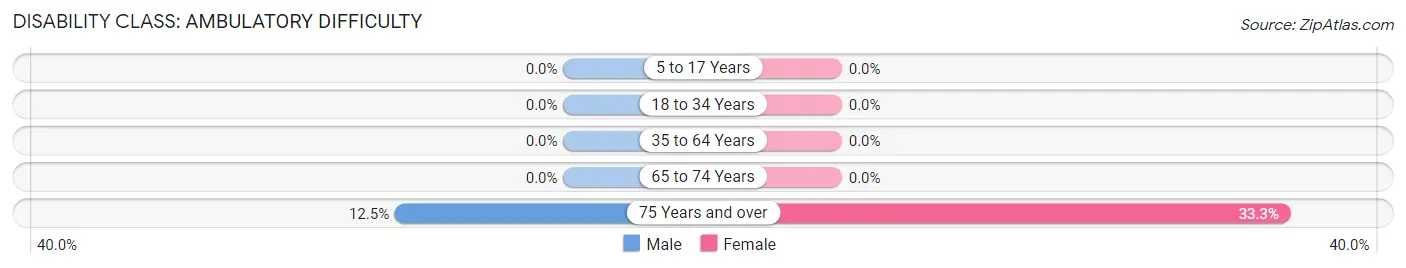
| Age Bracket | Male | Female |
| 5 to 17 Years | 0 (0.0%) | 0 (0.0%) |
| 18 to 34 Years | 0 (0.0%) | 0 (0.0%) |
| 35 to 64 Years | 0 (0.0%) | 0 (0.0%) |
| 65 to 74 Years | 0 (0.0%) | 0 (0.0%) |
| 75 Years and over | 1 (12.5%) | 2 (33.3%) |
Disability Class: Self-Care Difficulty
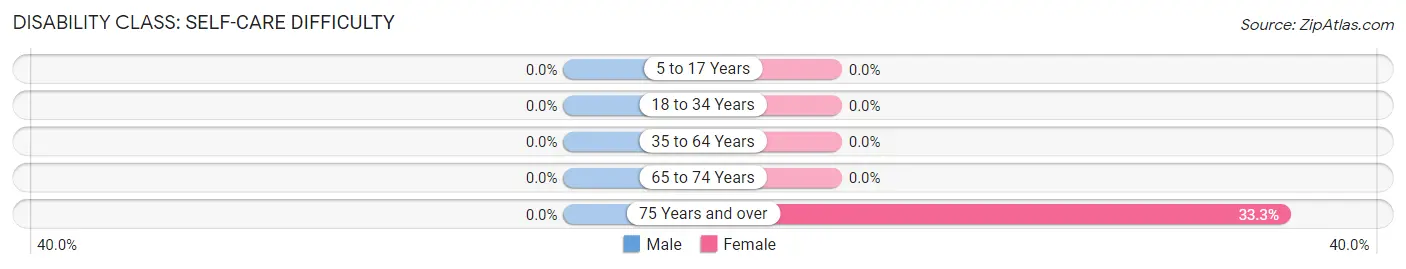
| Age Bracket | Male | Female |
| 5 to 17 Years | 0 (0.0%) | 0 (0.0%) |
| 18 to 34 Years | 0 (0.0%) | 0 (0.0%) |
| 35 to 64 Years | 0 (0.0%) | 0 (0.0%) |
| 65 to 74 Years | 0 (0.0%) | 0 (0.0%) |
| 75 Years and over | 0 (0.0%) | 2 (33.3%) |
Technology Access in Tunnel City
Computing Device Access in Tunnel City
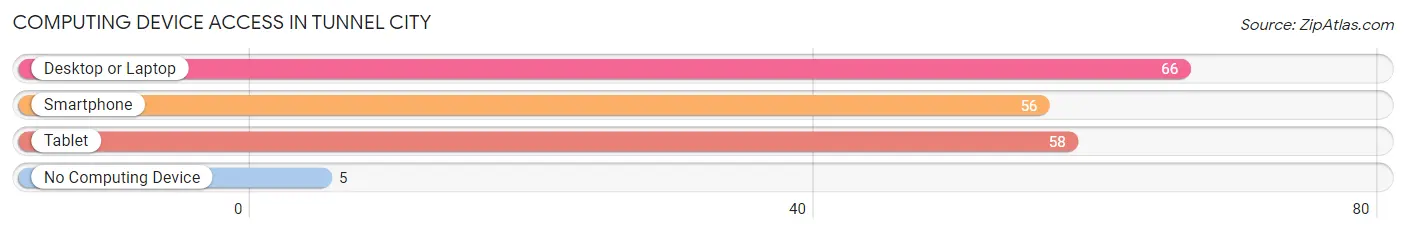
| Device Type | # Households | % Households |
| Desktop or Laptop | 66 | 93.0% |
| Smartphone | 56 | 78.9% |
| Tablet | 58 | 81.7% |
| No Computing Device | 5 | 7.0% |
| Total | 71 | 100.0% |
Internet Access in Tunnel City
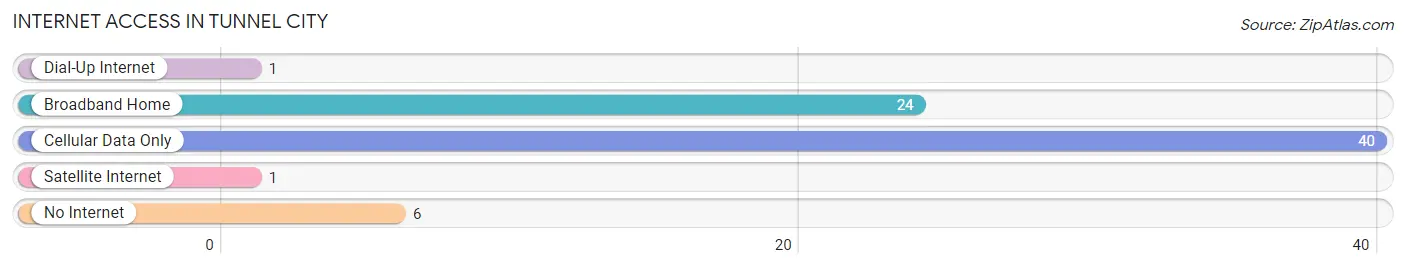
| Internet Type | # Households | % Households |
| Dial-Up Internet | 1 | 1.4% |
| Broadband Home | 24 | 33.8% |
| Cellular Data Only | 40 | 56.3% |
| Satellite Internet | 1 | 1.4% |
| No Internet | 6 | 8.5% |
| Total | 71 | 100.0% |
Tunnel City Summary
Tunnel City is a small unincorporated community located in Monroe County, Wisconsin, United States. It is situated in the town of Wellington, approximately five miles south of the city of Tomah. The population of Tunnel City was estimated to be around 200 people in 2020.
History
Tunnel City was founded in 1856 by a group of settlers from New York. The settlers were looking for a place to build a railroad tunnel, and they chose the area because of its proximity to the Wisconsin River. The first tunnel was completed in 1858, and the town was named after it. The tunnel was used to transport goods and passengers between Tomah and Sparta.
In the late 19th century, Tunnel City was a thriving community with a variety of businesses, including a hotel, a general store, a blacksmith shop, and a sawmill. The town also had a post office, a school, and a church.
In the early 20th century, the railroad industry began to decline, and the town's population began to dwindle. By the 1950s, the town was nearly abandoned. In the 1970s, the town was revitalized when a group of local residents formed the Tunnel City Historical Society. The society worked to preserve the town's history and to promote tourism.
Geography
Tunnel City is located in the western part of Monroe County, Wisconsin. It is situated in the town of Wellington, approximately five miles south of the city of Tomah. The town is located on the Wisconsin River, and is surrounded by rolling hills and forests.
The climate in Tunnel City is typical of the Midwest, with cold winters and hot summers. The average temperature in January is around 20 degrees Fahrenheit, and the average temperature in July is around 75 degrees Fahrenheit.
Economy
Tunnel City's economy is largely based on tourism. The town is home to several historic sites, including the Tunnel City Historical Society Museum, the Tunnel City Railroad Museum, and the Tunnel City Railroad Depot. The town also has several restaurants, shops, and other businesses that cater to tourists.
In addition to tourism, Tunnel City is home to several small businesses, including a sawmill, a blacksmith shop, and a general store. The town also has a post office and a school.
Demographics
As of the 2020 census, the population of Tunnel City was estimated to be around 200 people. The racial makeup of the town was 97.5% White, 0.5% African American, 0.5% Native American, and 1.5% from other races. The median household income was $37,500, and the median age was 44.5 years.
Conclusion
Tunnel City is a small unincorporated community located in Monroe County, Wisconsin. It was founded in 1856 by a group of settlers from New York, and was named after the railroad tunnel that was built in the area. The town has a rich history, and is home to several historic sites and businesses. The economy of Tunnel City is largely based on tourism, and the town has a population of around 200 people.
Common Questions
What is Per Capita Income in Tunnel City?
Per Capita income in Tunnel City is $67,326.
What is Inequality or Gini Index in Tunnel City?
Inequality or Gini Index in Tunnel City is 0.41.
What is the Total Population of Tunnel City?
Total Population of Tunnel City is 128.
What is the Total Male Population of Tunnel City?
Total Male Population of Tunnel City is 78.
What is the Total Female Population of Tunnel City?
Total Female Population of Tunnel City is 50.
What is the Ratio of Males per 100 Females in Tunnel City?
There are 156.00 Males per 100 Females in Tunnel City.
What is the Ratio of Females per 100 Males in Tunnel City?
There are 64.10 Females per 100 Males in Tunnel City.
What is the Median Population Age in Tunnel City?
Median Population Age in Tunnel City is 45.4 Years.
What is the Average Family Size in Tunnel City
Average Family Size in Tunnel City is 1.9 People.
What is the Average Household Size in Tunnel City
Average Household Size in Tunnel City is 1.8 People.
How Large is the Labor Force in Tunnel City?
There are 57 People in the Labor Forcein in Tunnel City.
What is the Percentage of People in the Labor Force in Tunnel City?
52.8% of People are in the Labor Force in Tunnel City.