Brown Deer, WI Map & Demographics
Brown Deer Map
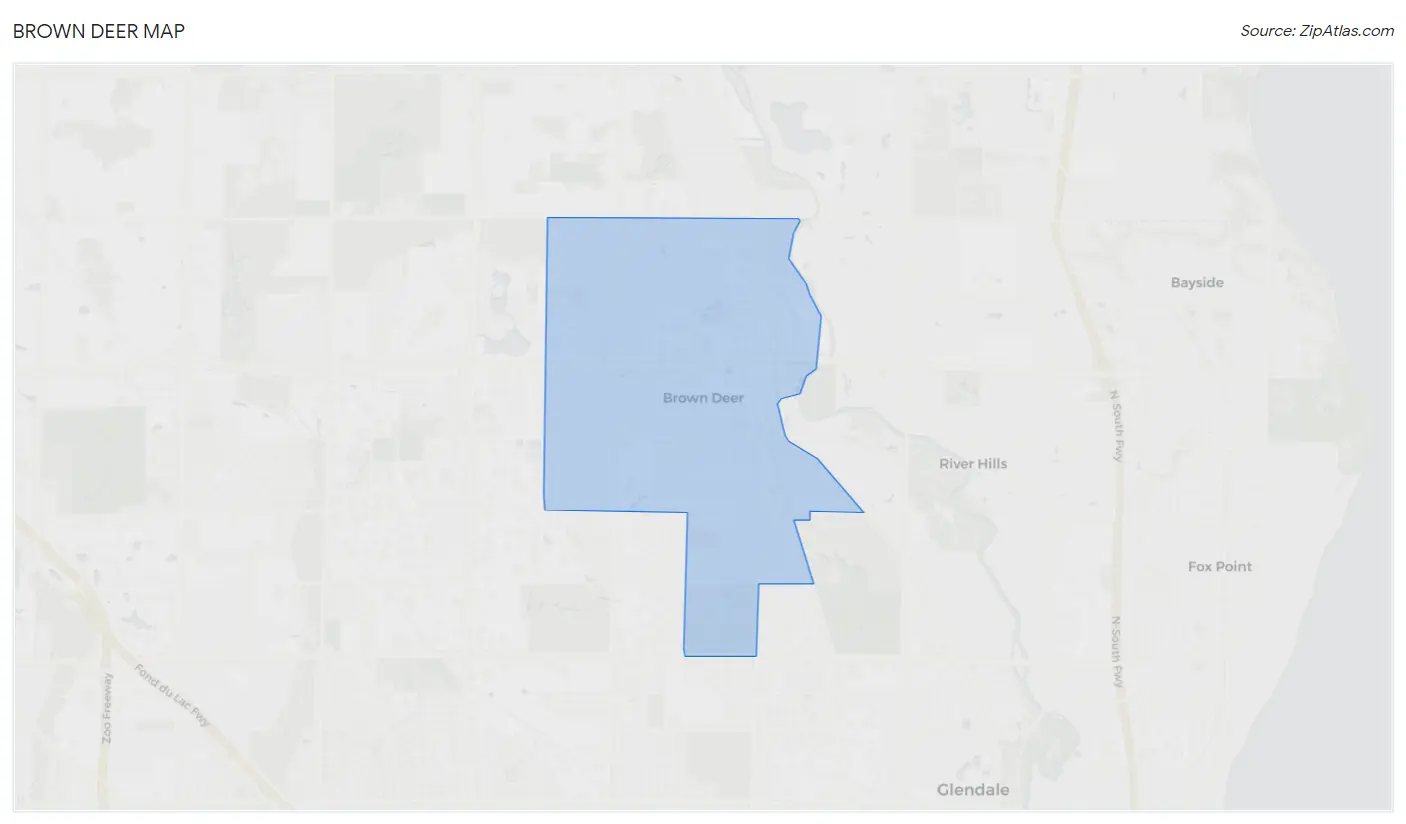
Brown Deer Overview
$38,692
PER CAPITA INCOME
$110,724
AVG FAMILY INCOME
$88,164
AVG HOUSEHOLD INCOME
32.1%
WAGE / INCOME GAP [ % ]
67.9¢/ $1
WAGE / INCOME GAP [ $ ]
0.37
INEQUALITY / GINI INDEX
12,593
TOTAL POPULATION
6,490
MALE POPULATION
6,103
FEMALE POPULATION
106.34
MALES / 100 FEMALES
94.04
FEMALES / 100 MALES
42.7
MEDIAN AGE
2.8
AVG FAMILY SIZE
2.2
AVG HOUSEHOLD SIZE
6,665
LABOR FORCE [ PEOPLE ]
63.7%
PERCENT IN LABOR FORCE
3.8%
UNEMPLOYMENT RATE
Income in Brown Deer
Income Overview in Brown Deer
Per Capita Income in Brown Deer is $38,692, while median incomes of families and households are $110,724 and $88,164 respectively.
| Characteristic | Number | Measure |
| Per Capita Income | 12,593 | $38,692 |
| Median Family Income | 3,681 | $110,724 |
| Mean Family Income | 3,681 | $106,758 |
| Median Household Income | 5,684 | $88,164 |
| Mean Household Income | 5,684 | $87,320 |
| Income Deficit | 3,681 | $0 |
| Wage / Income Gap (%) | 12,593 | 32.11% |
| Wage / Income Gap ($) | 12,593 | 67.89¢ per $1 |
| Gini / Inequality Index | 12,593 | 0.37 |
Earnings by Sex in Brown Deer
Average Earnings in Brown Deer are $52,730, $59,951 for men and $40,703 for women, a difference of 32.1%.
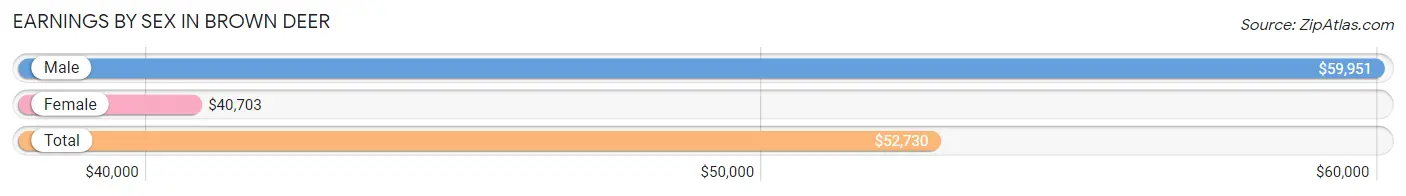
| Sex | Number | Average Earnings |
| Male | 3,509 (50.4%) | $59,951 |
| Female | 3,448 (49.6%) | $40,703 |
| Total | 6,957 (100.0%) | $52,730 |
Earnings by Sex by Income Bracket in Brown Deer
The most common earnings brackets in Brown Deer are $65,000 to $74,999 for men (647 | 18.4%) and $75,000 to $99,999 for women (660 | 19.1%).
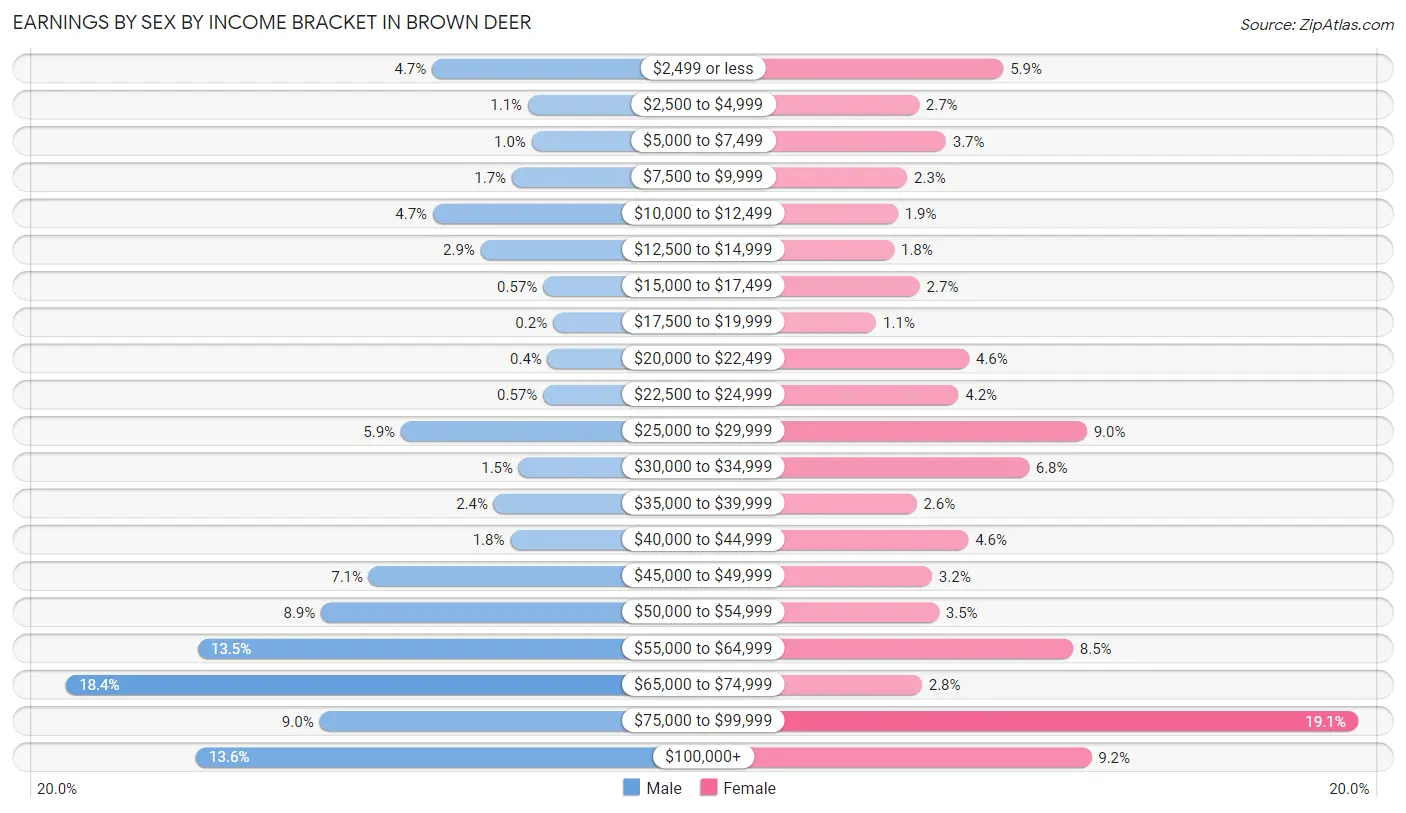
| Income | Male | Female |
| $2,499 or less | 166 (4.7%) | 202 (5.9%) |
| $2,500 to $4,999 | 40 (1.1%) | 93 (2.7%) |
| $5,000 to $7,499 | 35 (1.0%) | 128 (3.7%) |
| $7,500 to $9,999 | 61 (1.7%) | 78 (2.3%) |
| $10,000 to $12,499 | 165 (4.7%) | 66 (1.9%) |
| $12,500 to $14,999 | 102 (2.9%) | 61 (1.8%) |
| $15,000 to $17,499 | 20 (0.6%) | 94 (2.7%) |
| $17,500 to $19,999 | 7 (0.2%) | 38 (1.1%) |
| $20,000 to $22,499 | 14 (0.4%) | 158 (4.6%) |
| $22,500 to $24,999 | 20 (0.6%) | 144 (4.2%) |
| $25,000 to $29,999 | 207 (5.9%) | 310 (9.0%) |
| $30,000 to $34,999 | 52 (1.5%) | 235 (6.8%) |
| $35,000 to $39,999 | 85 (2.4%) | 90 (2.6%) |
| $40,000 to $44,999 | 63 (1.8%) | 157 (4.5%) |
| $45,000 to $49,999 | 249 (7.1%) | 110 (3.2%) |
| $50,000 to $54,999 | 312 (8.9%) | 119 (3.5%) |
| $55,000 to $64,999 | 474 (13.5%) | 292 (8.5%) |
| $65,000 to $74,999 | 647 (18.4%) | 97 (2.8%) |
| $75,000 to $99,999 | 314 (8.9%) | 660 (19.1%) |
| $100,000+ | 476 (13.6%) | 316 (9.2%) |
| Total | 3,509 (100.0%) | 3,448 (100.0%) |
Earnings by Sex by Educational Attainment in Brown Deer
Average earnings in Brown Deer are $60,993 for men and $45,386 for women, a difference of 25.6%. Men with an educational attainment of graduate degree enjoy the highest average annual earnings of $98,153, while those with less than high school education earn the least with $25,677. Women with an educational attainment of bachelor's degree earn the most with the average annual earnings of $58,447, while those with high school diploma education have the smallest earnings of $28,915.
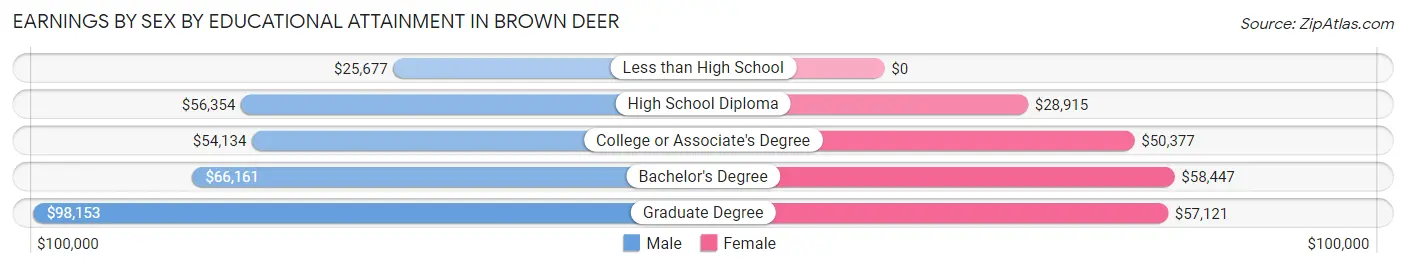
| Educational Attainment | Male Income | Female Income |
| Less than High School | $25,677 | $0 |
| High School Diploma | $56,354 | $28,915 |
| College or Associate's Degree | $54,134 | $50,377 |
| Bachelor's Degree | $66,161 | $58,447 |
| Graduate Degree | $98,153 | $57,121 |
| Total | $60,993 | $45,386 |
Family Income in Brown Deer
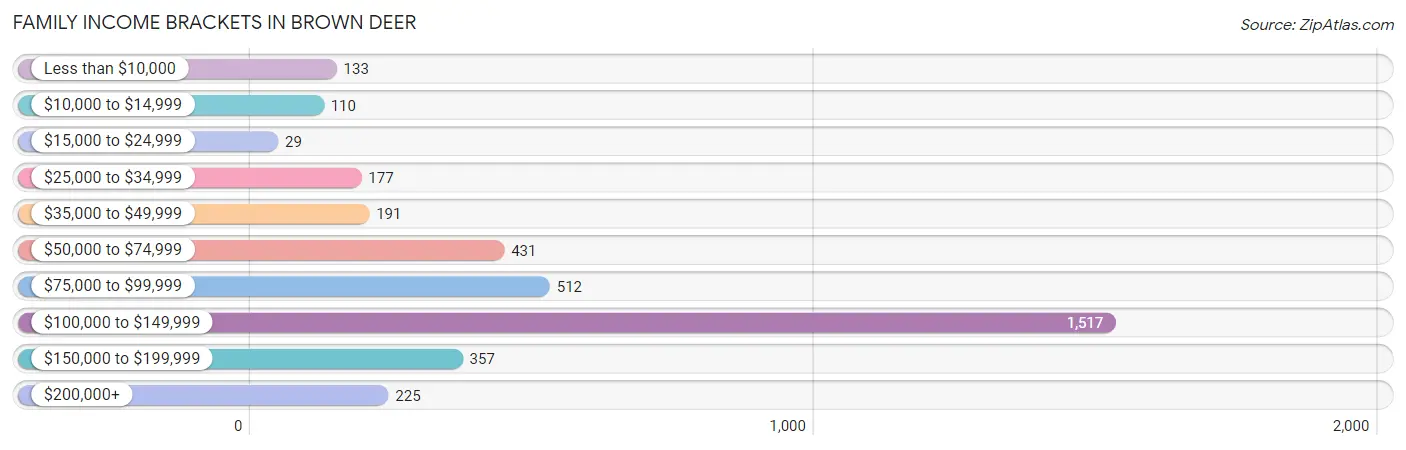
Family Income Brackets in Brown Deer
According to the Brown Deer family income data, there are 1,517 families falling into the $100,000 to $149,999 income range, which is the most common income bracket and makes up 41.2% of all families. Conversely, the $15,000 to $24,999 income bracket is the least frequent group with only 29 families (0.8%) belonging to this category.
| Income Bracket | # Families | % Families |
| Less than $10,000 | 133 | 3.6% |
| $10,000 to $14,999 | 110 | 3.0% |
| $15,000 to $24,999 | 29 | 0.8% |
| $25,000 to $34,999 | 177 | 4.8% |
| $35,000 to $49,999 | 191 | 5.2% |
| $50,000 to $74,999 | 431 | 11.7% |
| $75,000 to $99,999 | 512 | 13.9% |
| $100,000 to $149,999 | 1,517 | 41.2% |
| $150,000 to $199,999 | 357 | 9.7% |
| $200,000+ | 225 | 6.1% |
Family Income by Famaliy Size in Brown Deer
5-person families (373 | 10.1%) account for the highest median family income in Brown Deer with $140,720 per family, while 2-person families (2,050 | 55.7%) have the highest median income of $52,965 per family member.
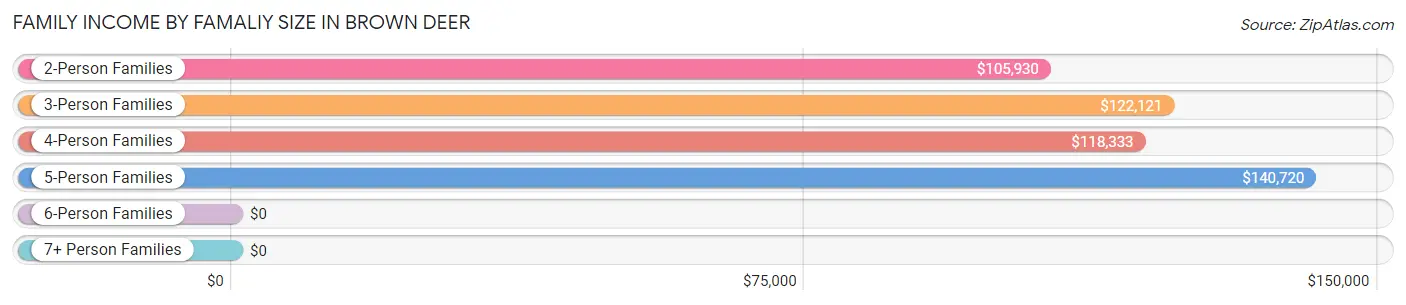
| Income Bracket | # Families | Median Income |
| 2-Person Families | 2,050 (55.7%) | $105,930 |
| 3-Person Families | 820 (22.3%) | $122,121 |
| 4-Person Families | 402 (10.9%) | $118,333 |
| 5-Person Families | 373 (10.1%) | $140,720 |
| 6-Person Families | 36 (1.0%) | $0 |
| 7+ Person Families | 0 (0.0%) | $0 |
| Total | 3,681 (100.0%) | $110,724 |
Family Income by Number of Earners in Brown Deer
The median family income in Brown Deer is $110,724, with families comprising 3+ earners (402) having the highest median family income of $143,160, while families with no earners (526) have the lowest median family income of $31,964, accounting for 10.9% and 14.3% of families, respectively.
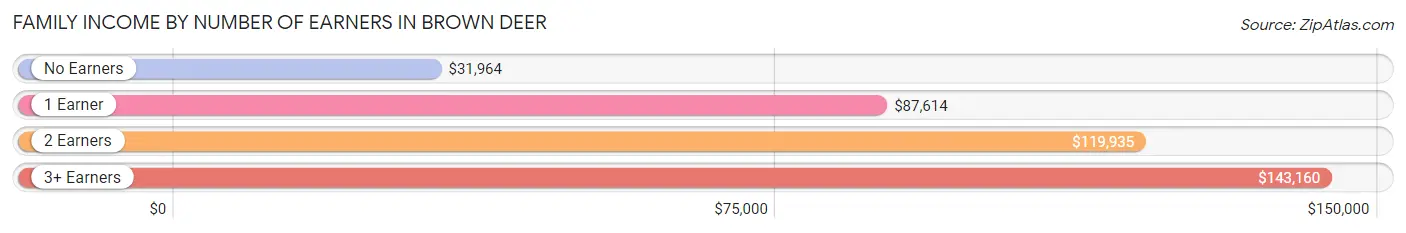
| Number of Earners | # Families | Median Income |
| No Earners | 526 (14.3%) | $31,964 |
| 1 Earner | 1,121 (30.4%) | $87,614 |
| 2 Earners | 1,632 (44.3%) | $119,935 |
| 3+ Earners | 402 (10.9%) | $143,160 |
| Total | 3,681 (100.0%) | $110,724 |
Household Income in Brown Deer
Household Income Brackets in Brown Deer
With 1,722 households falling in the category, the $100,000 to $149,999 income range is the most frequent in Brown Deer, accounting for 30.3% of all households. In contrast, only 227 households (4.0%) fall into the less than $10,000 income bracket, making it the least populous group.
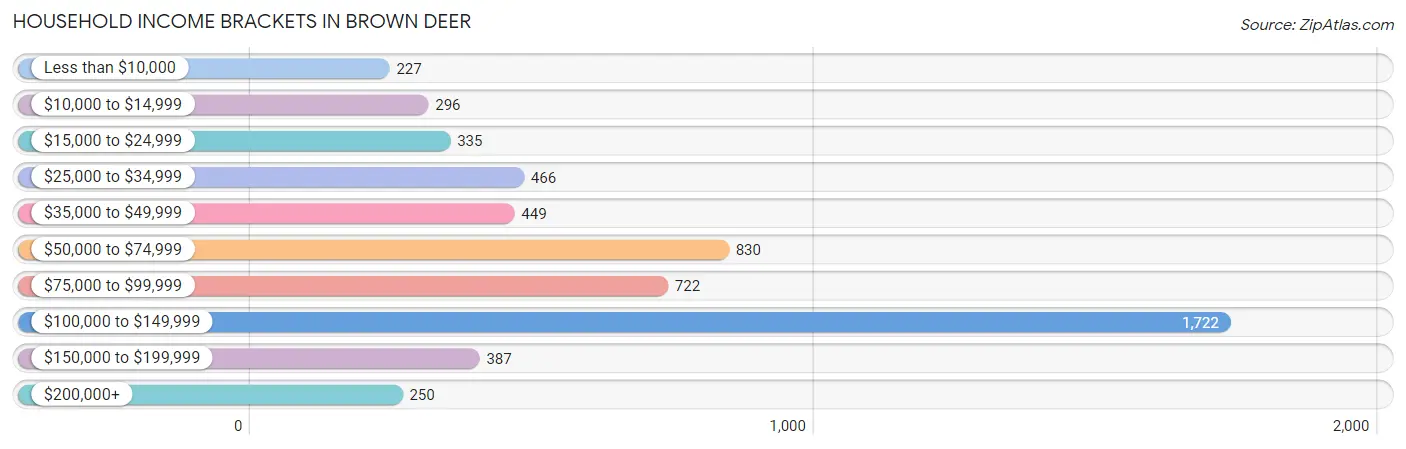
| Income Bracket | # Households | % Households |
| Less than $10,000 | 227 | 4.0% |
| $10,000 to $14,999 | 296 | 5.2% |
| $15,000 to $24,999 | 335 | 5.9% |
| $25,000 to $34,999 | 466 | 8.2% |
| $35,000 to $49,999 | 449 | 7.9% |
| $50,000 to $74,999 | 830 | 14.6% |
| $75,000 to $99,999 | 722 | 12.7% |
| $100,000 to $149,999 | 1,722 | 30.3% |
| $150,000 to $199,999 | 387 | 6.8% |
| $200,000+ | 250 | 4.4% |
Household Income by Householder Age in Brown Deer
The median household income in Brown Deer is $88,164, with the highest median household income of $94,974 found in the 25 to 44 years age bracket for the primary householder. A total of 1,844 households (32.4%) fall into this category. Meanwhile, the 15 to 24 years age bracket for the primary householder has the lowest median household income of $0, with 73 households (1.3%) in this group.
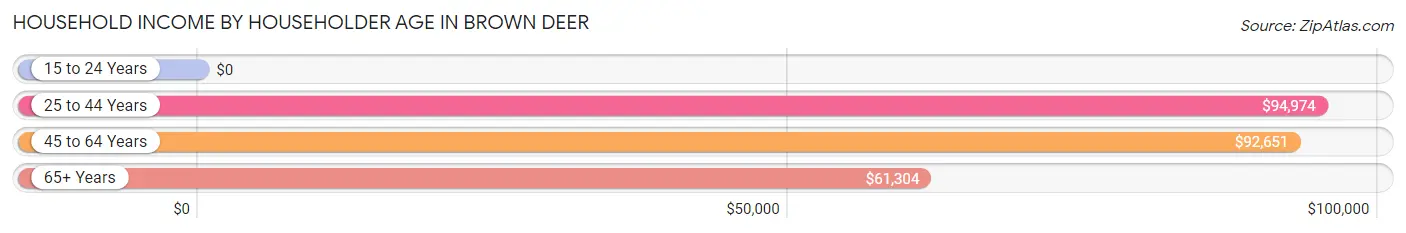
| Income Bracket | # Households | Median Income |
| 15 to 24 Years | 73 (1.3%) | $0 |
| 25 to 44 Years | 1,844 (32.4%) | $94,974 |
| 45 to 64 Years | 2,037 (35.8%) | $92,651 |
| 65+ Years | 1,730 (30.4%) | $61,304 |
| Total | 5,684 (100.0%) | $88,164 |
Poverty in Brown Deer
Income Below Poverty by Sex and Age in Brown Deer
With 9.5% poverty level for males and 11.3% for females among the residents of Brown Deer, under 5 year old males and 18 to 24 year old females are the most vulnerable to poverty, with 85 males (24.5%) and 87 females (36.9%) in their respective age groups living below the poverty level.
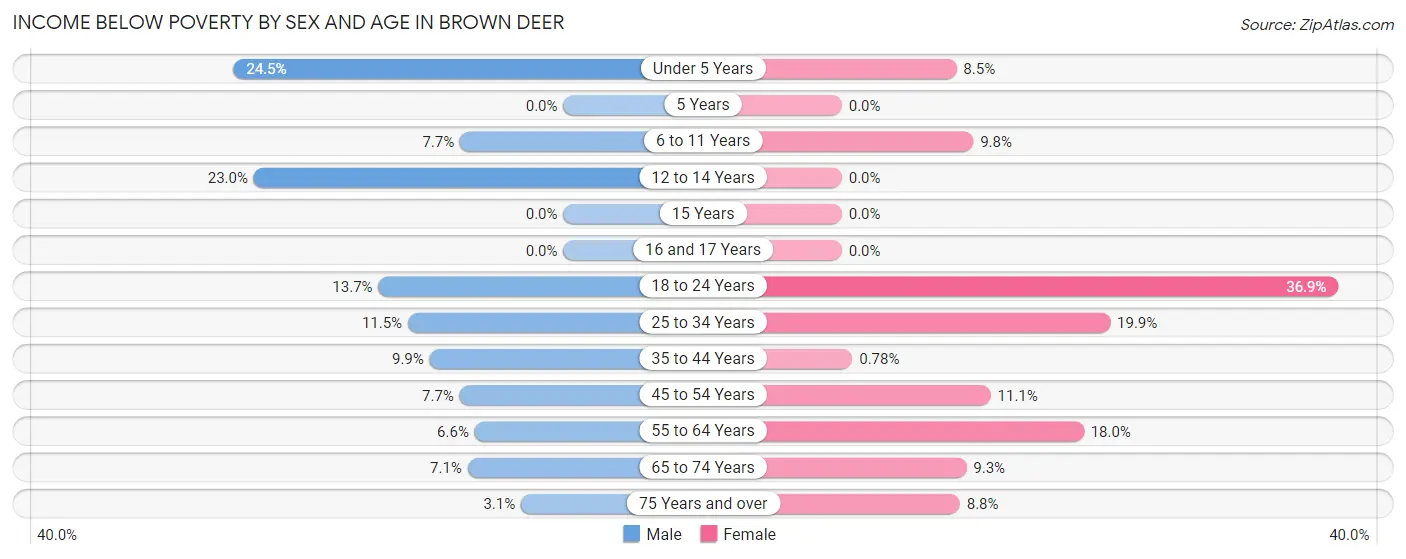
| Age Bracket | Male | Female |
| Under 5 Years | 85 (24.5%) | 24 (8.5%) |
| 5 Years | 0 (0.0%) | 0 (0.0%) |
| 6 to 11 Years | 44 (7.7%) | 45 (9.8%) |
| 12 to 14 Years | 37 (23.0%) | 0 (0.0%) |
| 15 Years | 0 (0.0%) | 0 (0.0%) |
| 16 and 17 Years | 0 (0.0%) | 0 (0.0%) |
| 18 to 24 Years | 71 (13.7%) | 87 (36.9%) |
| 25 to 34 Years | 113 (11.5%) | 155 (19.9%) |
| 35 to 44 Years | 90 (9.9%) | 7 (0.8%) |
| 45 to 54 Years | 55 (7.7%) | 75 (11.1%) |
| 55 to 64 Years | 58 (6.6%) | 173 (18.0%) |
| 65 to 74 Years | 54 (7.1%) | 86 (9.2%) |
| 75 Years and over | 11 (3.1%) | 38 (8.8%) |
| Total | 618 (9.5%) | 690 (11.3%) |
Income Above Poverty by Sex and Age in Brown Deer
According to the poverty statistics in Brown Deer, males aged 5 years and females aged 5 years are the age groups that are most secure financially, with 100.0% of males and 100.0% of females in these age groups living above the poverty line.
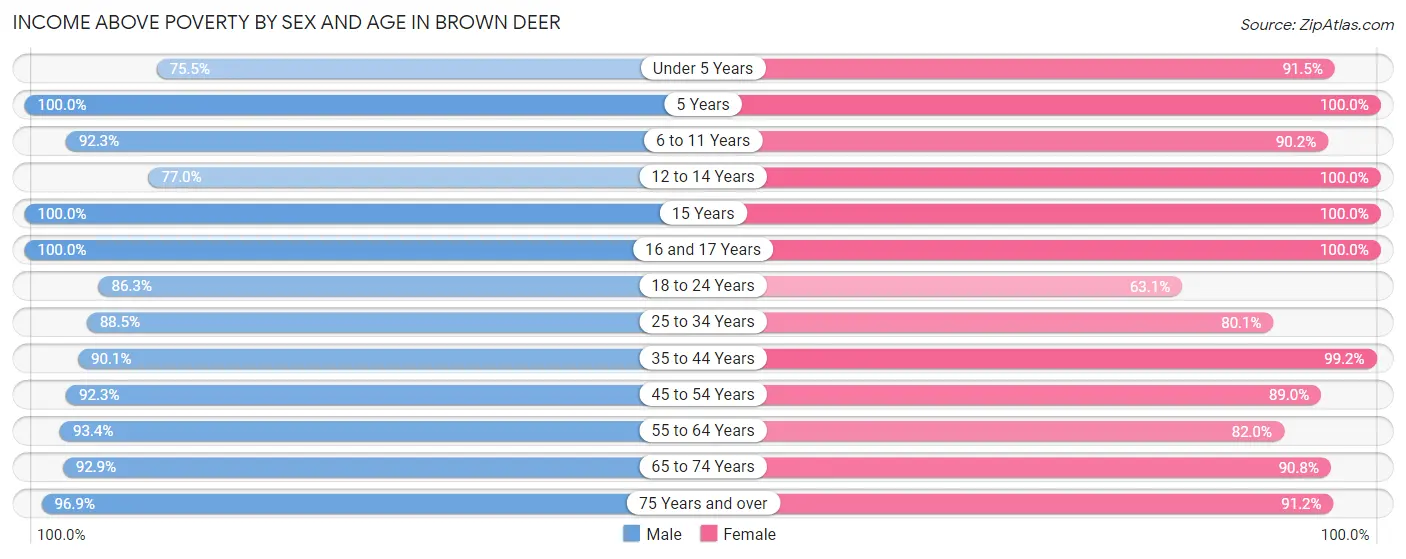
| Age Bracket | Male | Female |
| Under 5 Years | 262 (75.5%) | 258 (91.5%) |
| 5 Years | 45 (100.0%) | 68 (100.0%) |
| 6 to 11 Years | 530 (92.3%) | 416 (90.2%) |
| 12 to 14 Years | 124 (77.0%) | 116 (100.0%) |
| 15 Years | 44 (100.0%) | 31 (100.0%) |
| 16 and 17 Years | 206 (100.0%) | 221 (100.0%) |
| 18 to 24 Years | 446 (86.3%) | 149 (63.1%) |
| 25 to 34 Years | 866 (88.5%) | 623 (80.1%) |
| 35 to 44 Years | 816 (90.1%) | 886 (99.2%) |
| 45 to 54 Years | 659 (92.3%) | 604 (88.9%) |
| 55 to 64 Years | 824 (93.4%) | 790 (82.0%) |
| 65 to 74 Years | 707 (92.9%) | 844 (90.7%) |
| 75 Years and over | 339 (96.9%) | 396 (91.2%) |
| Total | 5,868 (90.5%) | 5,402 (88.7%) |
Income Below Poverty Among Married-Couple Families in Brown Deer
The poverty statistics for married-couple families in Brown Deer show that 5.2% or 160 of the total 3,051 families live below the poverty line. Families with 3 or 4 children have the highest poverty rate of 23.6%, comprising of 47 families. On the other hand, families with 1 or 2 children have the lowest poverty rate of 1.2%, which includes 9 families.
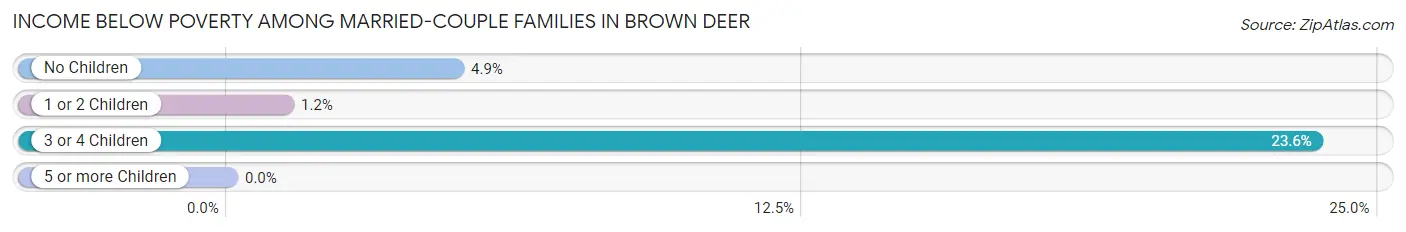
| Children | Above Poverty | Below Poverty |
| No Children | 2,010 (95.1%) | 104 (4.9%) |
| 1 or 2 Children | 729 (98.8%) | 9 (1.2%) |
| 3 or 4 Children | 152 (76.4%) | 47 (23.6%) |
| 5 or more Children | 0 (0.0%) | 0 (0.0%) |
| Total | 2,891 (94.8%) | 160 (5.2%) |
Income Below Poverty Among Single-Parent Households in Brown Deer
According to the poverty data in Brown Deer, 5.3% or 7 single-father households and 25.6% or 127 single-mother households are living below the poverty line. Among single-father households, those with no children have the highest poverty rate, with 7 households (12.3%) experiencing poverty. Likewise, among single-mother households, those with 3 or 4 children have the highest poverty rate, with 22 households (71.0%) falling below the poverty line.
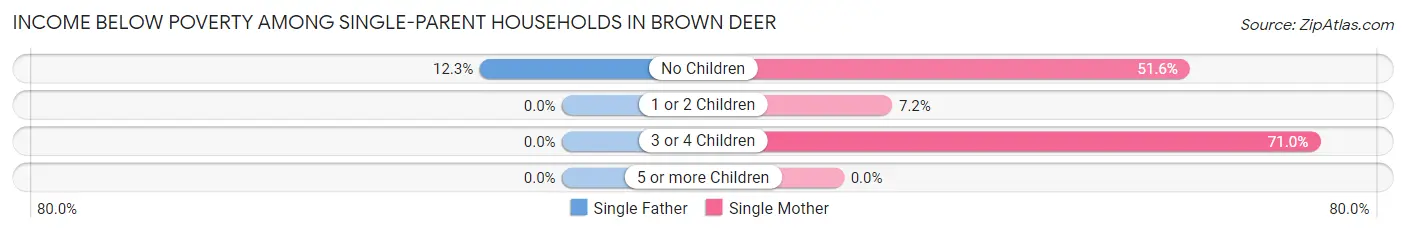
| Children | Single Father | Single Mother |
| No Children | 7 (12.3%) | 83 (51.5%) |
| 1 or 2 Children | 0 (0.0%) | 22 (7.2%) |
| 3 or 4 Children | 0 (0.0%) | 22 (71.0%) |
| 5 or more Children | 0 (0.0%) | 0 (0.0%) |
| Total | 7 (5.3%) | 127 (25.6%) |
Income Below Poverty Among Married-Couple vs Single-Parent Households in Brown Deer
The poverty data for Brown Deer shows that 160 of the married-couple family households (5.2%) and 134 of the single-parent households (21.3%) are living below the poverty level. Within the married-couple family households, those with 3 or 4 children have the highest poverty rate, with 47 households (23.6%) falling below the poverty line. Among the single-parent households, those with 3 or 4 children have the highest poverty rate, with 22 household (71.0%) living below poverty.
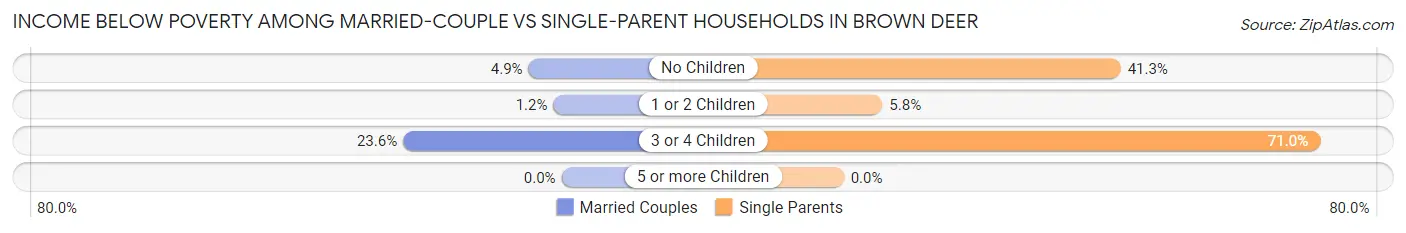
| Children | Married-Couple Families | Single-Parent Households |
| No Children | 104 (4.9%) | 90 (41.3%) |
| 1 or 2 Children | 9 (1.2%) | 22 (5.8%) |
| 3 or 4 Children | 47 (23.6%) | 22 (71.0%) |
| 5 or more Children | 0 (0.0%) | 0 (0.0%) |
| Total | 160 (5.2%) | 134 (21.3%) |
Race in Brown Deer
The most populous races in Brown Deer are White / Caucasian (6,257 | 49.7%), Black / African American (3,875 | 30.8%), and Two or more Races (1,450 | 11.5%).
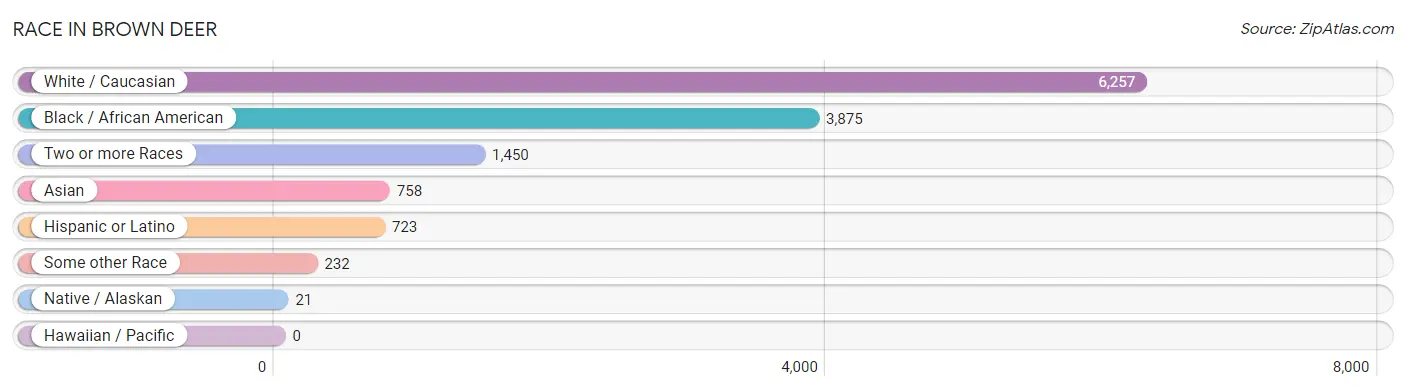
| Race | # Population | % Population |
| Asian | 758 | 6.0% |
| Black / African American | 3,875 | 30.8% |
| Hawaiian / Pacific | 0 | 0.0% |
| Hispanic or Latino | 723 | 5.7% |
| Native / Alaskan | 21 | 0.2% |
| White / Caucasian | 6,257 | 49.7% |
| Two or more Races | 1,450 | 11.5% |
| Some other Race | 232 | 1.8% |
| Total | 12,593 | 100.0% |
Ancestry in Brown Deer
The most populous ancestries reported in Brown Deer are German (3,324 | 26.4%), Irish (1,063 | 8.4%), Polish (612 | 4.9%), English (566 | 4.5%), and Subsaharan African (484 | 3.8%), together accounting for 48.0% of all Brown Deer residents.
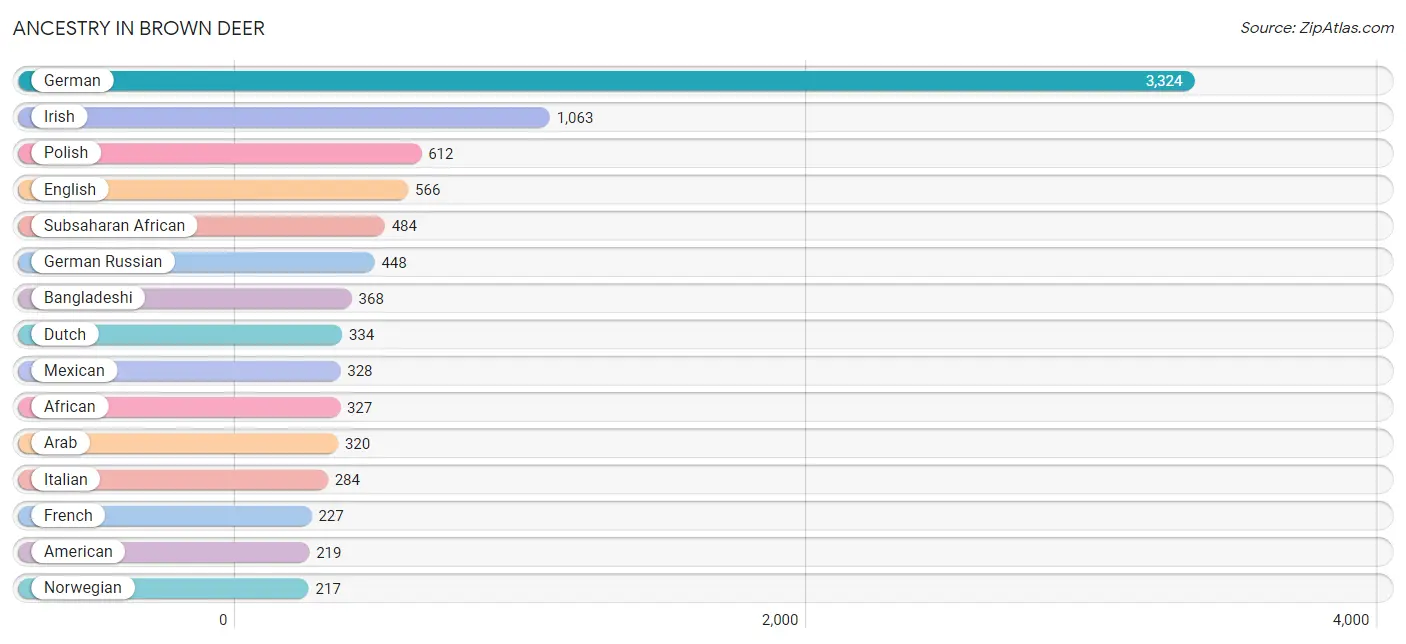
| Ancestry | # Population | % Population |
| African | 327 | 2.6% |
| American | 219 | 1.7% |
| Arab | 320 | 2.5% |
| Argentinean | 11 | 0.1% |
| Armenian | 24 | 0.2% |
| Austrian | 13 | 0.1% |
| Bangladeshi | 368 | 2.9% |
| Bhutanese | 13 | 0.1% |
| British | 11 | 0.1% |
| Burmese | 12 | 0.1% |
| Canadian | 25 | 0.2% |
| Central American | 209 | 1.7% |
| Central American Indian | 10 | 0.1% |
| Cherokee | 36 | 0.3% |
| Croatian | 107 | 0.9% |
| Czech | 137 | 1.1% |
| Czechoslovakian | 22 | 0.2% |
| Danish | 14 | 0.1% |
| Dutch | 334 | 2.6% |
| Eastern European | 19 | 0.2% |
| Ecuadorian | 13 | 0.1% |
| English | 566 | 4.5% |
| European | 101 | 0.8% |
| Finnish | 30 | 0.2% |
| French | 227 | 1.8% |
| French Canadian | 90 | 0.7% |
| German | 3,324 | 26.4% |
| German Russian | 448 | 3.6% |
| Ghanaian | 101 | 0.8% |
| Greek | 12 | 0.1% |
| Guatemalan | 163 | 1.3% |
| Honduran | 10 | 0.1% |
| Hungarian | 53 | 0.4% |
| Indian (Asian) | 95 | 0.7% |
| Irish | 1,063 | 8.4% |
| Italian | 284 | 2.3% |
| Jamaican | 36 | 0.3% |
| Korean | 79 | 0.6% |
| Lithuanian | 15 | 0.1% |
| Luxembourger | 14 | 0.1% |
| Mexican | 328 | 2.6% |
| Mexican American Indian | 11 | 0.1% |
| Native Hawaiian | 13 | 0.1% |
| Nigerian | 157 | 1.3% |
| Norwegian | 217 | 1.7% |
| Polish | 612 | 4.9% |
| Portuguese | 13 | 0.1% |
| Puerto Rican | 162 | 1.3% |
| Romanian | 15 | 0.1% |
| Russian | 129 | 1.0% |
| Salvadoran | 36 | 0.3% |
| Scandinavian | 11 | 0.1% |
| Scotch-Irish | 26 | 0.2% |
| Scottish | 86 | 0.7% |
| Sioux | 6 | 0.1% |
| Slovak | 29 | 0.2% |
| South American | 24 | 0.2% |
| Sri Lankan | 52 | 0.4% |
| Subsaharan African | 484 | 3.8% |
| Swedish | 100 | 0.8% |
| Swiss | 29 | 0.2% |
| Thai | 120 | 0.9% |
| Tongan | 16 | 0.1% |
| Ukrainian | 56 | 0.4% |
| Welsh | 3 | 0.0% |
| West Indian | 19 | 0.2% | View All 66 Rows |
Immigrants in Brown Deer
The most numerous immigrant groups reported in Brown Deer came from Asia (506 | 4.0%), Latin America (235 | 1.9%), Saudi Arabia (235 | 1.9%), Western Asia (235 | 1.9%), and Europe (232 | 1.8%), together accounting for 11.5% of all Brown Deer residents.
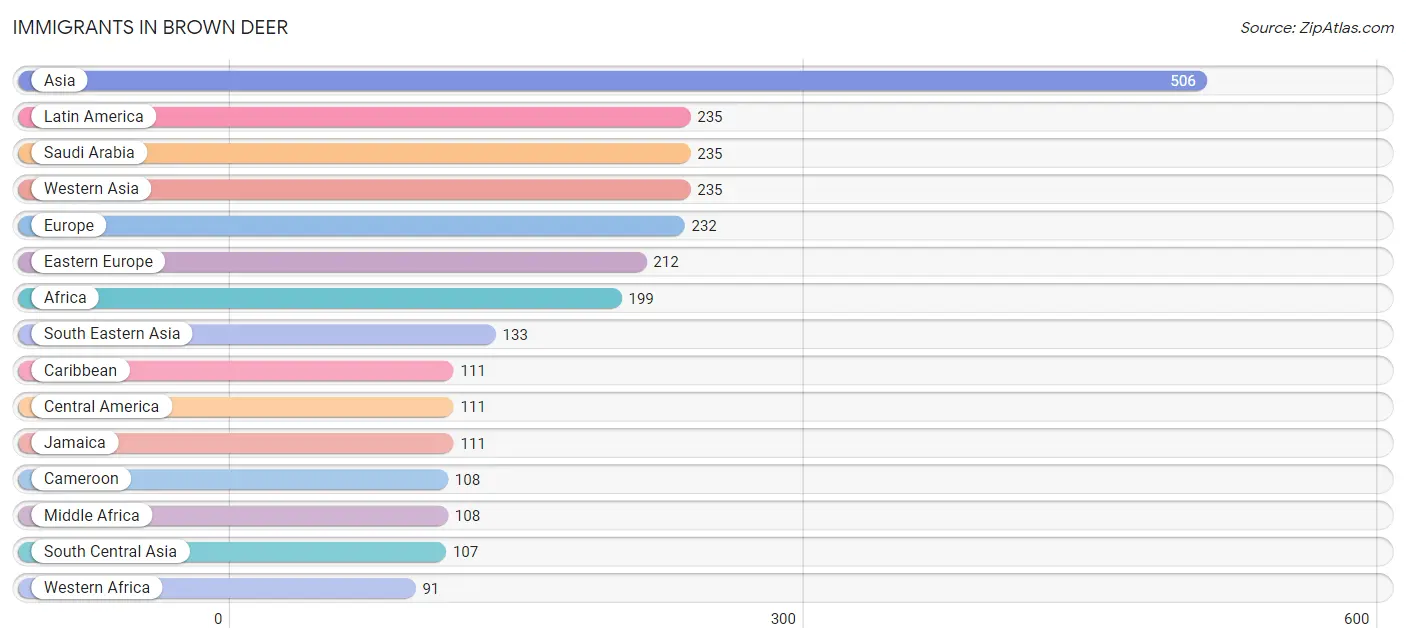
| Immigration Origin | # Population | % Population |
| Africa | 199 | 1.6% |
| Asia | 506 | 4.0% |
| Belarus | 48 | 0.4% |
| Cameroon | 108 | 0.9% |
| Canada | 21 | 0.2% |
| Caribbean | 111 | 0.9% |
| Central America | 111 | 0.9% |
| China | 31 | 0.3% |
| Czechoslovakia | 41 | 0.3% |
| Eastern Asia | 31 | 0.3% |
| Eastern Europe | 212 | 1.7% |
| Ecuador | 13 | 0.1% |
| El Salvador | 36 | 0.3% |
| Europe | 232 | 1.8% |
| Ghana | 35 | 0.3% |
| Honduras | 10 | 0.1% |
| India | 65 | 0.5% |
| Italy | 20 | 0.2% |
| Jamaica | 111 | 0.9% |
| Laos | 51 | 0.4% |
| Latin America | 235 | 1.9% |
| Mexico | 65 | 0.5% |
| Middle Africa | 108 | 0.9% |
| Nigeria | 56 | 0.4% |
| Pakistan | 42 | 0.3% |
| Philippines | 20 | 0.2% |
| Romania | 38 | 0.3% |
| Saudi Arabia | 235 | 1.9% |
| South America | 13 | 0.1% |
| South Central Asia | 107 | 0.9% |
| South Eastern Asia | 133 | 1.1% |
| Southern Europe | 20 | 0.2% |
| Thailand | 30 | 0.2% |
| Ukraine | 64 | 0.5% |
| Vietnam | 32 | 0.3% |
| Western Africa | 91 | 0.7% |
| Western Asia | 235 | 1.9% | View All 37 Rows |
Sex and Age in Brown Deer
Sex and Age in Brown Deer
The most populous age groups in Brown Deer are 25 to 29 Years (693 | 10.7%) for men and 40 to 44 Years (618 | 10.1%) for women.
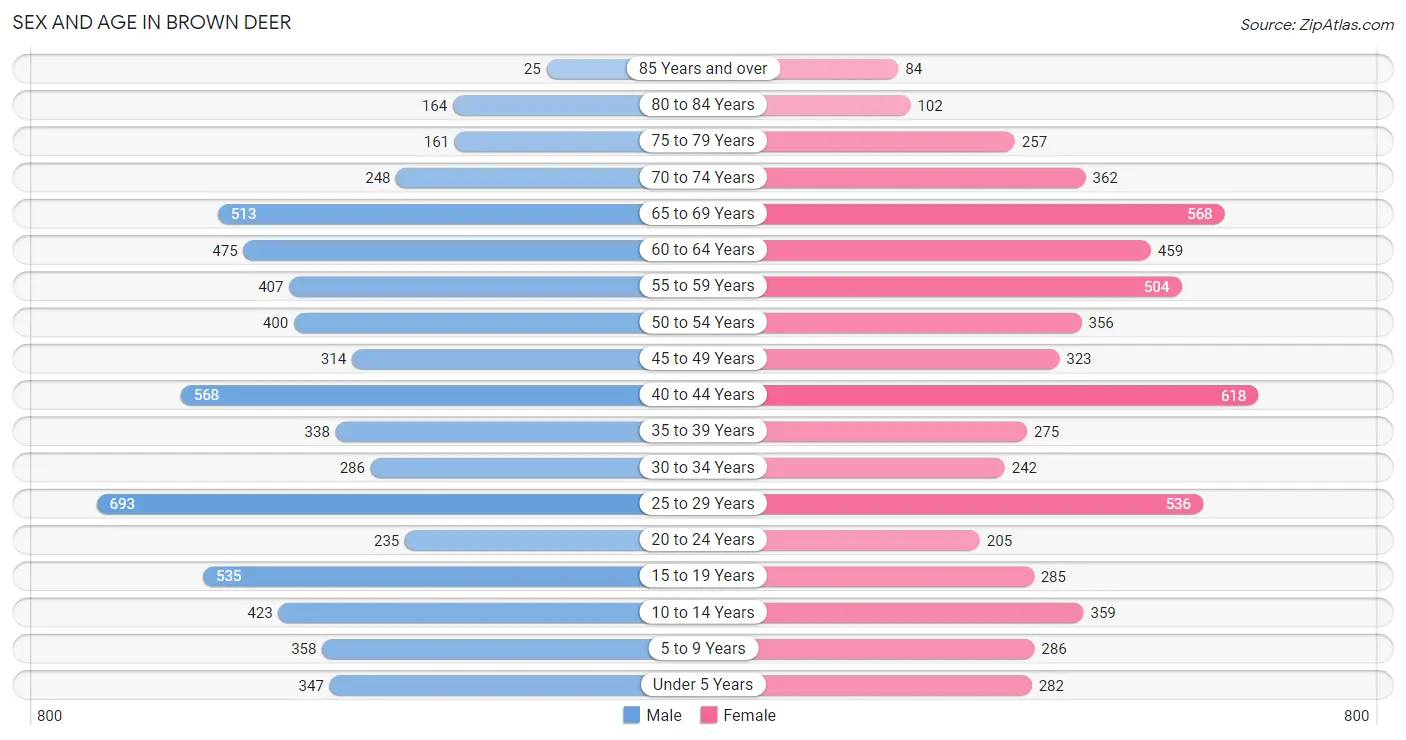
| Age Bracket | Male | Female |
| Under 5 Years | 347 (5.3%) | 282 (4.6%) |
| 5 to 9 Years | 358 (5.5%) | 286 (4.7%) |
| 10 to 14 Years | 423 (6.5%) | 359 (5.9%) |
| 15 to 19 Years | 535 (8.2%) | 285 (4.7%) |
| 20 to 24 Years | 235 (3.6%) | 205 (3.4%) |
| 25 to 29 Years | 693 (10.7%) | 536 (8.8%) |
| 30 to 34 Years | 286 (4.4%) | 242 (4.0%) |
| 35 to 39 Years | 338 (5.2%) | 275 (4.5%) |
| 40 to 44 Years | 568 (8.7%) | 618 (10.1%) |
| 45 to 49 Years | 314 (4.8%) | 323 (5.3%) |
| 50 to 54 Years | 400 (6.2%) | 356 (5.8%) |
| 55 to 59 Years | 407 (6.3%) | 504 (8.3%) |
| 60 to 64 Years | 475 (7.3%) | 459 (7.5%) |
| 65 to 69 Years | 513 (7.9%) | 568 (9.3%) |
| 70 to 74 Years | 248 (3.8%) | 362 (5.9%) |
| 75 to 79 Years | 161 (2.5%) | 257 (4.2%) |
| 80 to 84 Years | 164 (2.5%) | 102 (1.7%) |
| 85 Years and over | 25 (0.4%) | 84 (1.4%) |
| Total | 6,490 (100.0%) | 6,103 (100.0%) |
Families and Households in Brown Deer
Median Family Size in Brown Deer
The median family size in Brown Deer is 2.77 persons per family, with single female/mother families (497 | 13.5%) accounting for the largest median family size of 2.81 persons per family. On the other hand, single male/father families (133 | 3.6%) represent the smallest median family size with 1.98 persons per family.
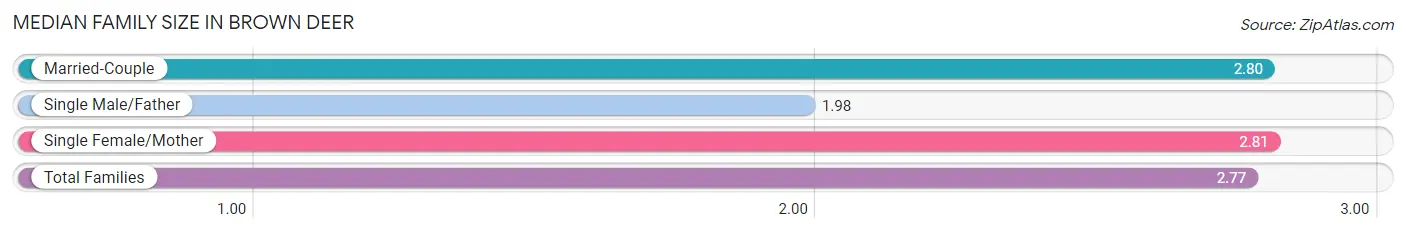
| Family Type | # Families | Family Size |
| Married-Couple | 3,051 (82.9%) | 2.80 |
| Single Male/Father | 133 (3.6%) | 1.98 |
| Single Female/Mother | 497 (13.5%) | 2.81 |
| Total Families | 3,681 (100.0%) | 2.77 |
Median Household Size in Brown Deer
The median household size in Brown Deer is 2.20 persons per household, with single female/mother households (497 | 8.7%) accounting for the largest median household size of 2.9 persons per household. non-family households (2,003 | 35.2%) represent the smallest median household size with 1.09 persons per household.
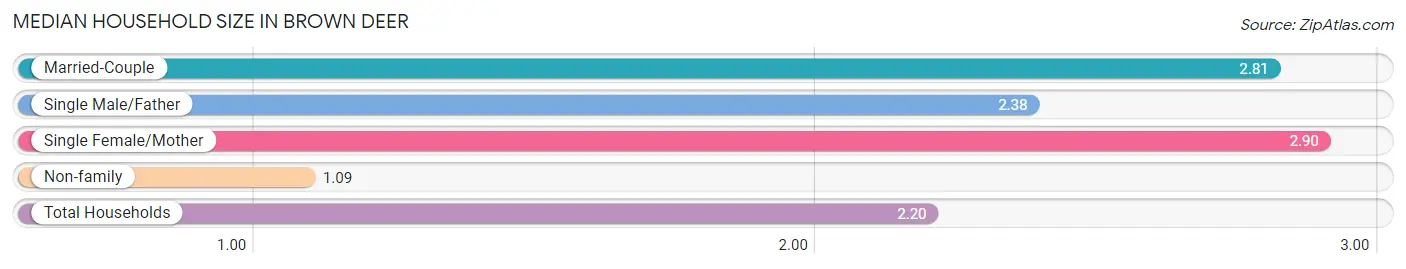
| Household Type | # Households | Household Size |
| Married-Couple | 3,051 (53.7%) | 2.81 |
| Single Male/Father | 133 (2.3%) | 2.38 |
| Single Female/Mother | 497 (8.7%) | 2.90 |
| Non-family | 2,003 (35.2%) | 1.09 |
| Total Households | 5,684 (100.0%) | 2.20 |
Household Size by Marriage Status in Brown Deer
Out of a total of 5,684 households in Brown Deer, 3,681 (64.8%) are family households, while 2,003 (35.2%) are nonfamily households. The most numerous type of family households are 2-person households, comprising 1,985, and the most common type of nonfamily households are 1-person households, comprising 1,867.
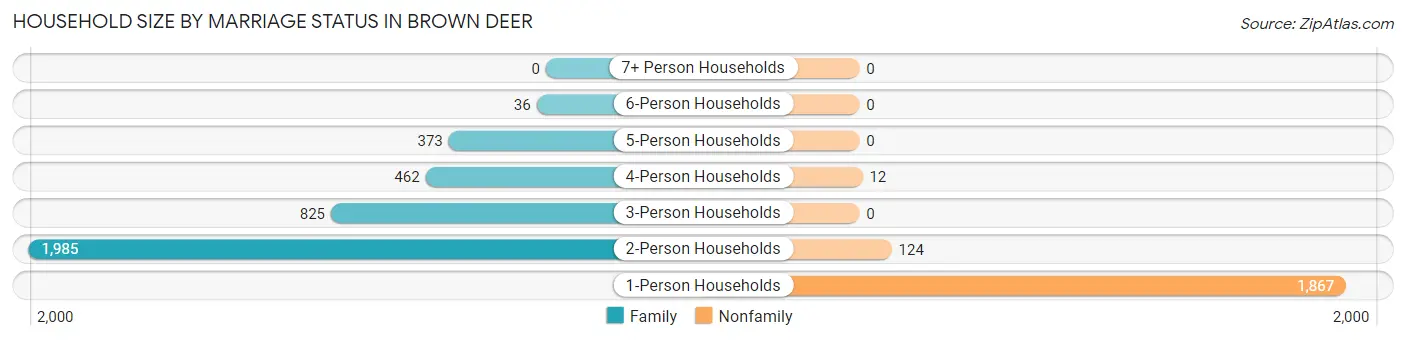
| Household Size | Family Households | Nonfamily Households |
| 1-Person Households | - | 1,867 (32.9%) |
| 2-Person Households | 1,985 (34.9%) | 124 (2.2%) |
| 3-Person Households | 825 (14.5%) | 0 (0.0%) |
| 4-Person Households | 462 (8.1%) | 12 (0.2%) |
| 5-Person Households | 373 (6.6%) | 0 (0.0%) |
| 6-Person Households | 36 (0.6%) | 0 (0.0%) |
| 7+ Person Households | 0 (0.0%) | 0 (0.0%) |
| Total | 3,681 (64.8%) | 2,003 (35.2%) |
Female Fertility in Brown Deer
Fertility by Age in Brown Deer
Average fertility rate in Brown Deer is 33.0 births per 1,000 women. Women in the age bracket of 35 to 50 years have the highest fertility rate with 40.0 births per 1,000 women. Women in the age bracket of 35 to 50 years acount for 60.0% of all women with births.
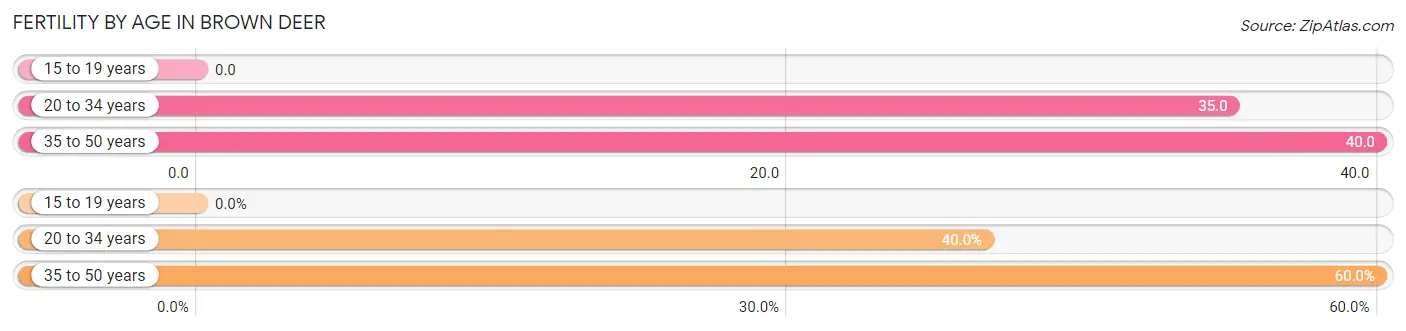
| Age Bracket | Women with Births | Births / 1,000 Women |
| 15 to 19 years | 0 (0.0%) | 0.0 |
| 20 to 34 years | 34 (40.0%) | 35.0 |
| 35 to 50 years | 51 (60.0%) | 40.0 |
| Total | 85 (100.0%) | 33.0 |
Fertility by Age by Marriage Status in Brown Deer
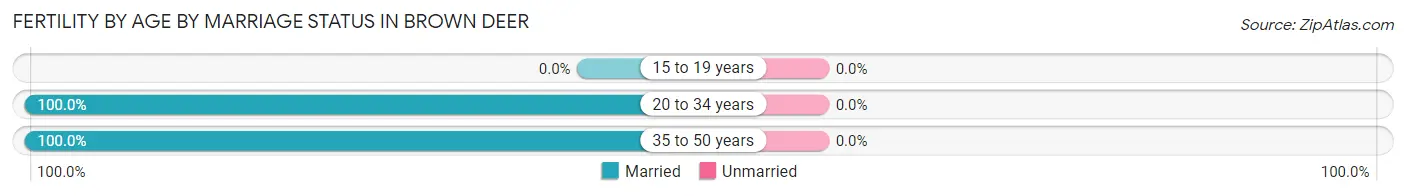
| Age Bracket | Married | Unmarried |
| 15 to 19 years | 0 (0.0%) | 0 (0.0%) |
| 20 to 34 years | 34 (100.0%) | 0 (0.0%) |
| 35 to 50 years | 51 (100.0%) | 0 (0.0%) |
| Total | 85 (100.0%) | 0 (0.0%) |
Fertility by Education in Brown Deer
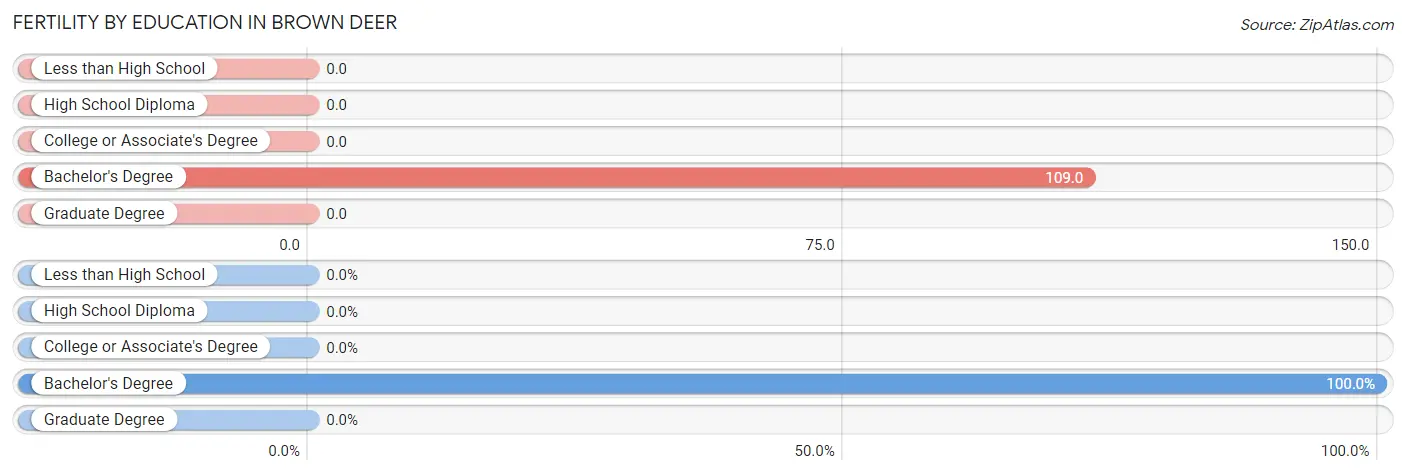
| Educational Attainment | Women with Births | Births / 1,000 Women |
| Less than High School | 0 (0.0%) | 0.0 |
| High School Diploma | 0 (0.0%) | 0.0 |
| College or Associate's Degree | 0 (0.0%) | 0.0 |
| Bachelor's Degree | 85 (100.0%) | 109.0 |
| Graduate Degree | 0 (0.0%) | 0.0 |
| Total | 85 (100.0%) | 33.0 |
Fertility by Education by Marriage Status in Brown Deer
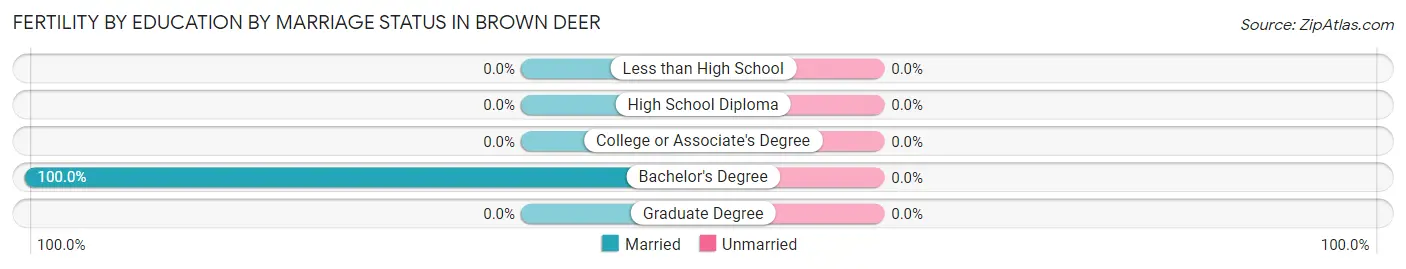
| Educational Attainment | Married | Unmarried |
| Less than High School | 0 (0.0%) | 0 (0.0%) |
| High School Diploma | 0 (0.0%) | 0 (0.0%) |
| College or Associate's Degree | 0 (0.0%) | 0 (0.0%) |
| Bachelor's Degree | 85 (100.0%) | 0 (0.0%) |
| Graduate Degree | 0 (0.0%) | 0 (0.0%) |
| Total | 85 (100.0%) | 0 (0.0%) |
Employment Characteristics in Brown Deer
Employment by Class of Employer in Brown Deer
Among the 6,348 employed individuals in Brown Deer, private company employees (4,286 | 67.5%), not-for-profit organizations (424 | 6.7%), and local government employees (423 | 6.7%) make up the most common classes of employment.
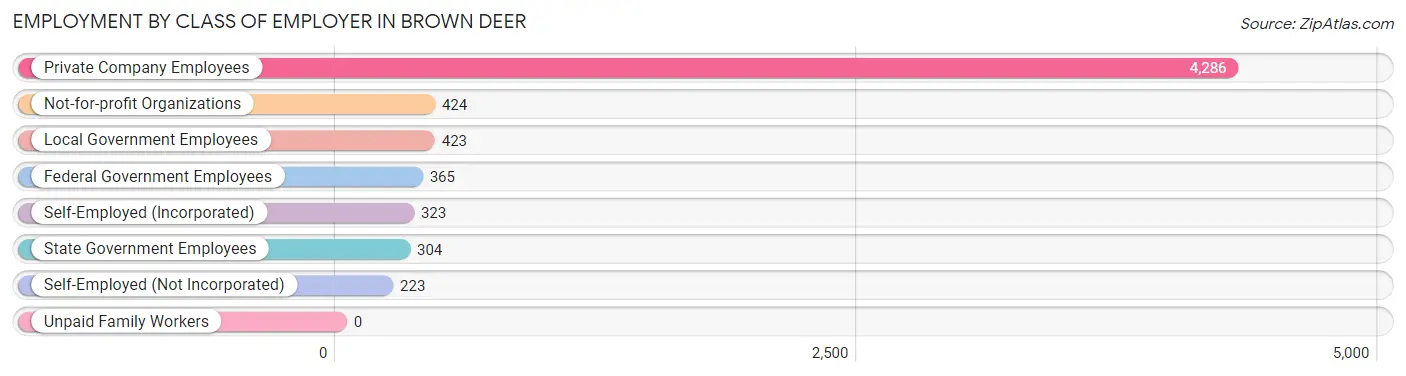
| Employer Class | # Employees | % Employees |
| Private Company Employees | 4,286 | 67.5% |
| Self-Employed (Incorporated) | 323 | 5.1% |
| Self-Employed (Not Incorporated) | 223 | 3.5% |
| Not-for-profit Organizations | 424 | 6.7% |
| Local Government Employees | 423 | 6.7% |
| State Government Employees | 304 | 4.8% |
| Federal Government Employees | 365 | 5.8% |
| Unpaid Family Workers | 0 | 0.0% |
| Total | 6,348 | 100.0% |
Employment Status by Age in Brown Deer
According to the labor force statistics for Brown Deer, out of the total population over 16 years of age (10,463), 63.7% or 6,665 individuals are in the labor force, with 3.8% or 253 of them unemployed. The age group with the highest labor force participation rate is 45 to 54 years, with 90.9% or 1,266 individuals in the labor force. Within the labor force, the 20 to 24 years age range has the highest percentage of unemployed individuals, with 22.7% or 54 of them being unemployed.
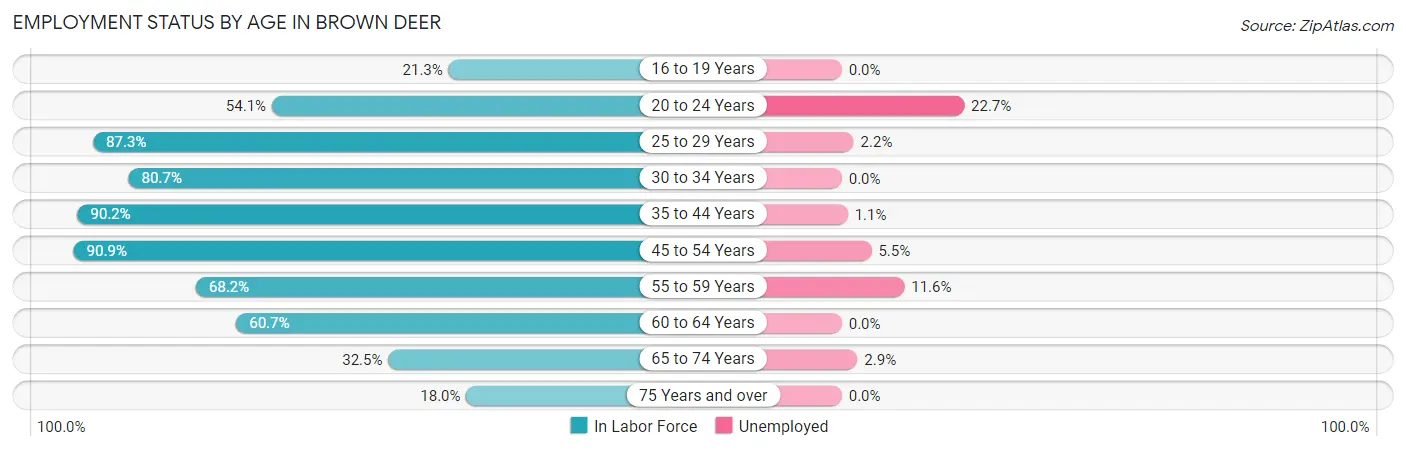
| Age Bracket | In Labor Force | Unemployed |
| 16 to 19 Years | 159 (21.3%) | 0 (0.0%) |
| 20 to 24 Years | 238 (54.1%) | 54 (22.7%) |
| 25 to 29 Years | 1,073 (87.3%) | 24 (2.2%) |
| 30 to 34 Years | 426 (80.7%) | 0 (0.0%) |
| 35 to 44 Years | 1,623 (90.2%) | 18 (1.1%) |
| 45 to 54 Years | 1,266 (90.9%) | 70 (5.5%) |
| 55 to 59 Years | 621 (68.2%) | 72 (11.6%) |
| 60 to 64 Years | 567 (60.7%) | 0 (0.0%) |
| 65 to 74 Years | 550 (32.5%) | 16 (2.9%) |
| 75 Years and over | 143 (18.0%) | 0 (0.0%) |
| Total | 6,665 (63.7%) | 253 (3.8%) |
Employment Status by Educational Attainment in Brown Deer
According to labor force statistics for Brown Deer, 82.1% of individuals (5,578) out of the total population between 25 and 64 years of age (6,794) are in the labor force, with 3.3% or 184 of them being unemployed. The group with the highest labor force participation rate are those with the educational attainment of college / associate degree, with 88.7% or 1,995 individuals in the labor force. Within the labor force, individuals with high school diploma education have the highest percentage of unemployment, with 5.3% or 49 of them being unemployed.
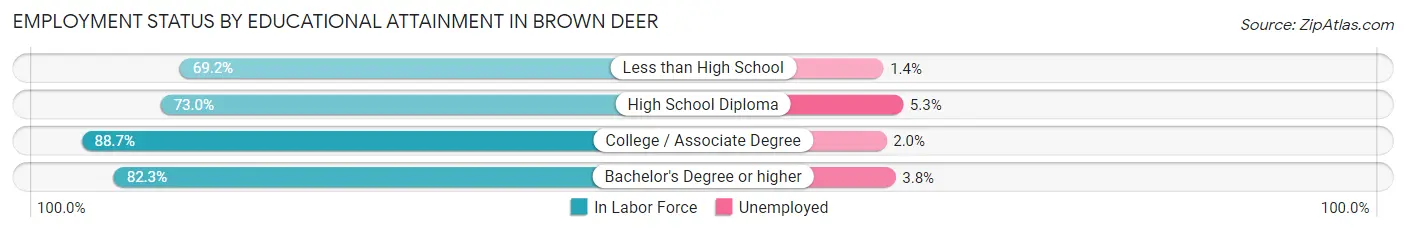
| Educational Attainment | In Labor Force | Unemployed |
| Less than High School | 220 (69.2%) | 4 (1.4%) |
| High School Diploma | 928 (73.0%) | 67 (5.3%) |
| College / Associate Degree | 1,995 (88.7%) | 45 (2.0%) |
| Bachelor's Degree or higher | 2,433 (82.3%) | 112 (3.8%) |
| Total | 5,578 (82.1%) | 224 (3.3%) |
Employment Occupations by Sex in Brown Deer
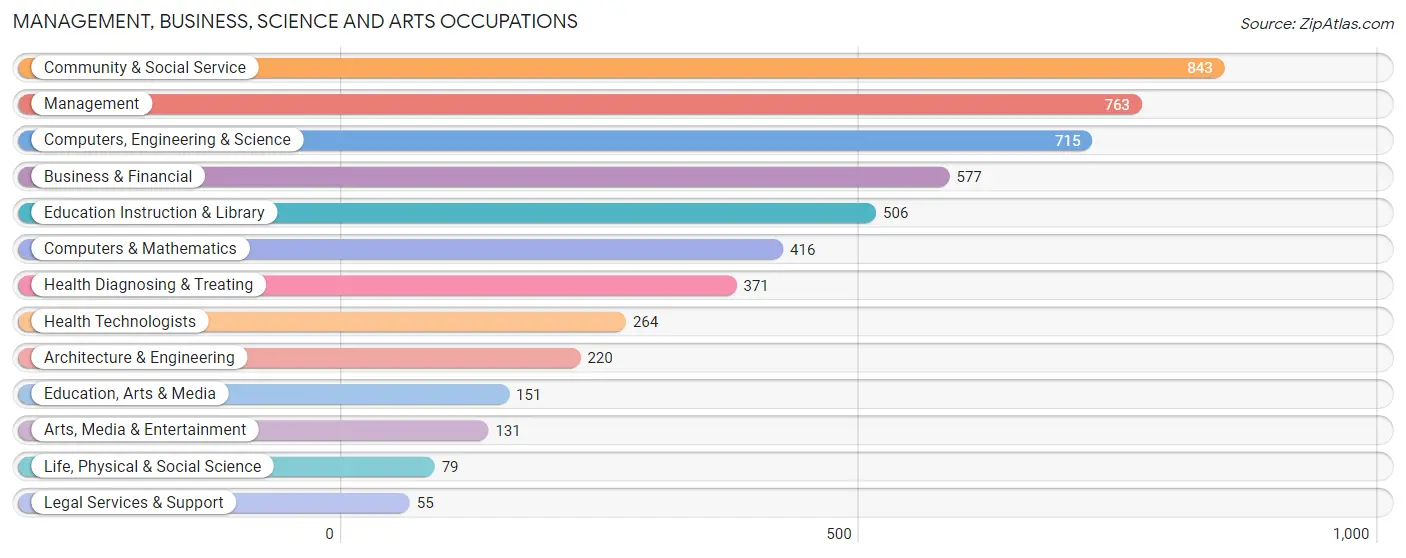
Management, Business, Science and Arts Occupations
The most common Management, Business, Science and Arts occupations in Brown Deer are Community & Social Service (843 | 13.2%), Management (763 | 11.9%), Computers, Engineering & Science (715 | 11.2%), Business & Financial (577 | 9.0%), and Education Instruction & Library (506 | 7.9%).
Management, Business, Science and Arts Occupations by Sex
Within the Management, Business, Science and Arts occupations in Brown Deer, the most male-oriented occupations are Computers & Mathematics (84.6%), Computers, Engineering & Science (79.9%), and Architecture & Engineering (74.6%), while the most female-oriented occupations are Legal Services & Support (100.0%), Health Technologists (78.8%), and Health Diagnosing & Treating (76.3%).
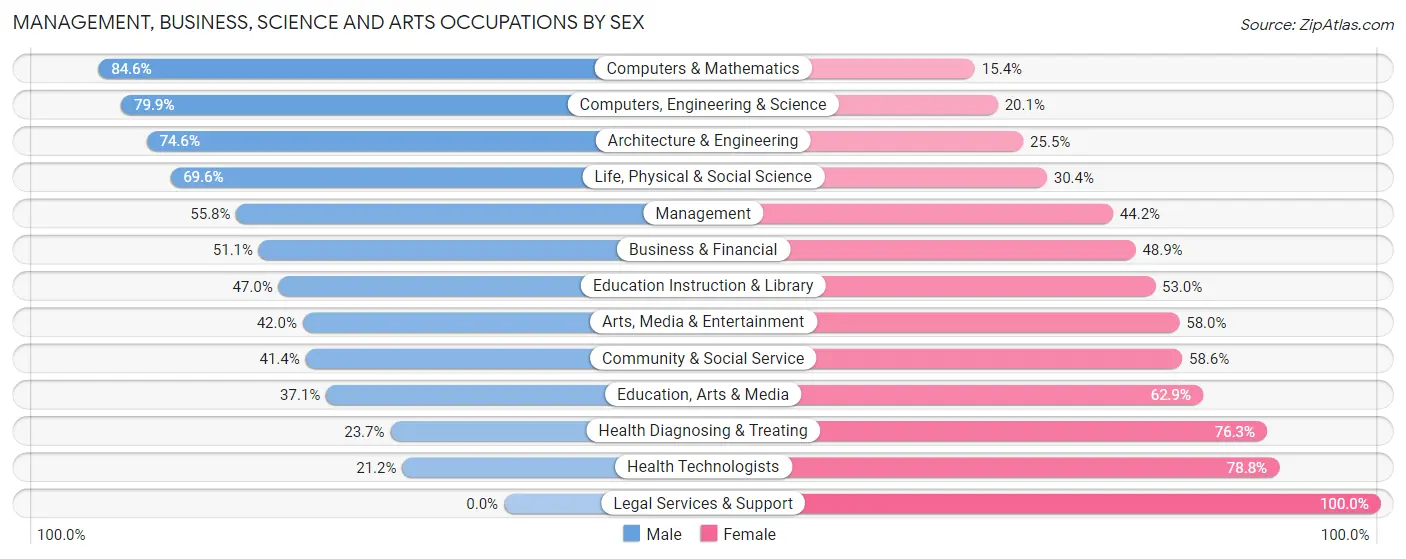
| Occupation | Male | Female |
| Management | 426 (55.8%) | 337 (44.2%) |
| Business & Financial | 295 (51.1%) | 282 (48.9%) |
| Computers, Engineering & Science | 571 (79.9%) | 144 (20.1%) |
| Computers & Mathematics | 352 (84.6%) | 64 (15.4%) |
| Architecture & Engineering | 164 (74.6%) | 56 (25.5%) |
| Life, Physical & Social Science | 55 (69.6%) | 24 (30.4%) |
| Community & Social Service | 349 (41.4%) | 494 (58.6%) |
| Education, Arts & Media | 56 (37.1%) | 95 (62.9%) |
| Legal Services & Support | 0 (0.0%) | 55 (100.0%) |
| Education Instruction & Library | 238 (47.0%) | 268 (53.0%) |
| Arts, Media & Entertainment | 55 (42.0%) | 76 (58.0%) |
| Health Diagnosing & Treating | 88 (23.7%) | 283 (76.3%) |
| Health Technologists | 56 (21.2%) | 208 (78.8%) |
| Total (Category) | 1,729 (52.9%) | 1,540 (47.1%) |
| Total (Overall) | 3,248 (50.7%) | 3,163 (49.3%) |
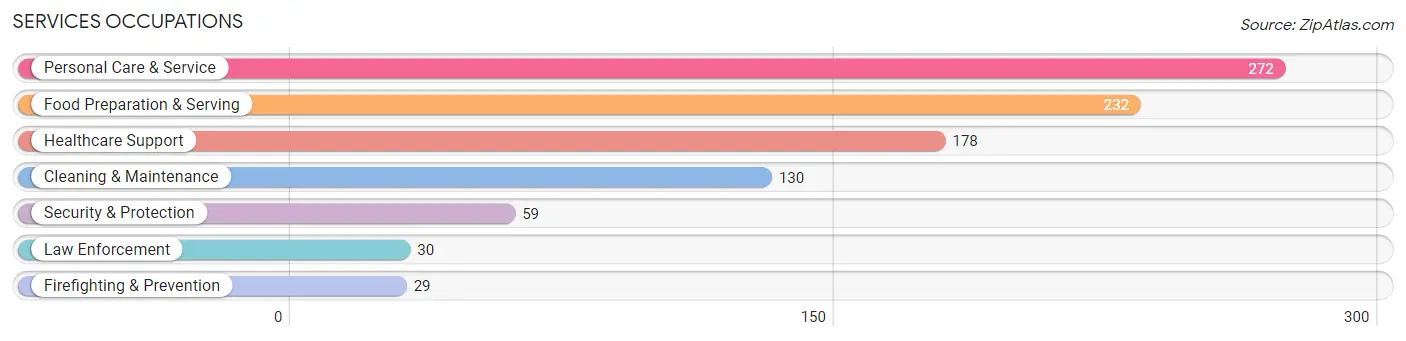
Services Occupations
The most common Services occupations in Brown Deer are Personal Care & Service (272 | 4.2%), Food Preparation & Serving (232 | 3.6%), Healthcare Support (178 | 2.8%), Cleaning & Maintenance (130 | 2.0%), and Security & Protection (59 | 0.9%).
Services Occupations by Sex
Within the Services occupations in Brown Deer, the most male-oriented occupations are Security & Protection (100.0%), Firefighting & Prevention (100.0%), and Law Enforcement (100.0%), while the most female-oriented occupations are Personal Care & Service (97.1%), Healthcare Support (96.1%), and Food Preparation & Serving (53.9%).
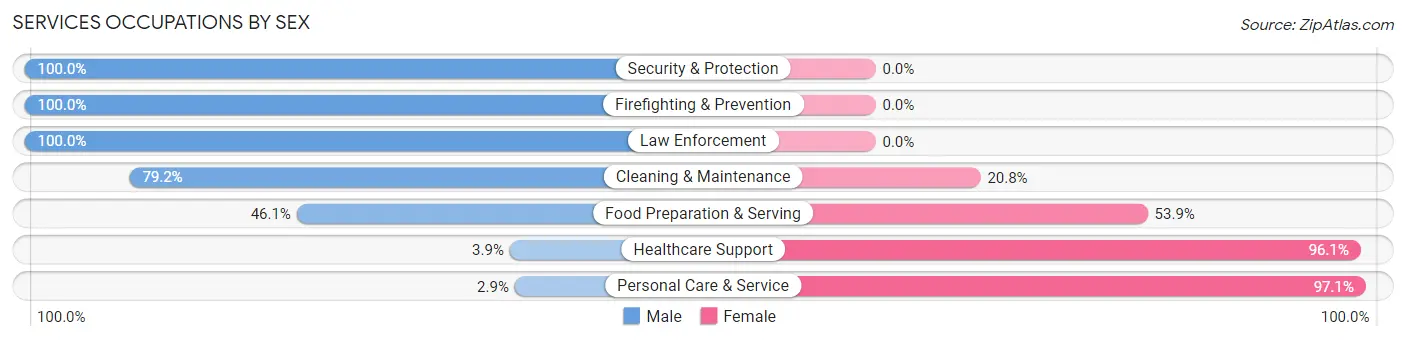
| Occupation | Male | Female |
| Healthcare Support | 7 (3.9%) | 171 (96.1%) |
| Security & Protection | 59 (100.0%) | 0 (0.0%) |
| Firefighting & Prevention | 29 (100.0%) | 0 (0.0%) |
| Law Enforcement | 30 (100.0%) | 0 (0.0%) |
| Food Preparation & Serving | 107 (46.1%) | 125 (53.9%) |
| Cleaning & Maintenance | 103 (79.2%) | 27 (20.8%) |
| Personal Care & Service | 8 (2.9%) | 264 (97.1%) |
| Total (Category) | 284 (32.6%) | 587 (67.4%) |
| Total (Overall) | 3,248 (50.7%) | 3,163 (49.3%) |
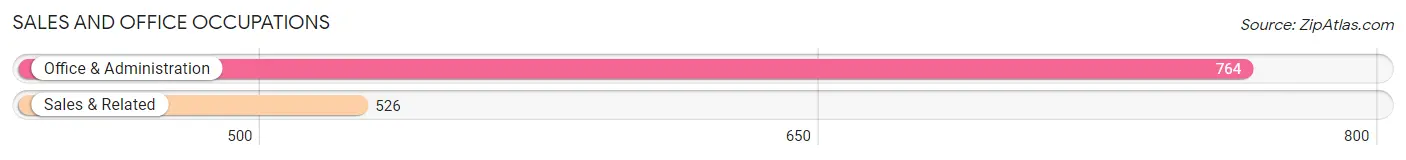
Sales and Office Occupations
The most common Sales and Office occupations in Brown Deer are Office & Administration (764 | 11.9%), and Sales & Related (526 | 8.2%).
Sales and Office Occupations by Sex
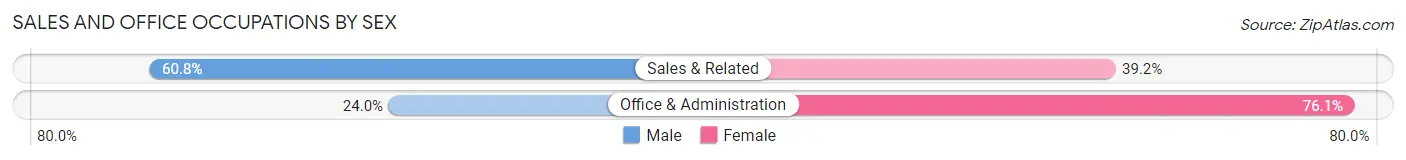
| Occupation | Male | Female |
| Sales & Related | 320 (60.8%) | 206 (39.2%) |
| Office & Administration | 183 (23.9%) | 581 (76.0%) |
| Total (Category) | 503 (39.0%) | 787 (61.0%) |
| Total (Overall) | 3,248 (50.7%) | 3,163 (49.3%) |
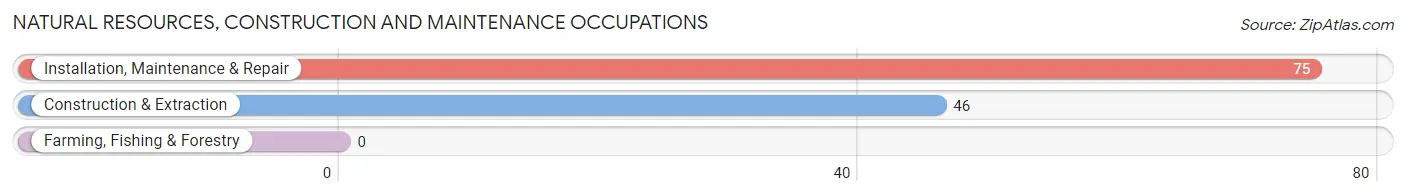
Natural Resources, Construction and Maintenance Occupations
The most common Natural Resources, Construction and Maintenance occupations in Brown Deer are Installation, Maintenance & Repair (75 | 1.2%), and Construction & Extraction (46 | 0.7%).
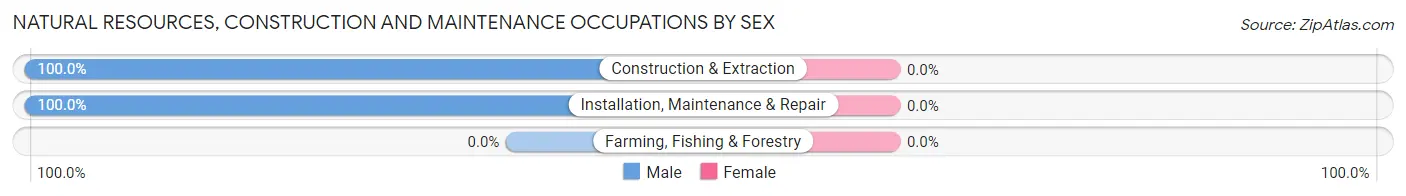
Natural Resources, Construction and Maintenance Occupations by Sex
| Occupation | Male | Female |
| Farming, Fishing & Forestry | 0 (0.0%) | 0 (0.0%) |
| Construction & Extraction | 46 (100.0%) | 0 (0.0%) |
| Installation, Maintenance & Repair | 75 (100.0%) | 0 (0.0%) |
| Total (Category) | 121 (100.0%) | 0 (0.0%) |
| Total (Overall) | 3,248 (50.7%) | 3,163 (49.3%) |
Production, Transportation and Moving Occupations
The most common Production, Transportation and Moving occupations in Brown Deer are Production (452 | 7.0%), Transportation (212 | 3.3%), and Material Moving (196 | 3.1%).
Production, Transportation and Moving Occupations by Sex
| Occupation | Male | Female |
| Production | 212 (46.9%) | 240 (53.1%) |
| Transportation | 203 (95.8%) | 9 (4.3%) |
| Material Moving | 196 (100.0%) | 0 (0.0%) |
| Total (Category) | 611 (71.1%) | 249 (28.9%) |
| Total (Overall) | 3,248 (50.7%) | 3,163 (49.3%) |
Employment Industries by Sex in Brown Deer
Employment Industries in Brown Deer
The major employment industries in Brown Deer include Educational Services (907 | 14.1%), Retail Trade (835 | 13.0%), Health Care & Social Assistance (828 | 12.9%), Manufacturing (824 | 12.9%), and Transportation & Warehousing (657 | 10.2%).
Employment Industries by Sex in Brown Deer
The Brown Deer industries that see more men than women are Construction (100.0%), Administrative & Support (94.3%), and Wholesale Trade (89.5%), whereas the industries that tend to have a higher number of women are Utilities (100.0%), Health Care & Social Assistance (80.3%), and Transportation & Warehousing (65.3%).
| Industry | Male | Female |
| Agriculture, Fishing & Hunting | 0 (0.0%) | 0 (0.0%) |
| Mining, Quarrying, & Extraction | 0 (0.0%) | 0 (0.0%) |
| Construction | 65 (100.0%) | 0 (0.0%) |
| Manufacturing | 538 (65.3%) | 286 (34.7%) |
| Wholesale Trade | 153 (89.5%) | 18 (10.5%) |
| Retail Trade | 558 (66.8%) | 277 (33.2%) |
| Transportation & Warehousing | 228 (34.7%) | 429 (65.3%) |
| Utilities | 0 (0.0%) | 20 (100.0%) |
| Information | 98 (56.7%) | 75 (43.3%) |
| Finance & Insurance | 170 (44.2%) | 215 (55.8%) |
| Real Estate, Rental & Leasing | 41 (48.8%) | 43 (51.2%) |
| Professional & Scientific | 176 (64.9%) | 95 (35.1%) |
| Enterprise Management | 0 (0.0%) | 0 (0.0%) |
| Administrative & Support | 166 (94.3%) | 10 (5.7%) |
| Educational Services | 485 (53.5%) | 422 (46.5%) |
| Health Care & Social Assistance | 163 (19.7%) | 665 (80.3%) |
| Arts, Entertainment & Recreation | 91 (37.6%) | 151 (62.4%) |
| Accommodation & Food Services | 131 (44.6%) | 163 (55.4%) |
| Public Administration | 136 (56.2%) | 106 (43.8%) |
| Total | 3,248 (50.7%) | 3,163 (49.3%) |
Education in Brown Deer
School Enrollment in Brown Deer
The most common levels of schooling among the 2,830 students in Brown Deer are middle school (711 | 25.1%), high school (626 | 22.1%), and college / undergraduate (510 | 18.0%).
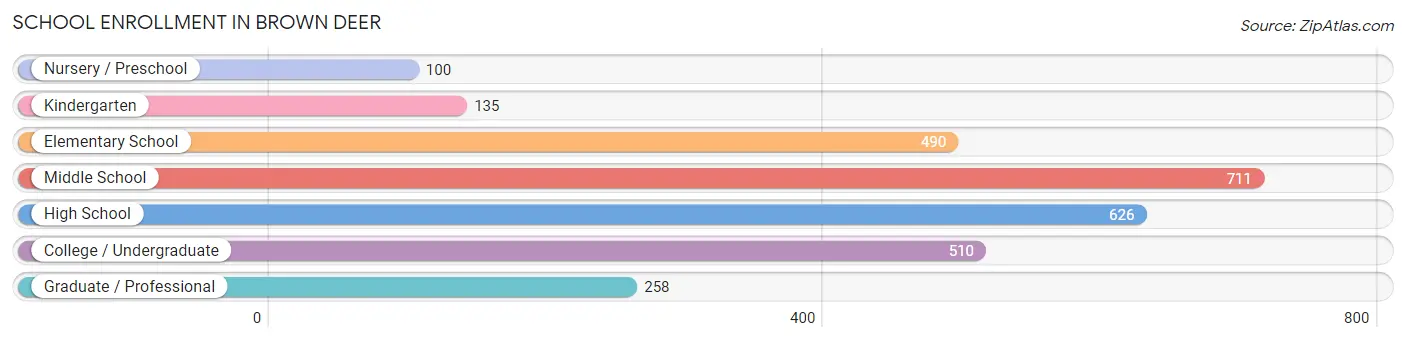
| School Level | # Students | % Students |
| Nursery / Preschool | 100 | 3.5% |
| Kindergarten | 135 | 4.8% |
| Elementary School | 490 | 17.3% |
| Middle School | 711 | 25.1% |
| High School | 626 | 22.1% |
| College / Undergraduate | 510 | 18.0% |
| Graduate / Professional | 258 | 9.1% |
| Total | 2,830 | 100.0% |
School Enrollment by Age by Funding Source in Brown Deer
Out of a total of 2,830 students who are enrolled in schools in Brown Deer, 812 (28.7%) attend a private institution, while the remaining 2,018 (71.3%) are enrolled in public schools. The age group of 20 to 24 year olds has the highest likelihood of being enrolled in private schools, with 169 (100.0% in the age bracket) enrolled. Conversely, the age group of 18 to 19 year olds has the lowest likelihood of being enrolled in a private school, with 250 (98.0% in the age bracket) attending a public institution.
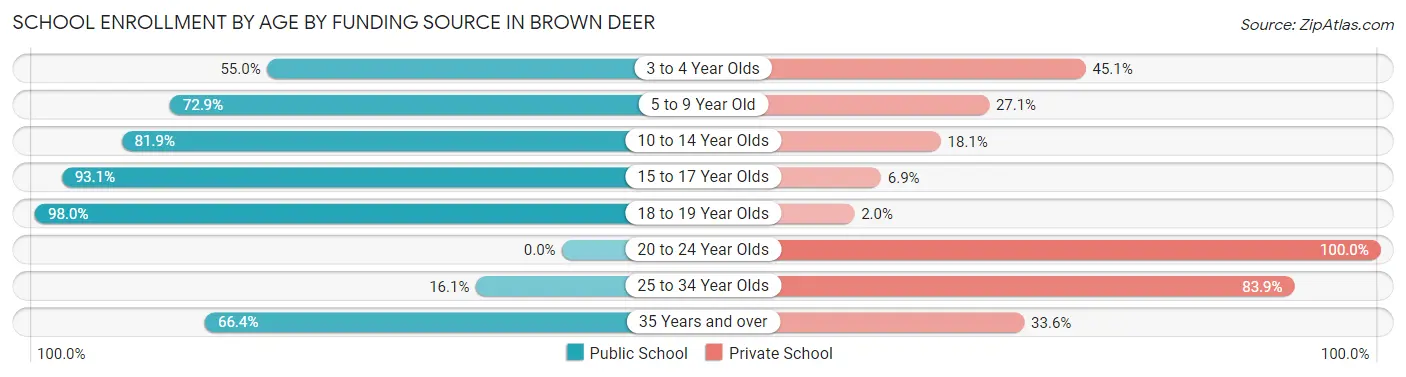
| Age Bracket | Public School | Private School |
| 3 to 4 Year Olds | 50 (54.9%) | 41 (45.1%) |
| 5 to 9 Year Old | 442 (72.9%) | 164 (27.1%) |
| 10 to 14 Year Olds | 617 (81.9%) | 136 (18.1%) |
| 15 to 17 Year Olds | 471 (93.1%) | 35 (6.9%) |
| 18 to 19 Year Olds | 250 (98.0%) | 5 (2.0%) |
| 20 to 24 Year Olds | 0 (0.0%) | 169 (100.0%) |
| 25 to 34 Year Olds | 35 (16.1%) | 183 (83.9%) |
| 35 Years and over | 154 (66.4%) | 78 (33.6%) |
| Total | 2,018 (71.3%) | 812 (28.7%) |
Educational Attainment by Field of Study in Brown Deer
Business (810 | 20.5%), science & technology (565 | 14.3%), education (394 | 10.0%), social sciences (377 | 9.6%), and arts & humanities (281 | 7.1%) are the most common fields of study among 3,947 individuals in Brown Deer who have obtained a bachelor's degree or higher.
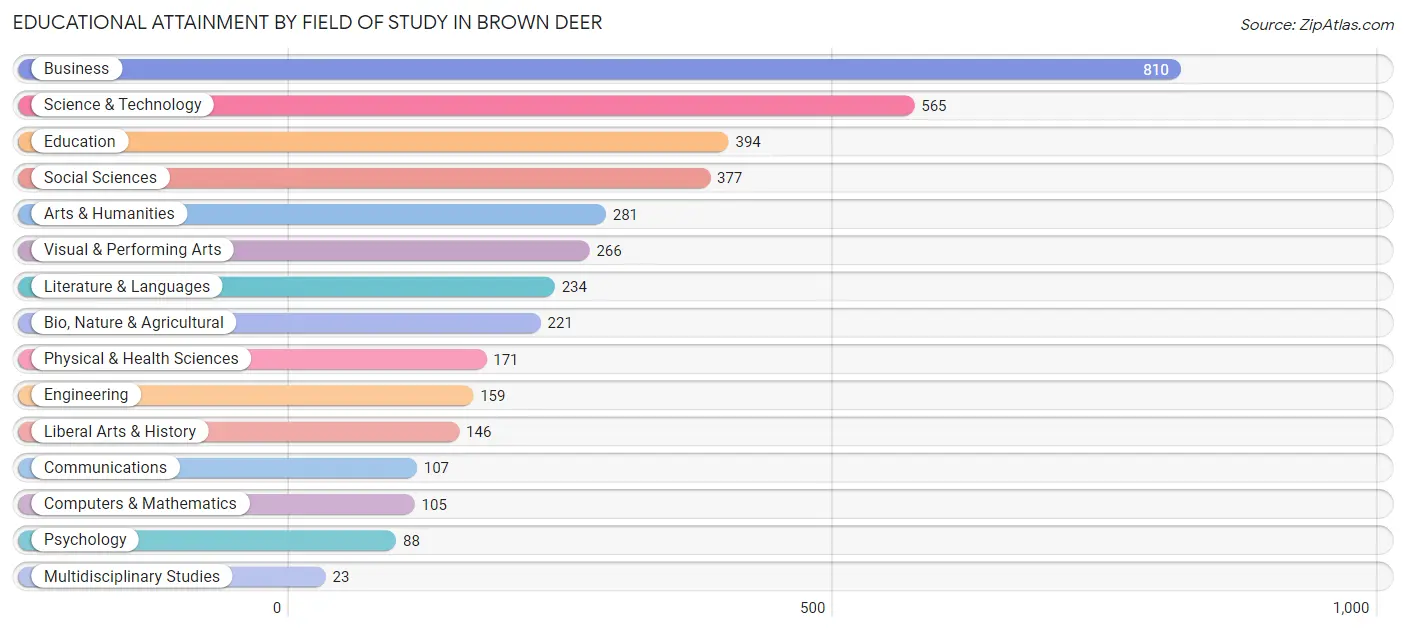
| Field of Study | # Graduates | % Graduates |
| Computers & Mathematics | 105 | 2.7% |
| Bio, Nature & Agricultural | 221 | 5.6% |
| Physical & Health Sciences | 171 | 4.3% |
| Psychology | 88 | 2.2% |
| Social Sciences | 377 | 9.6% |
| Engineering | 159 | 4.0% |
| Multidisciplinary Studies | 23 | 0.6% |
| Science & Technology | 565 | 14.3% |
| Business | 810 | 20.5% |
| Education | 394 | 10.0% |
| Literature & Languages | 234 | 5.9% |
| Liberal Arts & History | 146 | 3.7% |
| Visual & Performing Arts | 266 | 6.7% |
| Communications | 107 | 2.7% |
| Arts & Humanities | 281 | 7.1% |
| Total | 3,947 | 100.0% |
Transportation & Commute in Brown Deer
Vehicle Availability by Sex in Brown Deer
The most prevalent vehicle ownership categories in Brown Deer are males with 2 vehicles (1,773, accounting for 55.2%) and females with 2 vehicles (1,598, making up 56.5%).
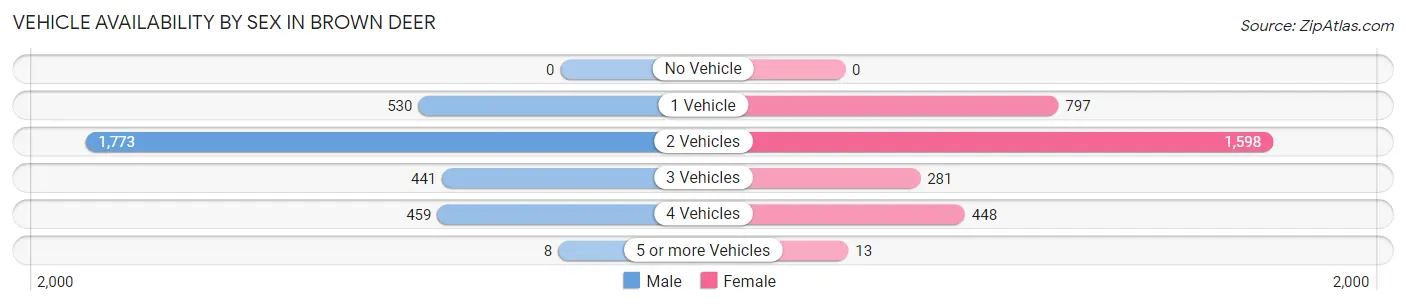
| Vehicles Available | Male | Female |
| No Vehicle | 0 (0.0%) | 0 (0.0%) |
| 1 Vehicle | 530 (16.5%) | 797 (25.4%) |
| 2 Vehicles | 1,773 (55.2%) | 1,598 (50.9%) |
| 3 Vehicles | 441 (13.7%) | 281 (9.0%) |
| 4 Vehicles | 459 (14.3%) | 448 (14.3%) |
| 5 or more Vehicles | 8 (0.3%) | 13 (0.4%) |
| Total | 3,211 (100.0%) | 3,137 (100.0%) |
Commute Time in Brown Deer
The most frequently occuring commute durations in Brown Deer are 15 to 19 minutes (1,321 commuters, 25.2%), 20 to 24 minutes (942 commuters, 18.0%), and 30 to 34 minutes (735 commuters, 14.0%).
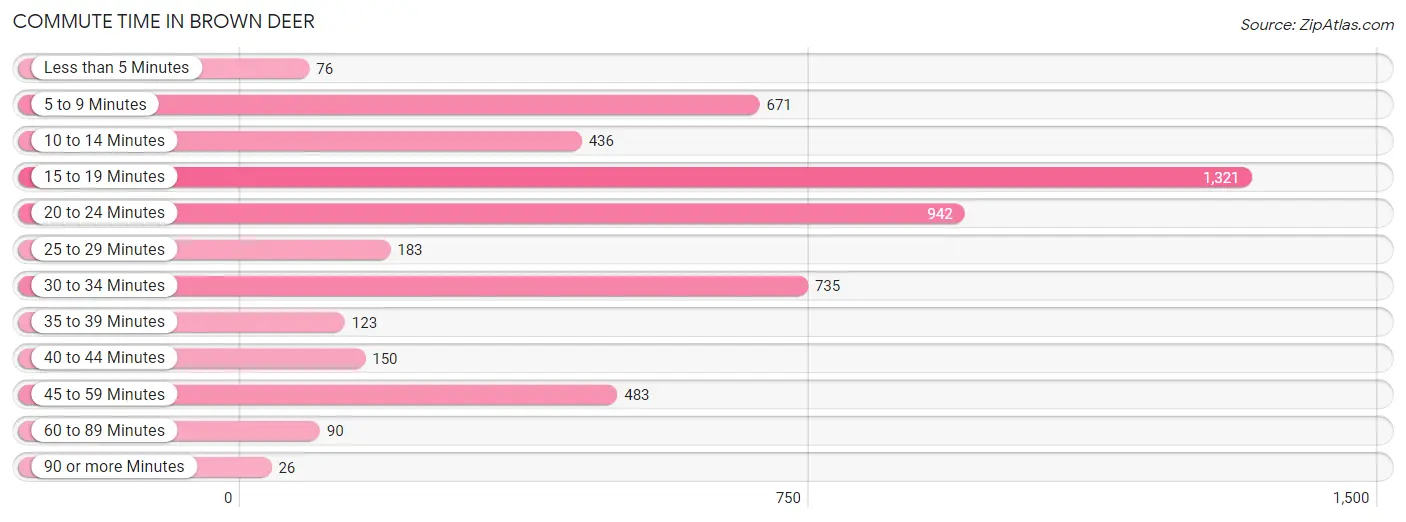
| Commute Time | # Commuters | % Commuters |
| Less than 5 Minutes | 76 | 1.5% |
| 5 to 9 Minutes | 671 | 12.8% |
| 10 to 14 Minutes | 436 | 8.3% |
| 15 to 19 Minutes | 1,321 | 25.2% |
| 20 to 24 Minutes | 942 | 18.0% |
| 25 to 29 Minutes | 183 | 3.5% |
| 30 to 34 Minutes | 735 | 14.0% |
| 35 to 39 Minutes | 123 | 2.4% |
| 40 to 44 Minutes | 150 | 2.9% |
| 45 to 59 Minutes | 483 | 9.2% |
| 60 to 89 Minutes | 90 | 1.7% |
| 90 or more Minutes | 26 | 0.5% |
Commute Time by Sex in Brown Deer
The most common commute times in Brown Deer are 15 to 19 minutes (665 commuters, 24.8%) for males and 15 to 19 minutes (656 commuters, 25.7%) for females.
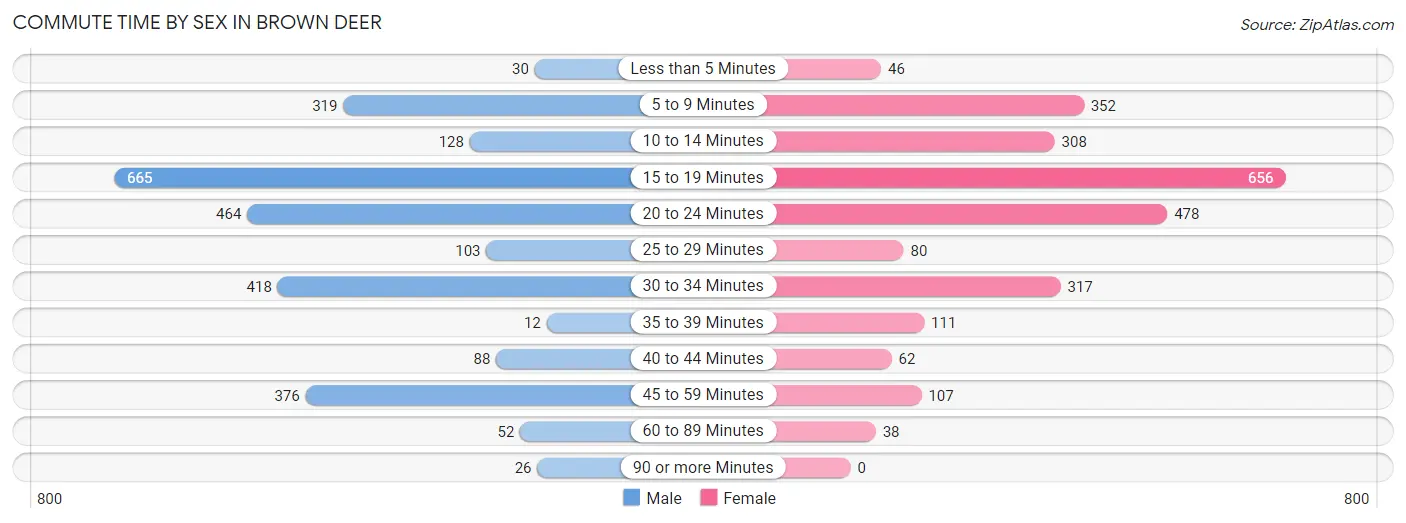
| Commute Time | Male | Female |
| Less than 5 Minutes | 30 (1.1%) | 46 (1.8%) |
| 5 to 9 Minutes | 319 (11.9%) | 352 (13.8%) |
| 10 to 14 Minutes | 128 (4.8%) | 308 (12.0%) |
| 15 to 19 Minutes | 665 (24.8%) | 656 (25.7%) |
| 20 to 24 Minutes | 464 (17.3%) | 478 (18.7%) |
| 25 to 29 Minutes | 103 (3.8%) | 80 (3.1%) |
| 30 to 34 Minutes | 418 (15.6%) | 317 (12.4%) |
| 35 to 39 Minutes | 12 (0.4%) | 111 (4.3%) |
| 40 to 44 Minutes | 88 (3.3%) | 62 (2.4%) |
| 45 to 59 Minutes | 376 (14.0%) | 107 (4.2%) |
| 60 to 89 Minutes | 52 (1.9%) | 38 (1.5%) |
| 90 or more Minutes | 26 (1.0%) | 0 (0.0%) |
Time of Departure to Work by Sex in Brown Deer
The most frequent times of departure to work in Brown Deer are 8:00 AM to 8:29 AM (484, 18.0%) for males and 12:00 PM to 3:59 PM (425, 16.6%) for females.
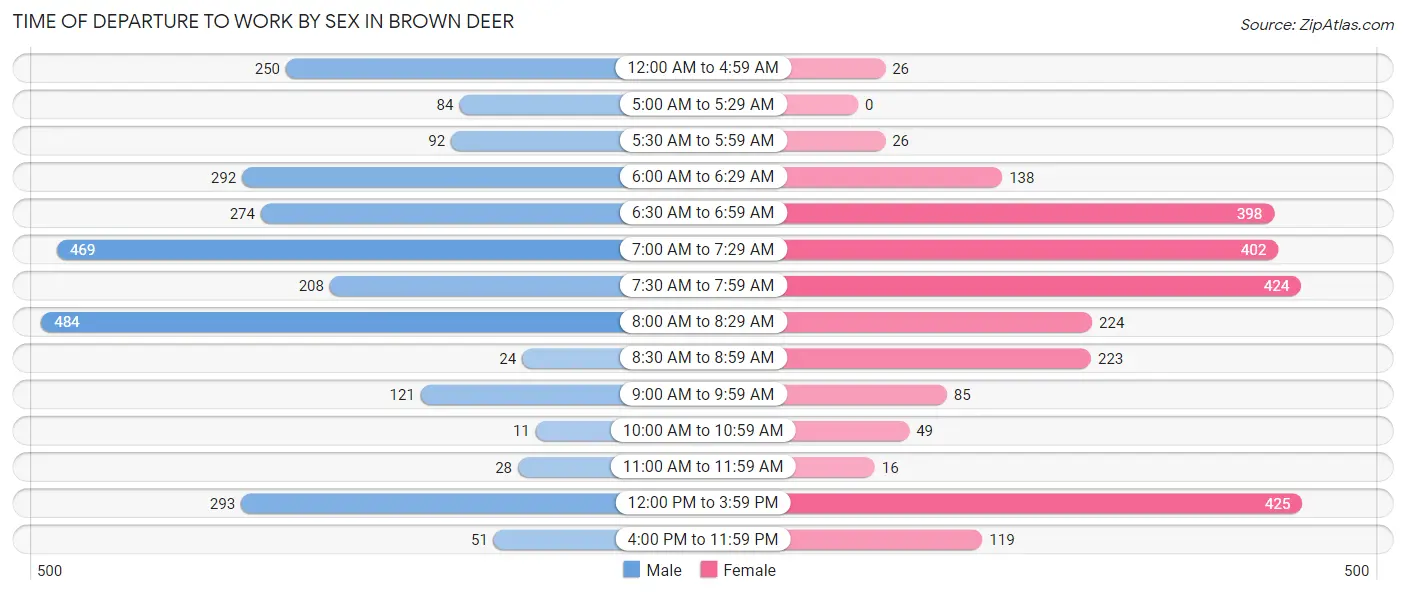
| Time of Departure | Male | Female |
| 12:00 AM to 4:59 AM | 250 (9.3%) | 26 (1.0%) |
| 5:00 AM to 5:29 AM | 84 (3.1%) | 0 (0.0%) |
| 5:30 AM to 5:59 AM | 92 (3.4%) | 26 (1.0%) |
| 6:00 AM to 6:29 AM | 292 (10.9%) | 138 (5.4%) |
| 6:30 AM to 6:59 AM | 274 (10.2%) | 398 (15.6%) |
| 7:00 AM to 7:29 AM | 469 (17.5%) | 402 (15.7%) |
| 7:30 AM to 7:59 AM | 208 (7.8%) | 424 (16.6%) |
| 8:00 AM to 8:29 AM | 484 (18.0%) | 224 (8.8%) |
| 8:30 AM to 8:59 AM | 24 (0.9%) | 223 (8.7%) |
| 9:00 AM to 9:59 AM | 121 (4.5%) | 85 (3.3%) |
| 10:00 AM to 10:59 AM | 11 (0.4%) | 49 (1.9%) |
| 11:00 AM to 11:59 AM | 28 (1.0%) | 16 (0.6%) |
| 12:00 PM to 3:59 PM | 293 (10.9%) | 425 (16.6%) |
| 4:00 PM to 11:59 PM | 51 (1.9%) | 119 (4.7%) |
| Total | 2,681 (100.0%) | 2,555 (100.0%) |
Housing Occupancy in Brown Deer
Occupancy by Ownership in Brown Deer
Of the total 5,684 dwellings in Brown Deer, owner-occupied units account for 3,740 (65.8%), while renter-occupied units make up 1,944 (34.2%).
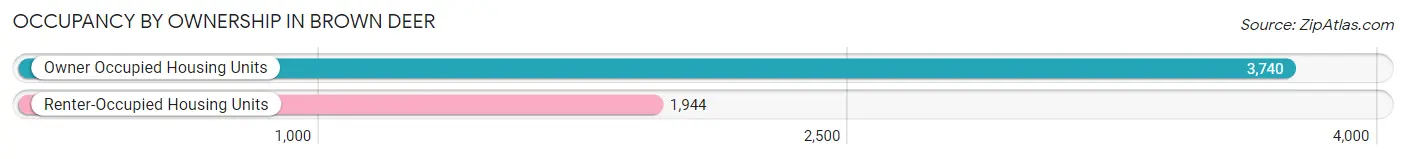
| Occupancy | # Housing Units | % Housing Units |
| Owner Occupied Housing Units | 3,740 | 65.8% |
| Renter-Occupied Housing Units | 1,944 | 34.2% |
| Total Occupied Housing Units | 5,684 | 100.0% |
Occupancy by Household Size in Brown Deer
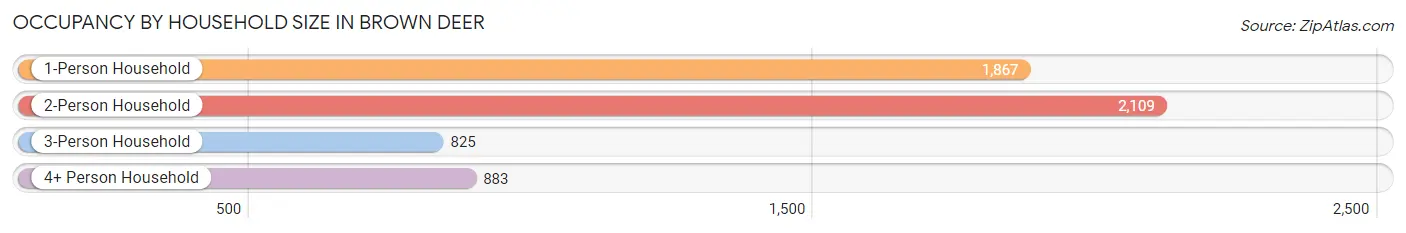
| Household Size | # Housing Units | % Housing Units |
| 1-Person Household | 1,867 | 32.9% |
| 2-Person Household | 2,109 | 37.1% |
| 3-Person Household | 825 | 14.5% |
| 4+ Person Household | 883 | 15.5% |
| Total Housing Units | 5,684 | 100.0% |
Occupancy by Ownership by Household Size in Brown Deer
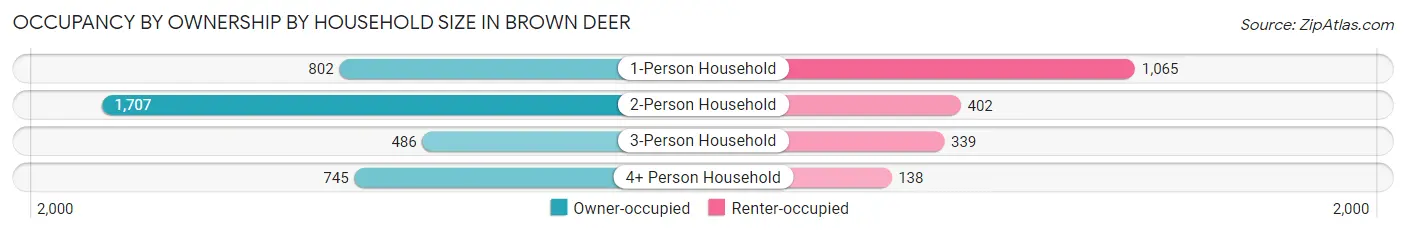
| Household Size | Owner-occupied | Renter-occupied |
| 1-Person Household | 802 (43.0%) | 1,065 (57.0%) |
| 2-Person Household | 1,707 (80.9%) | 402 (19.1%) |
| 3-Person Household | 486 (58.9%) | 339 (41.1%) |
| 4+ Person Household | 745 (84.4%) | 138 (15.6%) |
| Total Housing Units | 3,740 (65.8%) | 1,944 (34.2%) |
Occupancy by Educational Attainment in Brown Deer
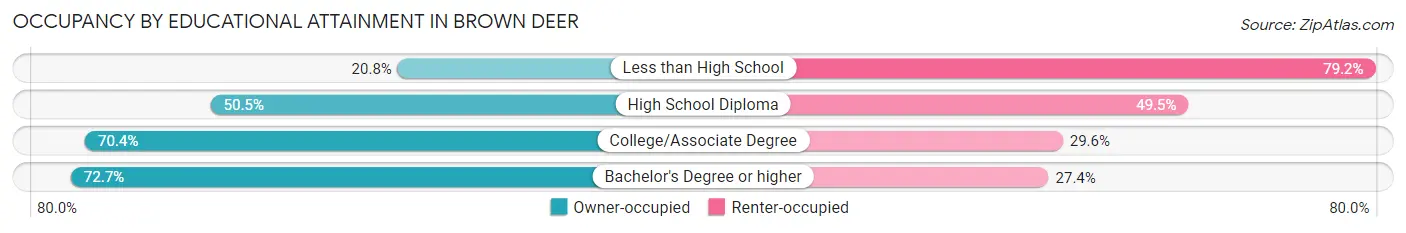
| Household Size | Owner-occupied | Renter-occupied |
| Less than High School | 30 (20.8%) | 114 (79.2%) |
| High School Diploma | 615 (50.5%) | 603 (49.5%) |
| College/Associate Degree | 1,403 (70.4%) | 590 (29.6%) |
| Bachelor's Degree or higher | 1,692 (72.7%) | 637 (27.4%) |
Occupancy by Age of Householder in Brown Deer
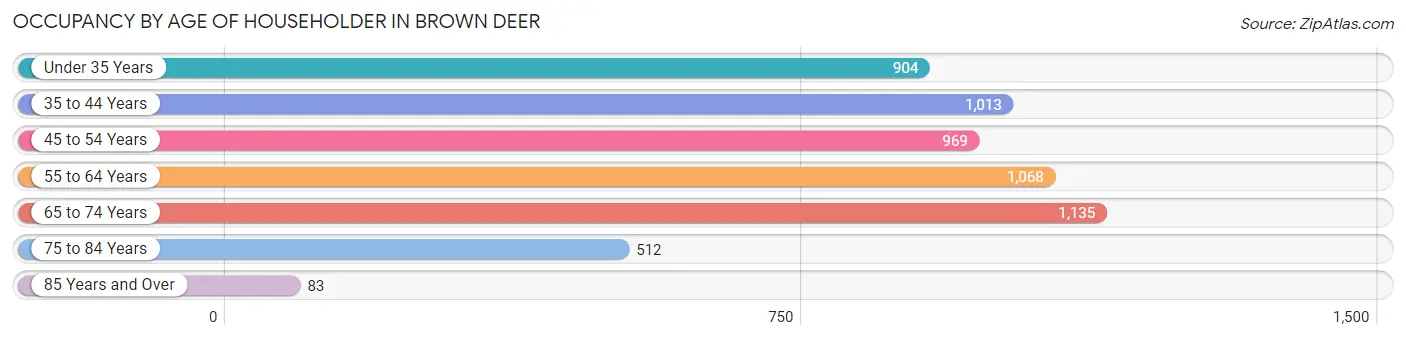
| Age Bracket | # Households | % Households |
| Under 35 Years | 904 | 15.9% |
| 35 to 44 Years | 1,013 | 17.8% |
| 45 to 54 Years | 969 | 17.1% |
| 55 to 64 Years | 1,068 | 18.8% |
| 65 to 74 Years | 1,135 | 20.0% |
| 75 to 84 Years | 512 | 9.0% |
| 85 Years and Over | 83 | 1.5% |
| Total | 5,684 | 100.0% |
Housing Finances in Brown Deer
Median Income by Occupancy in Brown Deer
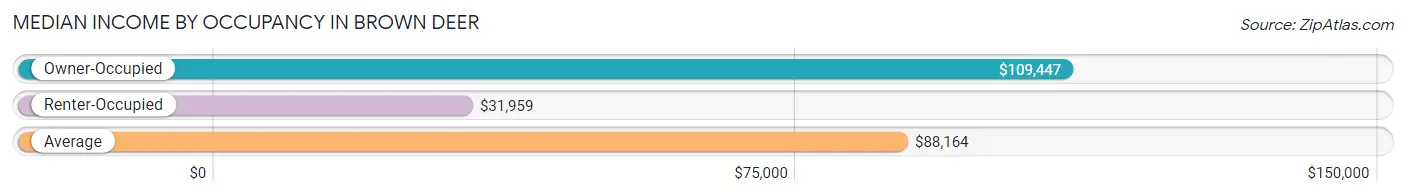
| Occupancy Type | # Households | Median Income |
| Owner-Occupied | 3,740 (65.8%) | $109,447 |
| Renter-Occupied | 1,944 (34.2%) | $31,959 |
| Average | 5,684 (100.0%) | $88,164 |
Occupancy by Householder Income Bracket in Brown Deer
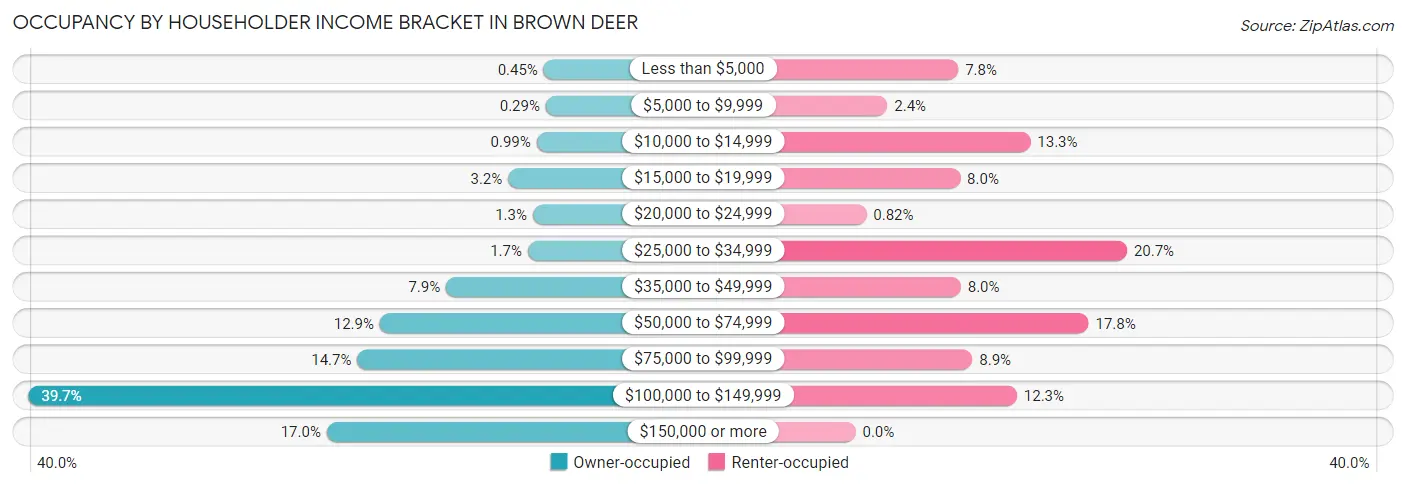
| Income Bracket | Owner-occupied | Renter-occupied |
| Less than $5,000 | 17 (0.4%) | 152 (7.8%) |
| $5,000 to $9,999 | 11 (0.3%) | 47 (2.4%) |
| $10,000 to $14,999 | 37 (1.0%) | 259 (13.3%) |
| $15,000 to $19,999 | 118 (3.2%) | 155 (8.0%) |
| $20,000 to $24,999 | 48 (1.3%) | 16 (0.8%) |
| $25,000 to $34,999 | 62 (1.7%) | 402 (20.7%) |
| $35,000 to $49,999 | 295 (7.9%) | 156 (8.0%) |
| $50,000 to $74,999 | 484 (12.9%) | 345 (17.7%) |
| $75,000 to $99,999 | 548 (14.6%) | 173 (8.9%) |
| $100,000 to $149,999 | 1,485 (39.7%) | 239 (12.3%) |
| $150,000 or more | 635 (17.0%) | 0 (0.0%) |
| Total | 3,740 (100.0%) | 1,944 (100.0%) |
Monthly Housing Cost Tiers in Brown Deer
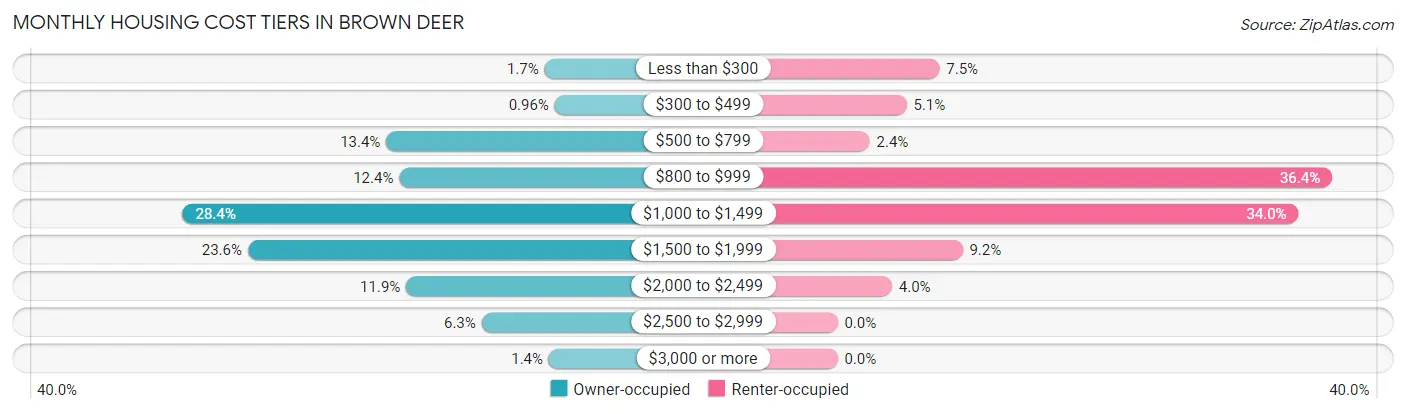
| Monthly Cost | Owner-occupied | Renter-occupied |
| Less than $300 | 64 (1.7%) | 146 (7.5%) |
| $300 to $499 | 36 (1.0%) | 99 (5.1%) |
| $500 to $799 | 500 (13.4%) | 46 (2.4%) |
| $800 to $999 | 464 (12.4%) | 708 (36.4%) |
| $1,000 to $1,499 | 1,061 (28.4%) | 660 (34.0%) |
| $1,500 to $1,999 | 881 (23.6%) | 179 (9.2%) |
| $2,000 to $2,499 | 445 (11.9%) | 78 (4.0%) |
| $2,500 to $2,999 | 237 (6.3%) | 0 (0.0%) |
| $3,000 or more | 52 (1.4%) | 0 (0.0%) |
| Total | 3,740 (100.0%) | 1,944 (100.0%) |
Physical Housing Characteristics in Brown Deer
Housing Structures in Brown Deer
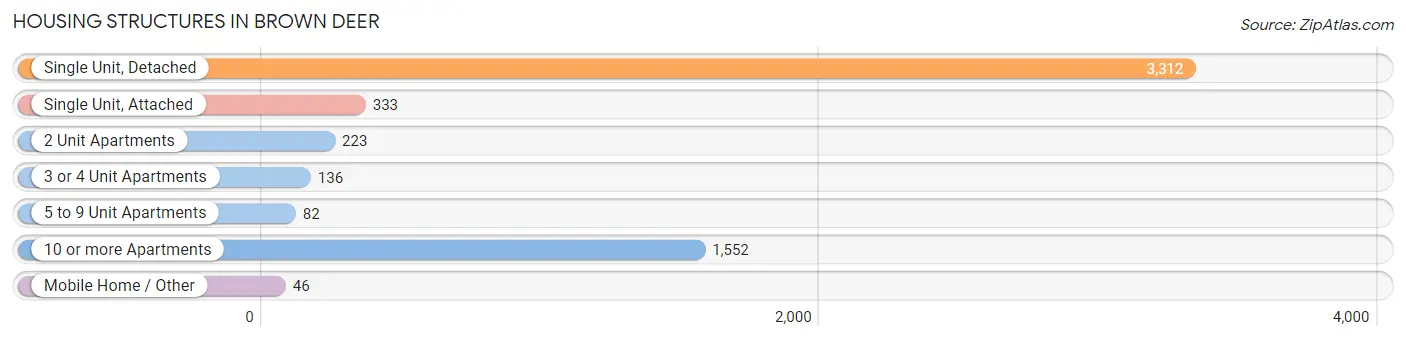
| Structure Type | # Housing Units | % Housing Units |
| Single Unit, Detached | 3,312 | 58.3% |
| Single Unit, Attached | 333 | 5.9% |
| 2 Unit Apartments | 223 | 3.9% |
| 3 or 4 Unit Apartments | 136 | 2.4% |
| 5 to 9 Unit Apartments | 82 | 1.4% |
| 10 or more Apartments | 1,552 | 27.3% |
| Mobile Home / Other | 46 | 0.8% |
| Total | 5,684 | 100.0% |
Housing Structures by Occupancy in Brown Deer
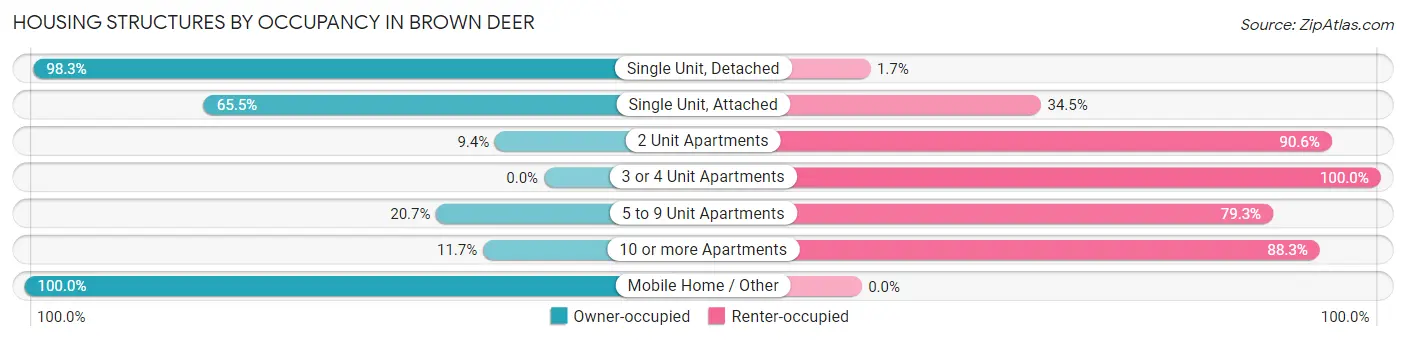
| Structure Type | Owner-occupied | Renter-occupied |
| Single Unit, Detached | 3,256 (98.3%) | 56 (1.7%) |
| Single Unit, Attached | 218 (65.5%) | 115 (34.5%) |
| 2 Unit Apartments | 21 (9.4%) | 202 (90.6%) |
| 3 or 4 Unit Apartments | 0 (0.0%) | 136 (100.0%) |
| 5 to 9 Unit Apartments | 17 (20.7%) | 65 (79.3%) |
| 10 or more Apartments | 182 (11.7%) | 1,370 (88.3%) |
| Mobile Home / Other | 46 (100.0%) | 0 (0.0%) |
| Total | 3,740 (65.8%) | 1,944 (34.2%) |
Housing Structures by Number of Rooms in Brown Deer
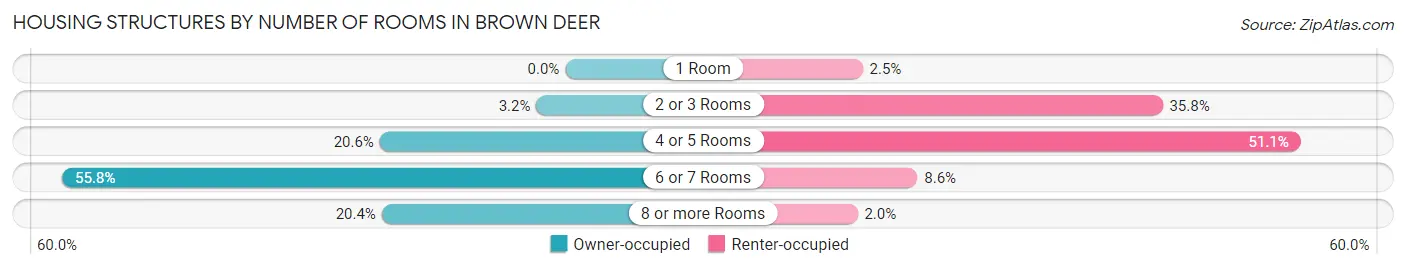
| Number of Rooms | Owner-occupied | Renter-occupied |
| 1 Room | 0 (0.0%) | 49 (2.5%) |
| 2 or 3 Rooms | 120 (3.2%) | 696 (35.8%) |
| 4 or 5 Rooms | 770 (20.6%) | 994 (51.1%) |
| 6 or 7 Rooms | 2,088 (55.8%) | 167 (8.6%) |
| 8 or more Rooms | 762 (20.4%) | 38 (1.9%) |
| Total | 3,740 (100.0%) | 1,944 (100.0%) |
Housing Structure by Heating Type in Brown Deer
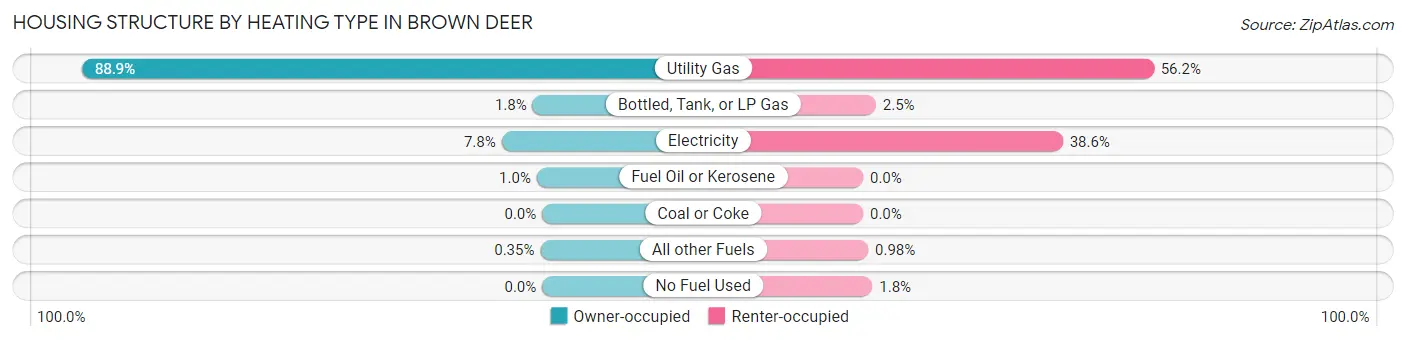
| Heating Type | Owner-occupied | Renter-occupied |
| Utility Gas | 3,326 (88.9%) | 1,092 (56.2%) |
| Bottled, Tank, or LP Gas | 69 (1.8%) | 48 (2.5%) |
| Electricity | 293 (7.8%) | 750 (38.6%) |
| Fuel Oil or Kerosene | 39 (1.0%) | 0 (0.0%) |
| Coal or Coke | 0 (0.0%) | 0 (0.0%) |
| All other Fuels | 13 (0.4%) | 19 (1.0%) |
| No Fuel Used | 0 (0.0%) | 35 (1.8%) |
| Total | 3,740 (100.0%) | 1,944 (100.0%) |
Household Vehicle Usage in Brown Deer
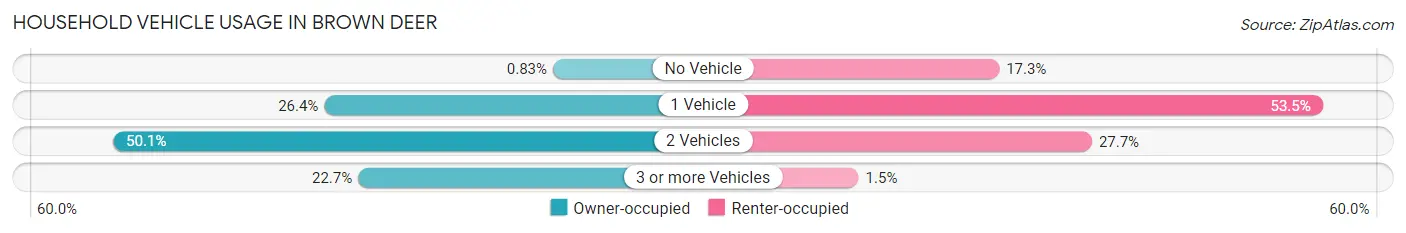
| Vehicles per Household | Owner-occupied | Renter-occupied |
| No Vehicle | 31 (0.8%) | 336 (17.3%) |
| 1 Vehicle | 989 (26.4%) | 1,040 (53.5%) |
| 2 Vehicles | 1,873 (50.1%) | 538 (27.7%) |
| 3 or more Vehicles | 847 (22.7%) | 30 (1.5%) |
| Total | 3,740 (100.0%) | 1,944 (100.0%) |
Real Estate & Mortgages in Brown Deer
Real Estate and Mortgage Overview in Brown Deer
| Characteristic | Without Mortgage | With Mortgage |
| Housing Units | 1,013 | 2,727 |
| Median Property Value | $203,200 | $209,300 |
| Median Household Income | $74,102 | $529 |
| Monthly Housing Costs | $690 | $52 |
| Real Estate Taxes | $4,143 | $11 |
Property Value by Mortgage Status in Brown Deer
| Property Value | Without Mortgage | With Mortgage |
| Less than $50,000 | 113 (11.2%) | 55 (2.0%) |
| $50,000 to $99,999 | 129 (12.7%) | 131 (4.8%) |
| $100,000 to $299,999 | 698 (68.9%) | 2,112 (77.4%) |
| $300,000 to $499,999 | 73 (7.2%) | 429 (15.7%) |
| $500,000 to $749,999 | 0 (0.0%) | 0 (0.0%) |
| $750,000 to $999,999 | 0 (0.0%) | 0 (0.0%) |
| $1,000,000 or more | 0 (0.0%) | 0 (0.0%) |
| Total | 1,013 (100.0%) | 2,727 (100.0%) |
Household Income by Mortgage Status in Brown Deer
| Household Income | Without Mortgage | With Mortgage |
| Less than $10,000 | 17 (1.7%) | 23 (0.8%) |
| $10,000 to $24,999 | 134 (13.2%) | 11 (0.4%) |
| $25,000 to $34,999 | 51 (5.0%) | 69 (2.5%) |
| $35,000 to $49,999 | 151 (14.9%) | 11 (0.4%) |
| $50,000 to $74,999 | 179 (17.7%) | 144 (5.3%) |
| $75,000 to $99,999 | 116 (11.5%) | 305 (11.2%) |
| $100,000 to $149,999 | 259 (25.6%) | 432 (15.8%) |
| $150,000 or more | 106 (10.5%) | 1,226 (45.0%) |
| Total | 1,013 (100.0%) | 2,727 (100.0%) |
Property Value to Household Income Ratio in Brown Deer
| Value-to-Income Ratio | Without Mortgage | With Mortgage |
| Less than 2.0x | 357 (35.2%) | 116,229 (4,262.2%) |
| 2.0x to 2.9x | 357 (35.2%) | 1,415 (51.9%) |
| 3.0x to 3.9x | 69 (6.8%) | 902 (33.1%) |
| 4.0x or more | 219 (21.6%) | 205 (7.5%) |
| Total | 1,013 (100.0%) | 2,727 (100.0%) |
Real Estate Taxes by Mortgage Status in Brown Deer
| Property Taxes | Without Mortgage | With Mortgage |
| Less than $800 | 16 (1.6%) | 0 (0.0%) |
| $800 to $1,499 | 110 (10.9%) | 71 (2.6%) |
| $800 to $1,499 | 867 (85.6%) | 22 (0.8%) |
| Total | 1,013 (100.0%) | 2,727 (100.0%) |
Health & Disability in Brown Deer
Health Insurance Coverage by Age in Brown Deer
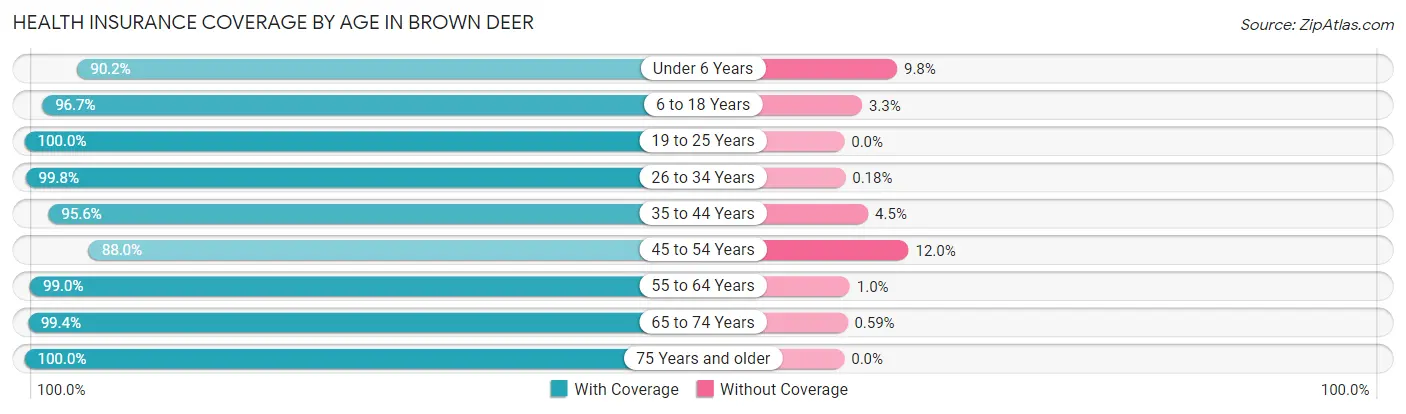
| Age Bracket | With Coverage | Without Coverage |
| Under 6 Years | 669 (90.2%) | 73 (9.8%) |
| 6 to 18 Years | 1,853 (96.7%) | 63 (3.3%) |
| 19 to 25 Years | 717 (100.0%) | 0 (0.0%) |
| 26 to 34 Years | 1,688 (99.8%) | 3 (0.2%) |
| 35 to 44 Years | 1,719 (95.6%) | 80 (4.4%) |
| 45 to 54 Years | 1,226 (88.0%) | 167 (12.0%) |
| 55 to 64 Years | 1,826 (99.0%) | 19 (1.0%) |
| 65 to 74 Years | 1,681 (99.4%) | 10 (0.6%) |
| 75 Years and older | 784 (100.0%) | 0 (0.0%) |
| Total | 12,163 (96.7%) | 415 (3.3%) |
Health Insurance Coverage by Citizenship Status in Brown Deer
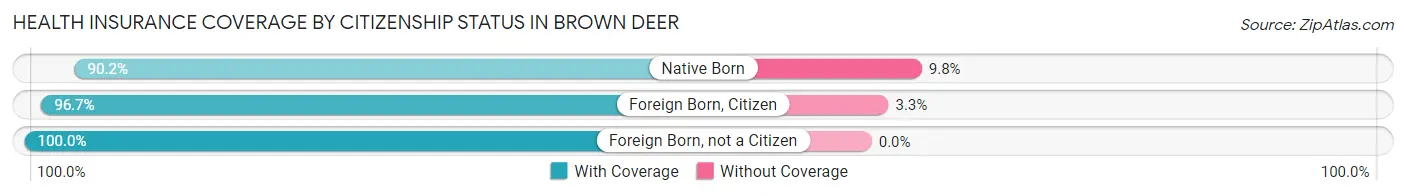
| Citizenship Status | With Coverage | Without Coverage |
| Native Born | 669 (90.2%) | 73 (9.8%) |
| Foreign Born, Citizen | 1,853 (96.7%) | 63 (3.3%) |
| Foreign Born, not a Citizen | 717 (100.0%) | 0 (0.0%) |
Health Insurance Coverage by Household Income in Brown Deer
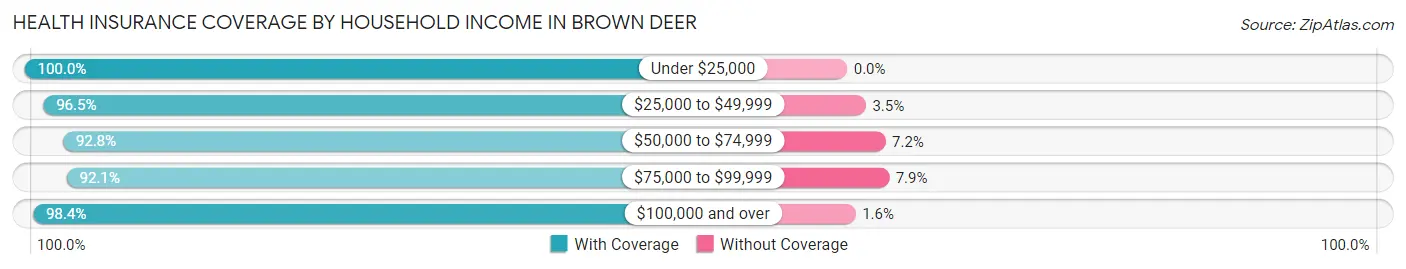
| Household Income | With Coverage | Without Coverage |
| Under $25,000 | 1,392 (100.0%) | 0 (0.0%) |
| $25,000 to $49,999 | 1,463 (96.5%) | 53 (3.5%) |
| $50,000 to $74,999 | 1,372 (92.8%) | 106 (7.2%) |
| $75,000 to $99,999 | 1,829 (92.1%) | 156 (7.9%) |
| $100,000 and over | 6,037 (98.4%) | 97 (1.6%) |
Public vs Private Health Insurance Coverage by Age in Brown Deer
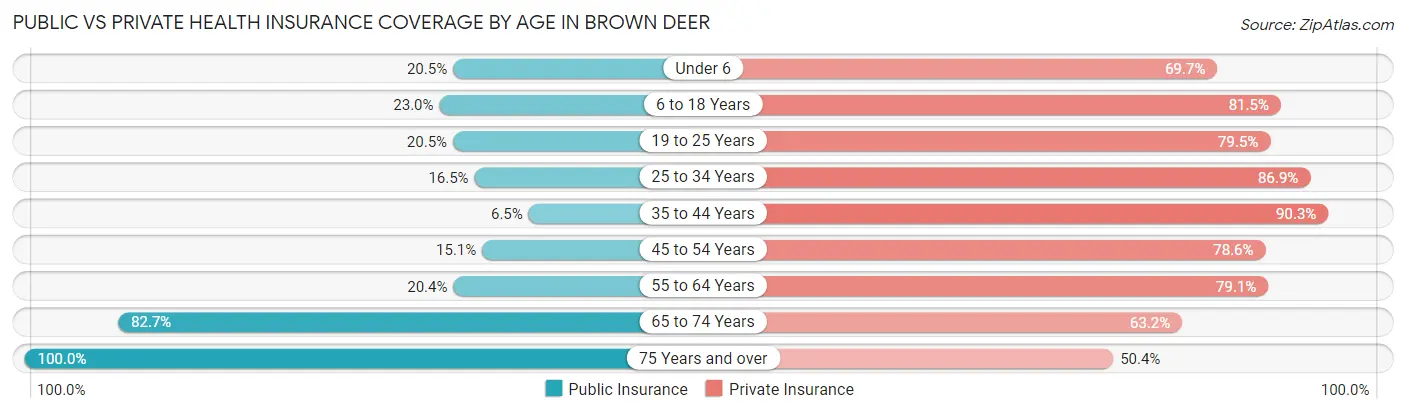
| Age Bracket | Public Insurance | Private Insurance |
| Under 6 | 152 (20.5%) | 517 (69.7%) |
| 6 to 18 Years | 441 (23.0%) | 1,561 (81.5%) |
| 19 to 25 Years | 147 (20.5%) | 570 (79.5%) |
| 25 to 34 Years | 279 (16.5%) | 1,470 (86.9%) |
| 35 to 44 Years | 116 (6.5%) | 1,624 (90.3%) |
| 45 to 54 Years | 210 (15.1%) | 1,095 (78.6%) |
| 55 to 64 Years | 377 (20.4%) | 1,460 (79.1%) |
| 65 to 74 Years | 1,398 (82.7%) | 1,068 (63.2%) |
| 75 Years and over | 784 (100.0%) | 395 (50.4%) |
| Total | 3,904 (31.0%) | 9,760 (77.6%) |
Disability Status by Sex by Age in Brown Deer
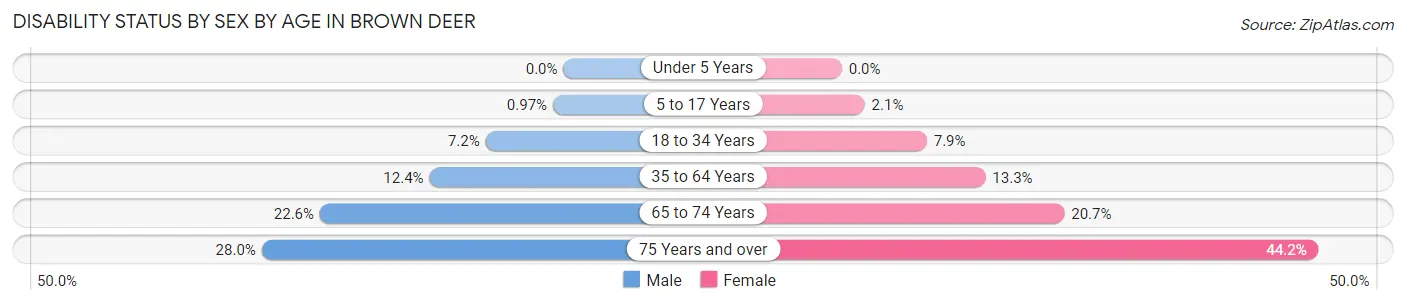
| Age Bracket | Male | Female |
| Under 5 Years | 0 (0.0%) | 0 (0.0%) |
| 5 to 17 Years | 10 (1.0%) | 19 (2.1%) |
| 18 to 34 Years | 108 (7.2%) | 80 (7.9%) |
| 35 to 64 Years | 311 (12.4%) | 338 (13.3%) |
| 65 to 74 Years | 172 (22.6%) | 192 (20.6%) |
| 75 Years and over | 98 (28.0%) | 192 (44.2%) |
Disability Class by Sex by Age in Brown Deer
Disability Class: Hearing Difficulty
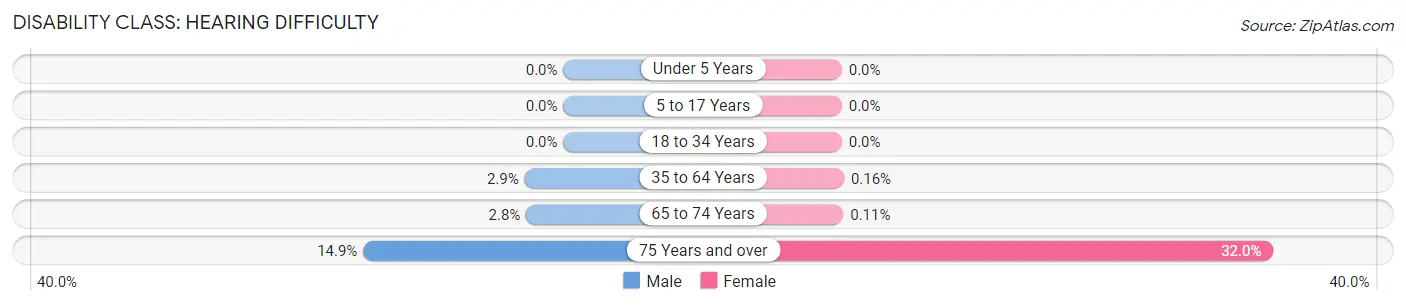
| Age Bracket | Male | Female |
| Under 5 Years | 0 (0.0%) | 0 (0.0%) |
| 5 to 17 Years | 0 (0.0%) | 0 (0.0%) |
| 18 to 34 Years | 0 (0.0%) | 0 (0.0%) |
| 35 to 64 Years | 72 (2.9%) | 4 (0.2%) |
| 65 to 74 Years | 21 (2.8%) | 1 (0.1%) |
| 75 Years and over | 52 (14.9%) | 139 (32.0%) |
Disability Class: Vision Difficulty
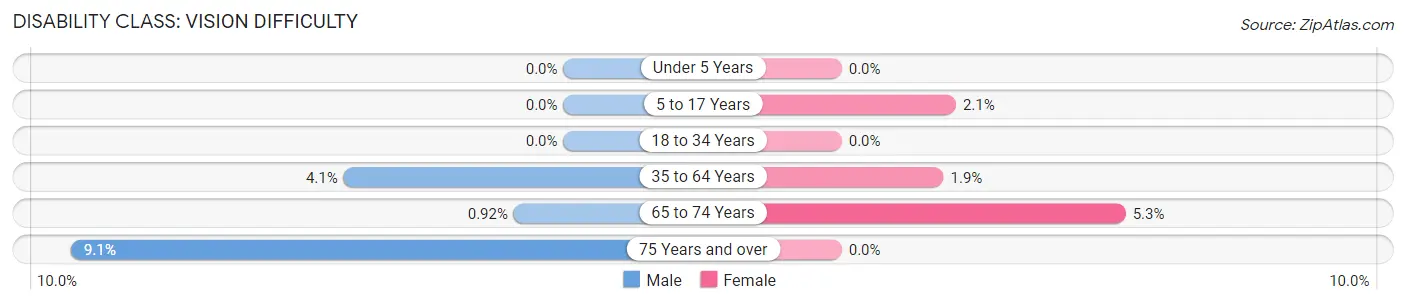
| Age Bracket | Male | Female |
| Under 5 Years | 0 (0.0%) | 0 (0.0%) |
| 5 to 17 Years | 0 (0.0%) | 19 (2.1%) |
| 18 to 34 Years | 0 (0.0%) | 0 (0.0%) |
| 35 to 64 Years | 102 (4.1%) | 48 (1.9%) |
| 65 to 74 Years | 7 (0.9%) | 49 (5.3%) |
| 75 Years and over | 32 (9.1%) | 0 (0.0%) |
Disability Class: Cognitive Difficulty
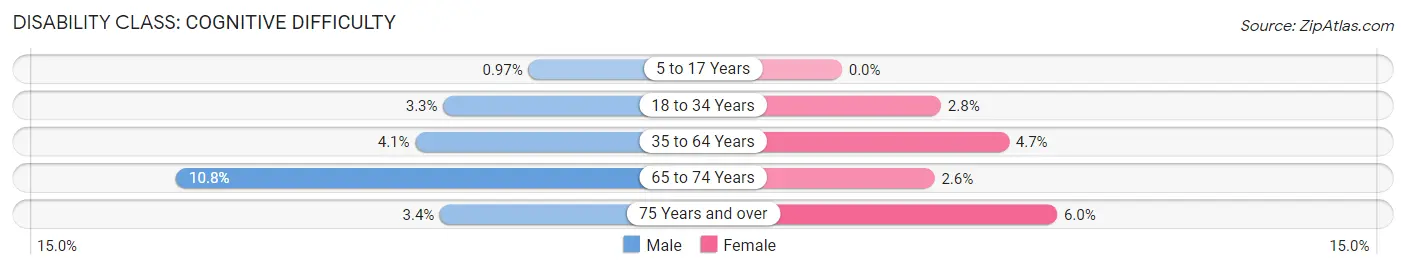
| Age Bracket | Male | Female |
| 5 to 17 Years | 10 (1.0%) | 0 (0.0%) |
| 18 to 34 Years | 50 (3.3%) | 28 (2.8%) |
| 35 to 64 Years | 103 (4.1%) | 118 (4.6%) |
| 65 to 74 Years | 82 (10.8%) | 24 (2.6%) |
| 75 Years and over | 12 (3.4%) | 26 (6.0%) |
Disability Class: Ambulatory Difficulty
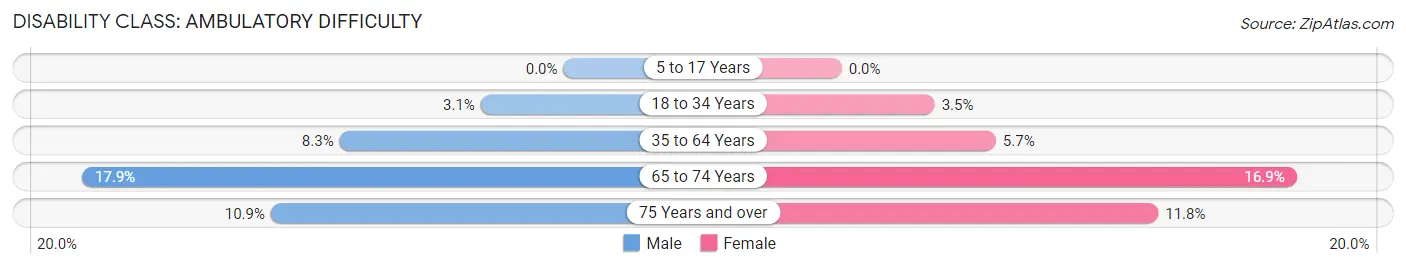
| Age Bracket | Male | Female |
| 5 to 17 Years | 0 (0.0%) | 0 (0.0%) |
| 18 to 34 Years | 46 (3.1%) | 35 (3.5%) |
| 35 to 64 Years | 208 (8.3%) | 145 (5.7%) |
| 65 to 74 Years | 136 (17.9%) | 157 (16.9%) |
| 75 Years and over | 38 (10.9%) | 51 (11.7%) |
Disability Class: Self-Care Difficulty
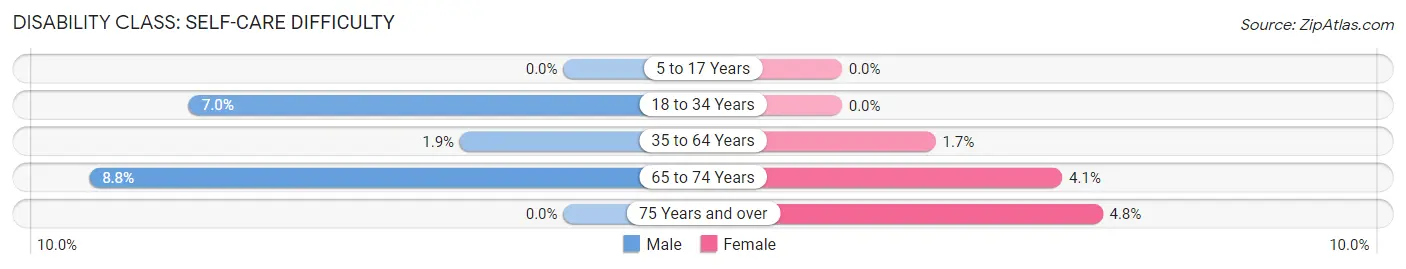
| Age Bracket | Male | Female |
| 5 to 17 Years | 0 (0.0%) | 0 (0.0%) |
| 18 to 34 Years | 104 (7.0%) | 0 (0.0%) |
| 35 to 64 Years | 48 (1.9%) | 44 (1.7%) |
| 65 to 74 Years | 67 (8.8%) | 38 (4.1%) |
| 75 Years and over | 0 (0.0%) | 21 (4.8%) |
Technology Access in Brown Deer
Computing Device Access in Brown Deer
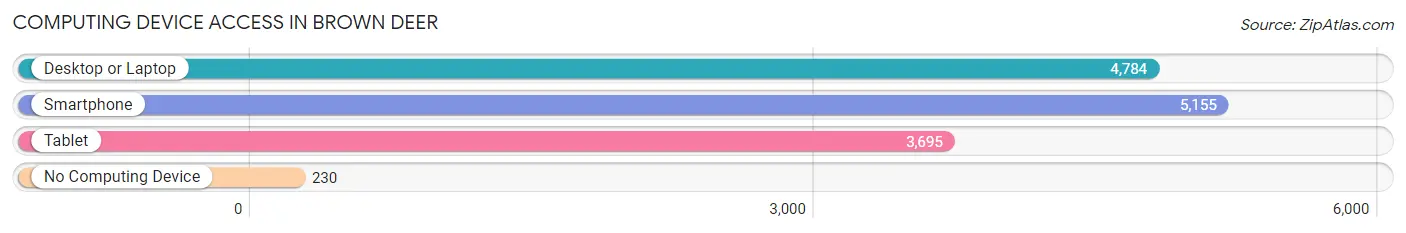
| Device Type | # Households | % Households |
| Desktop or Laptop | 4,784 | 84.2% |
| Smartphone | 5,155 | 90.7% |
| Tablet | 3,695 | 65.0% |
| No Computing Device | 230 | 4.1% |
| Total | 5,684 | 100.0% |
Internet Access in Brown Deer
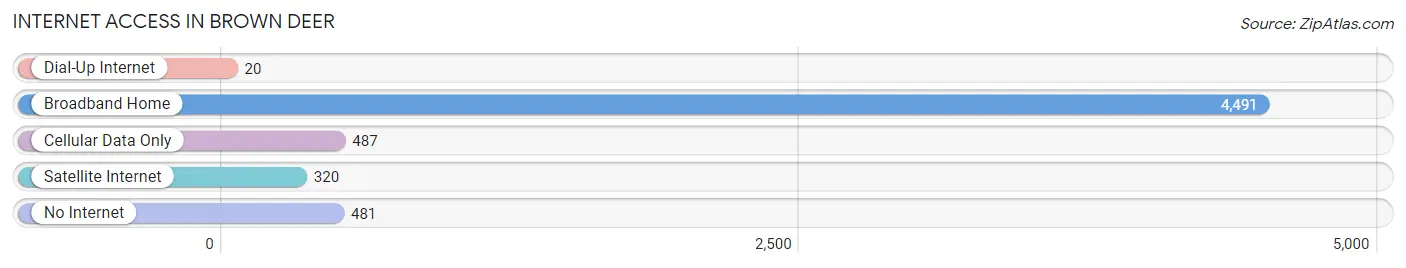
| Internet Type | # Households | % Households |
| Dial-Up Internet | 20 | 0.4% |
| Broadband Home | 4,491 | 79.0% |
| Cellular Data Only | 487 | 8.6% |
| Satellite Internet | 320 | 5.6% |
| No Internet | 481 | 8.5% |
| Total | 5,684 | 100.0% |
Brown Deer Summary
History
Brown Deer is a village located in Milwaukee County, Wisconsin. It is bordered by the cities of Milwaukee, Glendale, and River Hills. The village was first settled in 1835 by a group of German immigrants. The village was originally known as “Deerfield”, but was later changed to “Brown Deer” in 1839. The name was chosen to reflect the abundance of deer in the area.
The village was incorporated in 1956 and has since grown to a population of 11,999 as of the 2010 census. The village is home to a variety of businesses, including a large industrial park, a shopping center, and a golf course.
Geography
Brown Deer is located in southeastern Wisconsin, approximately 10 miles north of Milwaukee. The village is situated on the Milwaukee River, which flows through the village and is a popular recreational spot for fishing and boating. The village is also home to several parks, including Brown Deer Park, which is the largest park in the village.
The village is located in the Central Lake Michigan Lowlands, which is characterized by rolling hills and flat plains. The climate in Brown Deer is humid continental, with hot summers and cold winters. The average temperature in the summer is around 75 degrees Fahrenheit, and the average temperature in the winter is around 25 degrees Fahrenheit.
Economy
The economy of Brown Deer is largely based on manufacturing and retail. The village is home to several large industrial parks, which are home to a variety of businesses, including manufacturing, warehousing, and distribution. The village is also home to a large shopping center, which is home to a variety of retail stores and restaurants.
The village is also home to a variety of small businesses, including professional services, health care, and financial services. The village is also home to a variety of educational institutions, including the University of Wisconsin-Milwaukee, Milwaukee Area Technical College, and the Milwaukee Institute of Technology.
Demographics
As of the 2010 census, the population of Brown Deer was 11,999. The racial makeup of the village was 79.3% White, 11.2% African American, 0.7% Native American, 2.2% Asian, 0.1% Pacific Islander, 4.2% from other races, and 2.5% from two or more races. Hispanic or Latino of any race were 8.2% of the population.
The median income for a household in the village was $50,945, and the median income for a family was $60,945. The per capita income for the village was $25,945. About 6.2% of families and 8.2% of the population were below the poverty line, including 10.2% of those under age 18 and 5.2% of those age 65 or over.
Common Questions
What is Per Capita Income in Brown Deer?
Per Capita income in Brown Deer is $38,692.
What is the Median Family Income in Brown Deer?
Median Family Income in Brown Deer is $110,724.
What is the Median Household income in Brown Deer?
Median Household Income in Brown Deer is $88,164.
What is Income or Wage Gap in Brown Deer?
Income or Wage Gap in Brown Deer is 32.1%.
Women in Brown Deer earn 67.9 cents for every dollar earned by a man.
What is Inequality or Gini Index in Brown Deer?
Inequality or Gini Index in Brown Deer is 0.37.
What is the Total Population of Brown Deer?
Total Population of Brown Deer is 12,593.
What is the Total Male Population of Brown Deer?
Total Male Population of Brown Deer is 6,490.
What is the Total Female Population of Brown Deer?
Total Female Population of Brown Deer is 6,103.
What is the Ratio of Males per 100 Females in Brown Deer?
There are 106.34 Males per 100 Females in Brown Deer.
What is the Ratio of Females per 100 Males in Brown Deer?
There are 94.04 Females per 100 Males in Brown Deer.
What is the Median Population Age in Brown Deer?
Median Population Age in Brown Deer is 42.7 Years.
What is the Average Family Size in Brown Deer
Average Family Size in Brown Deer is 2.8 People.
What is the Average Household Size in Brown Deer
Average Household Size in Brown Deer is 2.2 People.
How Large is the Labor Force in Brown Deer?
There are 6,665 People in the Labor Forcein in Brown Deer.
What is the Percentage of People in the Labor Force in Brown Deer?
63.7% of People are in the Labor Force in Brown Deer.
What is the Unemployment Rate in Brown Deer?
Unemployment Rate in Brown Deer is 3.8%.