Shell Lake, WI Map & Demographics
Shell Lake Map
Shell Lake Overview
$33,612
PER CAPITA INCOME
$75,703
AVG FAMILY INCOME
$52,500
AVG HOUSEHOLD INCOME
51.2%
WAGE / INCOME GAP [ % ]
48.8¢/ $1
WAGE / INCOME GAP [ $ ]
0.52
INEQUALITY / GINI INDEX
1,664
TOTAL POPULATION
688
MALE POPULATION
976
FEMALE POPULATION
70.49
MALES / 100 FEMALES
141.86
FEMALES / 100 MALES
42.8
MEDIAN AGE
3.1
AVG FAMILY SIZE
2.5
AVG HOUSEHOLD SIZE
641
LABOR FORCE [ PEOPLE ]
49.5%
PERCENT IN LABOR FORCE
3.3%
UNEMPLOYMENT RATE
Shell Lake Zip Codes
Shell Lake Area Codes
Income in Shell Lake
Income Overview in Shell Lake
Per Capita Income in Shell Lake is $33,612, while median incomes of families and households are $75,703 and $52,500 respectively.
| Characteristic | Number | Measure |
| Per Capita Income | 1,664 | $33,612 |
| Median Family Income | 409 | $75,703 |
| Mean Family Income | 409 | $105,471 |
| Median Household Income | 636 | $52,500 |
| Mean Household Income | 636 | $83,281 |
| Income Deficit | 409 | $0 |
| Wage / Income Gap (%) | 1,664 | 51.23% |
| Wage / Income Gap ($) | 1,664 | 48.77¢ per $1 |
| Gini / Inequality Index | 1,664 | 0.52 |
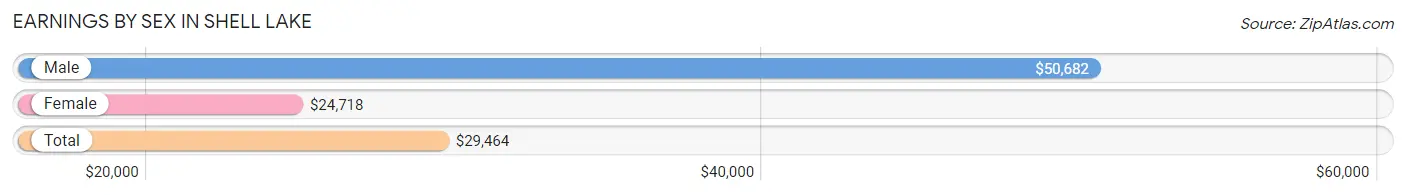
Earnings by Sex in Shell Lake
Average Earnings in Shell Lake are $29,464, $50,682 for men and $24,718 for women, a difference of 51.2%.
| Sex | Number | Average Earnings |
| Male | 302 (43.2%) | $50,682 |
| Female | 397 (56.8%) | $24,718 |
| Total | 699 (100.0%) | $29,464 |
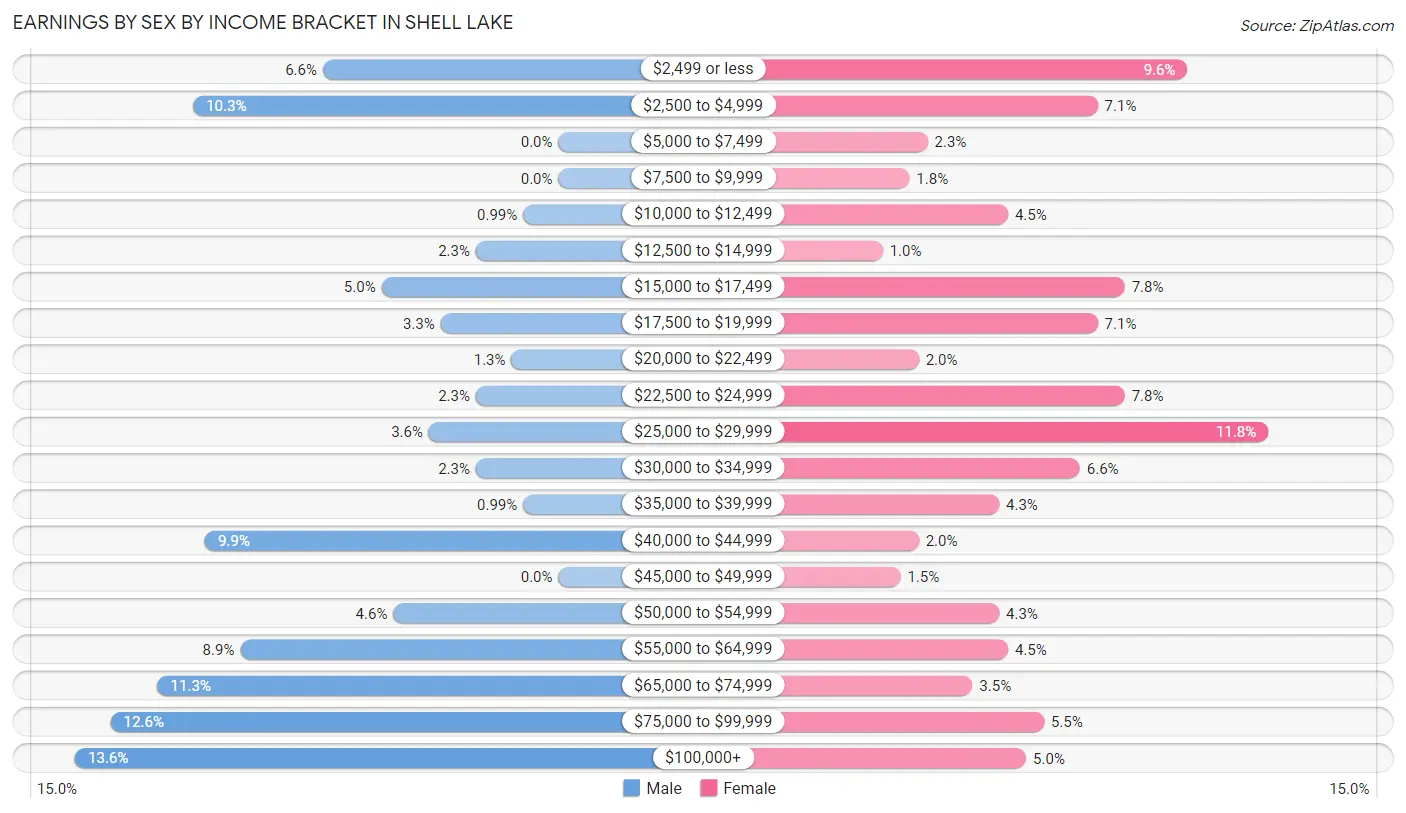
Earnings by Sex by Income Bracket in Shell Lake
The most common earnings brackets in Shell Lake are $100,000+ for men (41 | 13.6%) and $25,000 to $29,999 for women (47 | 11.8%).
| Income | Male | Female |
| $2,499 or less | 20 (6.6%) | 38 (9.6%) |
| $2,500 to $4,999 | 31 (10.3%) | 28 (7.0%) |
| $5,000 to $7,499 | 0 (0.0%) | 9 (2.3%) |
| $7,500 to $9,999 | 0 (0.0%) | 7 (1.8%) |
| $10,000 to $12,499 | 3 (1.0%) | 18 (4.5%) |
| $12,500 to $14,999 | 7 (2.3%) | 4 (1.0%) |
| $15,000 to $17,499 | 15 (5.0%) | 31 (7.8%) |
| $17,500 to $19,999 | 10 (3.3%) | 28 (7.0%) |
| $20,000 to $22,499 | 4 (1.3%) | 8 (2.0%) |
| $22,500 to $24,999 | 7 (2.3%) | 31 (7.8%) |
| $25,000 to $29,999 | 11 (3.6%) | 47 (11.8%) |
| $30,000 to $34,999 | 7 (2.3%) | 26 (6.6%) |
| $35,000 to $39,999 | 3 (1.0%) | 17 (4.3%) |
| $40,000 to $44,999 | 30 (9.9%) | 8 (2.0%) |
| $45,000 to $49,999 | 0 (0.0%) | 6 (1.5%) |
| $50,000 to $54,999 | 14 (4.6%) | 17 (4.3%) |
| $55,000 to $64,999 | 27 (8.9%) | 18 (4.5%) |
| $65,000 to $74,999 | 34 (11.3%) | 14 (3.5%) |
| $75,000 to $99,999 | 38 (12.6%) | 22 (5.5%) |
| $100,000+ | 41 (13.6%) | 20 (5.0%) |
| Total | 302 (100.0%) | 397 (100.0%) |
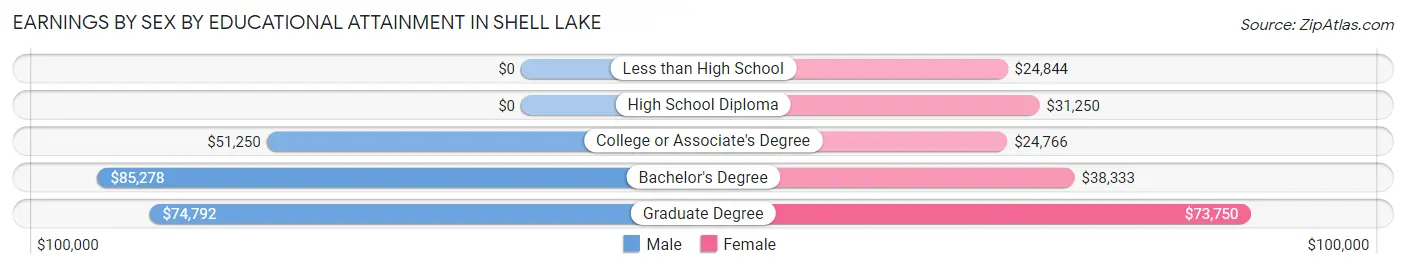
Earnings by Sex by Educational Attainment in Shell Lake
Average earnings in Shell Lake are $56,389 for men and $29,435 for women, a difference of 47.8%. Men with an educational attainment of bachelor's degree enjoy the highest average annual earnings of $85,278, while those with college or associate's degree education earn the least with $51,250. Women with an educational attainment of graduate degree earn the most with the average annual earnings of $73,750, while those with college or associate's degree education have the smallest earnings of $24,766.
| Educational Attainment | Male Income | Female Income |
| Less than High School | - | - |
| High School Diploma | - | - |
| College or Associate's Degree | $51,250 | $24,766 |
| Bachelor's Degree | $85,278 | $38,333 |
| Graduate Degree | $74,792 | $73,750 |
| Total | $56,389 | $29,435 |
Family Income in Shell Lake
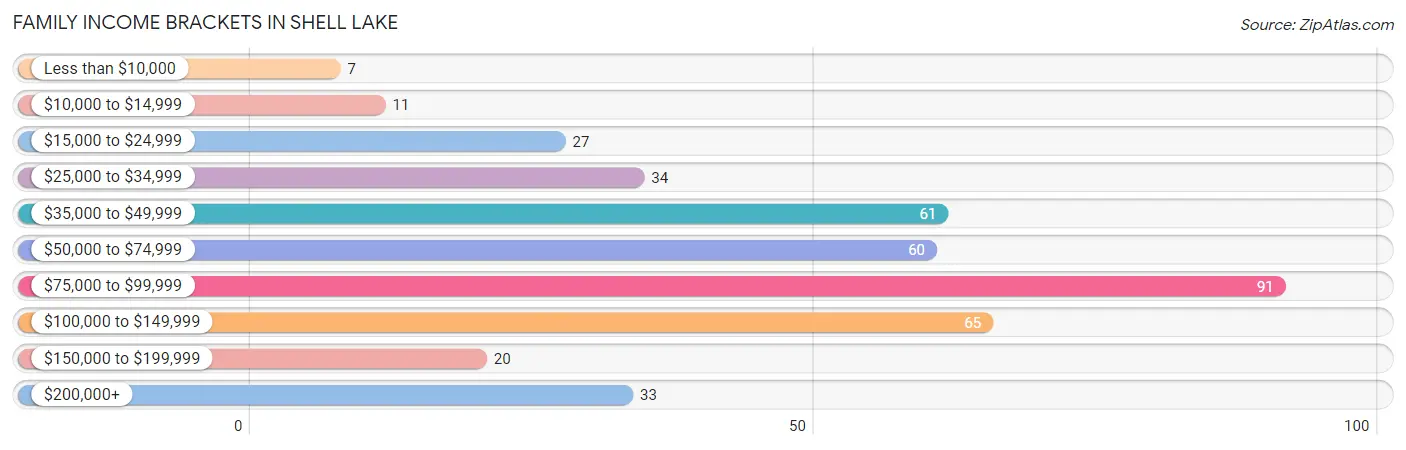
Family Income Brackets in Shell Lake
According to the Shell Lake family income data, there are 91 families falling into the $75,000 to $99,999 income range, which is the most common income bracket and makes up 22.3% of all families. Conversely, the less than $10,000 income bracket is the least frequent group with only 7 families (1.7%) belonging to this category.
| Income Bracket | # Families | % Families |
| Less than $10,000 | 7 | 1.7% |
| $10,000 to $14,999 | 11 | 2.7% |
| $15,000 to $24,999 | 27 | 6.6% |
| $25,000 to $34,999 | 34 | 8.3% |
| $35,000 to $49,999 | 61 | 14.9% |
| $50,000 to $74,999 | 60 | 14.7% |
| $75,000 to $99,999 | 91 | 22.2% |
| $100,000 to $149,999 | 65 | 15.9% |
| $150,000 to $199,999 | 20 | 4.9% |
| $200,000+ | 33 | 8.1% |
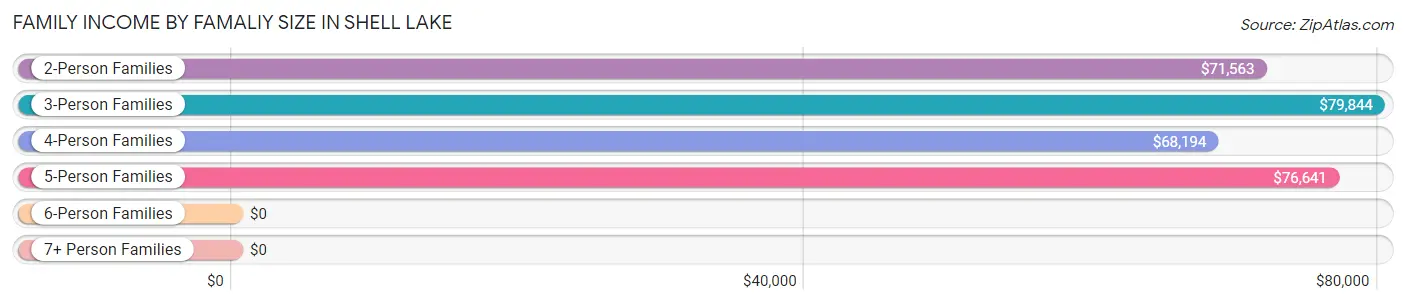
Family Income by Famaliy Size in Shell Lake
3-person families (71 | 17.4%) account for the highest median family income in Shell Lake with $79,844 per family, while 2-person families (223 | 54.5%) have the highest median income of $35,782 per family member.
| Income Bracket | # Families | Median Income |
| 2-Person Families | 223 (54.5%) | $71,563 |
| 3-Person Families | 71 (17.4%) | $79,844 |
| 4-Person Families | 65 (15.9%) | $68,194 |
| 5-Person Families | 39 (9.5%) | $76,641 |
| 6-Person Families | 11 (2.7%) | $0 |
| 7+ Person Families | 0 (0.0%) | $0 |
| Total | 409 (100.0%) | $75,703 |
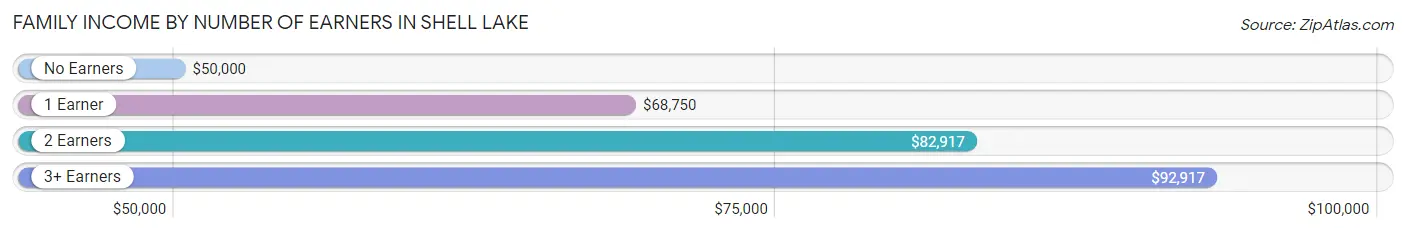
Family Income by Number of Earners in Shell Lake
The median family income in Shell Lake is $75,703, with families comprising 3+ earners (37) having the highest median family income of $92,917, while families with no earners (92) have the lowest median family income of $50,000, accounting for 9.0% and 22.5% of families, respectively.
| Number of Earners | # Families | Median Income |
| No Earners | 92 (22.5%) | $50,000 |
| 1 Earner | 125 (30.6%) | $68,750 |
| 2 Earners | 155 (37.9%) | $82,917 |
| 3+ Earners | 37 (9.0%) | $92,917 |
| Total | 409 (100.0%) | $75,703 |
Household Income in Shell Lake
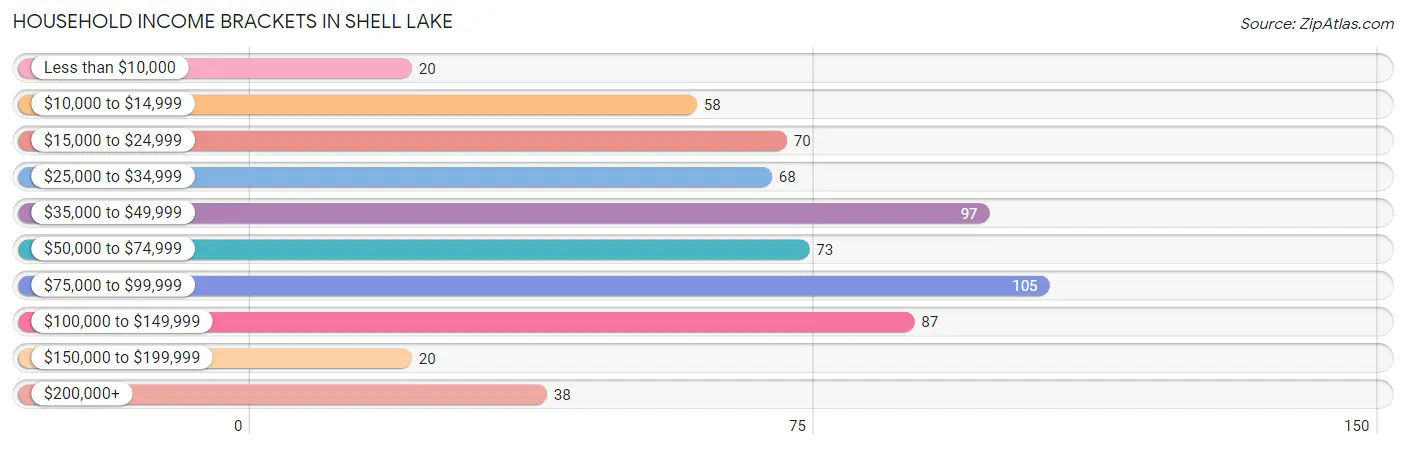
Household Income Brackets in Shell Lake
With 105 households falling in the category, the $75,000 to $99,999 income range is the most frequent in Shell Lake, accounting for 16.5% of all households. In contrast, only 20 households (3.1%) fall into the less than $10,000 income bracket, making it the least populous group.
| Income Bracket | # Households | % Households |
| Less than $10,000 | 20 | 3.1% |
| $10,000 to $14,999 | 58 | 9.1% |
| $15,000 to $24,999 | 70 | 11.0% |
| $25,000 to $34,999 | 68 | 10.7% |
| $35,000 to $49,999 | 97 | 15.3% |
| $50,000 to $74,999 | 73 | 11.5% |
| $75,000 to $99,999 | 105 | 16.5% |
| $100,000 to $149,999 | 87 | 13.7% |
| $150,000 to $199,999 | 20 | 3.1% |
| $200,000+ | 38 | 6.0% |
Household Income by Householder Age in Shell Lake
The median household income in Shell Lake is $52,500, with the highest median household income of $76,500 found in the 45 to 64 years age bracket for the primary householder. A total of 200 households (31.5%) fall into this category. Meanwhile, the 65+ years age bracket for the primary householder has the lowest median household income of $34,107, with 243 households (38.2%) in this group.
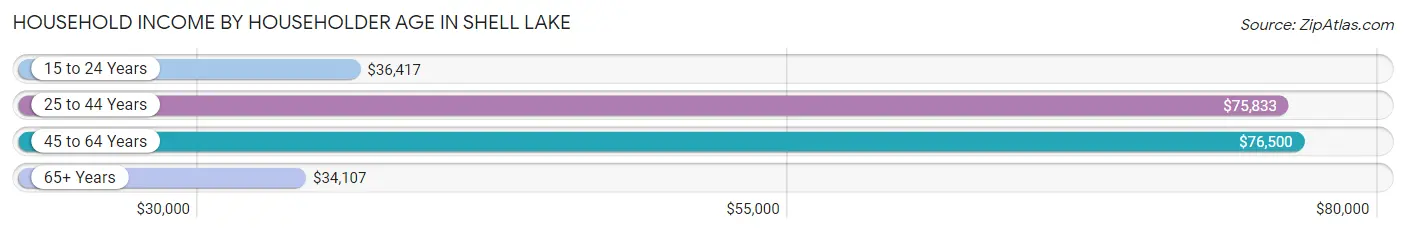
| Income Bracket | # Households | Median Income |
| 15 to 24 Years | 27 (4.3%) | $36,417 |
| 25 to 44 Years | 166 (26.1%) | $75,833 |
| 45 to 64 Years | 200 (31.5%) | $76,500 |
| 65+ Years | 243 (38.2%) | $34,107 |
| Total | 636 (100.0%) | $52,500 |
Poverty in Shell Lake
Income Below Poverty by Sex and Age in Shell Lake
With 9.0% poverty level for males and 13.5% for females among the residents of Shell Lake, 25 to 34 year old males and 75 year old and over females are the most vulnerable to poverty, with 11 males (21.6%) and 34 females (34.7%) in their respective age groups living below the poverty level.
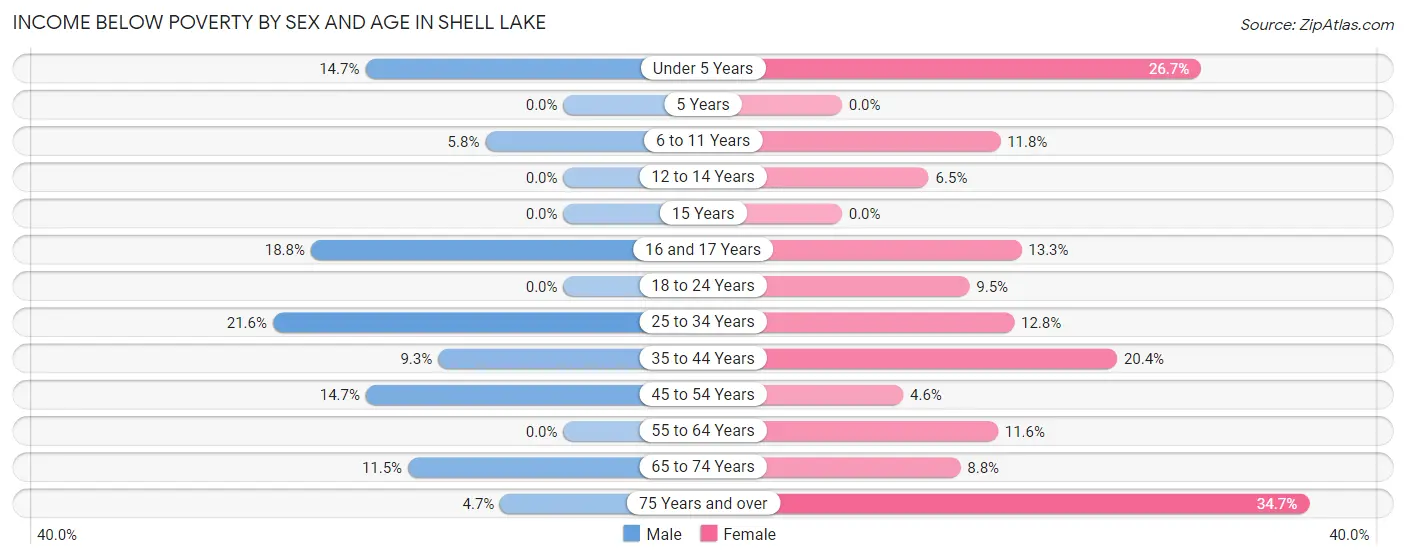
| Age Bracket | Male | Female |
| Under 5 Years | 5 (14.7%) | 12 (26.7%) |
| 5 Years | 0 (0.0%) | 0 (0.0%) |
| 6 to 11 Years | 4 (5.8%) | 8 (11.8%) |
| 12 to 14 Years | 0 (0.0%) | 4 (6.5%) |
| 15 Years | 0 (0.0%) | 0 (0.0%) |
| 16 and 17 Years | 3 (18.8%) | 4 (13.3%) |
| 18 to 24 Years | 0 (0.0%) | 9 (9.5%) |
| 25 to 34 Years | 11 (21.6%) | 11 (12.8%) |
| 35 to 44 Years | 8 (9.3%) | 19 (20.4%) |
| 45 to 54 Years | 11 (14.7%) | 4 (4.5%) |
| 55 to 64 Years | 0 (0.0%) | 11 (11.6%) |
| 65 to 74 Years | 12 (11.5%) | 11 (8.8%) |
| 75 Years and over | 3 (4.7%) | 34 (34.7%) |
| Total | 57 (9.0%) | 127 (13.5%) |
Income Above Poverty by Sex and Age in Shell Lake
According to the poverty statistics in Shell Lake, males aged 5 years and females aged 5 years are the age groups that are most secure financially, with 100.0% of males and 100.0% of females in these age groups living above the poverty line.
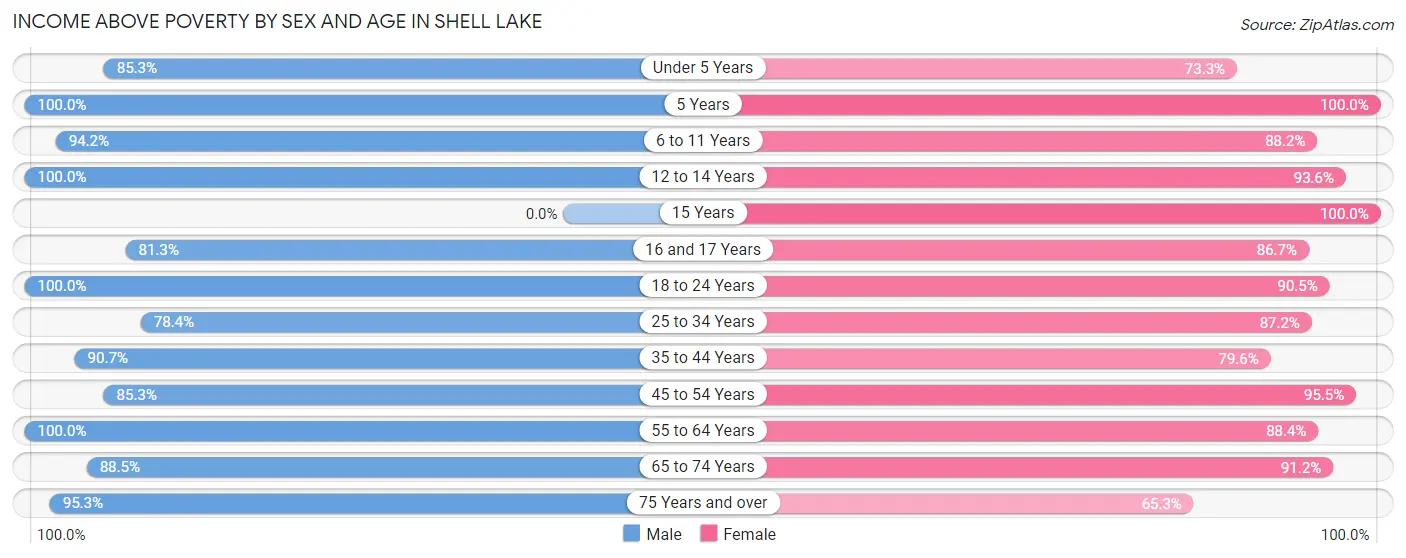
| Age Bracket | Male | Female |
| Under 5 Years | 29 (85.3%) | 33 (73.3%) |
| 5 Years | 24 (100.0%) | 20 (100.0%) |
| 6 to 11 Years | 65 (94.2%) | 60 (88.2%) |
| 12 to 14 Years | 14 (100.0%) | 58 (93.5%) |
| 15 Years | 0 (0.0%) | 33 (100.0%) |
| 16 and 17 Years | 13 (81.2%) | 26 (86.7%) |
| 18 to 24 Years | 19 (100.0%) | 86 (90.5%) |
| 25 to 34 Years | 40 (78.4%) | 75 (87.2%) |
| 35 to 44 Years | 78 (90.7%) | 74 (79.6%) |
| 45 to 54 Years | 64 (85.3%) | 84 (95.5%) |
| 55 to 64 Years | 80 (100.0%) | 84 (88.4%) |
| 65 to 74 Years | 92 (88.5%) | 114 (91.2%) |
| 75 Years and over | 61 (95.3%) | 64 (65.3%) |
| Total | 579 (91.0%) | 811 (86.5%) |
Income Below Poverty Among Married-Couple Families in Shell Lake
The poverty statistics for married-couple families in Shell Lake show that 6.9% or 21 of the total 306 families live below the poverty line. Families with 1 or 2 children have the highest poverty rate of 16.7%, comprising of 15 families. On the other hand, families with 3 or 4 children have the lowest poverty rate of 0.0%, which includes 0 families.
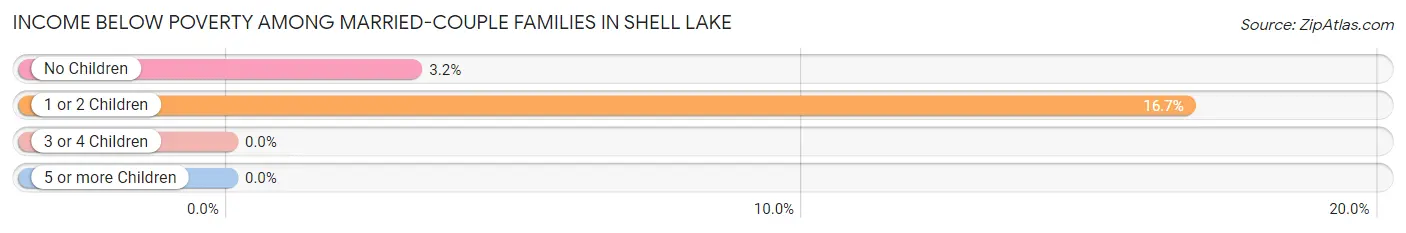
| Children | Above Poverty | Below Poverty |
| No Children | 181 (96.8%) | 6 (3.2%) |
| 1 or 2 Children | 75 (83.3%) | 15 (16.7%) |
| 3 or 4 Children | 29 (100.0%) | 0 (0.0%) |
| 5 or more Children | 0 (0.0%) | 0 (0.0%) |
| Total | 285 (93.1%) | 21 (6.9%) |
Income Below Poverty Among Single-Parent Households in Shell Lake
According to the poverty data in Shell Lake, 17.4% or 4 single-father households and 13.8% or 11 single-mother households are living below the poverty line. Among single-father households, those with 3 or 4 children have the highest poverty rate, with 4 households (30.8%) experiencing poverty. Likewise, among single-mother households, those with 1 or 2 children have the highest poverty rate, with 11 households (19.3%) falling below the poverty line.
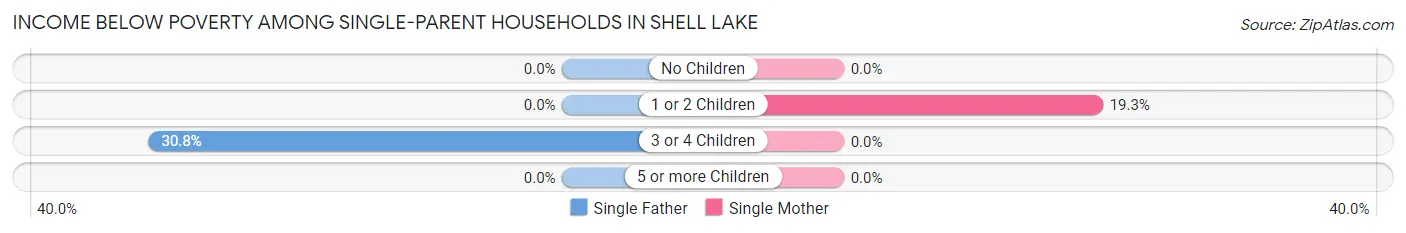
| Children | Single Father | Single Mother |
| No Children | 0 (0.0%) | 0 (0.0%) |
| 1 or 2 Children | 0 (0.0%) | 11 (19.3%) |
| 3 or 4 Children | 4 (30.8%) | 0 (0.0%) |
| 5 or more Children | 0 (0.0%) | 0 (0.0%) |
| Total | 4 (17.4%) | 11 (13.8%) |
Income Below Poverty Among Married-Couple vs Single-Parent Households in Shell Lake
The poverty data for Shell Lake shows that 21 of the married-couple family households (6.9%) and 15 of the single-parent households (14.6%) are living below the poverty level. Within the married-couple family households, those with 1 or 2 children have the highest poverty rate, with 15 households (16.7%) falling below the poverty line. Among the single-parent households, those with 3 or 4 children have the highest poverty rate, with 4 household (23.5%) living below poverty.
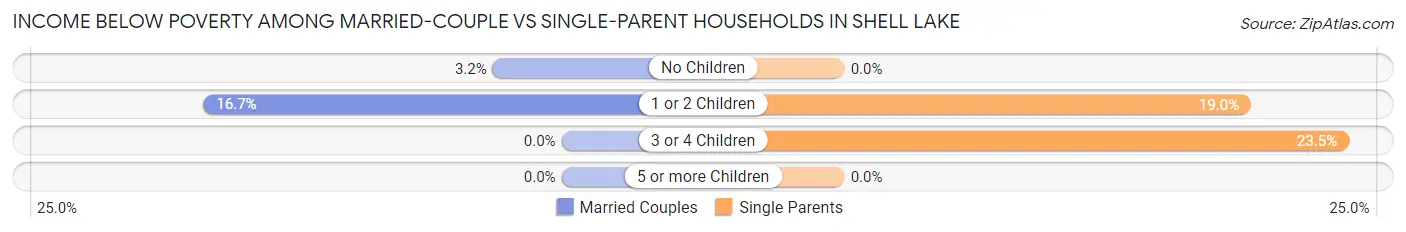
| Children | Married-Couple Families | Single-Parent Households |
| No Children | 6 (3.2%) | 0 (0.0%) |
| 1 or 2 Children | 15 (16.7%) | 11 (19.0%) |
| 3 or 4 Children | 0 (0.0%) | 4 (23.5%) |
| 5 or more Children | 0 (0.0%) | 0 (0.0%) |
| Total | 21 (6.9%) | 15 (14.6%) |
Race in Shell Lake
The most populous races in Shell Lake are White / Caucasian (1,537 | 92.4%), Two or more Races (84 | 5.1%), and Native / Alaskan (24 | 1.4%).
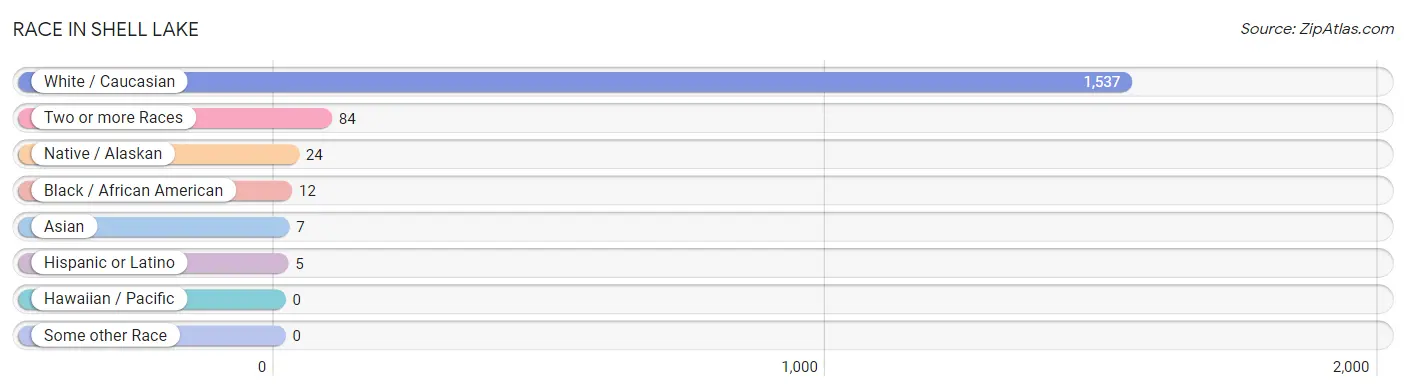
| Race | # Population | % Population |
| Asian | 7 | 0.4% |
| Black / African American | 12 | 0.7% |
| Hawaiian / Pacific | 0 | 0.0% |
| Hispanic or Latino | 5 | 0.3% |
| Native / Alaskan | 24 | 1.4% |
| White / Caucasian | 1,537 | 92.4% |
| Two or more Races | 84 | 5.1% |
| Some other Race | 0 | 0.0% |
| Total | 1,664 | 100.0% |
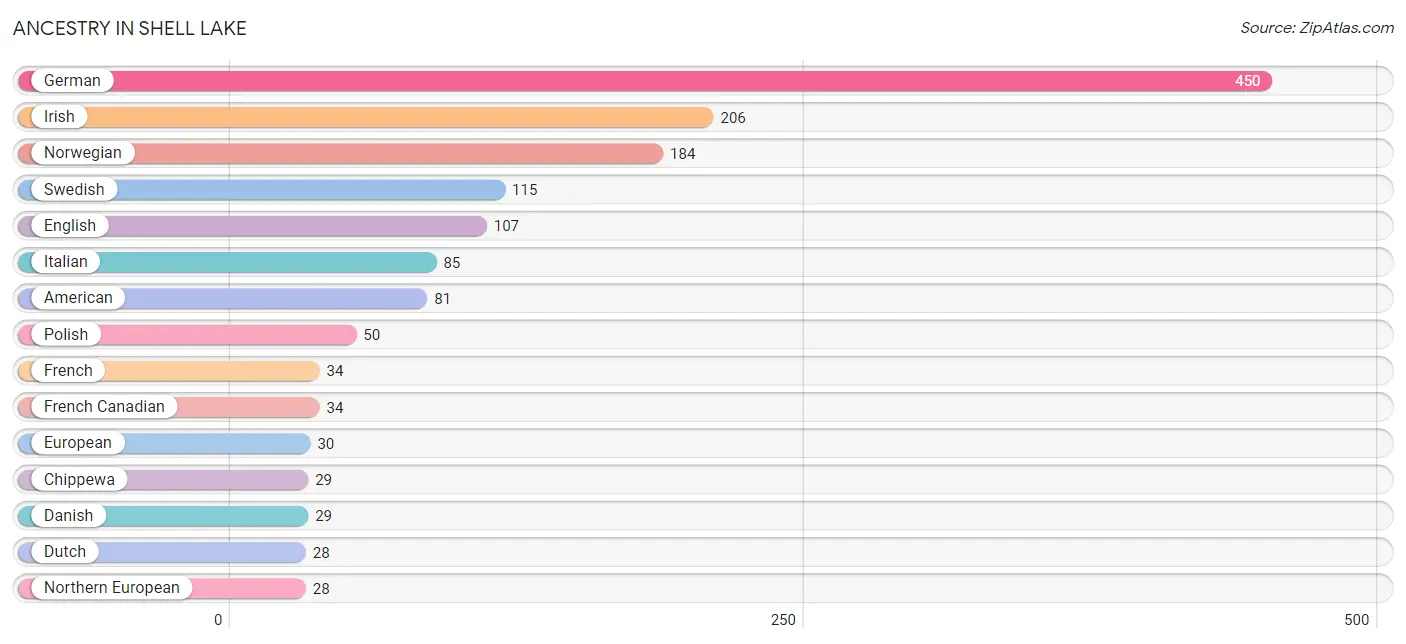
Ancestry in Shell Lake
The most populous ancestries reported in Shell Lake are German (450 | 27.0%), Irish (206 | 12.4%), Norwegian (184 | 11.1%), Swedish (115 | 6.9%), and English (107 | 6.4%), together accounting for 63.8% of all Shell Lake residents.
| Ancestry | # Population | % Population |
| American | 81 | 4.9% |
| Austrian | 3 | 0.2% |
| Belgian | 11 | 0.7% |
| Blackfeet | 3 | 0.2% |
| British | 4 | 0.2% |
| Chippewa | 29 | 1.7% |
| Croatian | 2 | 0.1% |
| Czech | 6 | 0.4% |
| Danish | 29 | 1.7% |
| Dutch | 28 | 1.7% |
| English | 107 | 6.4% |
| European | 30 | 1.8% |
| Finnish | 5 | 0.3% |
| French | 34 | 2.0% |
| French American Indian | 6 | 0.4% |
| French Canadian | 34 | 2.0% |
| German | 450 | 27.0% |
| Hungarian | 2 | 0.1% |
| Irish | 206 | 12.4% |
| Iroquois | 23 | 1.4% |
| Italian | 85 | 5.1% |
| Korean | 3 | 0.2% |
| Mexican | 5 | 0.3% |
| Northern European | 28 | 1.7% |
| Norwegian | 184 | 11.1% |
| Okinawan | 4 | 0.2% |
| Paiute | 19 | 1.1% |
| Polish | 50 | 3.0% |
| Scandinavian | 18 | 1.1% |
| Scotch-Irish | 21 | 1.3% |
| Scottish | 25 | 1.5% |
| Serbian | 13 | 0.8% |
| Sioux | 17 | 1.0% |
| Swedish | 115 | 6.9% |
| Swiss | 3 | 0.2% |
| Ukrainian | 3 | 0.2% | View All 36 Rows |
Immigrants in Shell Lake
The most numerous immigrant groups reported in Shell Lake came from Europe (22 | 1.3%), Eastern Europe (13 | 0.8%), Serbia (13 | 0.8%), Western Europe (9 | 0.5%), and Asia (7 | 0.4%), together accounting for 3.8% of all Shell Lake residents.
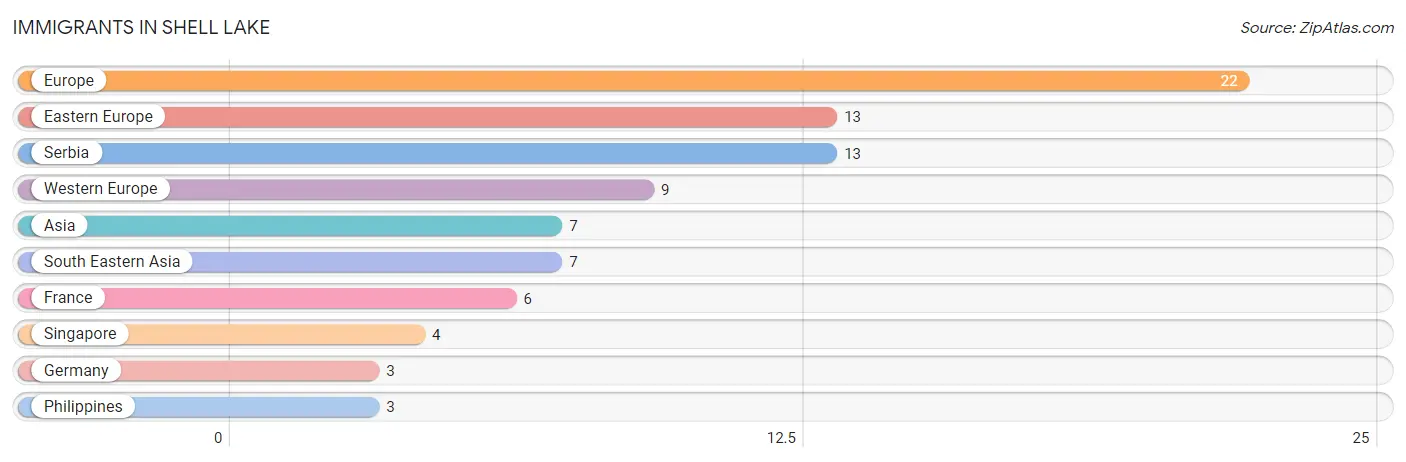
| Immigration Origin | # Population | % Population |
| Asia | 7 | 0.4% |
| Eastern Europe | 13 | 0.8% |
| Europe | 22 | 1.3% |
| France | 6 | 0.4% |
| Germany | 3 | 0.2% |
| Philippines | 3 | 0.2% |
| Serbia | 13 | 0.8% |
| Singapore | 4 | 0.2% |
| South Eastern Asia | 7 | 0.4% |
| Western Europe | 9 | 0.5% | View All 10 Rows |
Sex and Age in Shell Lake
Sex and Age in Shell Lake
The most populous age groups in Shell Lake are 5 to 9 Years (61 | 8.9%) for men and 20 to 24 Years (85 | 8.7%) for women.
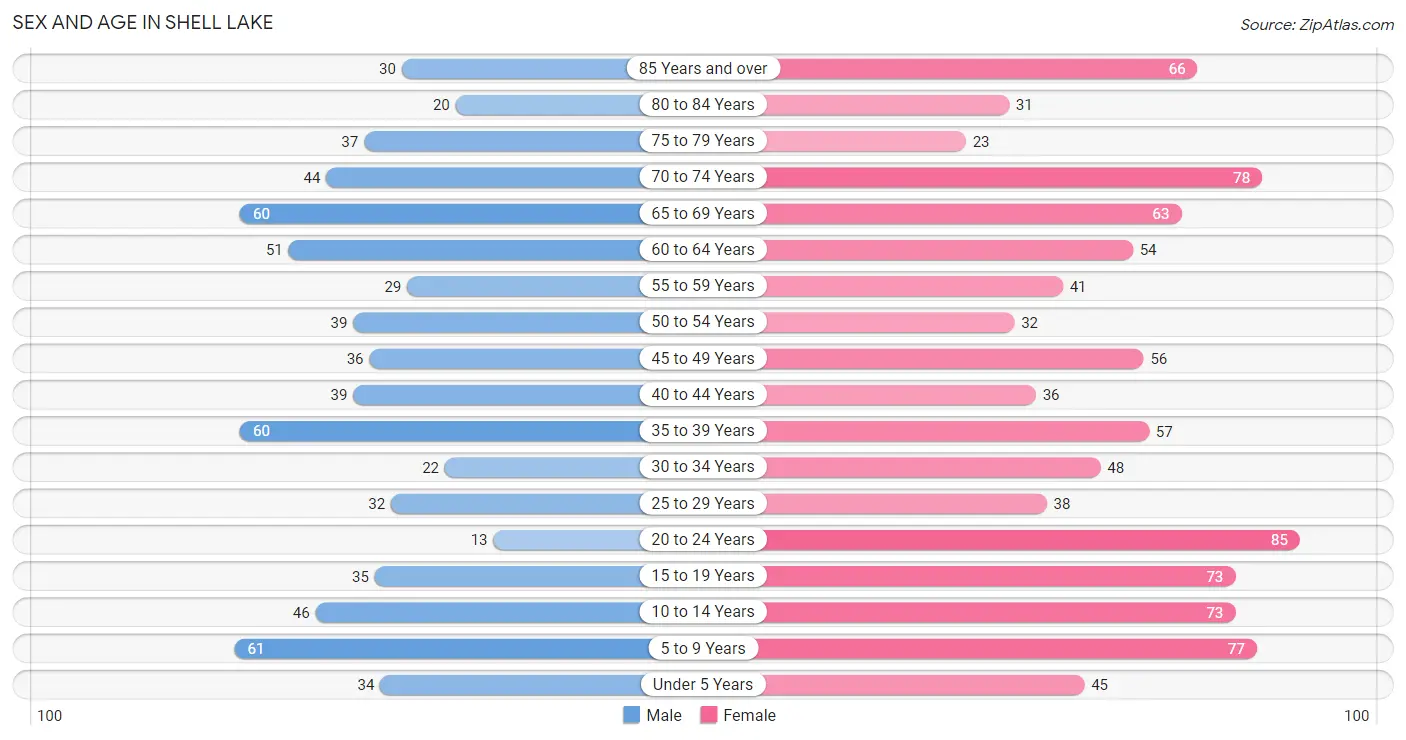
| Age Bracket | Male | Female |
| Under 5 Years | 34 (4.9%) | 45 (4.6%) |
| 5 to 9 Years | 61 (8.9%) | 77 (7.9%) |
| 10 to 14 Years | 46 (6.7%) | 73 (7.5%) |
| 15 to 19 Years | 35 (5.1%) | 73 (7.5%) |
| 20 to 24 Years | 13 (1.9%) | 85 (8.7%) |
| 25 to 29 Years | 32 (4.6%) | 38 (3.9%) |
| 30 to 34 Years | 22 (3.2%) | 48 (4.9%) |
| 35 to 39 Years | 60 (8.7%) | 57 (5.8%) |
| 40 to 44 Years | 39 (5.7%) | 36 (3.7%) |
| 45 to 49 Years | 36 (5.2%) | 56 (5.7%) |
| 50 to 54 Years | 39 (5.7%) | 32 (3.3%) |
| 55 to 59 Years | 29 (4.2%) | 41 (4.2%) |
| 60 to 64 Years | 51 (7.4%) | 54 (5.5%) |
| 65 to 69 Years | 60 (8.7%) | 63 (6.5%) |
| 70 to 74 Years | 44 (6.4%) | 78 (8.0%) |
| 75 to 79 Years | 37 (5.4%) | 23 (2.4%) |
| 80 to 84 Years | 20 (2.9%) | 31 (3.2%) |
| 85 Years and over | 30 (4.4%) | 66 (6.8%) |
| Total | 688 (100.0%) | 976 (100.0%) |
Families and Households in Shell Lake
Median Family Size in Shell Lake
The median family size in Shell Lake is 3.11 persons per family, with single male/father families (23 | 5.6%) accounting for the largest median family size of 4.04 persons per family. On the other hand, single female/mother families (80 | 19.6%) represent the smallest median family size with 3.04 persons per family.
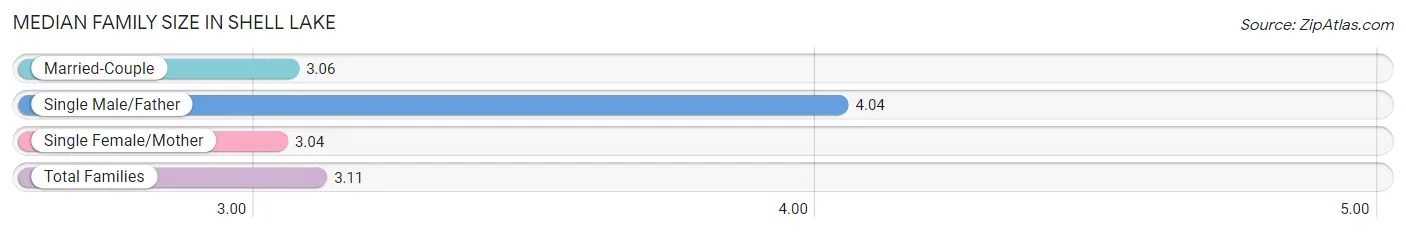
| Family Type | # Families | Family Size |
| Married-Couple | 306 (74.8%) | 3.06 |
| Single Male/Father | 23 (5.6%) | 4.04 |
| Single Female/Mother | 80 (19.6%) | 3.04 |
| Total Families | 409 (100.0%) | 3.11 |
Median Household Size in Shell Lake
The median household size in Shell Lake is 2.45 persons per household, with single male/father households (23 | 3.6%) accounting for the largest median household size of 4.65 persons per household. non-family households (227 | 35.7%) represent the smallest median household size with 1.17 persons per household.
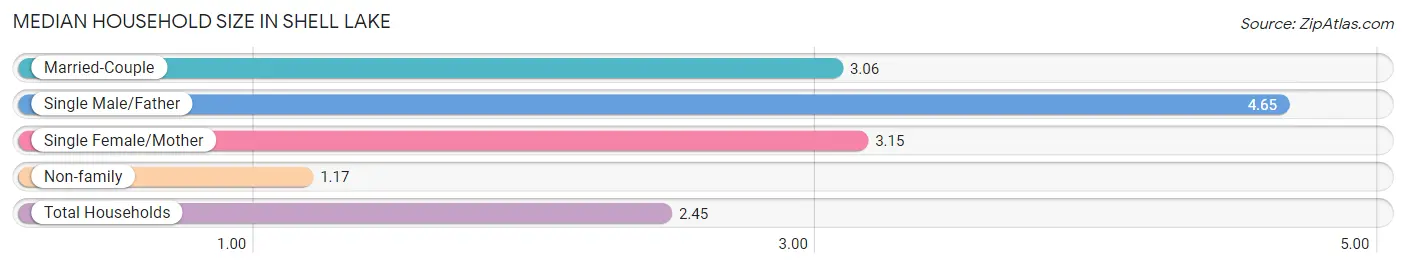
| Household Type | # Households | Household Size |
| Married-Couple | 306 (48.1%) | 3.06 |
| Single Male/Father | 23 (3.6%) | 4.65 |
| Single Female/Mother | 80 (12.6%) | 3.15 |
| Non-family | 227 (35.7%) | 1.17 |
| Total Households | 636 (100.0%) | 2.45 |
Household Size by Marriage Status in Shell Lake
Out of a total of 636 households in Shell Lake, 409 (64.3%) are family households, while 227 (35.7%) are nonfamily households. The most numerous type of family households are 2-person households, comprising 219, and the most common type of nonfamily households are 1-person households, comprising 190.
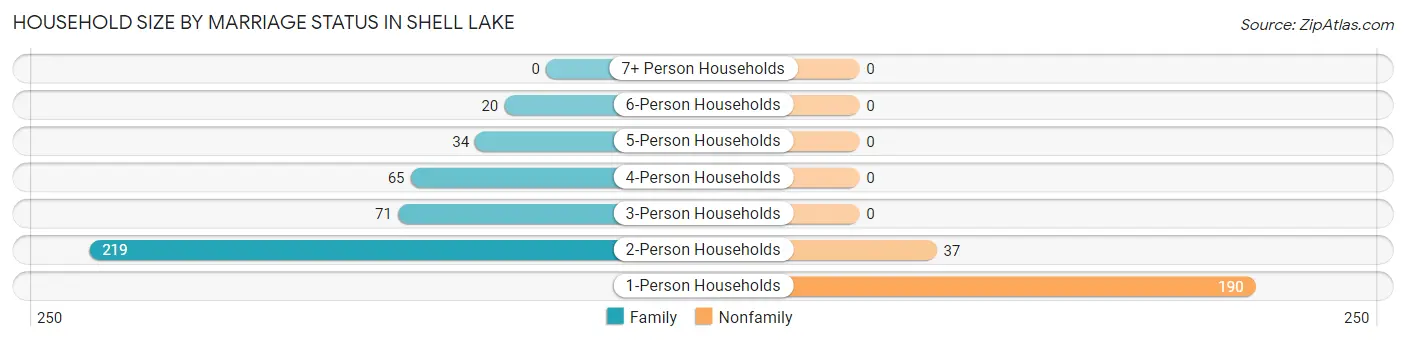
| Household Size | Family Households | Nonfamily Households |
| 1-Person Households | - | 190 (29.9%) |
| 2-Person Households | 219 (34.4%) | 37 (5.8%) |
| 3-Person Households | 71 (11.2%) | 0 (0.0%) |
| 4-Person Households | 65 (10.2%) | 0 (0.0%) |
| 5-Person Households | 34 (5.3%) | 0 (0.0%) |
| 6-Person Households | 20 (3.1%) | 0 (0.0%) |
| 7+ Person Households | 0 (0.0%) | 0 (0.0%) |
| Total | 409 (64.3%) | 227 (35.7%) |
Female Fertility in Shell Lake
Fertility by Age in Shell Lake
Average fertility rate in Shell Lake is 23.0 births per 1,000 women. Women in the age bracket of 20 to 34 years have the highest fertility rate with 53.0 births per 1,000 women. Women in the age bracket of 20 to 34 years acount for 100.0% of all women with births.
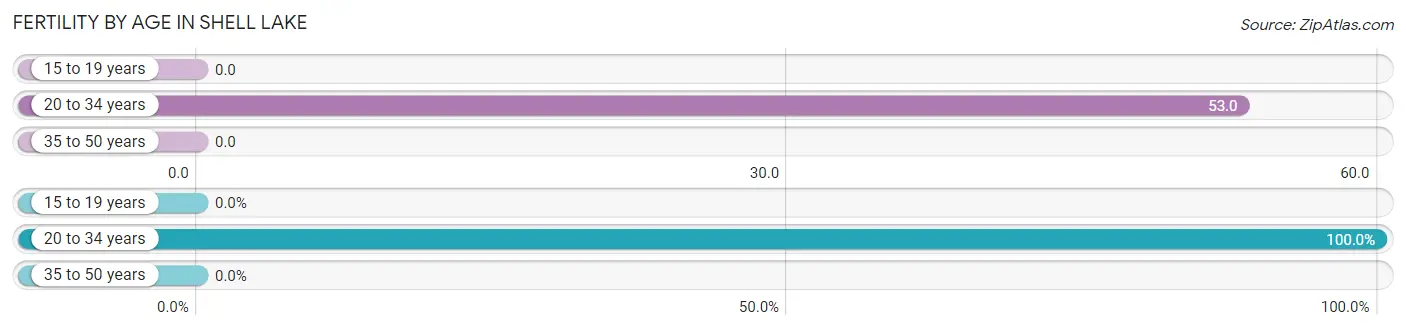
| Age Bracket | Women with Births | Births / 1,000 Women |
| 15 to 19 years | 0 (0.0%) | 0.0 |
| 20 to 34 years | 9 (100.0%) | 53.0 |
| 35 to 50 years | 0 (0.0%) | 0.0 |
| Total | 9 (100.0%) | 23.0 |
Fertility by Age by Marriage Status in Shell Lake
44.4% of women with births (9) in Shell Lake are married. The highest percentage of unmarried women with births falls into 20 to 34 years age bracket with 55.6% of them unmarried at the time of birth, while the lowest percentage of unmarried women with births belong to 20 to 34 years age bracket with 55.6% of them unmarried.
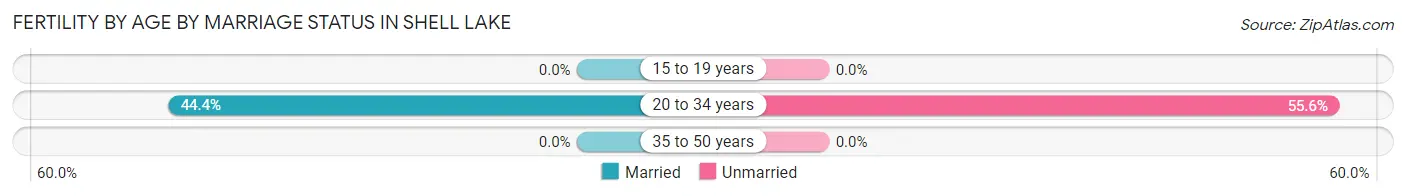
| Age Bracket | Married | Unmarried |
| 15 to 19 years | 0 (0.0%) | 0 (0.0%) |
| 20 to 34 years | 4 (44.4%) | 5 (55.6%) |
| 35 to 50 years | 0 (0.0%) | 0 (0.0%) |
| Total | 4 (44.4%) | 5 (55.6%) |
Fertility by Education in Shell Lake
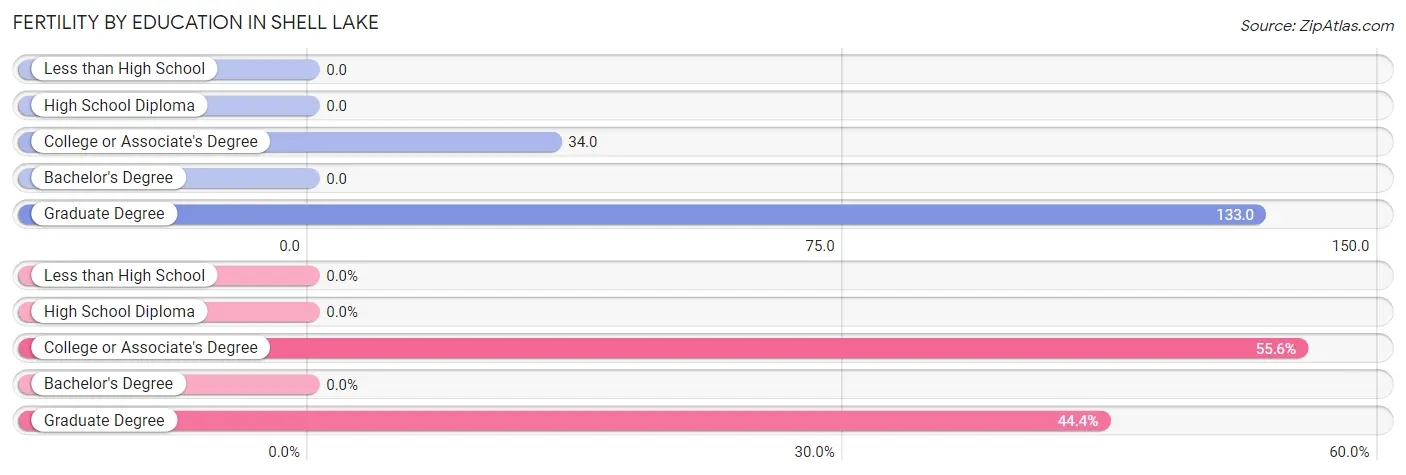
| Educational Attainment | Women with Births | Births / 1,000 Women |
| Less than High School | 0 (0.0%) | 0.0 |
| High School Diploma | 0 (0.0%) | 0.0 |
| College or Associate's Degree | 5 (55.6%) | 34.0 |
| Bachelor's Degree | 0 (0.0%) | 0.0 |
| Graduate Degree | 4 (44.4%) | 133.0 |
| Total | 9 (100.0%) | 23.0 |
Fertility by Education by Marriage Status in Shell Lake
55.6% of women with births in Shell Lake are unmarried. Women with the educational attainment of graduate degree are most likely to be married with 100.0% of them married at childbirth, while women with the educational attainment of college or associate's degree are least likely to be married with 100.0% of them unmarried at childbirth.
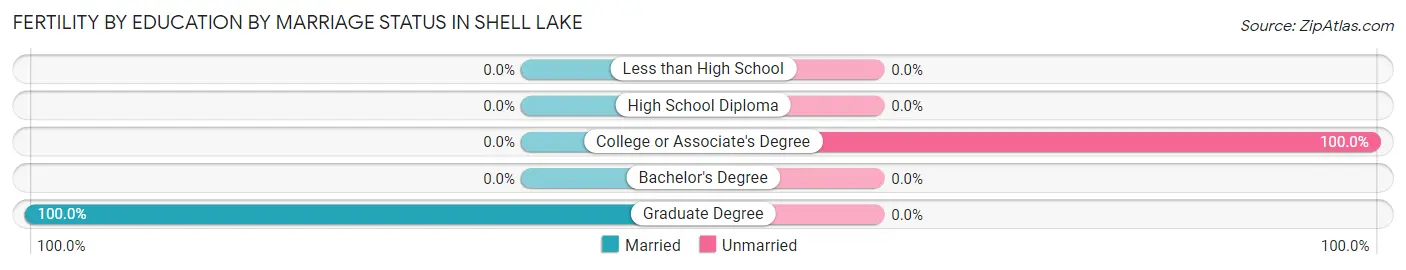
| Educational Attainment | Married | Unmarried |
| Less than High School | 0 (0.0%) | 0 (0.0%) |
| High School Diploma | 0 (0.0%) | 0 (0.0%) |
| College or Associate's Degree | 0 (0.0%) | 5 (100.0%) |
| Bachelor's Degree | 0 (0.0%) | 0 (0.0%) |
| Graduate Degree | 4 (100.0%) | 0 (0.0%) |
| Total | 4 (44.4%) | 5 (55.6%) |
Employment Characteristics in Shell Lake
Employment by Class of Employer in Shell Lake
Among the 610 employed individuals in Shell Lake, private company employees (328 | 53.8%), local government employees (73 | 12.0%), and not-for-profit organizations (72 | 11.8%) make up the most common classes of employment.
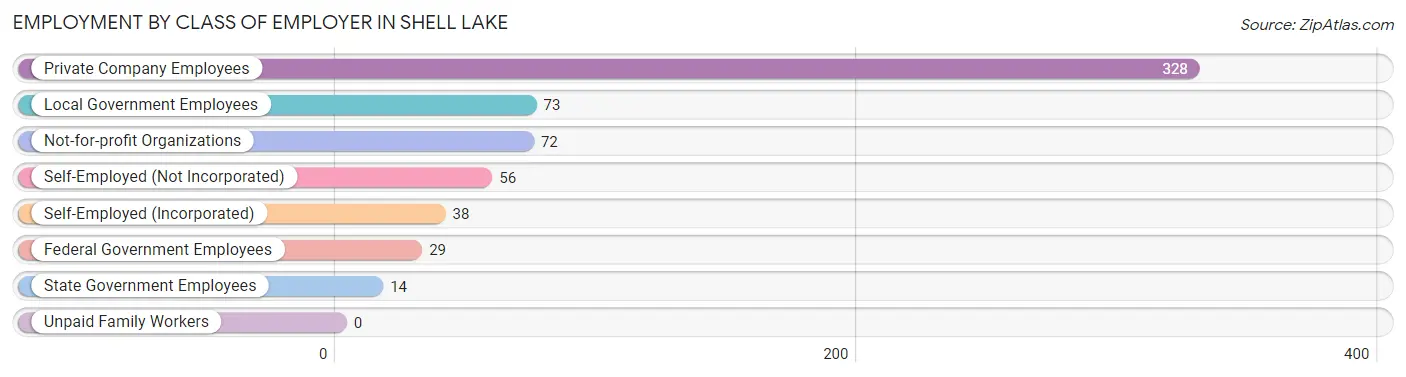
| Employer Class | # Employees | % Employees |
| Private Company Employees | 328 | 53.8% |
| Self-Employed (Incorporated) | 38 | 6.2% |
| Self-Employed (Not Incorporated) | 56 | 9.2% |
| Not-for-profit Organizations | 72 | 11.8% |
| Local Government Employees | 73 | 12.0% |
| State Government Employees | 14 | 2.3% |
| Federal Government Employees | 29 | 4.8% |
| Unpaid Family Workers | 0 | 0.0% |
| Total | 610 | 100.0% |
Employment Status by Age in Shell Lake
According to the labor force statistics for Shell Lake, out of the total population over 16 years of age (1,295), 49.5% or 641 individuals are in the labor force, with 3.3% or 21 of them unemployed. The age group with the highest labor force participation rate is 30 to 34 years, with 87.1% or 61 individuals in the labor force. Within the labor force, the 30 to 34 years age range has the highest percentage of unemployed individuals, with 18.0% or 11 of them being unemployed.
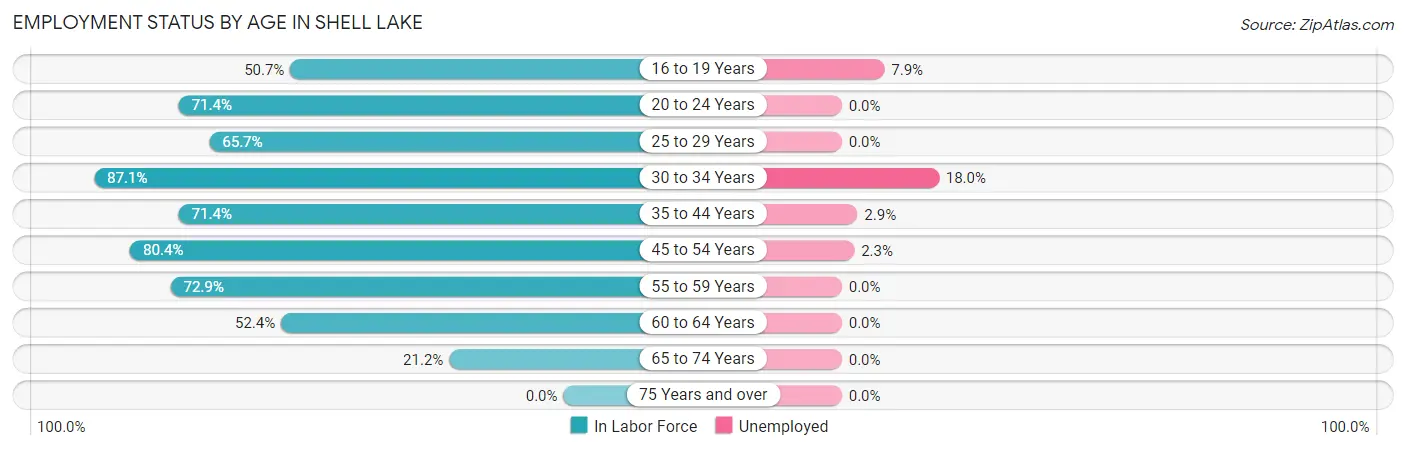
| Age Bracket | In Labor Force | Unemployed |
| 16 to 19 Years | 38 (50.7%) | 3 (7.9%) |
| 20 to 24 Years | 70 (71.4%) | 0 (0.0%) |
| 25 to 29 Years | 46 (65.7%) | 0 (0.0%) |
| 30 to 34 Years | 61 (87.1%) | 11 (18.0%) |
| 35 to 44 Years | 137 (71.4%) | 4 (2.9%) |
| 45 to 54 Years | 131 (80.4%) | 3 (2.3%) |
| 55 to 59 Years | 51 (72.9%) | 0 (0.0%) |
| 60 to 64 Years | 55 (52.4%) | 0 (0.0%) |
| 65 to 74 Years | 52 (21.2%) | 0 (0.0%) |
| 75 Years and over | 0 (0.0%) | 0 (0.0%) |
| Total | 641 (49.5%) | 21 (3.3%) |
Employment Status by Educational Attainment in Shell Lake
According to labor force statistics for Shell Lake, 71.8% of individuals (481) out of the total population between 25 and 64 years of age (670) are in the labor force, with 3.7% or 18 of them being unemployed. The group with the highest labor force participation rate are those with the educational attainment of bachelor's degree or higher, with 77.1% or 138 individuals in the labor force. Within the labor force, individuals with high school diploma education have the highest percentage of unemployment, with 6.5% or 7 of them being unemployed.
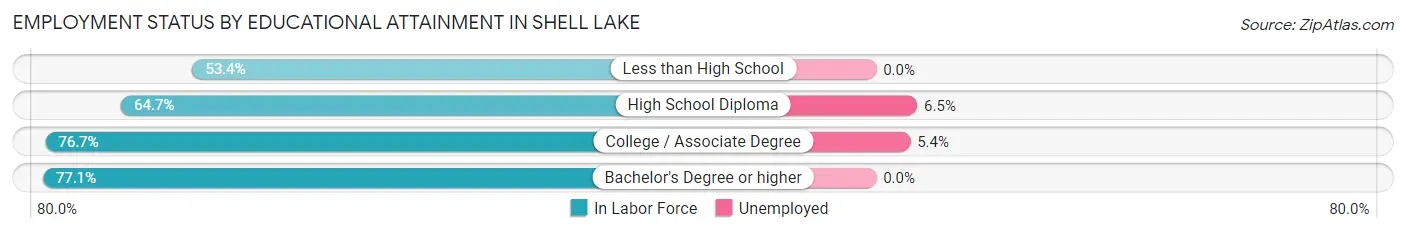
| Educational Attainment | In Labor Force | Unemployed |
| Less than High School | 31 (53.4%) | 0 (0.0%) |
| High School Diploma | 108 (64.7%) | 11 (6.5%) |
| College / Associate Degree | 204 (76.7%) | 14 (5.4%) |
| Bachelor's Degree or higher | 138 (77.1%) | 0 (0.0%) |
| Total | 481 (71.8%) | 25 (3.7%) |
Employment Occupations by Sex in Shell Lake
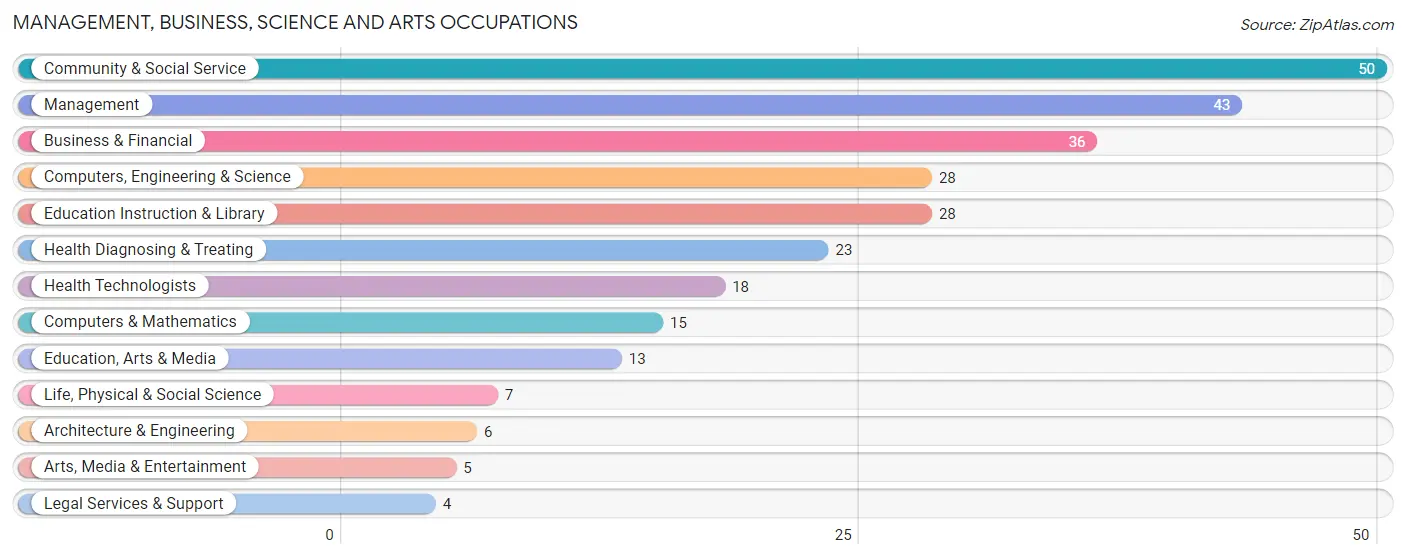
Management, Business, Science and Arts Occupations
The most common Management, Business, Science and Arts occupations in Shell Lake are Community & Social Service (50 | 8.1%), Management (43 | 6.9%), Business & Financial (36 | 5.8%), Computers, Engineering & Science (28 | 4.5%), and Education Instruction & Library (28 | 4.5%).
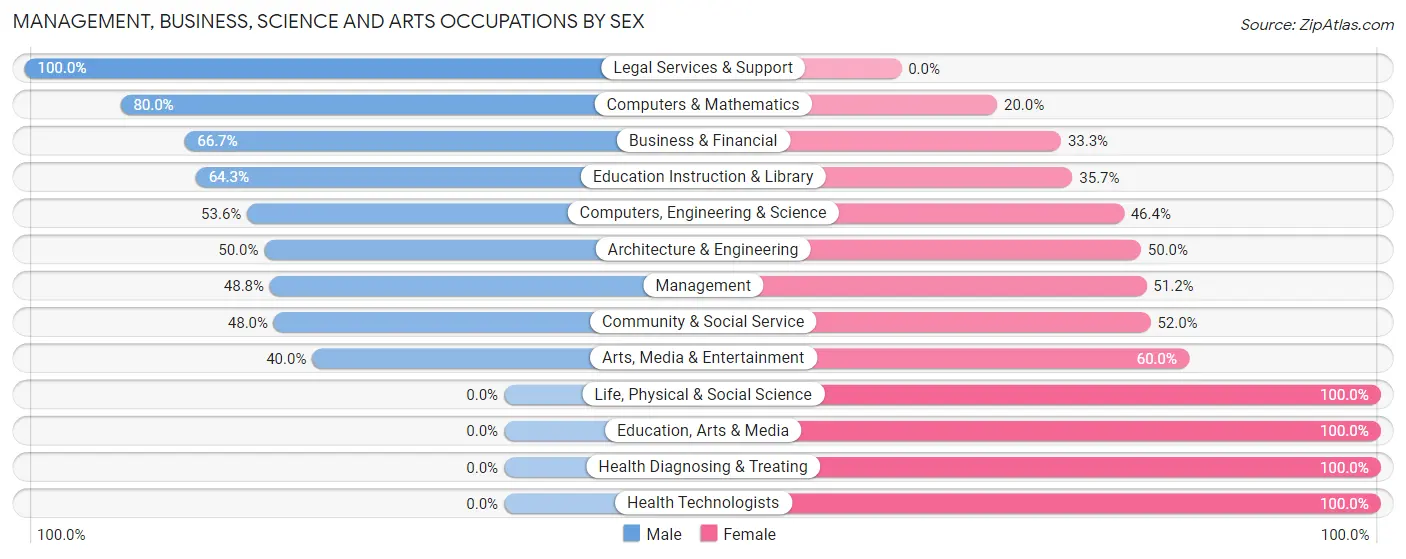
Management, Business, Science and Arts Occupations by Sex
Within the Management, Business, Science and Arts occupations in Shell Lake, the most male-oriented occupations are Legal Services & Support (100.0%), Computers & Mathematics (80.0%), and Business & Financial (66.7%), while the most female-oriented occupations are Life, Physical & Social Science (100.0%), Education, Arts & Media (100.0%), and Health Diagnosing & Treating (100.0%).
| Occupation | Male | Female |
| Management | 21 (48.8%) | 22 (51.2%) |
| Business & Financial | 24 (66.7%) | 12 (33.3%) |
| Computers, Engineering & Science | 15 (53.6%) | 13 (46.4%) |
| Computers & Mathematics | 12 (80.0%) | 3 (20.0%) |
| Architecture & Engineering | 3 (50.0%) | 3 (50.0%) |
| Life, Physical & Social Science | 0 (0.0%) | 7 (100.0%) |
| Community & Social Service | 24 (48.0%) | 26 (52.0%) |
| Education, Arts & Media | 0 (0.0%) | 13 (100.0%) |
| Legal Services & Support | 4 (100.0%) | 0 (0.0%) |
| Education Instruction & Library | 18 (64.3%) | 10 (35.7%) |
| Arts, Media & Entertainment | 2 (40.0%) | 3 (60.0%) |
| Health Diagnosing & Treating | 0 (0.0%) | 23 (100.0%) |
| Health Technologists | 0 (0.0%) | 18 (100.0%) |
| Total (Category) | 84 (46.7%) | 96 (53.3%) |
| Total (Overall) | 258 (41.6%) | 362 (58.4%) |
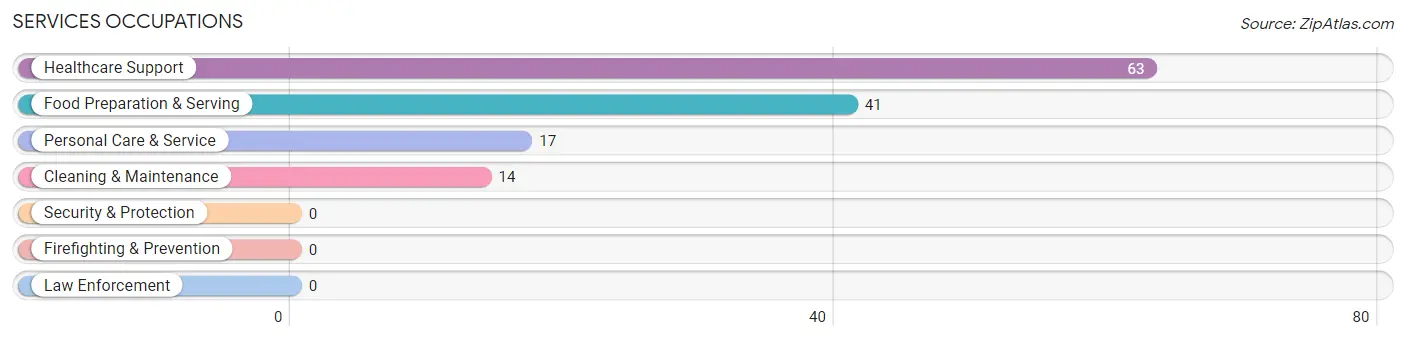
Services Occupations
The most common Services occupations in Shell Lake are Healthcare Support (63 | 10.2%), Food Preparation & Serving (41 | 6.6%), Personal Care & Service (17 | 2.7%), and Cleaning & Maintenance (14 | 2.3%).
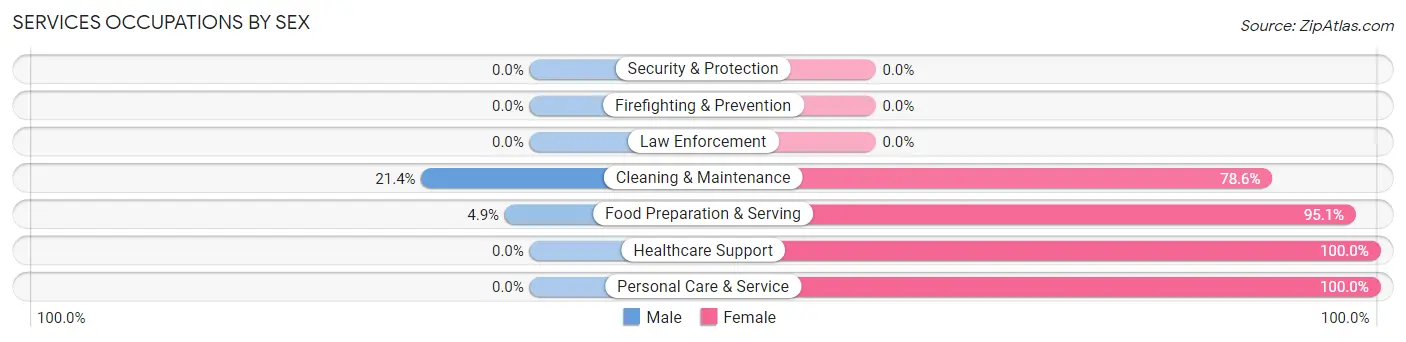
Services Occupations by Sex
Within the Services occupations in Shell Lake, the most male-oriented occupations are Cleaning & Maintenance (21.4%), and Food Preparation & Serving (4.9%), while the most female-oriented occupations are Healthcare Support (100.0%), Personal Care & Service (100.0%), and Food Preparation & Serving (95.1%).
| Occupation | Male | Female |
| Healthcare Support | 0 (0.0%) | 63 (100.0%) |
| Security & Protection | 0 (0.0%) | 0 (0.0%) |
| Firefighting & Prevention | 0 (0.0%) | 0 (0.0%) |
| Law Enforcement | 0 (0.0%) | 0 (0.0%) |
| Food Preparation & Serving | 2 (4.9%) | 39 (95.1%) |
| Cleaning & Maintenance | 3 (21.4%) | 11 (78.6%) |
| Personal Care & Service | 0 (0.0%) | 17 (100.0%) |
| Total (Category) | 5 (3.7%) | 130 (96.3%) |
| Total (Overall) | 258 (41.6%) | 362 (58.4%) |
Sales and Office Occupations
The most common Sales and Office occupations in Shell Lake are Sales & Related (96 | 15.5%), and Office & Administration (70 | 11.3%).
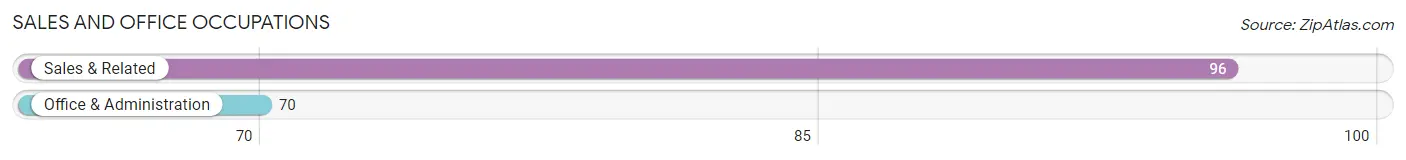
Sales and Office Occupations by Sex
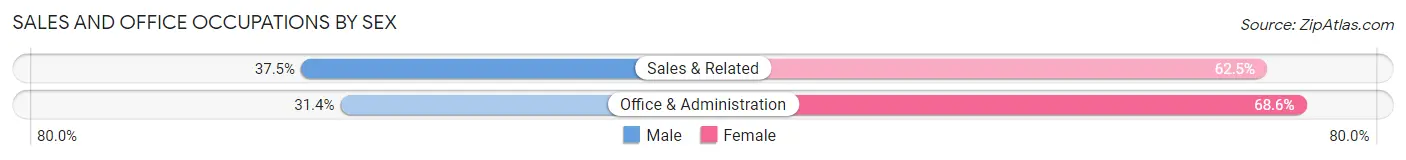
| Occupation | Male | Female |
| Sales & Related | 36 (37.5%) | 60 (62.5%) |
| Office & Administration | 22 (31.4%) | 48 (68.6%) |
| Total (Category) | 58 (34.9%) | 108 (65.1%) |
| Total (Overall) | 258 (41.6%) | 362 (58.4%) |
Natural Resources, Construction and Maintenance Occupations
The most common Natural Resources, Construction and Maintenance occupations in Shell Lake are Installation, Maintenance & Repair (52 | 8.4%), Construction & Extraction (18 | 2.9%), and Farming, Fishing & Forestry (9 | 1.5%).
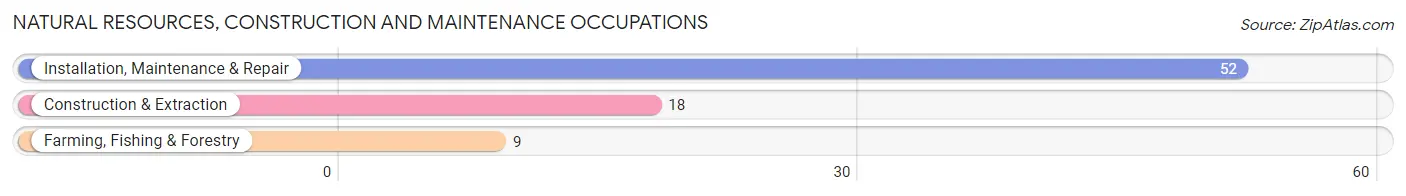
Natural Resources, Construction and Maintenance Occupations by Sex
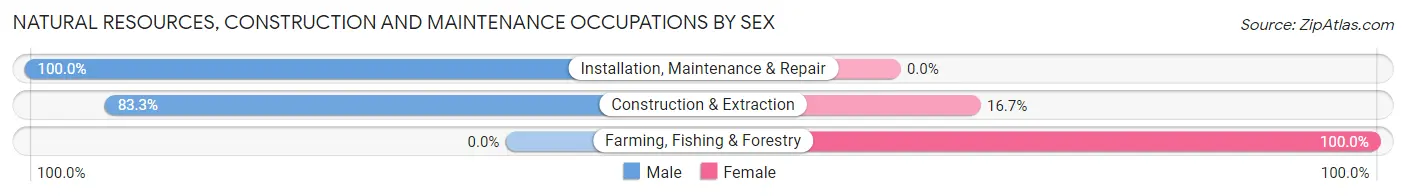
| Occupation | Male | Female |
| Farming, Fishing & Forestry | 0 (0.0%) | 9 (100.0%) |
| Construction & Extraction | 15 (83.3%) | 3 (16.7%) |
| Installation, Maintenance & Repair | 52 (100.0%) | 0 (0.0%) |
| Total (Category) | 67 (84.8%) | 12 (15.2%) |
| Total (Overall) | 258 (41.6%) | 362 (58.4%) |
Production, Transportation and Moving Occupations
The most common Production, Transportation and Moving occupations in Shell Lake are Material Moving (25 | 4.0%), Production (20 | 3.2%), and Transportation (15 | 2.4%).
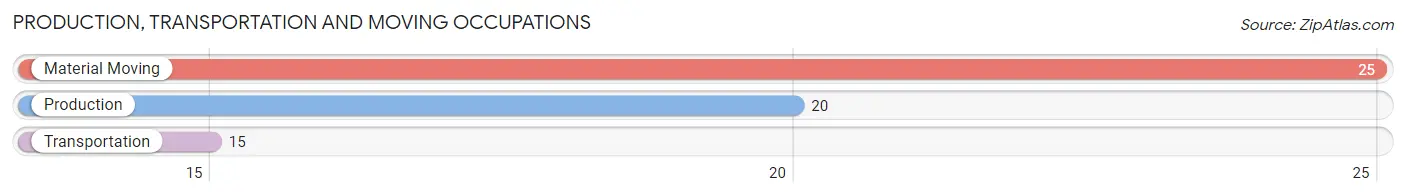
Production, Transportation and Moving Occupations by Sex
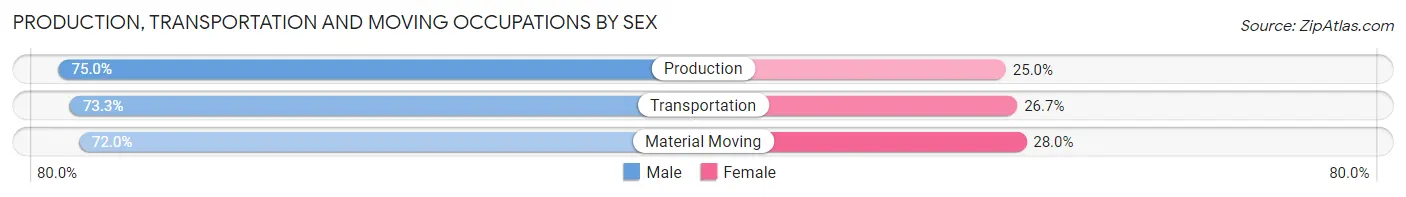
| Occupation | Male | Female |
| Production | 15 (75.0%) | 5 (25.0%) |
| Transportation | 11 (73.3%) | 4 (26.7%) |
| Material Moving | 18 (72.0%) | 7 (28.0%) |
| Total (Category) | 44 (73.3%) | 16 (26.7%) |
| Total (Overall) | 258 (41.6%) | 362 (58.4%) |
Employment Industries by Sex in Shell Lake
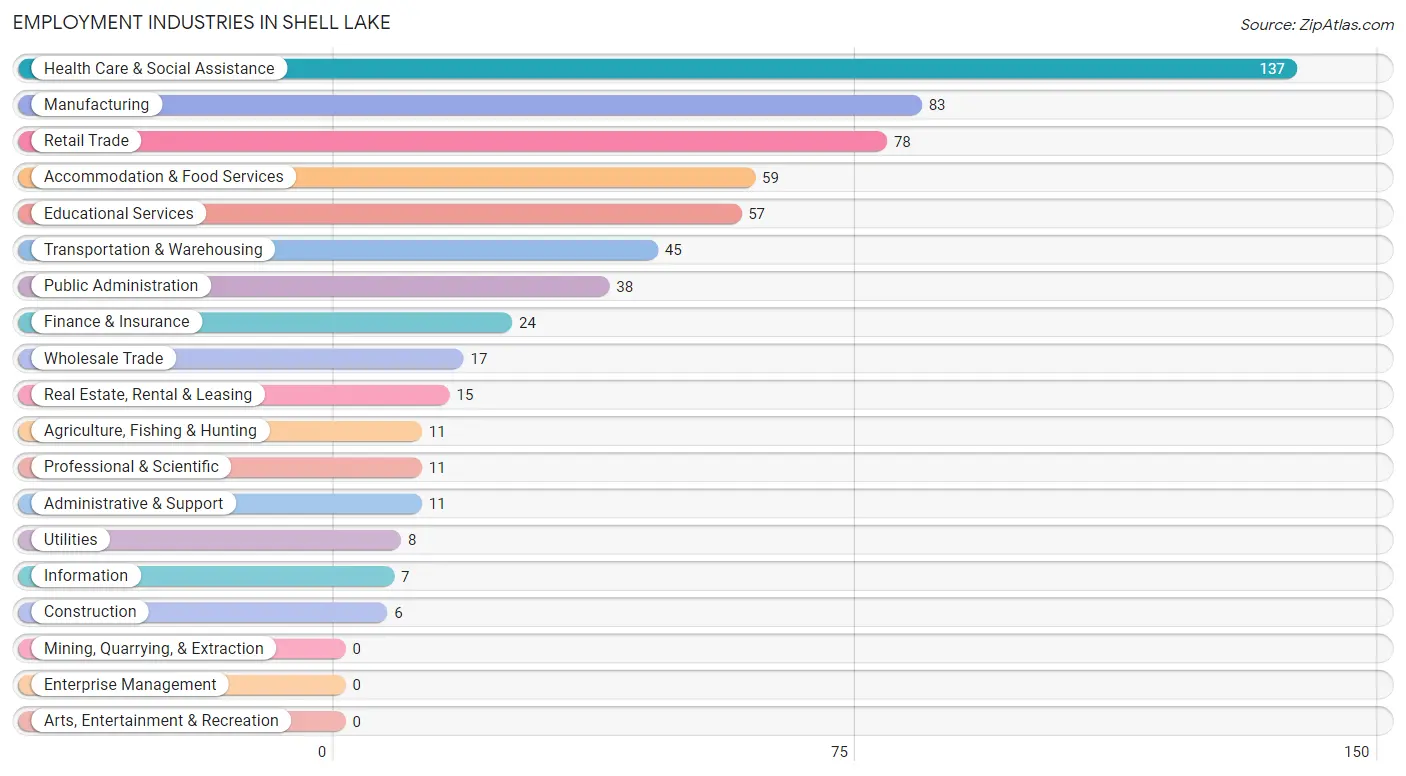
Employment Industries in Shell Lake
The major employment industries in Shell Lake include Health Care & Social Assistance (137 | 22.1%), Manufacturing (83 | 13.4%), Retail Trade (78 | 12.6%), Accommodation & Food Services (59 | 9.5%), and Educational Services (57 | 9.2%).
Employment Industries by Sex in Shell Lake
The Shell Lake industries that see more men than women are Construction (100.0%), Utilities (100.0%), and Professional & Scientific (100.0%), whereas the industries that tend to have a higher number of women are Information (100.0%), Accommodation & Food Services (96.6%), and Health Care & Social Assistance (86.1%).
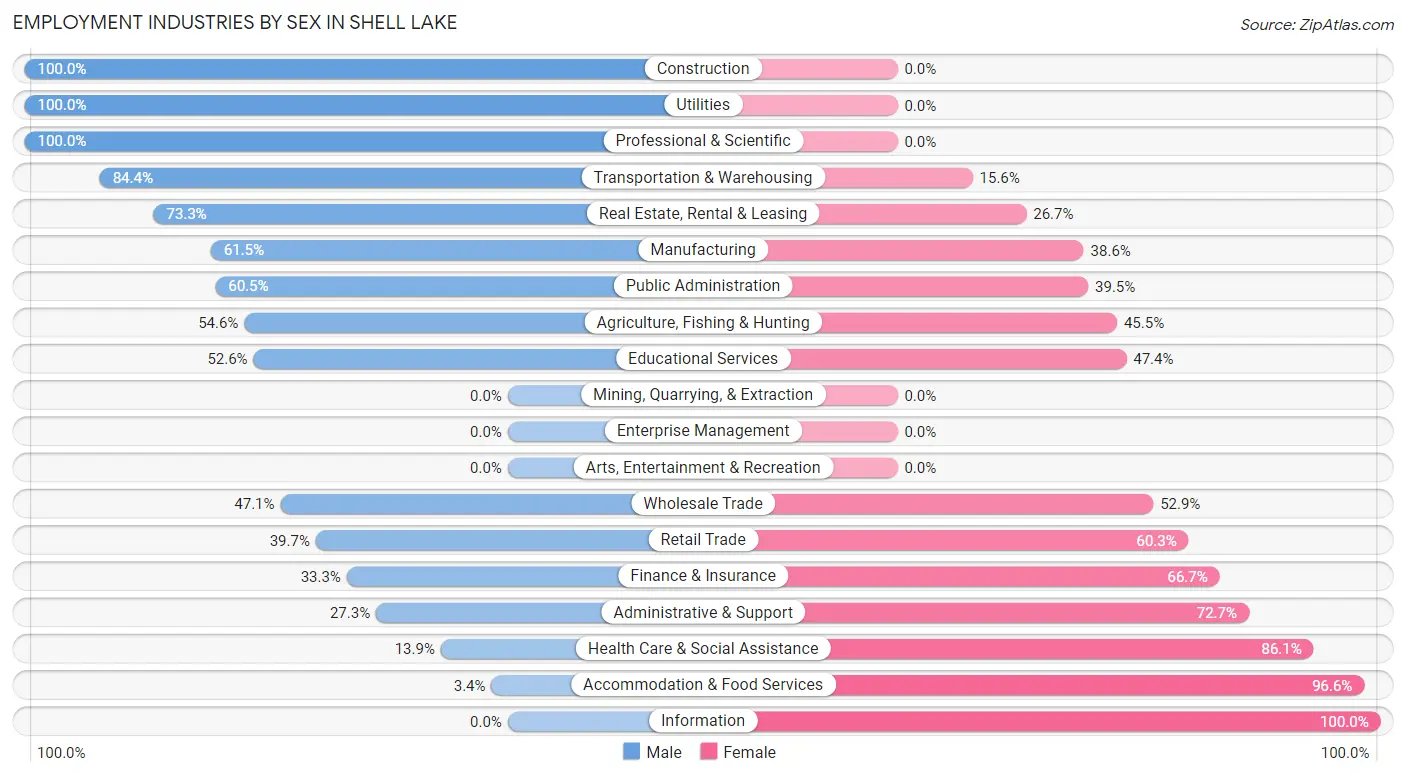
| Industry | Male | Female |
| Agriculture, Fishing & Hunting | 6 (54.5%) | 5 (45.5%) |
| Mining, Quarrying, & Extraction | 0 (0.0%) | 0 (0.0%) |
| Construction | 6 (100.0%) | 0 (0.0%) |
| Manufacturing | 51 (61.5%) | 32 (38.6%) |
| Wholesale Trade | 8 (47.1%) | 9 (52.9%) |
| Retail Trade | 31 (39.7%) | 47 (60.3%) |
| Transportation & Warehousing | 38 (84.4%) | 7 (15.6%) |
| Utilities | 8 (100.0%) | 0 (0.0%) |
| Information | 0 (0.0%) | 7 (100.0%) |
| Finance & Insurance | 8 (33.3%) | 16 (66.7%) |
| Real Estate, Rental & Leasing | 11 (73.3%) | 4 (26.7%) |
| Professional & Scientific | 11 (100.0%) | 0 (0.0%) |
| Enterprise Management | 0 (0.0%) | 0 (0.0%) |
| Administrative & Support | 3 (27.3%) | 8 (72.7%) |
| Educational Services | 30 (52.6%) | 27 (47.4%) |
| Health Care & Social Assistance | 19 (13.9%) | 118 (86.1%) |
| Arts, Entertainment & Recreation | 0 (0.0%) | 0 (0.0%) |
| Accommodation & Food Services | 2 (3.4%) | 57 (96.6%) |
| Public Administration | 23 (60.5%) | 15 (39.5%) |
| Total | 258 (41.6%) | 362 (58.4%) |
Education in Shell Lake
School Enrollment in Shell Lake
The most common levels of schooling among the 454 students in Shell Lake are high school (136 | 30.0%), elementary school (90 | 19.8%), and middle school (72 | 15.9%).
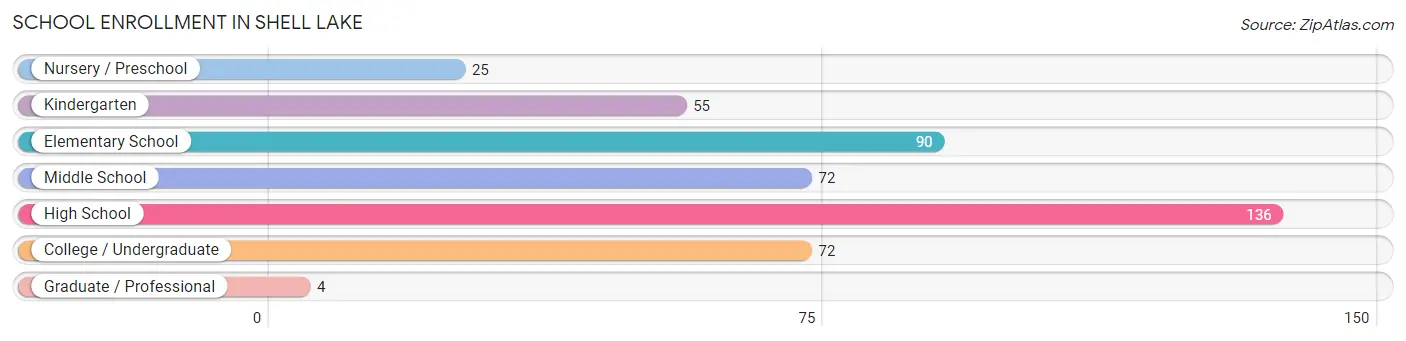
| School Level | # Students | % Students |
| Nursery / Preschool | 25 | 5.5% |
| Kindergarten | 55 | 12.1% |
| Elementary School | 90 | 19.8% |
| Middle School | 72 | 15.9% |
| High School | 136 | 30.0% |
| College / Undergraduate | 72 | 15.9% |
| Graduate / Professional | 4 | 0.9% |
| Total | 454 | 100.0% |
School Enrollment by Age by Funding Source in Shell Lake
Out of a total of 454 students who are enrolled in schools in Shell Lake, 28 (6.2%) attend a private institution, while the remaining 426 (93.8%) are enrolled in public schools. The age group of 25 to 34 year olds has the highest likelihood of being enrolled in private schools, with 14 (58.3% in the age bracket) enrolled. Conversely, the age group of 3 to 4 year olds has the lowest likelihood of being enrolled in a private school, with 25 (100.0% in the age bracket) attending a public institution.
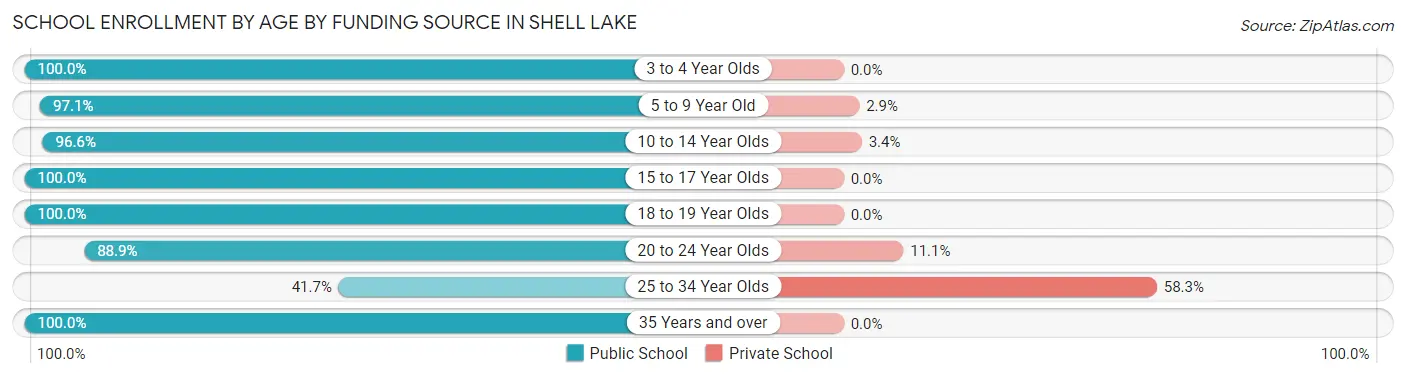
| Age Bracket | Public School | Private School |
| 3 to 4 Year Olds | 25 (100.0%) | 0 (0.0%) |
| 5 to 9 Year Old | 134 (97.1%) | 4 (2.9%) |
| 10 to 14 Year Olds | 115 (96.6%) | 4 (3.4%) |
| 15 to 17 Year Olds | 79 (100.0%) | 0 (0.0%) |
| 18 to 19 Year Olds | 11 (100.0%) | 0 (0.0%) |
| 20 to 24 Year Olds | 48 (88.9%) | 6 (11.1%) |
| 25 to 34 Year Olds | 10 (41.7%) | 14 (58.3%) |
| 35 Years and over | 4 (100.0%) | 0 (0.0%) |
| Total | 426 (93.8%) | 28 (6.2%) |
Educational Attainment by Field of Study in Shell Lake
Business (82 | 24.3%), education (40 | 11.9%), science & technology (36 | 10.7%), social sciences (33 | 9.8%), and engineering (26 | 7.7%) are the most common fields of study among 337 individuals in Shell Lake who have obtained a bachelor's degree or higher.
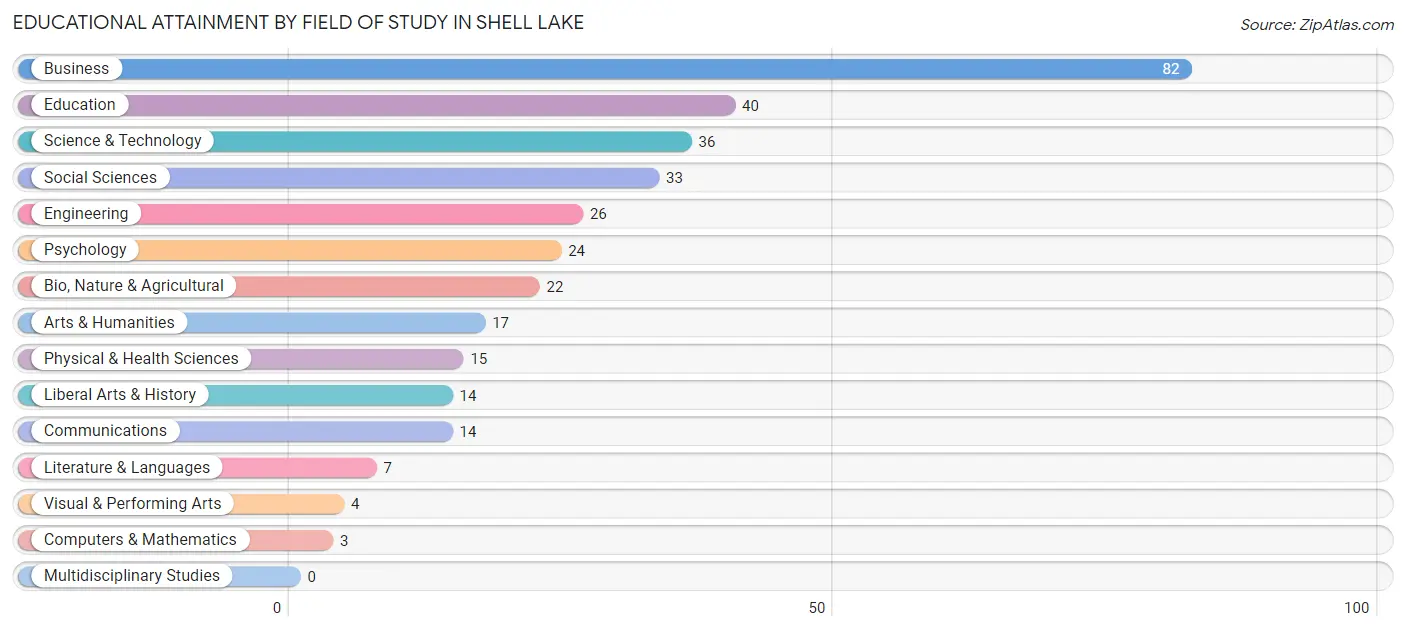
| Field of Study | # Graduates | % Graduates |
| Computers & Mathematics | 3 | 0.9% |
| Bio, Nature & Agricultural | 22 | 6.5% |
| Physical & Health Sciences | 15 | 4.4% |
| Psychology | 24 | 7.1% |
| Social Sciences | 33 | 9.8% |
| Engineering | 26 | 7.7% |
| Multidisciplinary Studies | 0 | 0.0% |
| Science & Technology | 36 | 10.7% |
| Business | 82 | 24.3% |
| Education | 40 | 11.9% |
| Literature & Languages | 7 | 2.1% |
| Liberal Arts & History | 14 | 4.2% |
| Visual & Performing Arts | 4 | 1.2% |
| Communications | 14 | 4.2% |
| Arts & Humanities | 17 | 5.0% |
| Total | 337 | 100.0% |
Transportation & Commute in Shell Lake
Vehicle Availability by Sex in Shell Lake
The most prevalent vehicle ownership categories in Shell Lake are males with 2 vehicles (133, accounting for 51.9%) and females with 2 vehicles (177, making up 37.6%).
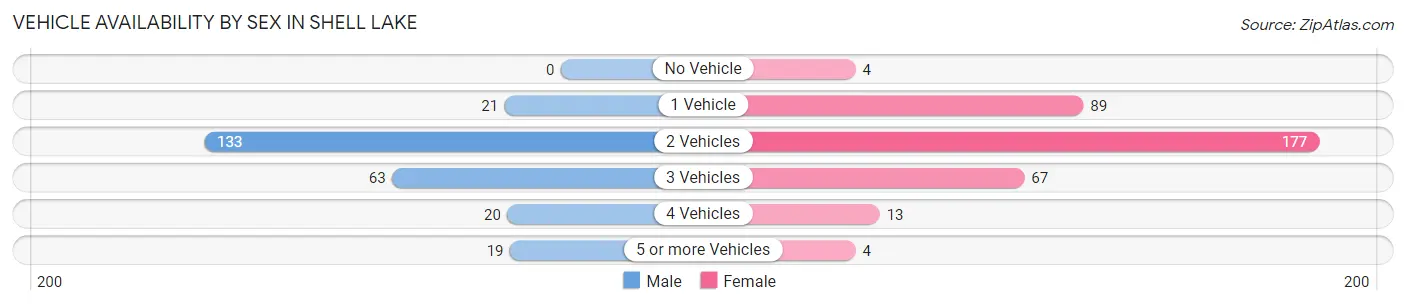
| Vehicles Available | Male | Female |
| No Vehicle | 0 (0.0%) | 4 (1.1%) |
| 1 Vehicle | 21 (8.2%) | 89 (25.1%) |
| 2 Vehicles | 133 (51.9%) | 177 (50.0%) |
| 3 Vehicles | 63 (24.6%) | 67 (18.9%) |
| 4 Vehicles | 20 (7.8%) | 13 (3.7%) |
| 5 or more Vehicles | 19 (7.4%) | 4 (1.1%) |
| Total | 256 (100.0%) | 354 (100.0%) |
Commute Time in Shell Lake
The most frequently occuring commute durations in Shell Lake are 5 to 9 minutes (131 commuters, 23.6%), 15 to 19 minutes (101 commuters, 18.2%), and 10 to 14 minutes (97 commuters, 17.5%).
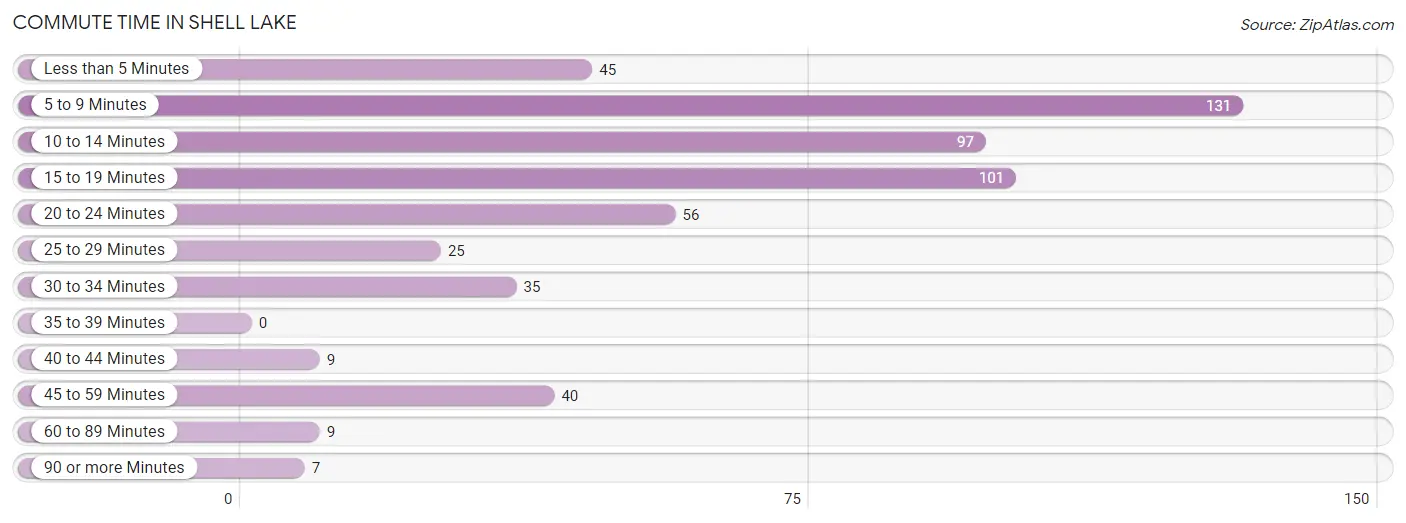
| Commute Time | # Commuters | % Commuters |
| Less than 5 Minutes | 45 | 8.1% |
| 5 to 9 Minutes | 131 | 23.6% |
| 10 to 14 Minutes | 97 | 17.5% |
| 15 to 19 Minutes | 101 | 18.2% |
| 20 to 24 Minutes | 56 | 10.1% |
| 25 to 29 Minutes | 25 | 4.5% |
| 30 to 34 Minutes | 35 | 6.3% |
| 35 to 39 Minutes | 0 | 0.0% |
| 40 to 44 Minutes | 9 | 1.6% |
| 45 to 59 Minutes | 40 | 7.2% |
| 60 to 89 Minutes | 9 | 1.6% |
| 90 or more Minutes | 7 | 1.3% |
Commute Time by Sex in Shell Lake
The most common commute times in Shell Lake are 5 to 9 minutes (66 commuters, 29.7%) for males and 10 to 14 minutes (69 commuters, 20.7%) for females.
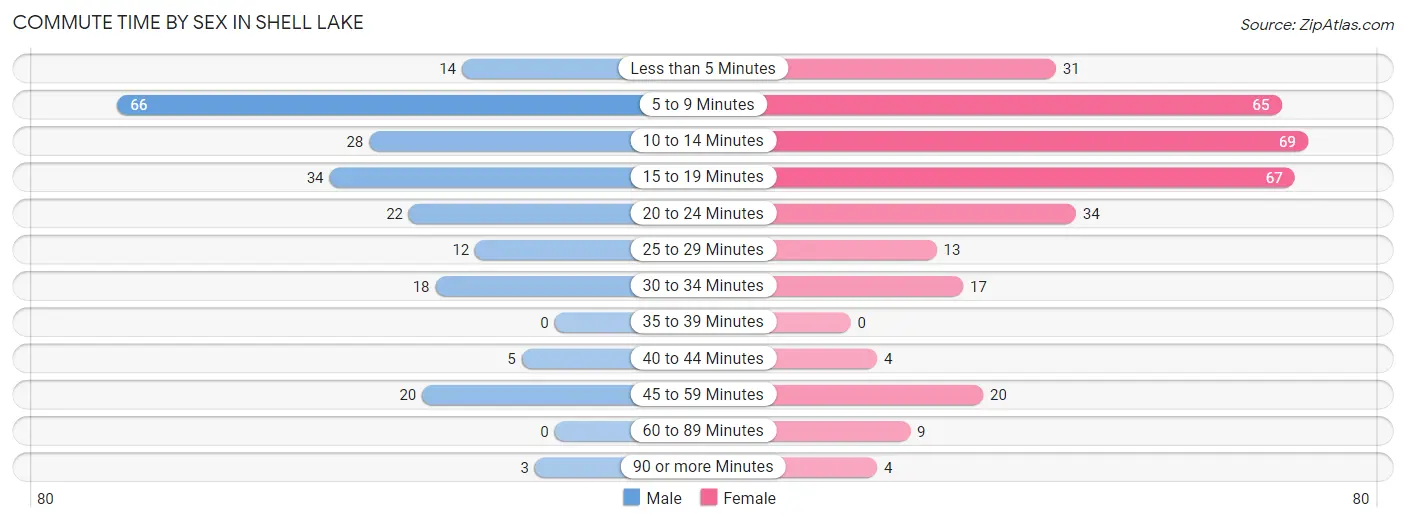
| Commute Time | Male | Female |
| Less than 5 Minutes | 14 (6.3%) | 31 (9.3%) |
| 5 to 9 Minutes | 66 (29.7%) | 65 (19.5%) |
| 10 to 14 Minutes | 28 (12.6%) | 69 (20.7%) |
| 15 to 19 Minutes | 34 (15.3%) | 67 (20.1%) |
| 20 to 24 Minutes | 22 (9.9%) | 34 (10.2%) |
| 25 to 29 Minutes | 12 (5.4%) | 13 (3.9%) |
| 30 to 34 Minutes | 18 (8.1%) | 17 (5.1%) |
| 35 to 39 Minutes | 0 (0.0%) | 0 (0.0%) |
| 40 to 44 Minutes | 5 (2.2%) | 4 (1.2%) |
| 45 to 59 Minutes | 20 (9.0%) | 20 (6.0%) |
| 60 to 89 Minutes | 0 (0.0%) | 9 (2.7%) |
| 90 or more Minutes | 3 (1.3%) | 4 (1.2%) |
Time of Departure to Work by Sex in Shell Lake
The most frequent times of departure to work in Shell Lake are 6:30 AM to 6:59 AM (37, 16.7%) for males and 7:00 AM to 7:29 AM (67, 20.1%) for females.
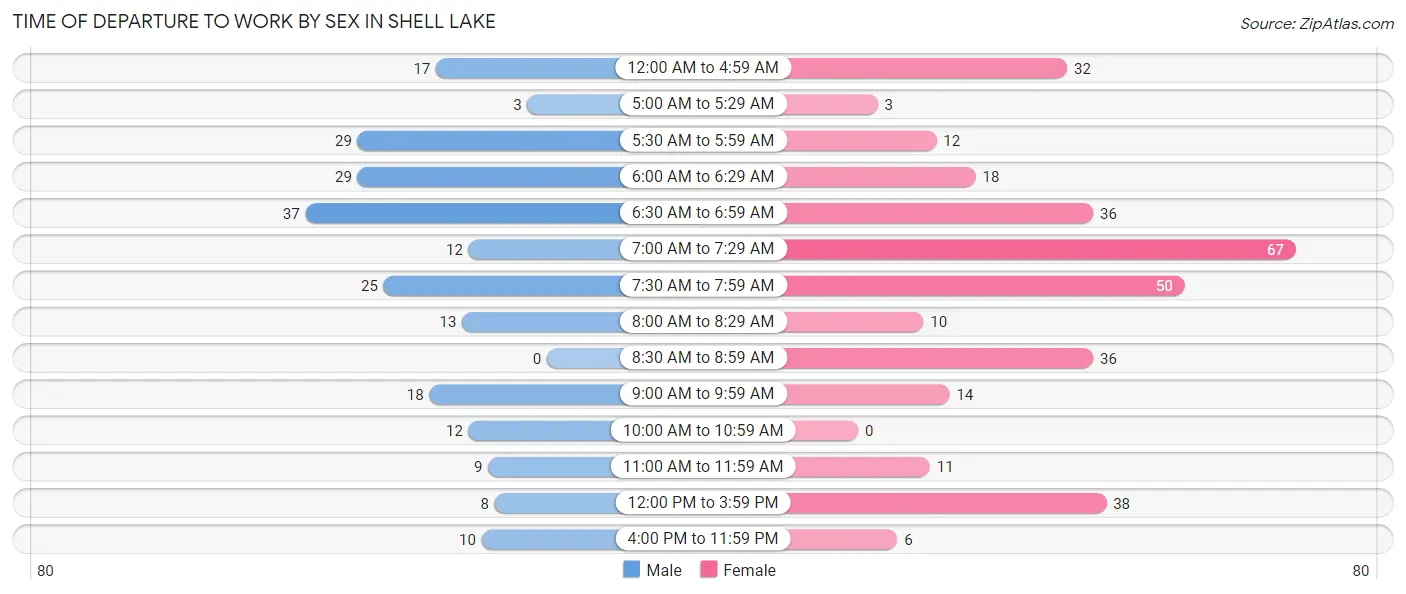
| Time of Departure | Male | Female |
| 12:00 AM to 4:59 AM | 17 (7.7%) | 32 (9.6%) |
| 5:00 AM to 5:29 AM | 3 (1.3%) | 3 (0.9%) |
| 5:30 AM to 5:59 AM | 29 (13.1%) | 12 (3.6%) |
| 6:00 AM to 6:29 AM | 29 (13.1%) | 18 (5.4%) |
| 6:30 AM to 6:59 AM | 37 (16.7%) | 36 (10.8%) |
| 7:00 AM to 7:29 AM | 12 (5.4%) | 67 (20.1%) |
| 7:30 AM to 7:59 AM | 25 (11.3%) | 50 (15.0%) |
| 8:00 AM to 8:29 AM | 13 (5.9%) | 10 (3.0%) |
| 8:30 AM to 8:59 AM | 0 (0.0%) | 36 (10.8%) |
| 9:00 AM to 9:59 AM | 18 (8.1%) | 14 (4.2%) |
| 10:00 AM to 10:59 AM | 12 (5.4%) | 0 (0.0%) |
| 11:00 AM to 11:59 AM | 9 (4.1%) | 11 (3.3%) |
| 12:00 PM to 3:59 PM | 8 (3.6%) | 38 (11.4%) |
| 4:00 PM to 11:59 PM | 10 (4.5%) | 6 (1.8%) |
| Total | 222 (100.0%) | 333 (100.0%) |
Housing Occupancy in Shell Lake
Occupancy by Ownership in Shell Lake
Of the total 636 dwellings in Shell Lake, owner-occupied units account for 456 (71.7%), while renter-occupied units make up 180 (28.3%).
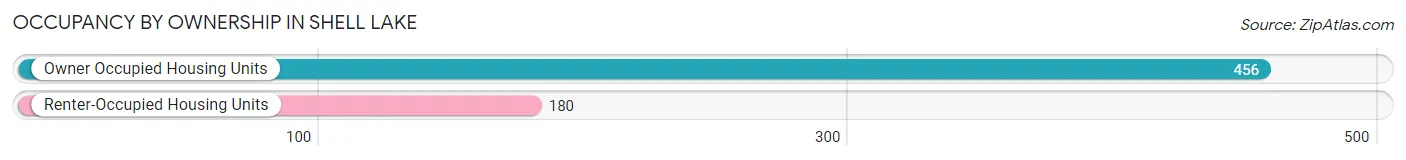
| Occupancy | # Housing Units | % Housing Units |
| Owner Occupied Housing Units | 456 | 71.7% |
| Renter-Occupied Housing Units | 180 | 28.3% |
| Total Occupied Housing Units | 636 | 100.0% |
Occupancy by Household Size in Shell Lake
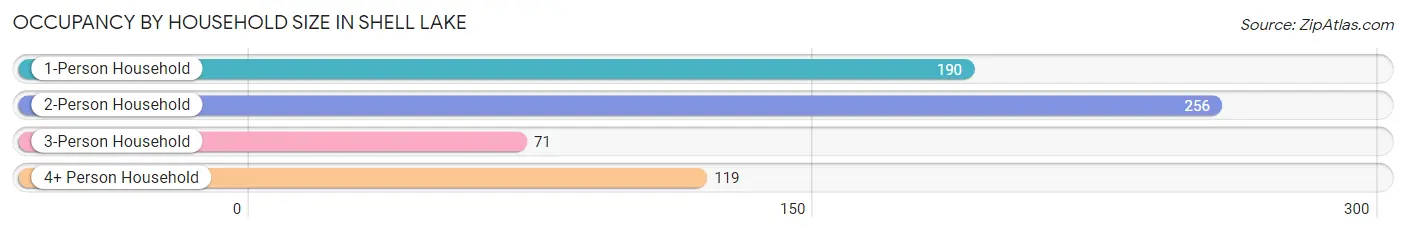
| Household Size | # Housing Units | % Housing Units |
| 1-Person Household | 190 | 29.9% |
| 2-Person Household | 256 | 40.3% |
| 3-Person Household | 71 | 11.2% |
| 4+ Person Household | 119 | 18.7% |
| Total Housing Units | 636 | 100.0% |
Occupancy by Ownership by Household Size in Shell Lake
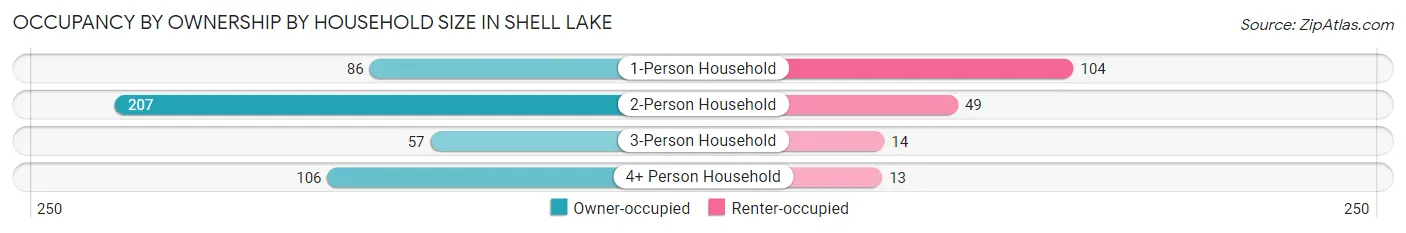
| Household Size | Owner-occupied | Renter-occupied |
| 1-Person Household | 86 (45.3%) | 104 (54.7%) |
| 2-Person Household | 207 (80.9%) | 49 (19.1%) |
| 3-Person Household | 57 (80.3%) | 14 (19.7%) |
| 4+ Person Household | 106 (89.1%) | 13 (10.9%) |
| Total Housing Units | 456 (71.7%) | 180 (28.3%) |
Occupancy by Educational Attainment in Shell Lake
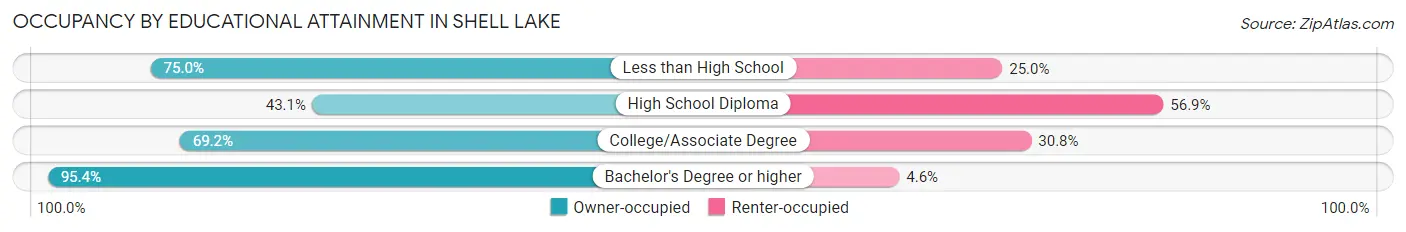
| Household Size | Owner-occupied | Renter-occupied |
| Less than High School | 27 (75.0%) | 9 (25.0%) |
| High School Diploma | 62 (43.1%) | 82 (56.9%) |
| College/Associate Degree | 180 (69.2%) | 80 (30.8%) |
| Bachelor's Degree or higher | 187 (95.4%) | 9 (4.6%) |
Occupancy by Age of Householder in Shell Lake
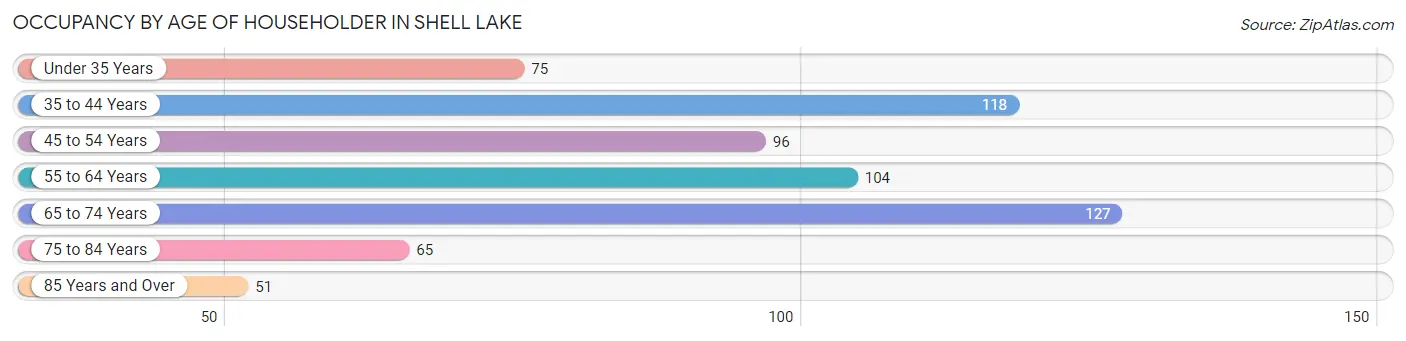
| Age Bracket | # Households | % Households |
| Under 35 Years | 75 | 11.8% |
| 35 to 44 Years | 118 | 18.5% |
| 45 to 54 Years | 96 | 15.1% |
| 55 to 64 Years | 104 | 16.4% |
| 65 to 74 Years | 127 | 20.0% |
| 75 to 84 Years | 65 | 10.2% |
| 85 Years and Over | 51 | 8.0% |
| Total | 636 | 100.0% |
Housing Finances in Shell Lake
Median Income by Occupancy in Shell Lake
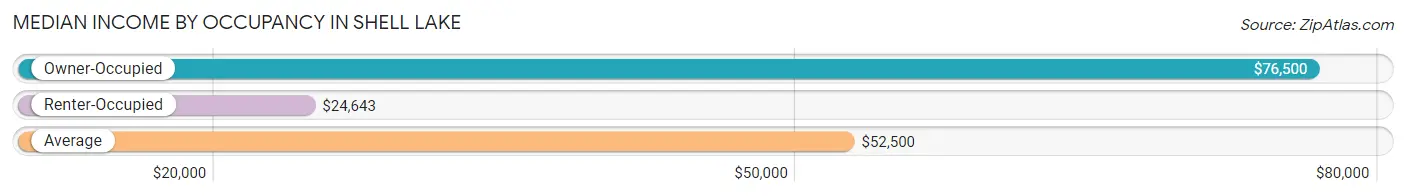
| Occupancy Type | # Households | Median Income |
| Owner-Occupied | 456 (71.7%) | $76,500 |
| Renter-Occupied | 180 (28.3%) | $24,643 |
| Average | 636 (100.0%) | $52,500 |
Occupancy by Householder Income Bracket in Shell Lake
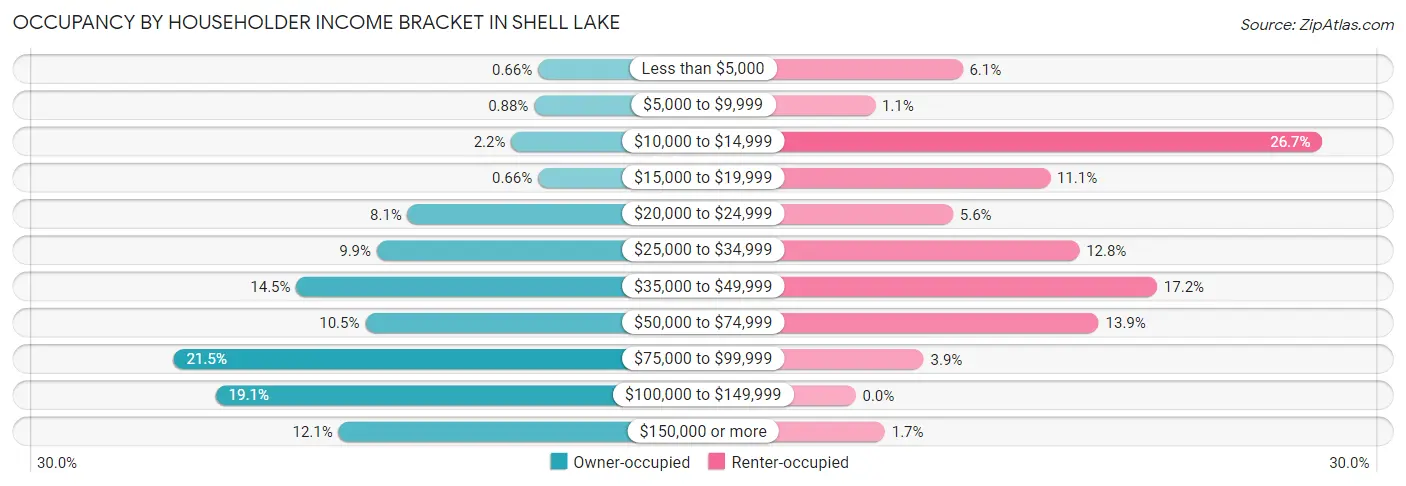
| Income Bracket | Owner-occupied | Renter-occupied |
| Less than $5,000 | 3 (0.7%) | 11 (6.1%) |
| $5,000 to $9,999 | 4 (0.9%) | 2 (1.1%) |
| $10,000 to $14,999 | 10 (2.2%) | 48 (26.7%) |
| $15,000 to $19,999 | 3 (0.7%) | 20 (11.1%) |
| $20,000 to $24,999 | 37 (8.1%) | 10 (5.6%) |
| $25,000 to $34,999 | 45 (9.9%) | 23 (12.8%) |
| $35,000 to $49,999 | 66 (14.5%) | 31 (17.2%) |
| $50,000 to $74,999 | 48 (10.5%) | 25 (13.9%) |
| $75,000 to $99,999 | 98 (21.5%) | 7 (3.9%) |
| $100,000 to $149,999 | 87 (19.1%) | 0 (0.0%) |
| $150,000 or more | 55 (12.1%) | 3 (1.7%) |
| Total | 456 (100.0%) | 180 (100.0%) |
Monthly Housing Cost Tiers in Shell Lake
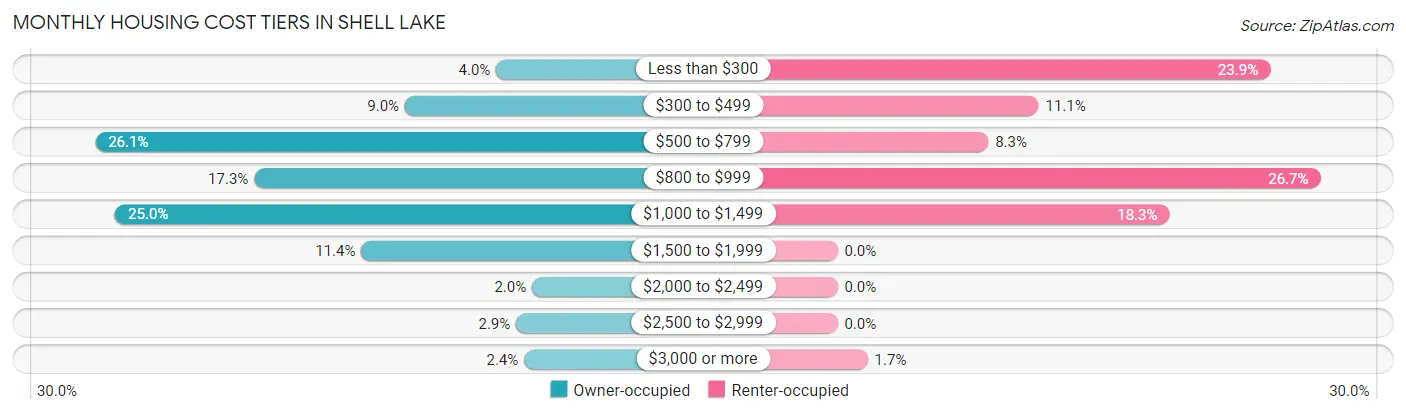
| Monthly Cost | Owner-occupied | Renter-occupied |
| Less than $300 | 18 (4.0%) | 43 (23.9%) |
| $300 to $499 | 41 (9.0%) | 20 (11.1%) |
| $500 to $799 | 119 (26.1%) | 15 (8.3%) |
| $800 to $999 | 79 (17.3%) | 48 (26.7%) |
| $1,000 to $1,499 | 114 (25.0%) | 33 (18.3%) |
| $1,500 to $1,999 | 52 (11.4%) | 0 (0.0%) |
| $2,000 to $2,499 | 9 (2.0%) | 0 (0.0%) |
| $2,500 to $2,999 | 13 (2.9%) | 0 (0.0%) |
| $3,000 or more | 11 (2.4%) | 3 (1.7%) |
| Total | 456 (100.0%) | 180 (100.0%) |
Physical Housing Characteristics in Shell Lake
Housing Structures in Shell Lake
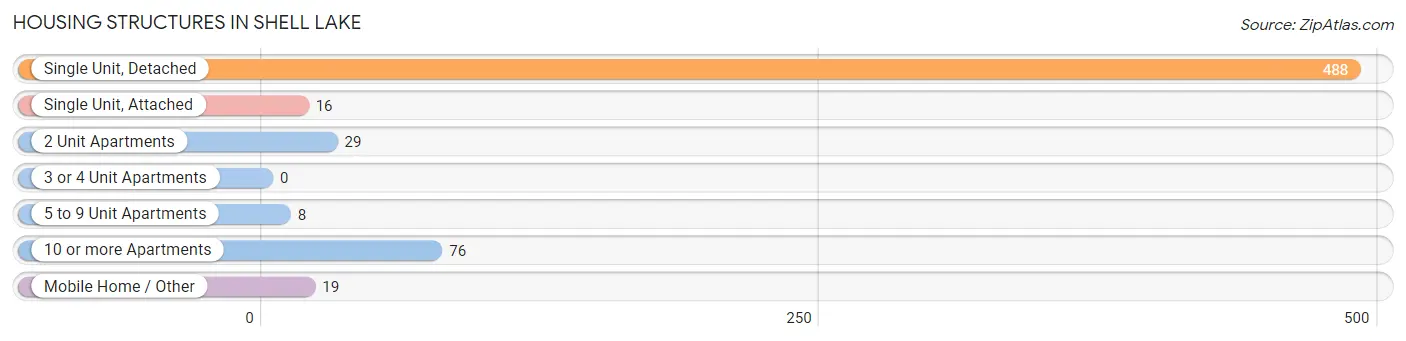
| Structure Type | # Housing Units | % Housing Units |
| Single Unit, Detached | 488 | 76.7% |
| Single Unit, Attached | 16 | 2.5% |
| 2 Unit Apartments | 29 | 4.6% |
| 3 or 4 Unit Apartments | 0 | 0.0% |
| 5 to 9 Unit Apartments | 8 | 1.3% |
| 10 or more Apartments | 76 | 11.9% |
| Mobile Home / Other | 19 | 3.0% |
| Total | 636 | 100.0% |
Housing Structures by Occupancy in Shell Lake
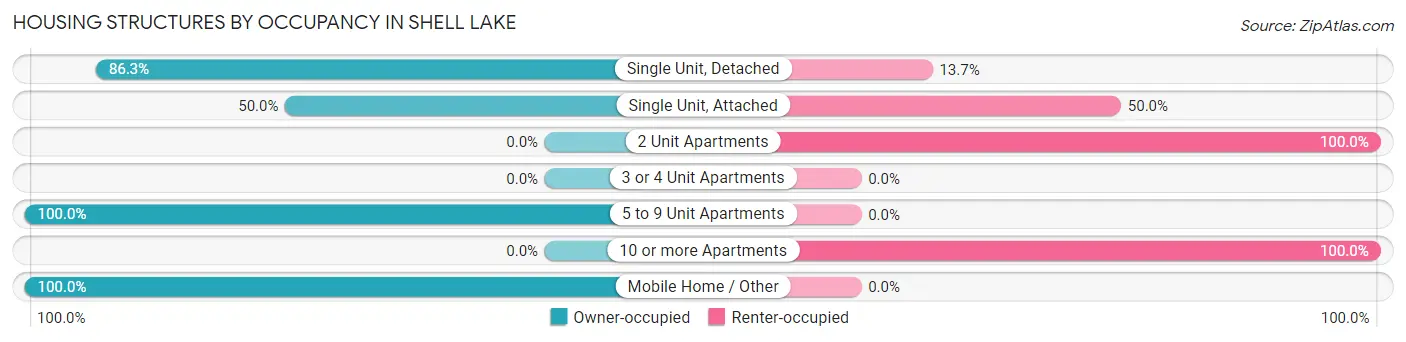
| Structure Type | Owner-occupied | Renter-occupied |
| Single Unit, Detached | 421 (86.3%) | 67 (13.7%) |
| Single Unit, Attached | 8 (50.0%) | 8 (50.0%) |
| 2 Unit Apartments | 0 (0.0%) | 29 (100.0%) |
| 3 or 4 Unit Apartments | 0 (0.0%) | 0 (0.0%) |
| 5 to 9 Unit Apartments | 8 (100.0%) | 0 (0.0%) |
| 10 or more Apartments | 0 (0.0%) | 76 (100.0%) |
| Mobile Home / Other | 19 (100.0%) | 0 (0.0%) |
| Total | 456 (71.7%) | 180 (28.3%) |
Housing Structures by Number of Rooms in Shell Lake
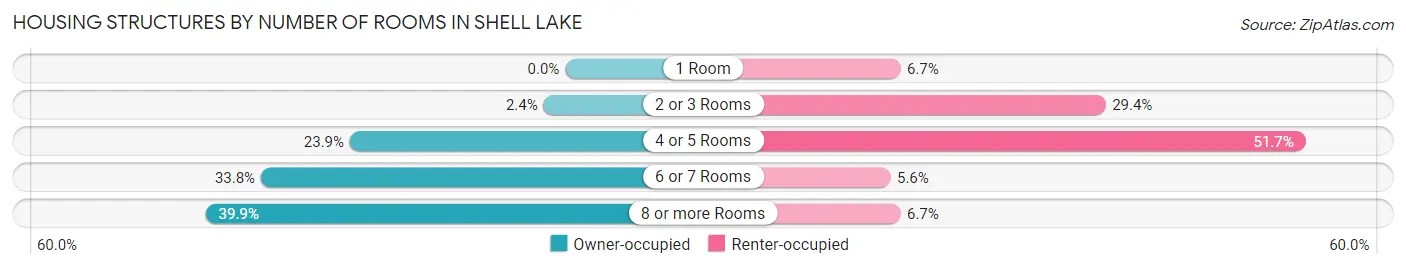
| Number of Rooms | Owner-occupied | Renter-occupied |
| 1 Room | 0 (0.0%) | 12 (6.7%) |
| 2 or 3 Rooms | 11 (2.4%) | 53 (29.4%) |
| 4 or 5 Rooms | 109 (23.9%) | 93 (51.7%) |
| 6 or 7 Rooms | 154 (33.8%) | 10 (5.6%) |
| 8 or more Rooms | 182 (39.9%) | 12 (6.7%) |
| Total | 456 (100.0%) | 180 (100.0%) |
Housing Structure by Heating Type in Shell Lake
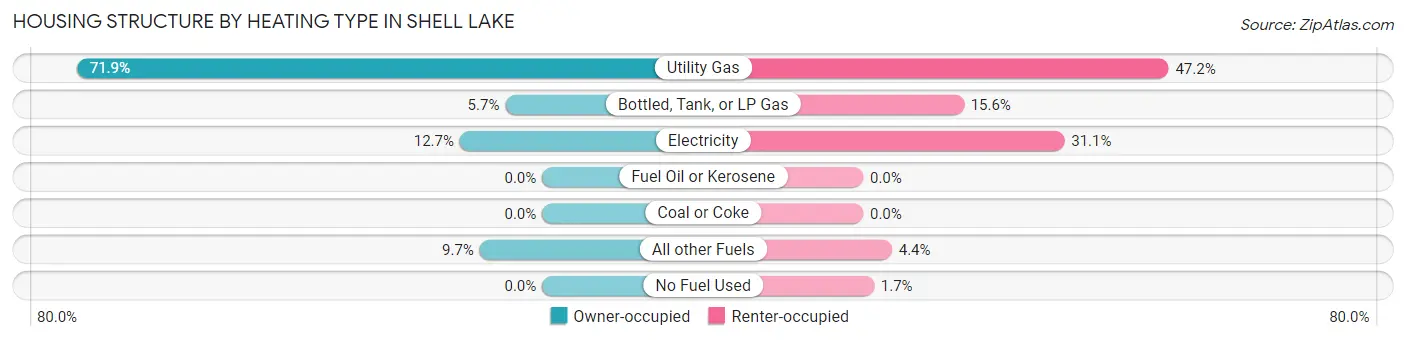
| Heating Type | Owner-occupied | Renter-occupied |
| Utility Gas | 328 (71.9%) | 85 (47.2%) |
| Bottled, Tank, or LP Gas | 26 (5.7%) | 28 (15.6%) |
| Electricity | 58 (12.7%) | 56 (31.1%) |
| Fuel Oil or Kerosene | 0 (0.0%) | 0 (0.0%) |
| Coal or Coke | 0 (0.0%) | 0 (0.0%) |
| All other Fuels | 44 (9.7%) | 8 (4.4%) |
| No Fuel Used | 0 (0.0%) | 3 (1.7%) |
| Total | 456 (100.0%) | 180 (100.0%) |
Household Vehicle Usage in Shell Lake
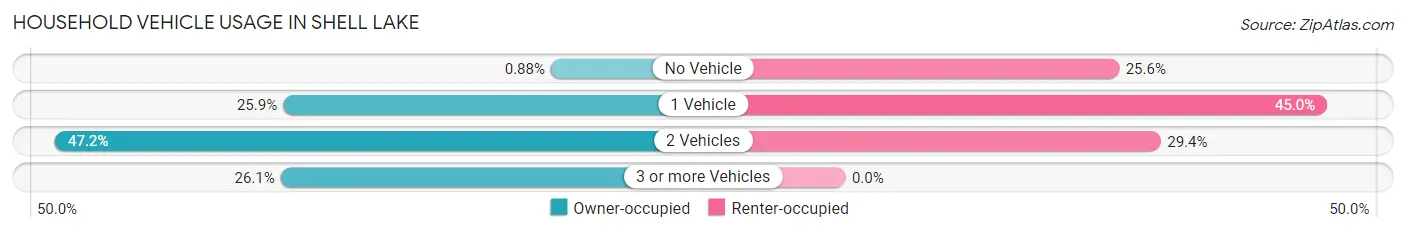
| Vehicles per Household | Owner-occupied | Renter-occupied |
| No Vehicle | 4 (0.9%) | 46 (25.6%) |
| 1 Vehicle | 118 (25.9%) | 81 (45.0%) |
| 2 Vehicles | 215 (47.1%) | 53 (29.4%) |
| 3 or more Vehicles | 119 (26.1%) | 0 (0.0%) |
| Total | 456 (100.0%) | 180 (100.0%) |
Real Estate & Mortgages in Shell Lake
Real Estate and Mortgage Overview in Shell Lake
| Characteristic | Without Mortgage | With Mortgage |
| Housing Units | 198 | 258 |
| Median Property Value | $237,000 | $145,400 |
| Median Household Income | $76,406 | $37 |
| Monthly Housing Costs | $646 | $11 |
| Real Estate Taxes | $3,859 | $0 |
Property Value by Mortgage Status in Shell Lake
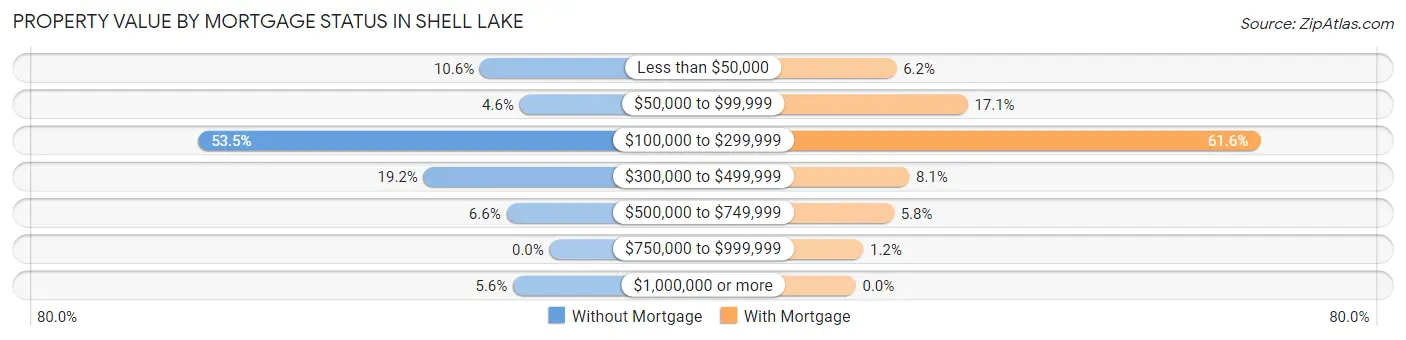
| Property Value | Without Mortgage | With Mortgage |
| Less than $50,000 | 21 (10.6%) | 16 (6.2%) |
| $50,000 to $99,999 | 9 (4.5%) | 44 (17.1%) |
| $100,000 to $299,999 | 106 (53.5%) | 159 (61.6%) |
| $300,000 to $499,999 | 38 (19.2%) | 21 (8.1%) |
| $500,000 to $749,999 | 13 (6.6%) | 15 (5.8%) |
| $750,000 to $999,999 | 0 (0.0%) | 3 (1.2%) |
| $1,000,000 or more | 11 (5.6%) | 0 (0.0%) |
| Total | 198 (100.0%) | 258 (100.0%) |
Household Income by Mortgage Status in Shell Lake
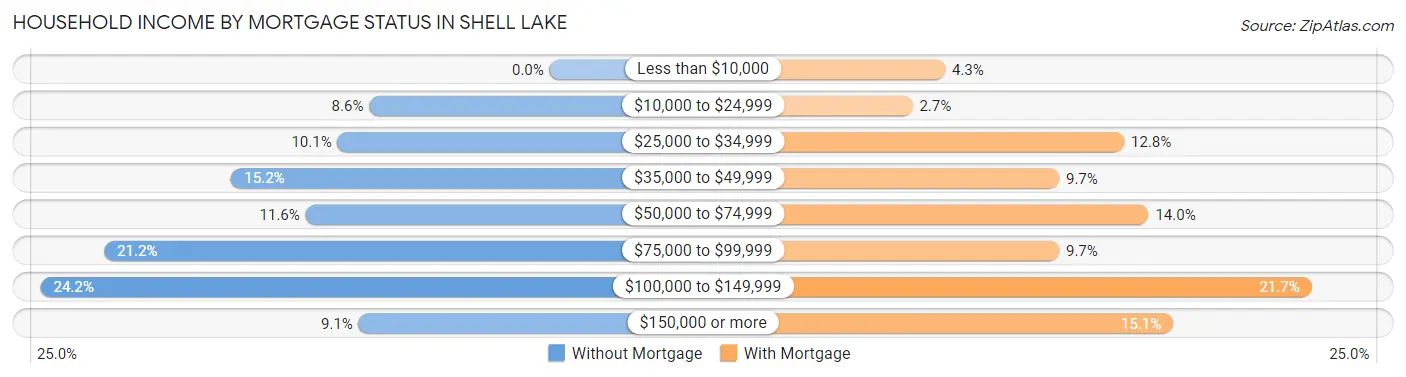
| Household Income | Without Mortgage | With Mortgage |
| Less than $10,000 | 0 (0.0%) | 11 (4.3%) |
| $10,000 to $24,999 | 17 (8.6%) | 7 (2.7%) |
| $25,000 to $34,999 | 20 (10.1%) | 33 (12.8%) |
| $35,000 to $49,999 | 30 (15.1%) | 25 (9.7%) |
| $50,000 to $74,999 | 23 (11.6%) | 36 (14.0%) |
| $75,000 to $99,999 | 42 (21.2%) | 25 (9.7%) |
| $100,000 to $149,999 | 48 (24.2%) | 56 (21.7%) |
| $150,000 or more | 18 (9.1%) | 39 (15.1%) |
| Total | 198 (100.0%) | 258 (100.0%) |
Property Value to Household Income Ratio in Shell Lake
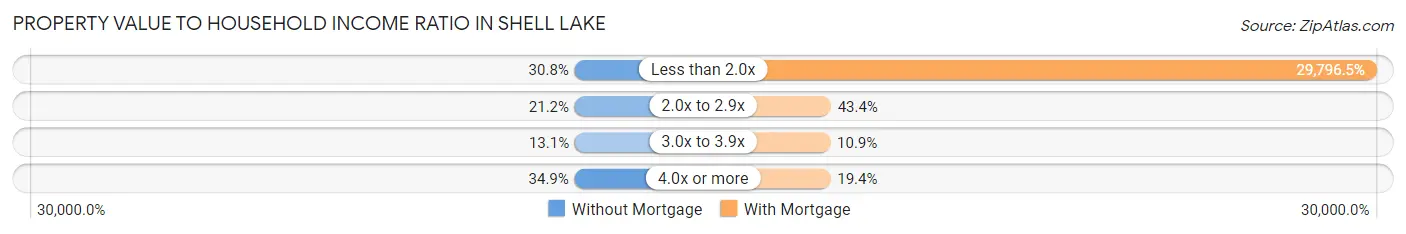
| Value-to-Income Ratio | Without Mortgage | With Mortgage |
| Less than 2.0x | 61 (30.8%) | 76,875 (29,796.5%) |
| 2.0x to 2.9x | 42 (21.2%) | 112 (43.4%) |
| 3.0x to 3.9x | 26 (13.1%) | 28 (10.8%) |
| 4.0x or more | 69 (34.8%) | 50 (19.4%) |
| Total | 198 (100.0%) | 258 (100.0%) |
Real Estate Taxes by Mortgage Status in Shell Lake
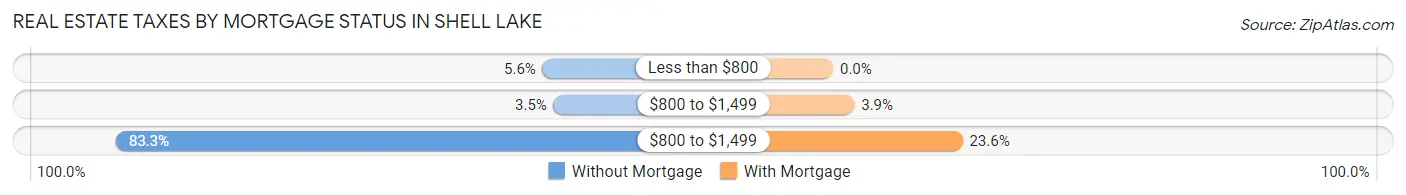
| Property Taxes | Without Mortgage | With Mortgage |
| Less than $800 | 11 (5.6%) | 0 (0.0%) |
| $800 to $1,499 | 7 (3.5%) | 10 (3.9%) |
| $800 to $1,499 | 165 (83.3%) | 61 (23.6%) |
| Total | 198 (100.0%) | 258 (100.0%) |
Health & Disability in Shell Lake
Health Insurance Coverage by Age in Shell Lake
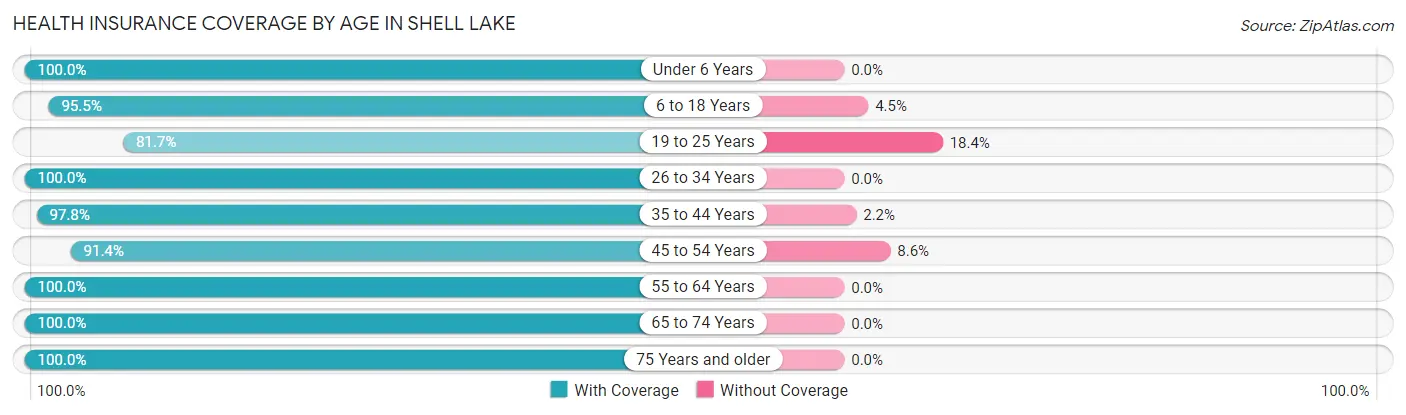
| Age Bracket | With Coverage | Without Coverage |
| Under 6 Years | 123 (100.0%) | 0 (0.0%) |
| 6 to 18 Years | 300 (95.5%) | 14 (4.5%) |
| 19 to 25 Years | 89 (81.7%) | 20 (18.3%) |
| 26 to 34 Years | 120 (100.0%) | 0 (0.0%) |
| 35 to 44 Years | 175 (97.8%) | 4 (2.2%) |
| 45 to 54 Years | 149 (91.4%) | 14 (8.6%) |
| 55 to 64 Years | 175 (100.0%) | 0 (0.0%) |
| 65 to 74 Years | 229 (100.0%) | 0 (0.0%) |
| 75 Years and older | 162 (100.0%) | 0 (0.0%) |
| Total | 1,522 (96.7%) | 52 (3.3%) |
Health Insurance Coverage by Citizenship Status in Shell Lake
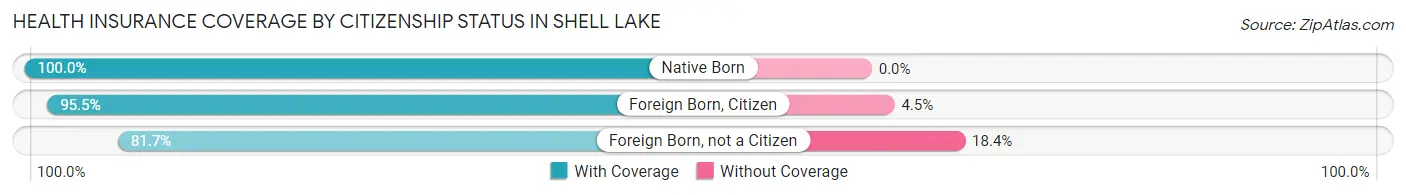
| Citizenship Status | With Coverage | Without Coverage |
| Native Born | 123 (100.0%) | 0 (0.0%) |
| Foreign Born, Citizen | 300 (95.5%) | 14 (4.5%) |
| Foreign Born, not a Citizen | 89 (81.7%) | 20 (18.3%) |
Health Insurance Coverage by Household Income in Shell Lake
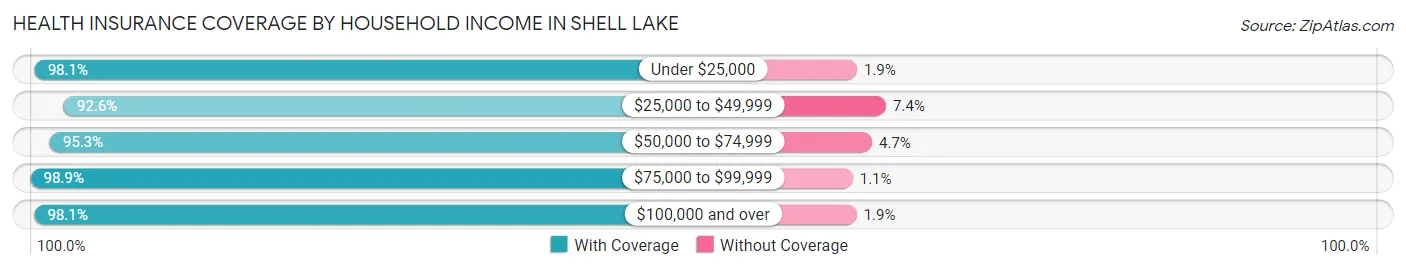
| Household Income | With Coverage | Without Coverage |
| Under $25,000 | 207 (98.1%) | 4 (1.9%) |
| $25,000 to $49,999 | 327 (92.6%) | 26 (7.4%) |
| $50,000 to $74,999 | 201 (95.3%) | 10 (4.7%) |
| $75,000 to $99,999 | 353 (98.9%) | 4 (1.1%) |
| $100,000 and over | 421 (98.1%) | 8 (1.9%) |
Public vs Private Health Insurance Coverage by Age in Shell Lake
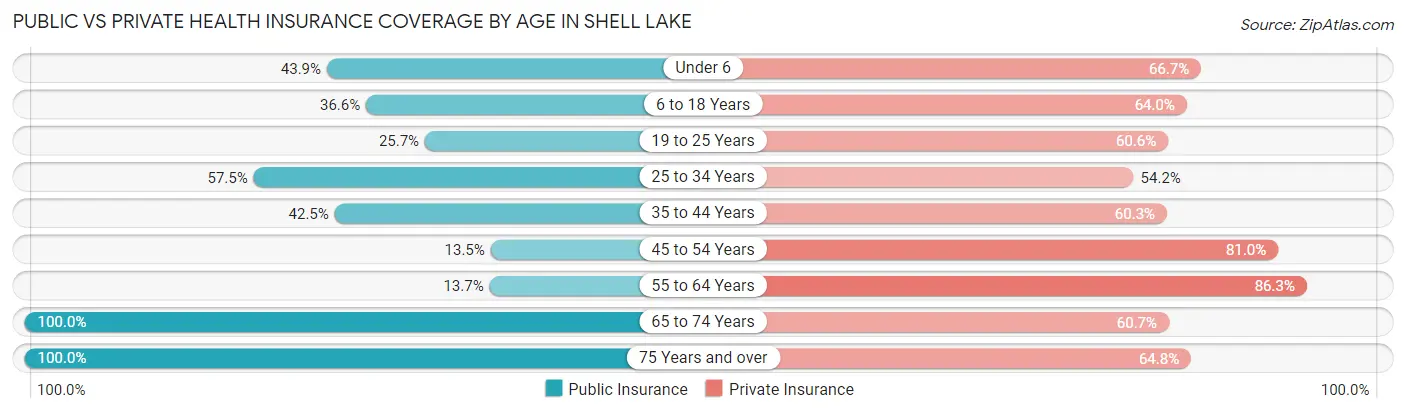
| Age Bracket | Public Insurance | Private Insurance |
| Under 6 | 54 (43.9%) | 82 (66.7%) |
| 6 to 18 Years | 115 (36.6%) | 201 (64.0%) |
| 19 to 25 Years | 28 (25.7%) | 66 (60.6%) |
| 25 to 34 Years | 69 (57.5%) | 65 (54.2%) |
| 35 to 44 Years | 76 (42.5%) | 108 (60.3%) |
| 45 to 54 Years | 22 (13.5%) | 132 (81.0%) |
| 55 to 64 Years | 24 (13.7%) | 151 (86.3%) |
| 65 to 74 Years | 229 (100.0%) | 139 (60.7%) |
| 75 Years and over | 162 (100.0%) | 105 (64.8%) |
| Total | 779 (49.5%) | 1,049 (66.6%) |
Disability Status by Sex by Age in Shell Lake
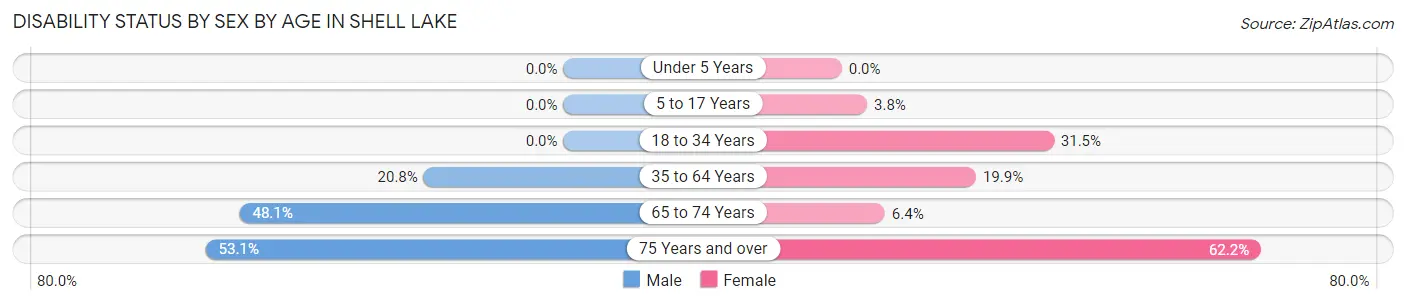
| Age Bracket | Male | Female |
| Under 5 Years | 0 (0.0%) | 0 (0.0%) |
| 5 to 17 Years | 0 (0.0%) | 8 (3.8%) |
| 18 to 34 Years | 0 (0.0%) | 57 (31.5%) |
| 35 to 64 Years | 50 (20.7%) | 55 (19.9%) |
| 65 to 74 Years | 50 (48.1%) | 8 (6.4%) |
| 75 Years and over | 34 (53.1%) | 61 (62.2%) |
Disability Class by Sex by Age in Shell Lake
Disability Class: Hearing Difficulty
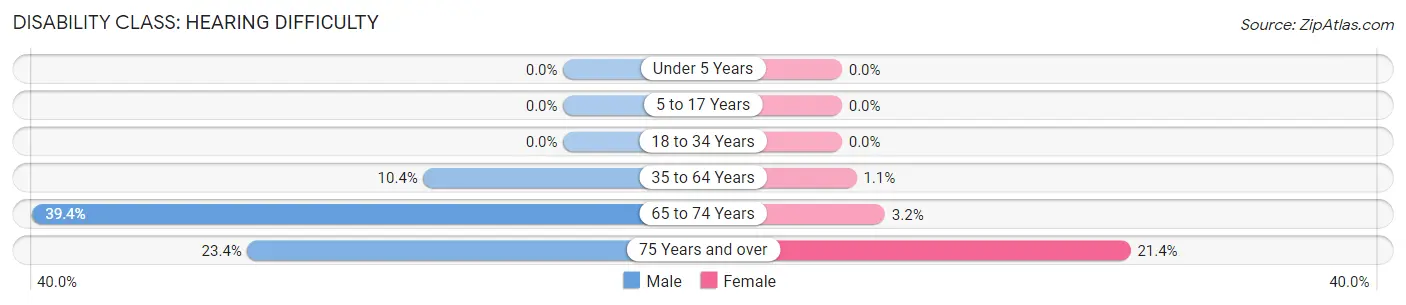
| Age Bracket | Male | Female |
| Under 5 Years | 0 (0.0%) | 0 (0.0%) |
| 5 to 17 Years | 0 (0.0%) | 0 (0.0%) |
| 18 to 34 Years | 0 (0.0%) | 0 (0.0%) |
| 35 to 64 Years | 25 (10.4%) | 3 (1.1%) |
| 65 to 74 Years | 41 (39.4%) | 4 (3.2%) |
| 75 Years and over | 15 (23.4%) | 21 (21.4%) |
Disability Class: Vision Difficulty
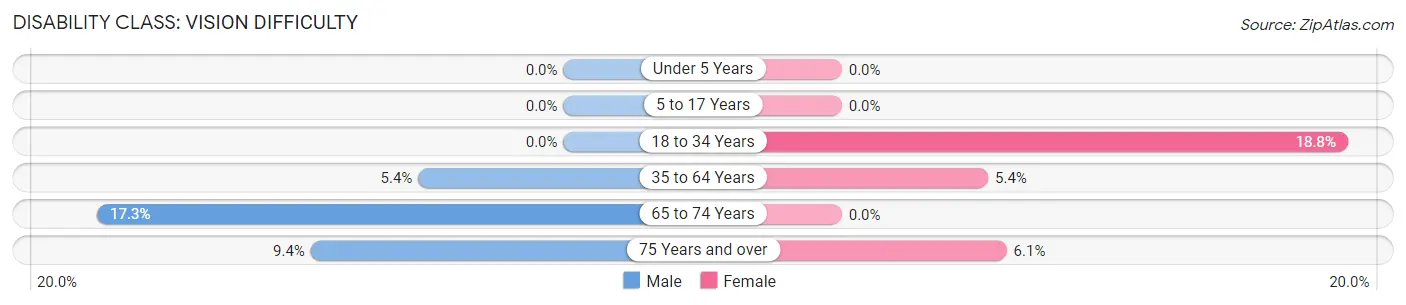
| Age Bracket | Male | Female |
| Under 5 Years | 0 (0.0%) | 0 (0.0%) |
| 5 to 17 Years | 0 (0.0%) | 0 (0.0%) |
| 18 to 34 Years | 0 (0.0%) | 34 (18.8%) |
| 35 to 64 Years | 13 (5.4%) | 15 (5.4%) |
| 65 to 74 Years | 18 (17.3%) | 0 (0.0%) |
| 75 Years and over | 6 (9.4%) | 6 (6.1%) |
Disability Class: Cognitive Difficulty
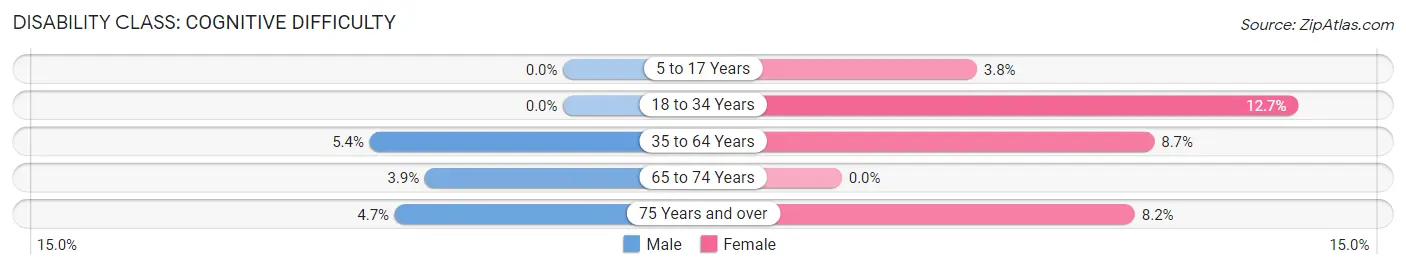
| Age Bracket | Male | Female |
| 5 to 17 Years | 0 (0.0%) | 8 (3.8%) |
| 18 to 34 Years | 0 (0.0%) | 23 (12.7%) |
| 35 to 64 Years | 13 (5.4%) | 24 (8.7%) |
| 65 to 74 Years | 4 (3.8%) | 0 (0.0%) |
| 75 Years and over | 3 (4.7%) | 8 (8.2%) |
Disability Class: Ambulatory Difficulty
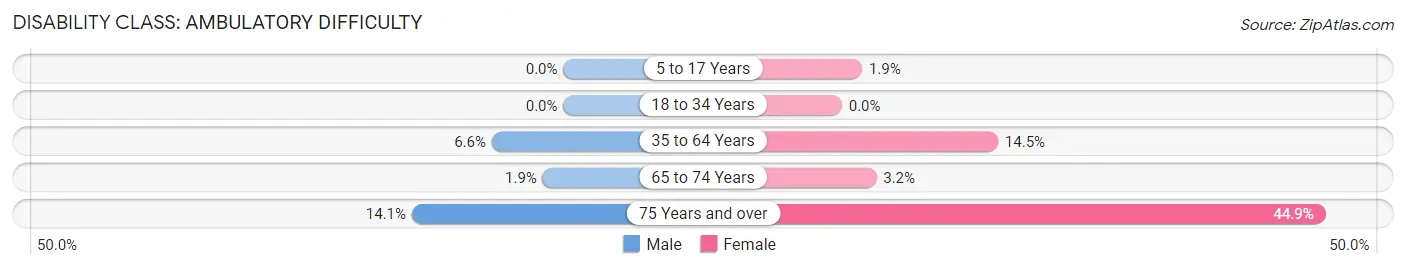
| Age Bracket | Male | Female |
| 5 to 17 Years | 0 (0.0%) | 4 (1.9%) |
| 18 to 34 Years | 0 (0.0%) | 0 (0.0%) |
| 35 to 64 Years | 16 (6.6%) | 40 (14.5%) |
| 65 to 74 Years | 2 (1.9%) | 4 (3.2%) |
| 75 Years and over | 9 (14.1%) | 44 (44.9%) |
Disability Class: Self-Care Difficulty
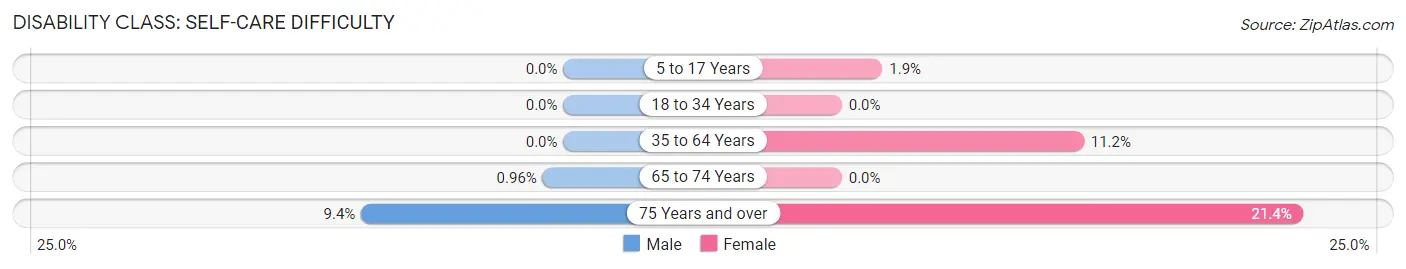
| Age Bracket | Male | Female |
| 5 to 17 Years | 0 (0.0%) | 4 (1.9%) |
| 18 to 34 Years | 0 (0.0%) | 0 (0.0%) |
| 35 to 64 Years | 0 (0.0%) | 31 (11.2%) |
| 65 to 74 Years | 1 (1.0%) | 0 (0.0%) |
| 75 Years and over | 6 (9.4%) | 21 (21.4%) |
Technology Access in Shell Lake
Computing Device Access in Shell Lake
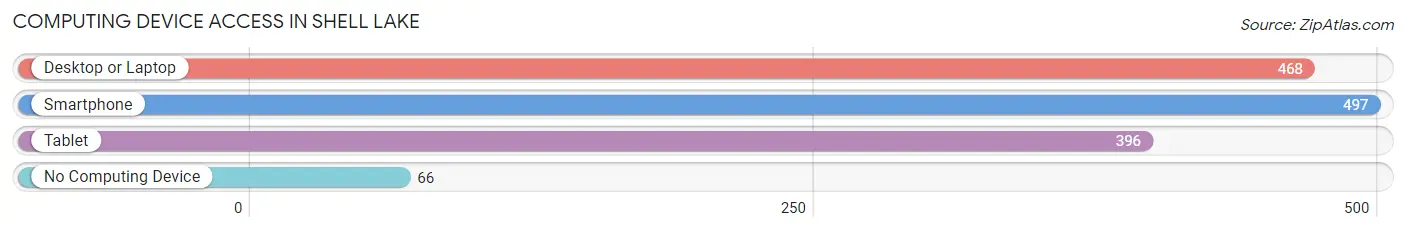
| Device Type | # Households | % Households |
| Desktop or Laptop | 468 | 73.6% |
| Smartphone | 497 | 78.1% |
| Tablet | 396 | 62.3% |
| No Computing Device | 66 | 10.4% |
| Total | 636 | 100.0% |
Internet Access in Shell Lake
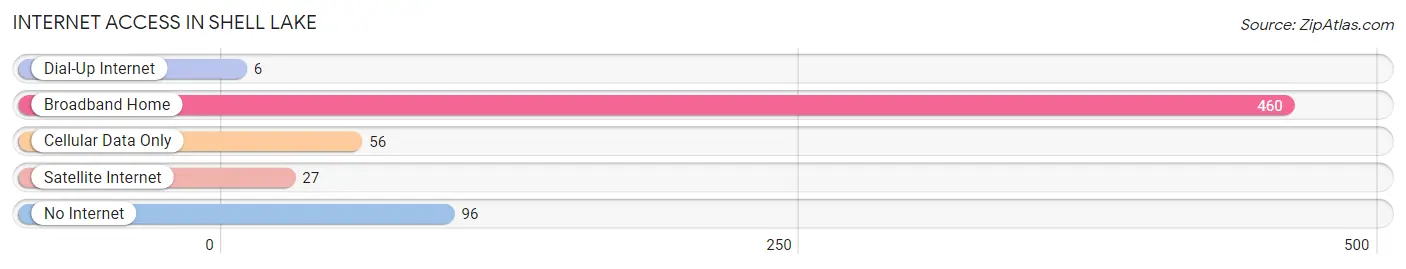
| Internet Type | # Households | % Households |
| Dial-Up Internet | 6 | 0.9% |
| Broadband Home | 460 | 72.3% |
| Cellular Data Only | 56 | 8.8% |
| Satellite Internet | 27 | 4.3% |
| No Internet | 96 | 15.1% |
| Total | 636 | 100.0% |
Shell Lake Summary
History
The area now known as Shell Lake, Wisconsin was first inhabited by the Ojibwe people, who were part of the Algonquin language family. The Ojibwe were a nomadic people who moved around the area, hunting, fishing, and gathering wild plants. They were also known for their birch bark canoes, which they used to travel the area’s many lakes and rivers.
The first European settlers arrived in the area in the late 1800s. These settlers were mostly of Scandinavian descent, and they established small farms and logging operations. The town of Shell Lake was officially founded in 1891, and it was named after the nearby Shell Lake. The town quickly grew, and by the early 1900s it had become a bustling logging and farming community.
In the early 1900s, Shell Lake was also home to a thriving resort industry. Tourists from all over the Midwest would come to the area to enjoy the lakes and forests. The resorts provided a variety of activities, including fishing, boating, and swimming.
In the 1950s, Shell Lake began to experience a decline in its economy. The logging industry had begun to decline, and the resorts were no longer as popular as they had once been. However, the town was able to rebound in the 1960s and 1970s, thanks to the growth of the tourism industry. Today, Shell Lake is a popular destination for outdoor enthusiasts, and it is home to a variety of resorts, restaurants, and other businesses.
Geography
Shell Lake is located in Washburn County, Wisconsin. It is situated on the western shore of Shell Lake, which is part of the larger Chippewa Flowage. The town is surrounded by a variety of lakes, rivers, and streams, including the Namekagon River, the Red Cedar River, and the Yellow River.
The town of Shell Lake is located in a region of Wisconsin known as the Northwoods. This region is characterized by its dense forests, rolling hills, and numerous lakes and rivers. The area is home to a variety of wildlife, including white-tailed deer, black bears, and bald eagles.
Economy
The economy of Shell Lake is largely based on tourism. The town is home to a variety of resorts, restaurants, and other businesses that cater to tourists. The town is also home to a number of manufacturing companies, including a paper mill and a furniture factory.
The town is also home to a variety of small businesses, including shops, restaurants, and other services. The town is also home to a number of farms, which produce a variety of crops, including corn, soybeans, and hay.
Demographics
As of the 2010 census, the population of Shell Lake was 1,541. The town has a median age of 44.7 years, and the median household income is $41,944. The town is predominantly white, with 92.3% of the population identifying as such. The town also has a small Hispanic population, with 4.2% of the population identifying as Hispanic or Latino.
Conclusion
Shell Lake, Wisconsin is a small town located in Washburn County. The town is home to a variety of businesses, including resorts, restaurants, and manufacturing companies. The town is also home to a variety of farms, which produce a variety of crops. The town has a predominantly white population, with a small Hispanic population. The town is a popular destination for outdoor enthusiasts, and it is home to a variety of resorts, restaurants, and other businesses.
Common Questions
What is Per Capita Income in Shell Lake?
Per Capita income in Shell Lake is $33,612.
What is the Median Family Income in Shell Lake?
Median Family Income in Shell Lake is $75,703.
What is the Median Household income in Shell Lake?
Median Household Income in Shell Lake is $52,500.
What is Income or Wage Gap in Shell Lake?
Income or Wage Gap in Shell Lake is 51.2%.
Women in Shell Lake earn 48.8 cents for every dollar earned by a man.
What is Inequality or Gini Index in Shell Lake?
Inequality or Gini Index in Shell Lake is 0.52.
What is the Total Population of Shell Lake?
Total Population of Shell Lake is 1,664.
What is the Total Male Population of Shell Lake?
Total Male Population of Shell Lake is 688.
What is the Total Female Population of Shell Lake?
Total Female Population of Shell Lake is 976.
What is the Ratio of Males per 100 Females in Shell Lake?
There are 70.49 Males per 100 Females in Shell Lake.
What is the Ratio of Females per 100 Males in Shell Lake?
There are 141.86 Females per 100 Males in Shell Lake.
What is the Median Population Age in Shell Lake?
Median Population Age in Shell Lake is 42.8 Years.
What is the Average Family Size in Shell Lake
Average Family Size in Shell Lake is 3.1 People.
What is the Average Household Size in Shell Lake
Average Household Size in Shell Lake is 2.5 People.
How Large is the Labor Force in Shell Lake?
There are 641 People in the Labor Forcein in Shell Lake.
What is the Percentage of People in the Labor Force in Shell Lake?
49.5% of People are in the Labor Force in Shell Lake.
What is the Unemployment Rate in Shell Lake?
Unemployment Rate in Shell Lake is 3.3%.