Fontana on Geneva Lake, WI Map & Demographics
Fontana on Geneva Lake Map
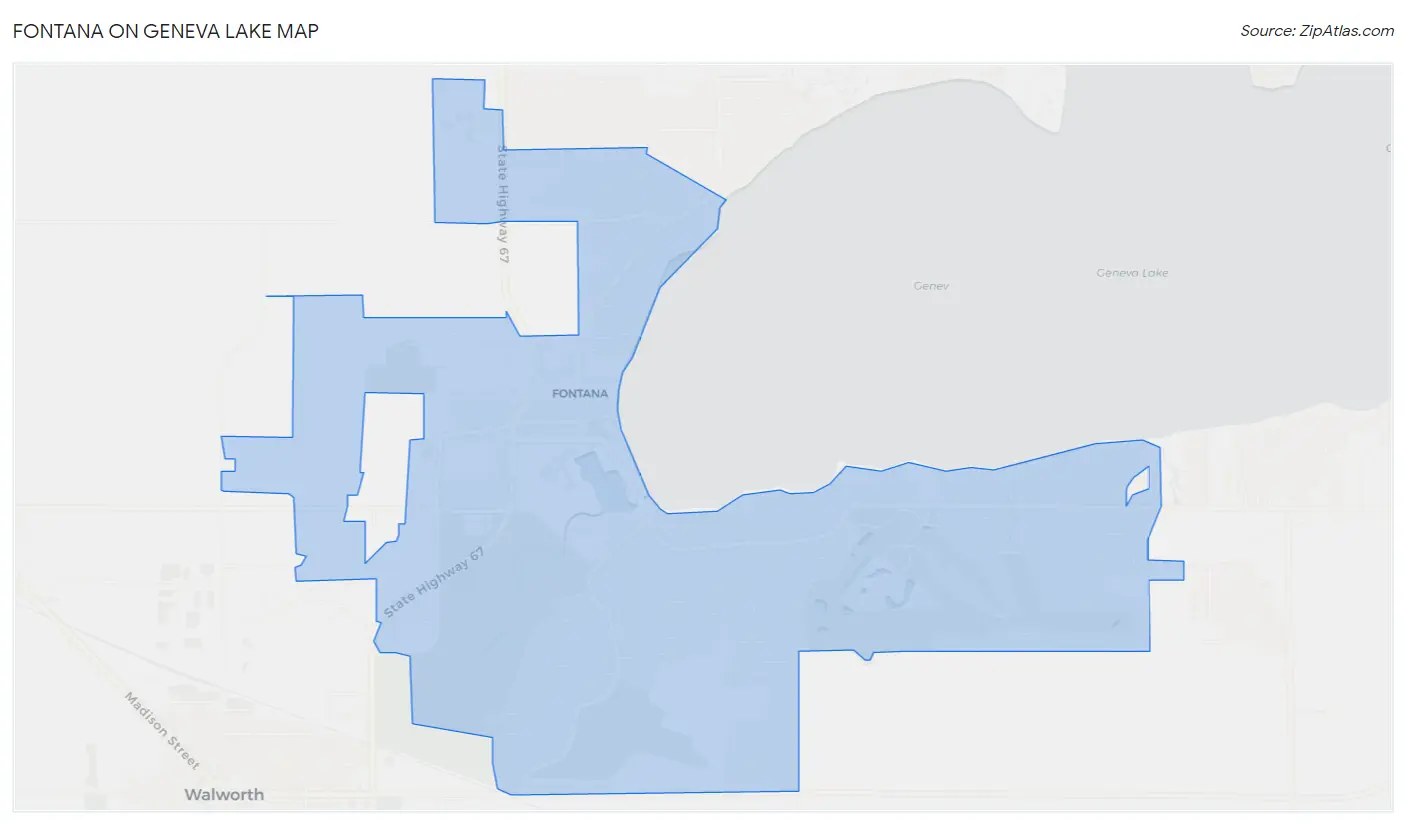
Fontana on Geneva Lake Overview
$74,144
PER CAPITA INCOME
$112,583
AVG FAMILY INCOME
$102,955
AVG HOUSEHOLD INCOME
42.7%
WAGE / INCOME GAP [ % ]
57.3¢/ $1
WAGE / INCOME GAP [ $ ]
$8,327
FAMILY INCOME DEFICIT
0.51
INEQUALITY / GINI INDEX
1,545
TOTAL POPULATION
741
MALE POPULATION
804
FEMALE POPULATION
92.16
MALES / 100 FEMALES
108.50
FEMALES / 100 MALES
55.6
MEDIAN AGE
2.6
AVG FAMILY SIZE
2.3
AVG HOUSEHOLD SIZE
765
LABOR FORCE [ PEOPLE ]
56.3%
PERCENT IN LABOR FORCE
3.8%
UNEMPLOYMENT RATE
Income in Fontana on Geneva Lake
Income Overview in Fontana on Geneva Lake
Per Capita Income in Fontana on Geneva Lake is $74,144, while median incomes of families and households are $112,583 and $102,955 respectively.
| Characteristic | Number | Measure |
| Per Capita Income | 1,545 | $74,144 |
| Median Family Income | 493 | $112,583 |
| Mean Family Income | 493 | $182,134 |
| Median Household Income | 670 | $102,955 |
| Mean Household Income | 670 | $165,341 |
| Income Deficit | 493 | $8,327 |
| Wage / Income Gap (%) | 1,545 | 42.73% |
| Wage / Income Gap ($) | 1,545 | 57.27¢ per $1 |
| Gini / Inequality Index | 1,545 | 0.51 |
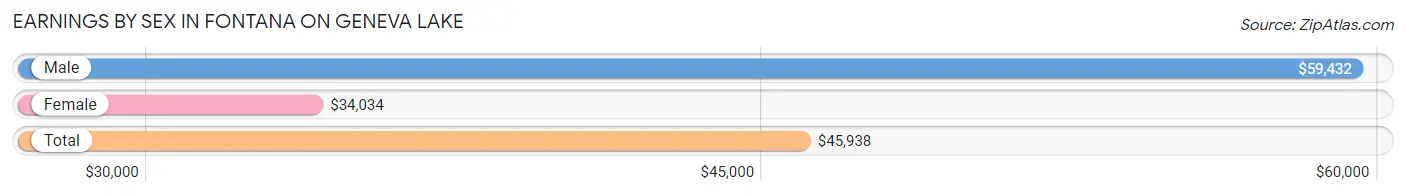
Earnings by Sex in Fontana on Geneva Lake
Average Earnings in Fontana on Geneva Lake are $45,938, $59,432 for men and $34,034 for women, a difference of 42.7%.
| Sex | Number | Average Earnings |
| Male | 427 (49.5%) | $59,432 |
| Female | 435 (50.5%) | $34,034 |
| Total | 862 (100.0%) | $45,938 |
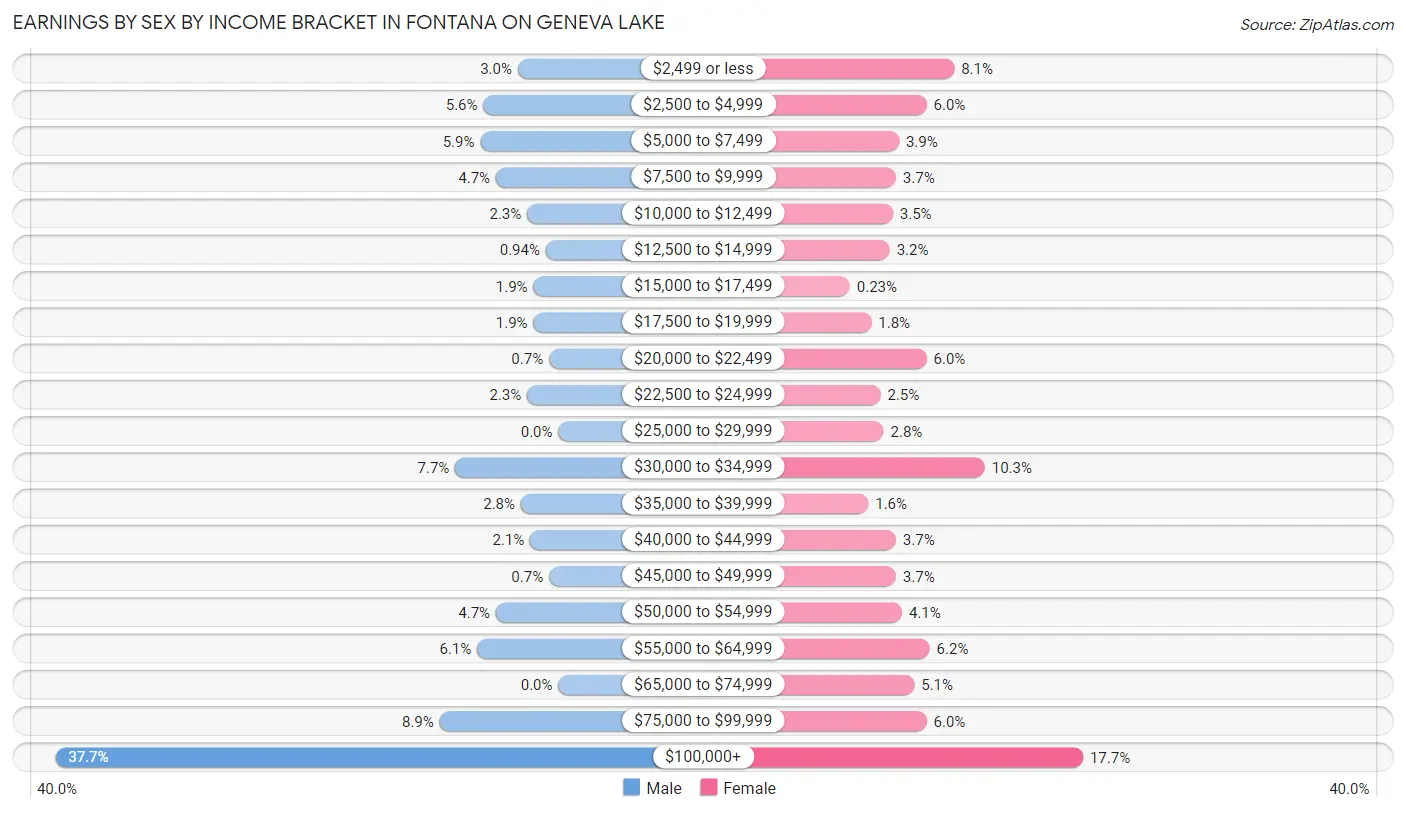
Earnings by Sex by Income Bracket in Fontana on Geneva Lake
The most common earnings brackets in Fontana on Geneva Lake are $100,000+ for men (161 | 37.7%) and $100,000+ for women (77 | 17.7%).
| Income | Male | Female |
| $2,499 or less | 13 (3.0%) | 35 (8.1%) |
| $2,500 to $4,999 | 24 (5.6%) | 26 (6.0%) |
| $5,000 to $7,499 | 25 (5.9%) | 17 (3.9%) |
| $7,500 to $9,999 | 20 (4.7%) | 16 (3.7%) |
| $10,000 to $12,499 | 10 (2.3%) | 15 (3.5%) |
| $12,500 to $14,999 | 4 (0.9%) | 14 (3.2%) |
| $15,000 to $17,499 | 8 (1.9%) | 1 (0.2%) |
| $17,500 to $19,999 | 8 (1.9%) | 8 (1.8%) |
| $20,000 to $22,499 | 3 (0.7%) | 26 (6.0%) |
| $22,500 to $24,999 | 10 (2.3%) | 11 (2.5%) |
| $25,000 to $29,999 | 0 (0.0%) | 12 (2.8%) |
| $30,000 to $34,999 | 33 (7.7%) | 45 (10.3%) |
| $35,000 to $39,999 | 12 (2.8%) | 7 (1.6%) |
| $40,000 to $44,999 | 9 (2.1%) | 16 (3.7%) |
| $45,000 to $49,999 | 3 (0.7%) | 16 (3.7%) |
| $50,000 to $54,999 | 20 (4.7%) | 18 (4.1%) |
| $55,000 to $64,999 | 26 (6.1%) | 27 (6.2%) |
| $65,000 to $74,999 | 0 (0.0%) | 22 (5.1%) |
| $75,000 to $99,999 | 38 (8.9%) | 26 (6.0%) |
| $100,000+ | 161 (37.7%) | 77 (17.7%) |
| Total | 427 (100.0%) | 435 (100.0%) |
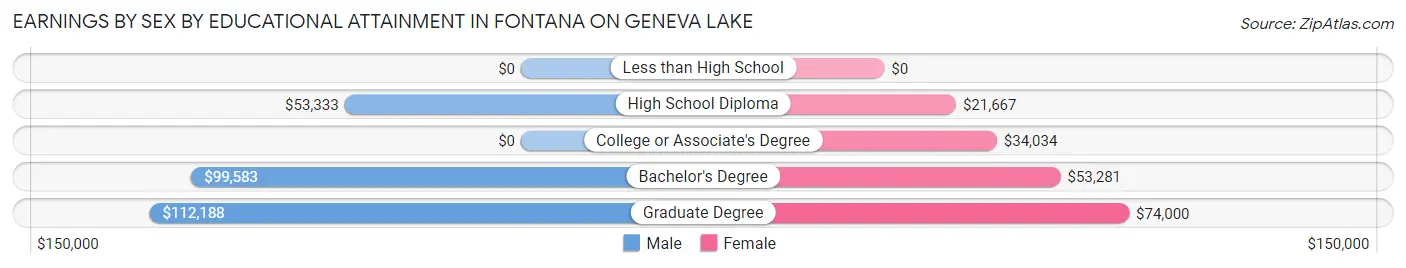
Earnings by Sex by Educational Attainment in Fontana on Geneva Lake
Average earnings in Fontana on Geneva Lake are $81,750 for men and $43,250 for women, a difference of 47.1%. Men with an educational attainment of graduate degree enjoy the highest average annual earnings of $112,188, while those with high school diploma education earn the least with $53,333. Women with an educational attainment of graduate degree earn the most with the average annual earnings of $74,000, while those with high school diploma education have the smallest earnings of $21,667.
| Educational Attainment | Male Income | Female Income |
| Less than High School | - | - |
| High School Diploma | $53,333 | $21,667 |
| College or Associate's Degree | - | - |
| Bachelor's Degree | $99,583 | $53,281 |
| Graduate Degree | $112,188 | $74,000 |
| Total | $81,750 | $43,250 |
Family Income in Fontana on Geneva Lake
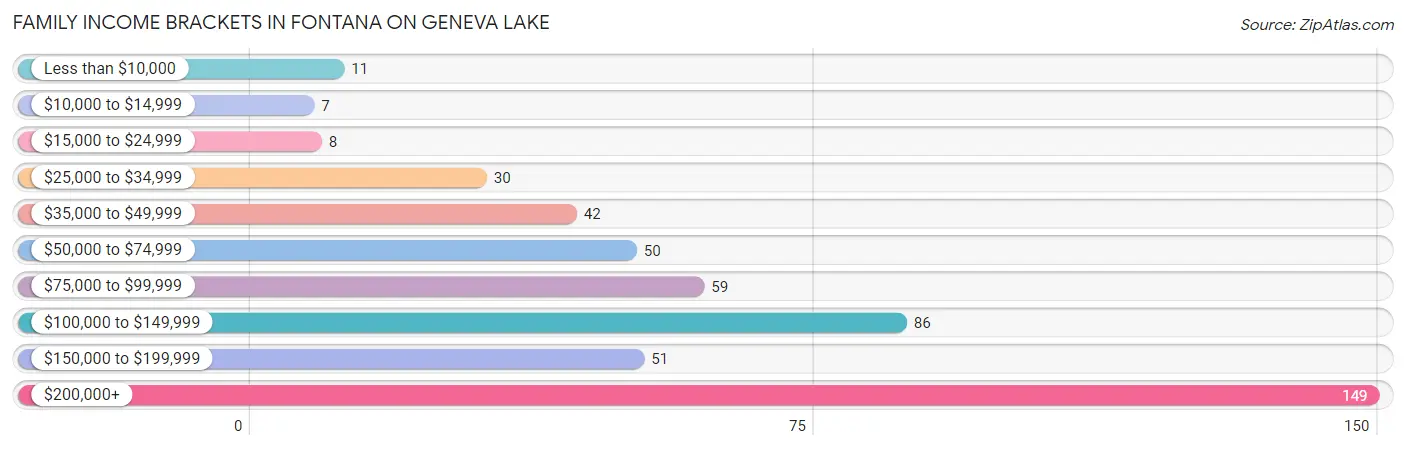
Family Income Brackets in Fontana on Geneva Lake
According to the Fontana on Geneva Lake family income data, there are 149 families falling into the $200,000+ income range, which is the most common income bracket and makes up 30.2% of all families. Conversely, the $10,000 to $14,999 income bracket is the least frequent group with only 7 families (1.4%) belonging to this category.
| Income Bracket | # Families | % Families |
| Less than $10,000 | 11 | 2.2% |
| $10,000 to $14,999 | 7 | 1.4% |
| $15,000 to $24,999 | 8 | 1.6% |
| $25,000 to $34,999 | 30 | 6.1% |
| $35,000 to $49,999 | 42 | 8.5% |
| $50,000 to $74,999 | 50 | 10.1% |
| $75,000 to $99,999 | 59 | 12.0% |
| $100,000 to $149,999 | 86 | 17.4% |
| $150,000 to $199,999 | 51 | 10.3% |
| $200,000+ | 149 | 30.2% |
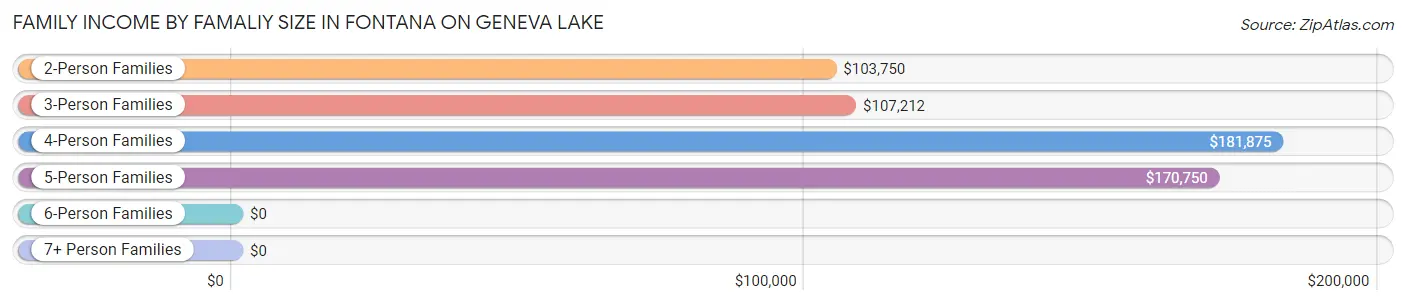
Family Income by Famaliy Size in Fontana on Geneva Lake
4-person families (53 | 10.7%) account for the highest median family income in Fontana on Geneva Lake with $181,875 per family, while 2-person families (338 | 68.6%) have the highest median income of $51,875 per family member.
| Income Bracket | # Families | Median Income |
| 2-Person Families | 338 (68.6%) | $103,750 |
| 3-Person Families | 83 (16.8%) | $107,212 |
| 4-Person Families | 53 (10.7%) | $181,875 |
| 5-Person Families | 13 (2.6%) | $170,750 |
| 6-Person Families | 0 (0.0%) | $0 |
| 7+ Person Families | 6 (1.2%) | $0 |
| Total | 493 (100.0%) | $112,583 |
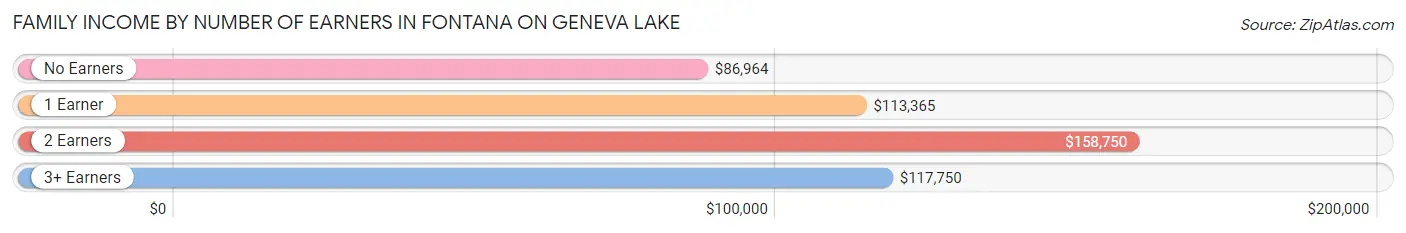
Family Income by Number of Earners in Fontana on Geneva Lake
The median family income in Fontana on Geneva Lake is $112,583, with families comprising 2 earners (172) having the highest median family income of $158,750, while families with no earners (115) have the lowest median family income of $86,964, accounting for 34.9% and 23.3% of families, respectively.
| Number of Earners | # Families | Median Income |
| No Earners | 115 (23.3%) | $86,964 |
| 1 Earner | 143 (29.0%) | $113,365 |
| 2 Earners | 172 (34.9%) | $158,750 |
| 3+ Earners | 63 (12.8%) | $117,750 |
| Total | 493 (100.0%) | $112,583 |
Household Income in Fontana on Geneva Lake
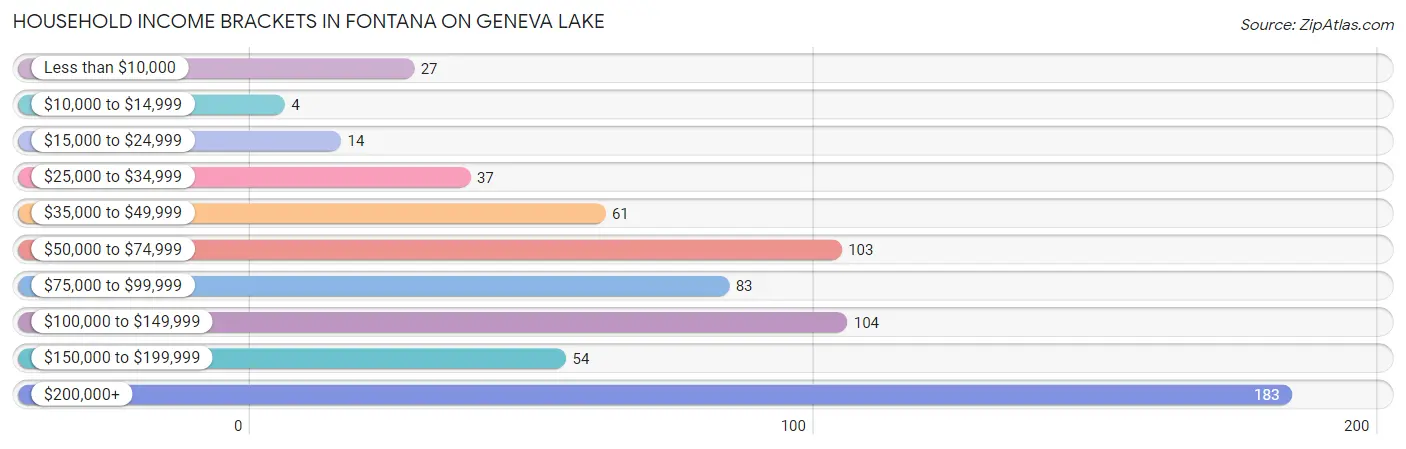
Household Income Brackets in Fontana on Geneva Lake
With 183 households falling in the category, the $200,000+ income range is the most frequent in Fontana on Geneva Lake, accounting for 27.3% of all households. In contrast, only 4 households (0.6%) fall into the $10,000 to $14,999 income bracket, making it the least populous group.
| Income Bracket | # Households | % Households |
| Less than $10,000 | 27 | 4.0% |
| $10,000 to $14,999 | 4 | 0.6% |
| $15,000 to $24,999 | 14 | 2.1% |
| $25,000 to $34,999 | 37 | 5.5% |
| $35,000 to $49,999 | 61 | 9.1% |
| $50,000 to $74,999 | 103 | 15.4% |
| $75,000 to $99,999 | 83 | 12.4% |
| $100,000 to $149,999 | 104 | 15.5% |
| $150,000 to $199,999 | 54 | 8.1% |
| $200,000+ | 183 | 27.3% |
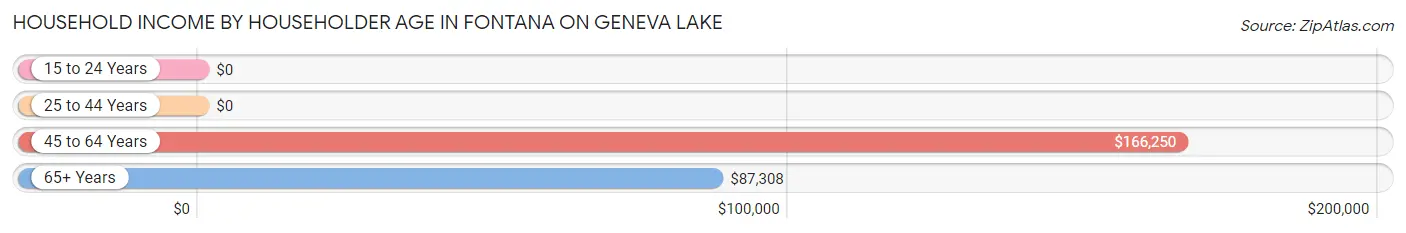
Household Income by Householder Age in Fontana on Geneva Lake
The median household income in Fontana on Geneva Lake is $102,955, with the highest median household income of $166,250 found in the 45 to 64 years age bracket for the primary householder. A total of 238 households (35.5%) fall into this category. Meanwhile, the 15 to 24 years age bracket for the primary householder has the lowest median household income of $0, with 7 households (1.0%) in this group.
| Income Bracket | # Households | Median Income |
| 15 to 24 Years | 7 (1.0%) | $0 |
| 25 to 44 Years | 113 (16.9%) | $0 |
| 45 to 64 Years | 238 (35.5%) | $166,250 |
| 65+ Years | 312 (46.6%) | $87,308 |
| Total | 670 (100.0%) | $102,955 |
Poverty in Fontana on Geneva Lake
Income Below Poverty by Sex and Age in Fontana on Geneva Lake
With 5.5% poverty level for males and 8.5% for females among the residents of Fontana on Geneva Lake, 12 to 14 year old males and 6 to 11 year old females are the most vulnerable to poverty, with 9 males (60.0%) and 10 females (27.8%) in their respective age groups living below the poverty level.
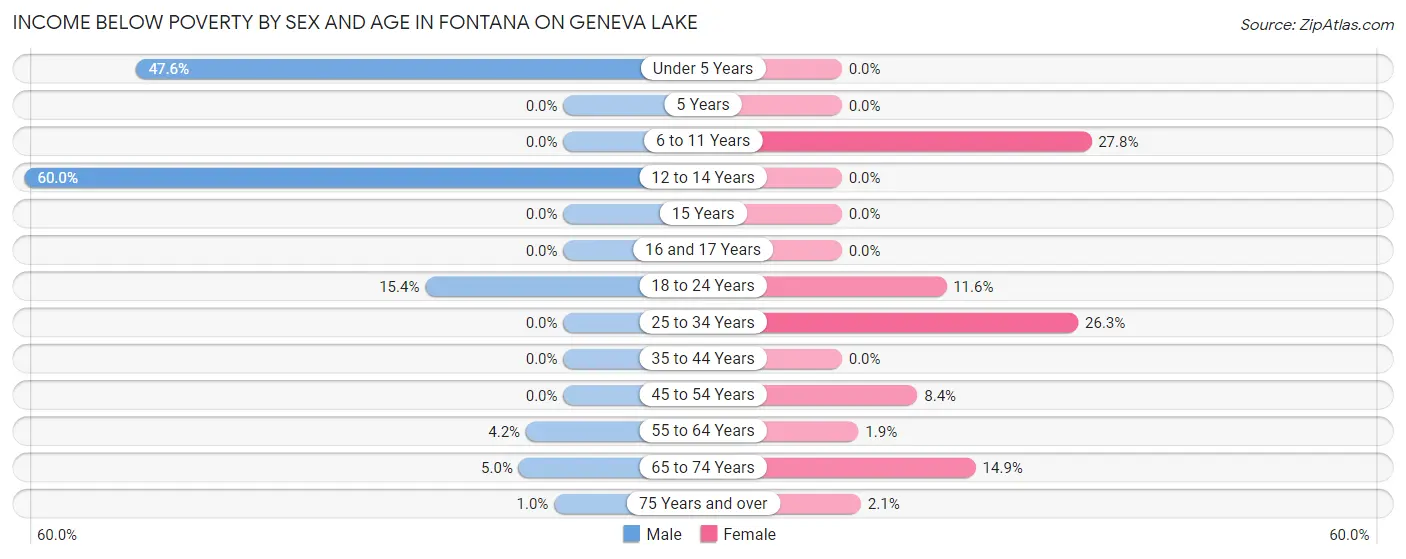
| Age Bracket | Male | Female |
| Under 5 Years | 10 (47.6%) | 0 (0.0%) |
| 5 Years | 0 (0.0%) | 0 (0.0%) |
| 6 to 11 Years | 0 (0.0%) | 10 (27.8%) |
| 12 to 14 Years | 9 (60.0%) | 0 (0.0%) |
| 15 Years | 0 (0.0%) | 0 (0.0%) |
| 16 and 17 Years | 0 (0.0%) | 0 (0.0%) |
| 18 to 24 Years | 8 (15.4%) | 5 (11.6%) |
| 25 to 34 Years | 0 (0.0%) | 15 (26.3%) |
| 35 to 44 Years | 0 (0.0%) | 0 (0.0%) |
| 45 to 54 Years | 0 (0.0%) | 9 (8.4%) |
| 55 to 64 Years | 5 (4.2%) | 3 (1.8%) |
| 65 to 74 Years | 8 (5.0%) | 24 (14.9%) |
| 75 Years and over | 1 (1.0%) | 2 (2.1%) |
| Total | 41 (5.5%) | 68 (8.5%) |
Income Above Poverty by Sex and Age in Fontana on Geneva Lake
According to the poverty statistics in Fontana on Geneva Lake, males aged 5 years and females aged under 5 years are the age groups that are most secure financially, with 100.0% of males and 100.0% of females in these age groups living above the poverty line.
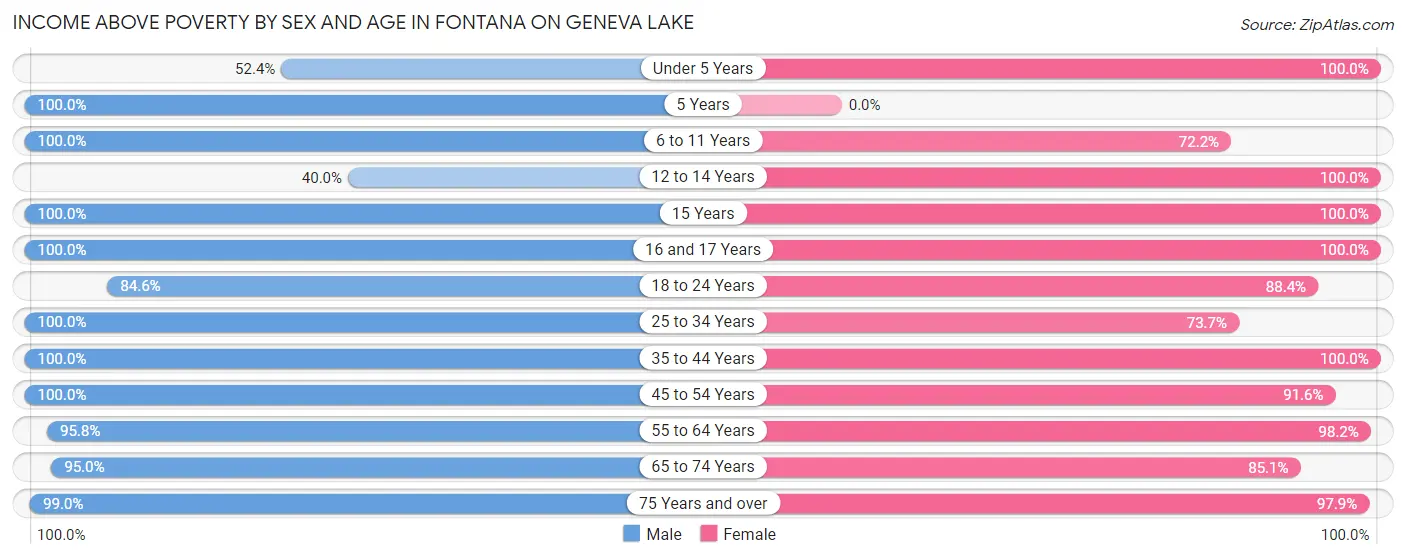
| Age Bracket | Male | Female |
| Under 5 Years | 11 (52.4%) | 38 (100.0%) |
| 5 Years | 2 (100.0%) | 0 (0.0%) |
| 6 to 11 Years | 38 (100.0%) | 26 (72.2%) |
| 12 to 14 Years | 6 (40.0%) | 13 (100.0%) |
| 15 Years | 15 (100.0%) | 8 (100.0%) |
| 16 and 17 Years | 20 (100.0%) | 19 (100.0%) |
| 18 to 24 Years | 44 (84.6%) | 38 (88.4%) |
| 25 to 34 Years | 33 (100.0%) | 42 (73.7%) |
| 35 to 44 Years | 64 (100.0%) | 66 (100.0%) |
| 45 to 54 Years | 102 (100.0%) | 98 (91.6%) |
| 55 to 64 Years | 115 (95.8%) | 159 (98.2%) |
| 65 to 74 Years | 153 (95.0%) | 137 (85.1%) |
| 75 Years and over | 97 (99.0%) | 92 (97.9%) |
| Total | 700 (94.5%) | 736 (91.5%) |
Income Below Poverty Among Married-Couple Families in Fontana on Geneva Lake
The poverty statistics for married-couple families in Fontana on Geneva Lake show that 2.6% or 12 of the total 456 families live below the poverty line. Families with no children have the highest poverty rate of 3.4%, comprising of 12 families. On the other hand, families with 1 or 2 children have the lowest poverty rate of 0.0%, which includes 0 families.
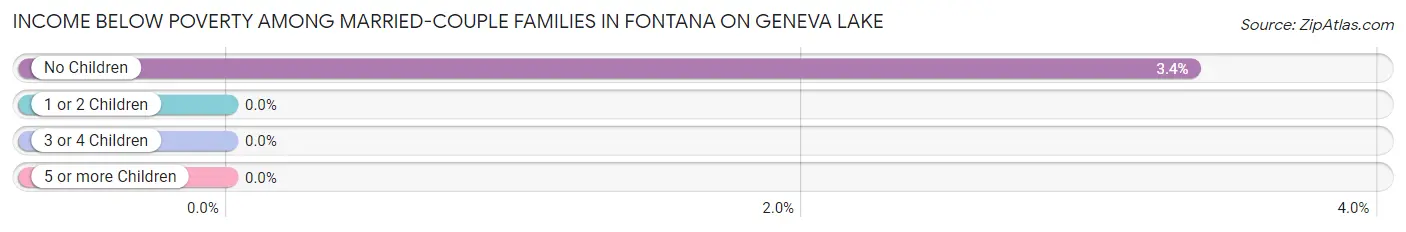
| Children | Above Poverty | Below Poverty |
| No Children | 346 (96.7%) | 12 (3.4%) |
| 1 or 2 Children | 89 (100.0%) | 0 (0.0%) |
| 3 or 4 Children | 3 (100.0%) | 0 (0.0%) |
| 5 or more Children | 6 (100.0%) | 0 (0.0%) |
| Total | 444 (97.4%) | 12 (2.6%) |
Income Below Poverty Among Single-Parent Households in Fontana on Geneva Lake
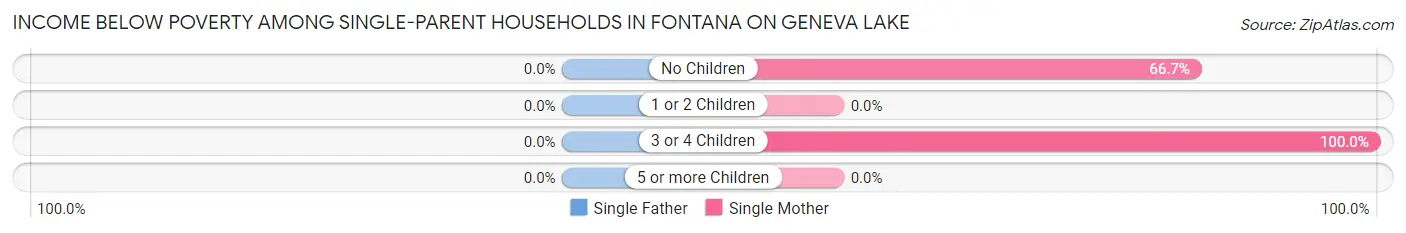
| Children | Single Father | Single Mother |
| No Children | 0 (0.0%) | 6 (66.7%) |
| 1 or 2 Children | 0 (0.0%) | 0 (0.0%) |
| 3 or 4 Children | 0 (0.0%) | 8 (100.0%) |
| 5 or more Children | 0 (0.0%) | 0 (0.0%) |
| Total | 0 (0.0%) | 14 (56.0%) |
Income Below Poverty Among Married-Couple vs Single-Parent Households in Fontana on Geneva Lake
The poverty data for Fontana on Geneva Lake shows that 12 of the married-couple family households (2.6%) and 14 of the single-parent households (37.8%) are living below the poverty level. Within the married-couple family households, those with no children have the highest poverty rate, with 12 households (3.4%) falling below the poverty line. Among the single-parent households, those with 3 or 4 children have the highest poverty rate, with 8 household (100.0%) living below poverty.
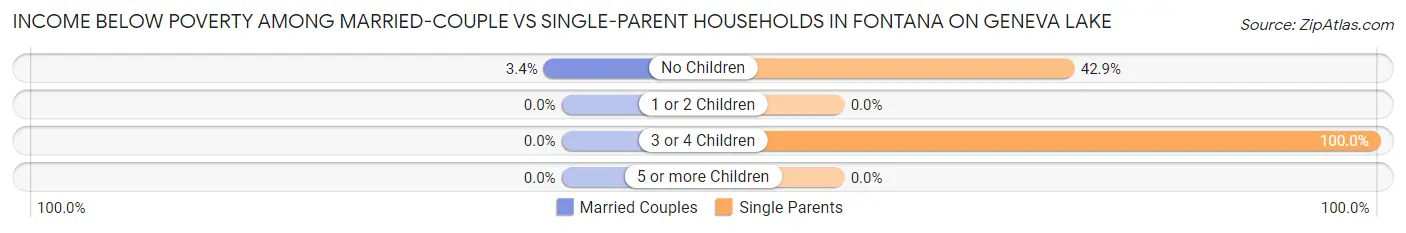
| Children | Married-Couple Families | Single-Parent Households |
| No Children | 12 (3.4%) | 6 (42.9%) |
| 1 or 2 Children | 0 (0.0%) | 0 (0.0%) |
| 3 or 4 Children | 0 (0.0%) | 8 (100.0%) |
| 5 or more Children | 0 (0.0%) | 0 (0.0%) |
| Total | 12 (2.6%) | 14 (37.8%) |
Race in Fontana on Geneva Lake
The most populous races in Fontana on Geneva Lake are White / Caucasian (1,461 | 94.6%), Two or more Races (56 | 3.6%), and Asian (22 | 1.4%).
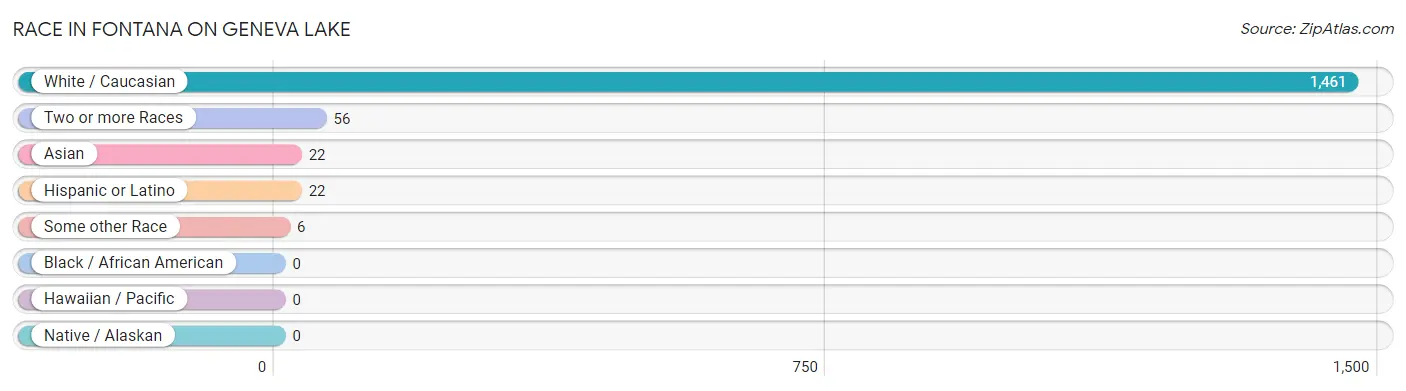
| Race | # Population | % Population |
| Asian | 22 | 1.4% |
| Black / African American | 0 | 0.0% |
| Hawaiian / Pacific | 0 | 0.0% |
| Hispanic or Latino | 22 | 1.4% |
| Native / Alaskan | 0 | 0.0% |
| White / Caucasian | 1,461 | 94.6% |
| Two or more Races | 56 | 3.6% |
| Some other Race | 6 | 0.4% |
| Total | 1,545 | 100.0% |
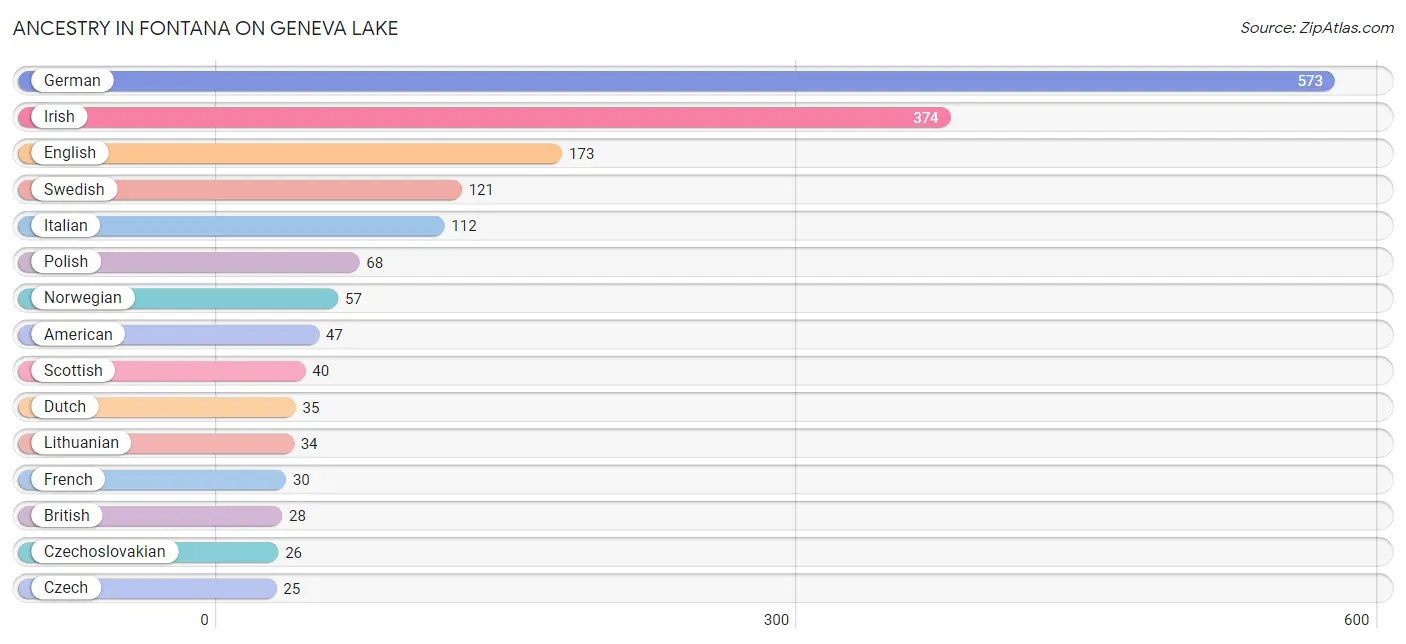
Ancestry in Fontana on Geneva Lake
The most populous ancestries reported in Fontana on Geneva Lake are German (573 | 37.1%), Irish (374 | 24.2%), English (173 | 11.2%), Swedish (121 | 7.8%), and Italian (112 | 7.2%), together accounting for 87.6% of all Fontana on Geneva Lake residents.
| Ancestry | # Population | % Population |
| American | 47 | 3.0% |
| Arab | 4 | 0.3% |
| Armenian | 3 | 0.2% |
| Australian | 5 | 0.3% |
| Austrian | 10 | 0.6% |
| Bangladeshi | 16 | 1.0% |
| Belgian | 2 | 0.1% |
| British | 28 | 1.8% |
| Bulgarian | 2 | 0.1% |
| Central American | 6 | 0.4% |
| Croatian | 13 | 0.8% |
| Czech | 25 | 1.6% |
| Czechoslovakian | 26 | 1.7% |
| Danish | 11 | 0.7% |
| Dominican | 3 | 0.2% |
| Dutch | 35 | 2.3% |
| Eastern European | 19 | 1.2% |
| English | 173 | 11.2% |
| European | 4 | 0.3% |
| Finnish | 10 | 0.6% |
| French | 30 | 1.9% |
| French Canadian | 6 | 0.4% |
| German | 573 | 37.1% |
| Greek | 13 | 0.8% |
| Guatemalan | 6 | 0.4% |
| Indian (Asian) | 12 | 0.8% |
| Irish | 374 | 24.2% |
| Italian | 112 | 7.2% |
| Korean | 6 | 0.4% |
| Lebanese | 4 | 0.3% |
| Lithuanian | 34 | 2.2% |
| Luxembourger | 5 | 0.3% |
| Mexican | 4 | 0.3% |
| Norwegian | 57 | 3.7% |
| Polish | 68 | 4.4% |
| Russian | 19 | 1.2% |
| Scotch-Irish | 18 | 1.2% |
| Scottish | 40 | 2.6% |
| Serbian | 2 | 0.1% |
| Slovak | 3 | 0.2% |
| Spanish | 9 | 0.6% |
| Swedish | 121 | 7.8% |
| Swiss | 5 | 0.3% |
| Ukrainian | 5 | 0.3% | View All 44 Rows |
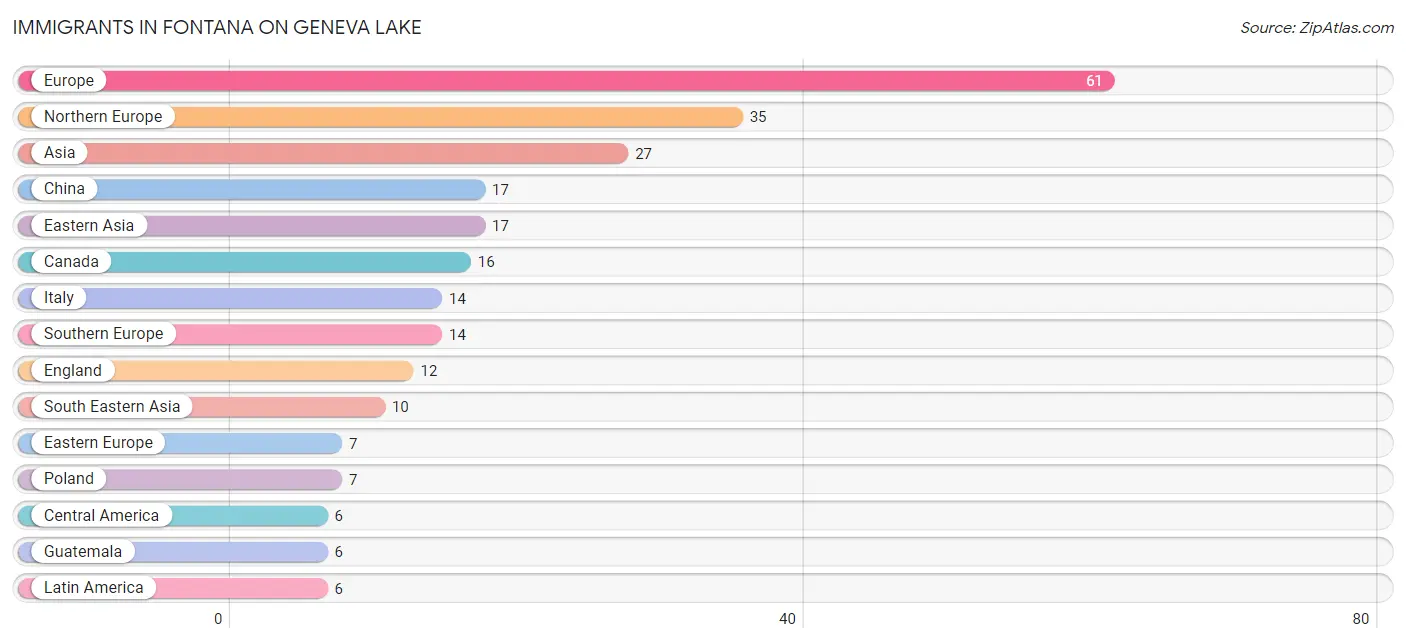
Immigrants in Fontana on Geneva Lake
The most numerous immigrant groups reported in Fontana on Geneva Lake came from Europe (61 | 4.0%), Northern Europe (35 | 2.3%), Asia (27 | 1.8%), China (17 | 1.1%), and Eastern Asia (17 | 1.1%), together accounting for 10.2% of all Fontana on Geneva Lake residents.
| Immigration Origin | # Population | % Population |
| Asia | 27 | 1.8% |
| Canada | 16 | 1.0% |
| Central America | 6 | 0.4% |
| China | 17 | 1.1% |
| Eastern Asia | 17 | 1.1% |
| Eastern Europe | 7 | 0.4% |
| England | 12 | 0.8% |
| Europe | 61 | 4.0% |
| France | 2 | 0.1% |
| Germany | 3 | 0.2% |
| Guatemala | 6 | 0.4% |
| Ireland | 3 | 0.2% |
| Italy | 14 | 0.9% |
| Laos | 4 | 0.3% |
| Latin America | 6 | 0.4% |
| Northern Europe | 35 | 2.3% |
| Philippines | 6 | 0.4% |
| Poland | 7 | 0.4% |
| South Eastern Asia | 10 | 0.6% |
| Southern Europe | 14 | 0.9% |
| Western Europe | 5 | 0.3% | View All 21 Rows |
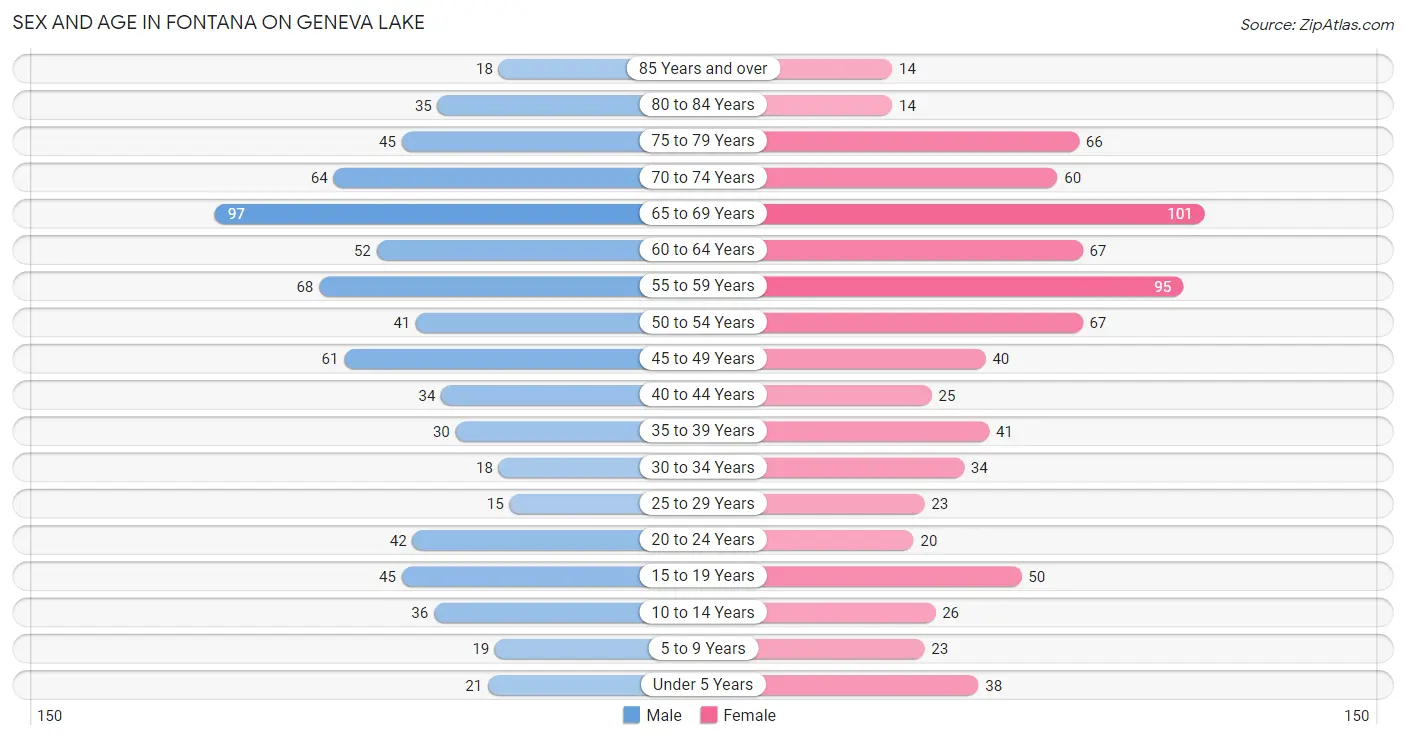
Sex and Age in Fontana on Geneva Lake
Sex and Age in Fontana on Geneva Lake
The most populous age groups in Fontana on Geneva Lake are 65 to 69 Years (97 | 13.1%) for men and 65 to 69 Years (101 | 12.6%) for women.
| Age Bracket | Male | Female |
| Under 5 Years | 21 (2.8%) | 38 (4.7%) |
| 5 to 9 Years | 19 (2.6%) | 23 (2.9%) |
| 10 to 14 Years | 36 (4.9%) | 26 (3.2%) |
| 15 to 19 Years | 45 (6.1%) | 50 (6.2%) |
| 20 to 24 Years | 42 (5.7%) | 20 (2.5%) |
| 25 to 29 Years | 15 (2.0%) | 23 (2.9%) |
| 30 to 34 Years | 18 (2.4%) | 34 (4.2%) |
| 35 to 39 Years | 30 (4.1%) | 41 (5.1%) |
| 40 to 44 Years | 34 (4.6%) | 25 (3.1%) |
| 45 to 49 Years | 61 (8.2%) | 40 (5.0%) |
| 50 to 54 Years | 41 (5.5%) | 67 (8.3%) |
| 55 to 59 Years | 68 (9.2%) | 95 (11.8%) |
| 60 to 64 Years | 52 (7.0%) | 67 (8.3%) |
| 65 to 69 Years | 97 (13.1%) | 101 (12.6%) |
| 70 to 74 Years | 64 (8.6%) | 60 (7.5%) |
| 75 to 79 Years | 45 (6.1%) | 66 (8.2%) |
| 80 to 84 Years | 35 (4.7%) | 14 (1.7%) |
| 85 Years and over | 18 (2.4%) | 14 (1.7%) |
| Total | 741 (100.0%) | 804 (100.0%) |
Families and Households in Fontana on Geneva Lake
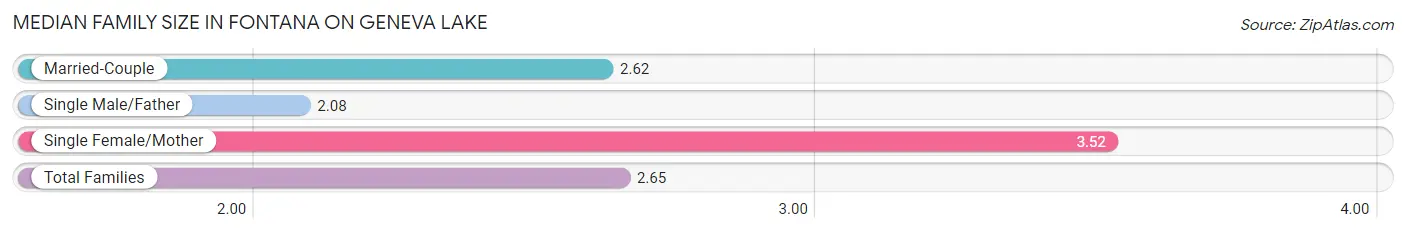
Median Family Size in Fontana on Geneva Lake
The median family size in Fontana on Geneva Lake is 2.65 persons per family, with single female/mother families (25 | 5.1%) accounting for the largest median family size of 3.52 persons per family. On the other hand, single male/father families (12 | 2.4%) represent the smallest median family size with 2.08 persons per family.
| Family Type | # Families | Family Size |
| Married-Couple | 456 (92.5%) | 2.62 |
| Single Male/Father | 12 (2.4%) | 2.08 |
| Single Female/Mother | 25 (5.1%) | 3.52 |
| Total Families | 493 (100.0%) | 2.65 |
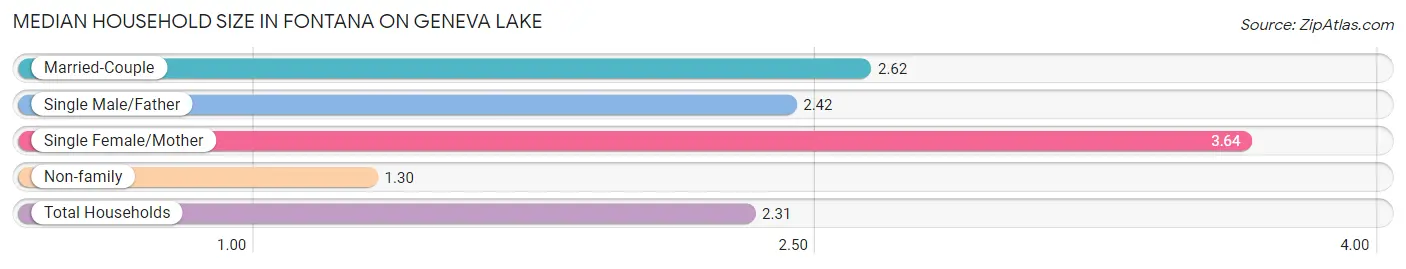
Median Household Size in Fontana on Geneva Lake
The median household size in Fontana on Geneva Lake is 2.31 persons per household, with single female/mother households (25 | 3.7%) accounting for the largest median household size of 3.64 persons per household. non-family households (177 | 26.4%) represent the smallest median household size with 1.30 persons per household.
| Household Type | # Households | Household Size |
| Married-Couple | 456 (68.1%) | 2.62 |
| Single Male/Father | 12 (1.8%) | 2.42 |
| Single Female/Mother | 25 (3.7%) | 3.64 |
| Non-family | 177 (26.4%) | 1.30 |
| Total Households | 670 (100.0%) | 2.31 |
Household Size by Marriage Status in Fontana on Geneva Lake
Out of a total of 670 households in Fontana on Geneva Lake, 493 (73.6%) are family households, while 177 (26.4%) are nonfamily households. The most numerous type of family households are 2-person households, comprising 335, and the most common type of nonfamily households are 1-person households, comprising 129.
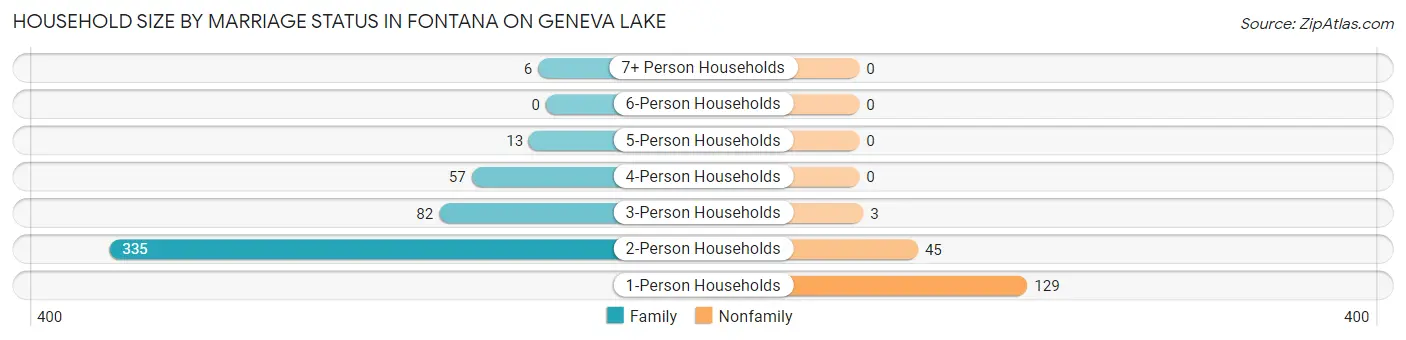
| Household Size | Family Households | Nonfamily Households |
| 1-Person Households | - | 129 (19.3%) |
| 2-Person Households | 335 (50.0%) | 45 (6.7%) |
| 3-Person Households | 82 (12.2%) | 3 (0.4%) |
| 4-Person Households | 57 (8.5%) | 0 (0.0%) |
| 5-Person Households | 13 (1.9%) | 0 (0.0%) |
| 6-Person Households | 0 (0.0%) | 0 (0.0%) |
| 7+ Person Households | 6 (0.9%) | 0 (0.0%) |
| Total | 493 (73.6%) | 177 (26.4%) |
Female Fertility in Fontana on Geneva Lake
Fertility by Age in Fontana on Geneva Lake
Average fertility rate in Fontana on Geneva Lake is 86.0 births per 1,000 women. Women in the age bracket of 20 to 34 years have the highest fertility rate with 221.0 births per 1,000 women. Women in the age bracket of 20 to 34 years acount for 77.3% of all women with births.
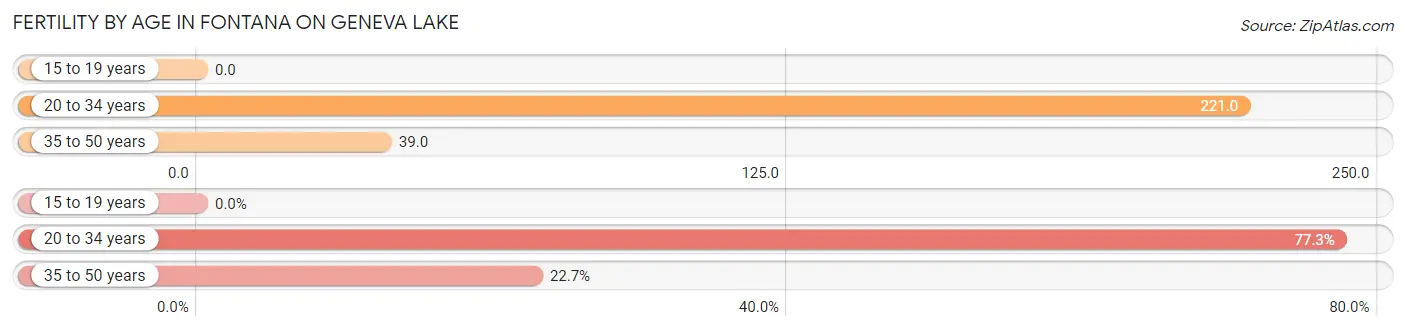
| Age Bracket | Women with Births | Births / 1,000 Women |
| 15 to 19 years | 0 (0.0%) | 0.0 |
| 20 to 34 years | 17 (77.3%) | 221.0 |
| 35 to 50 years | 5 (22.7%) | 39.0 |
| Total | 22 (100.0%) | 86.0 |
Fertility by Age by Marriage Status in Fontana on Geneva Lake
81.8% of women with births (22) in Fontana on Geneva Lake are married. The highest percentage of unmarried women with births falls into 20 to 34 years age bracket with 23.5% of them unmarried at the time of birth, while the lowest percentage of unmarried women with births belong to 35 to 50 years age bracket with 0.0% of them unmarried.
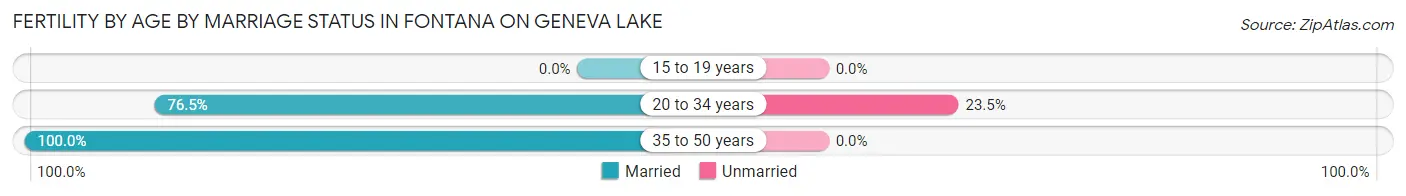
| Age Bracket | Married | Unmarried |
| 15 to 19 years | 0 (0.0%) | 0 (0.0%) |
| 20 to 34 years | 13 (76.5%) | 4 (23.5%) |
| 35 to 50 years | 5 (100.0%) | 0 (0.0%) |
| Total | 18 (81.8%) | 4 (18.2%) |
Fertility by Education in Fontana on Geneva Lake
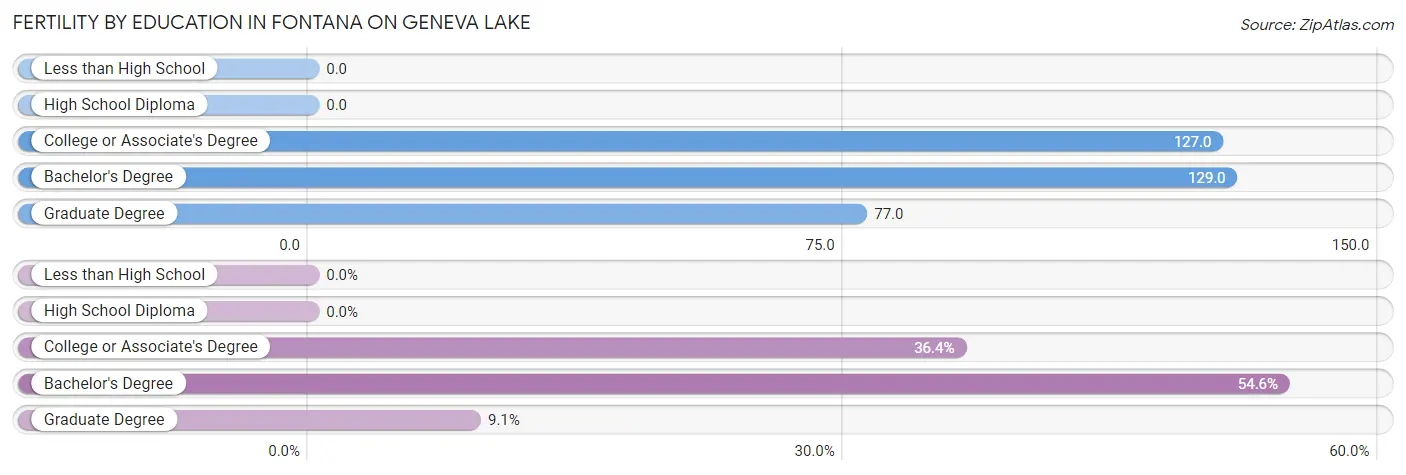
| Educational Attainment | Women with Births | Births / 1,000 Women |
| Less than High School | 0 (0.0%) | 0.0 |
| High School Diploma | 0 (0.0%) | 0.0 |
| College or Associate's Degree | 8 (36.4%) | 127.0 |
| Bachelor's Degree | 12 (54.5%) | 129.0 |
| Graduate Degree | 2 (9.1%) | 77.0 |
| Total | 22 (100.0%) | 86.0 |
Fertility by Education by Marriage Status in Fontana on Geneva Lake
18.2% of women with births in Fontana on Geneva Lake are unmarried. Women with the educational attainment of bachelor's degree are most likely to be married with 100.0% of them married at childbirth, while women with the educational attainment of college or associate's degree are least likely to be married with 50.0% of them unmarried at childbirth.
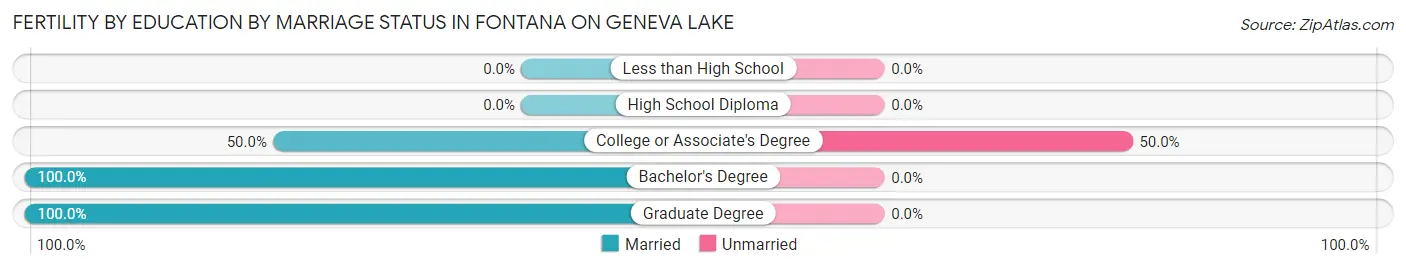
| Educational Attainment | Married | Unmarried |
| Less than High School | 0 (0.0%) | 0 (0.0%) |
| High School Diploma | 0 (0.0%) | 0 (0.0%) |
| College or Associate's Degree | 4 (50.0%) | 4 (50.0%) |
| Bachelor's Degree | 12 (100.0%) | 0 (0.0%) |
| Graduate Degree | 2 (100.0%) | 0 (0.0%) |
| Total | 18 (81.8%) | 4 (18.2%) |
Employment Characteristics in Fontana on Geneva Lake
Employment by Class of Employer in Fontana on Geneva Lake
Among the 729 employed individuals in Fontana on Geneva Lake, private company employees (468 | 64.2%), local government employees (88 | 12.1%), and self-employed (incorporated) (55 | 7.5%) make up the most common classes of employment.
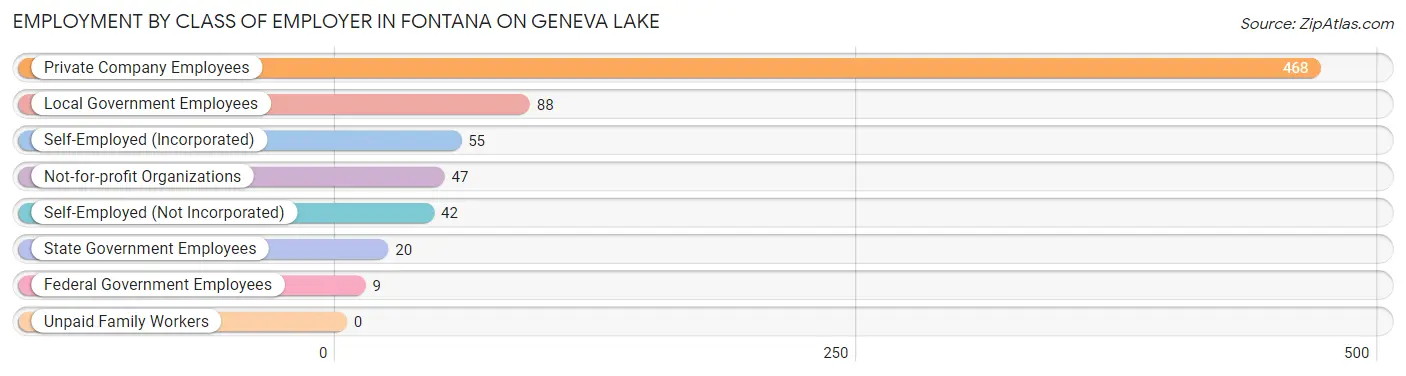
| Employer Class | # Employees | % Employees |
| Private Company Employees | 468 | 64.2% |
| Self-Employed (Incorporated) | 55 | 7.5% |
| Self-Employed (Not Incorporated) | 42 | 5.8% |
| Not-for-profit Organizations | 47 | 6.5% |
| Local Government Employees | 88 | 12.1% |
| State Government Employees | 20 | 2.7% |
| Federal Government Employees | 9 | 1.2% |
| Unpaid Family Workers | 0 | 0.0% |
| Total | 729 | 100.0% |
Employment Status by Age in Fontana on Geneva Lake
According to the labor force statistics for Fontana on Geneva Lake, out of the total population over 16 years of age (1,359), 56.3% or 765 individuals are in the labor force, with 3.8% or 29 of them unemployed. The age group with the highest labor force participation rate is 35 to 44 years, with 90.8% or 118 individuals in the labor force. Within the labor force, the 75 years and over age range has the highest percentage of unemployed individuals, with 15.0% or 3 of them being unemployed.
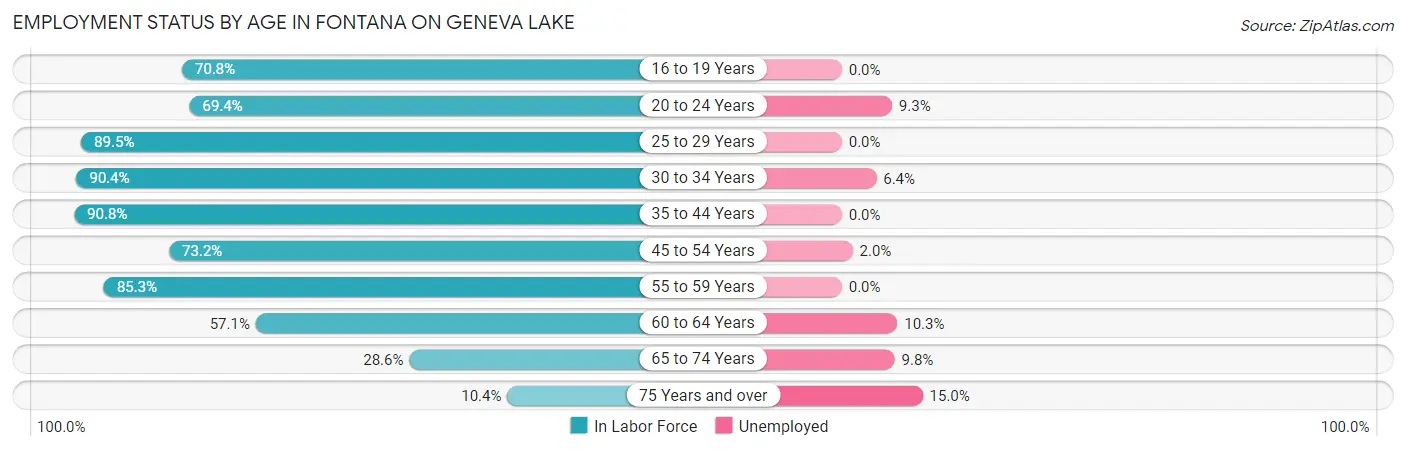
| Age Bracket | In Labor Force | Unemployed |
| 16 to 19 Years | 51 (70.8%) | 0 (0.0%) |
| 20 to 24 Years | 43 (69.4%) | 4 (9.3%) |
| 25 to 29 Years | 34 (89.5%) | 0 (0.0%) |
| 30 to 34 Years | 47 (90.4%) | 3 (6.4%) |
| 35 to 44 Years | 118 (90.8%) | 0 (0.0%) |
| 45 to 54 Years | 153 (73.2%) | 3 (2.0%) |
| 55 to 59 Years | 139 (85.3%) | 0 (0.0%) |
| 60 to 64 Years | 68 (57.1%) | 7 (10.3%) |
| 65 to 74 Years | 92 (28.6%) | 9 (9.8%) |
| 75 Years and over | 20 (10.4%) | 3 (15.0%) |
| Total | 765 (56.3%) | 29 (3.8%) |
Employment Status by Educational Attainment in Fontana on Geneva Lake
According to labor force statistics for Fontana on Geneva Lake, 78.6% of individuals (559) out of the total population between 25 and 64 years of age (711) are in the labor force, with 2.3% or 13 of them being unemployed. The group with the highest labor force participation rate are those with the educational attainment of college / associate degree, with 82.3% or 177 individuals in the labor force. Within the labor force, individuals with bachelor's degree or higher education have the highest percentage of unemployment, with 2.7% or 9 of them being unemployed.
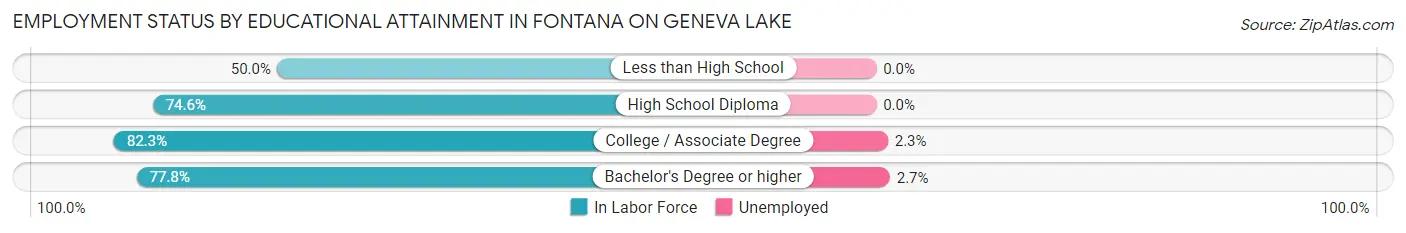
| Educational Attainment | In Labor Force | Unemployed |
| Less than High School | 3 (50.0%) | 0 (0.0%) |
| High School Diploma | 50 (74.6%) | 0 (0.0%) |
| College / Associate Degree | 177 (82.3%) | 5 (2.3%) |
| Bachelor's Degree or higher | 329 (77.8%) | 11 (2.7%) |
| Total | 559 (78.6%) | 16 (2.3%) |
Employment Occupations by Sex in Fontana on Geneva Lake
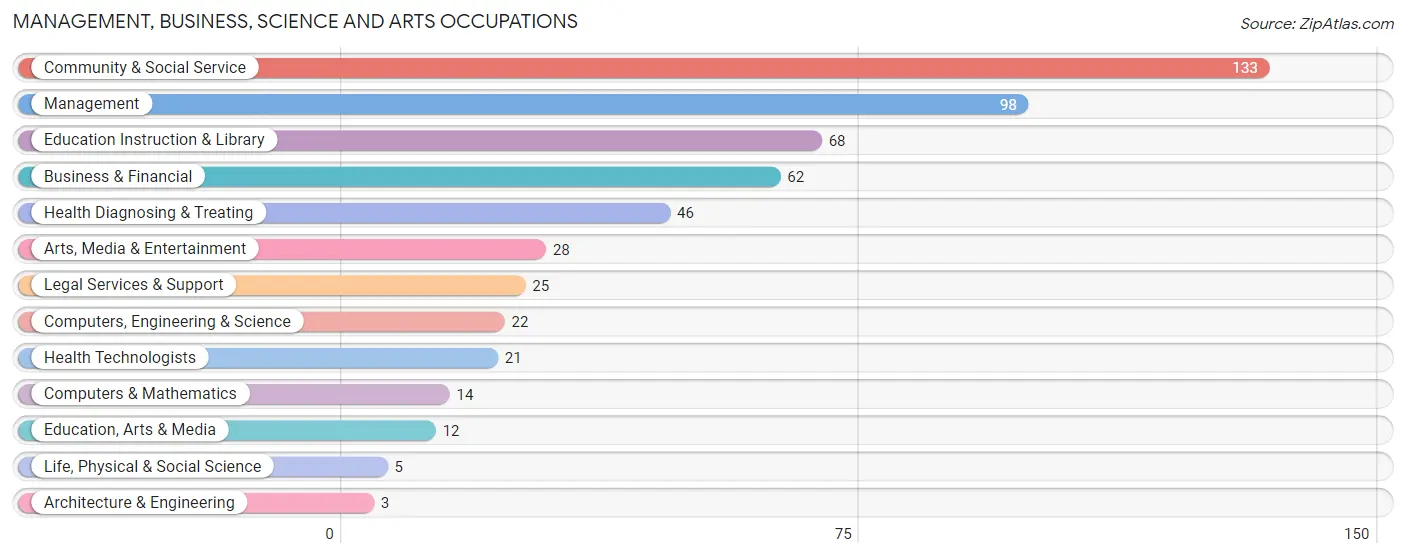
Management, Business, Science and Arts Occupations
The most common Management, Business, Science and Arts occupations in Fontana on Geneva Lake are Community & Social Service (133 | 18.1%), Management (98 | 13.3%), Education Instruction & Library (68 | 9.2%), Business & Financial (62 | 8.4%), and Health Diagnosing & Treating (46 | 6.2%).
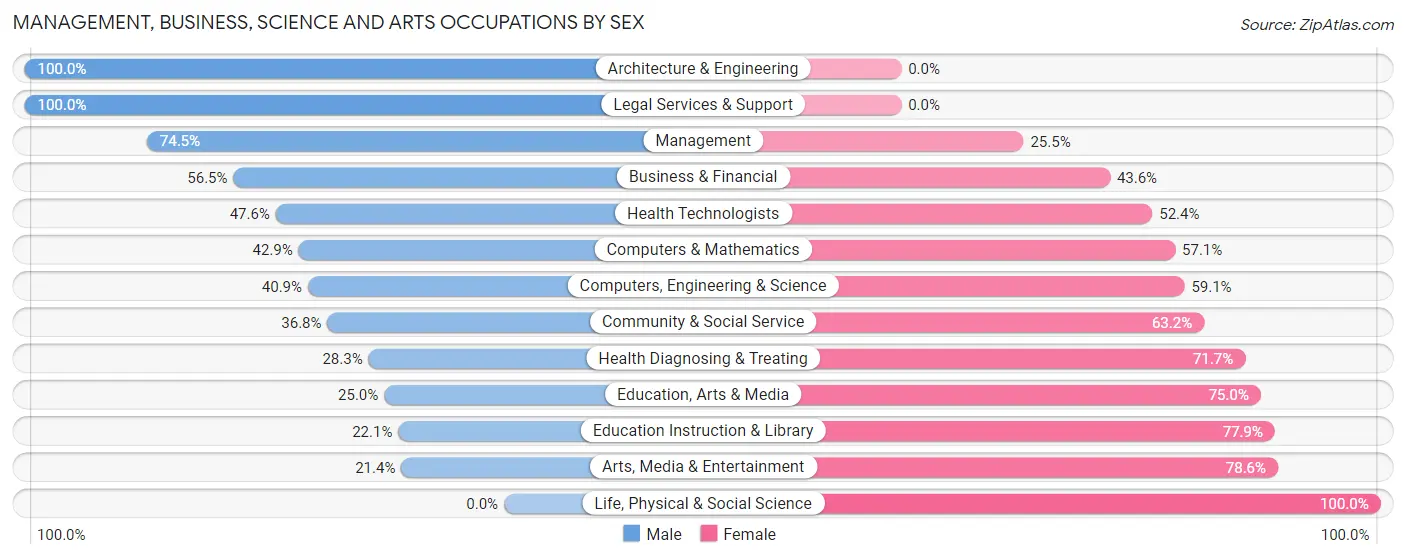
Management, Business, Science and Arts Occupations by Sex
Within the Management, Business, Science and Arts occupations in Fontana on Geneva Lake, the most male-oriented occupations are Architecture & Engineering (100.0%), Legal Services & Support (100.0%), and Management (74.5%), while the most female-oriented occupations are Life, Physical & Social Science (100.0%), Arts, Media & Entertainment (78.6%), and Education Instruction & Library (77.9%).
| Occupation | Male | Female |
| Management | 73 (74.5%) | 25 (25.5%) |
| Business & Financial | 35 (56.5%) | 27 (43.5%) |
| Computers, Engineering & Science | 9 (40.9%) | 13 (59.1%) |
| Computers & Mathematics | 6 (42.9%) | 8 (57.1%) |
| Architecture & Engineering | 3 (100.0%) | 0 (0.0%) |
| Life, Physical & Social Science | 0 (0.0%) | 5 (100.0%) |
| Community & Social Service | 49 (36.8%) | 84 (63.2%) |
| Education, Arts & Media | 3 (25.0%) | 9 (75.0%) |
| Legal Services & Support | 25 (100.0%) | 0 (0.0%) |
| Education Instruction & Library | 15 (22.1%) | 53 (77.9%) |
| Arts, Media & Entertainment | 6 (21.4%) | 22 (78.6%) |
| Health Diagnosing & Treating | 13 (28.3%) | 33 (71.7%) |
| Health Technologists | 10 (47.6%) | 11 (52.4%) |
| Total (Category) | 179 (49.6%) | 182 (50.4%) |
| Total (Overall) | 371 (50.4%) | 365 (49.6%) |
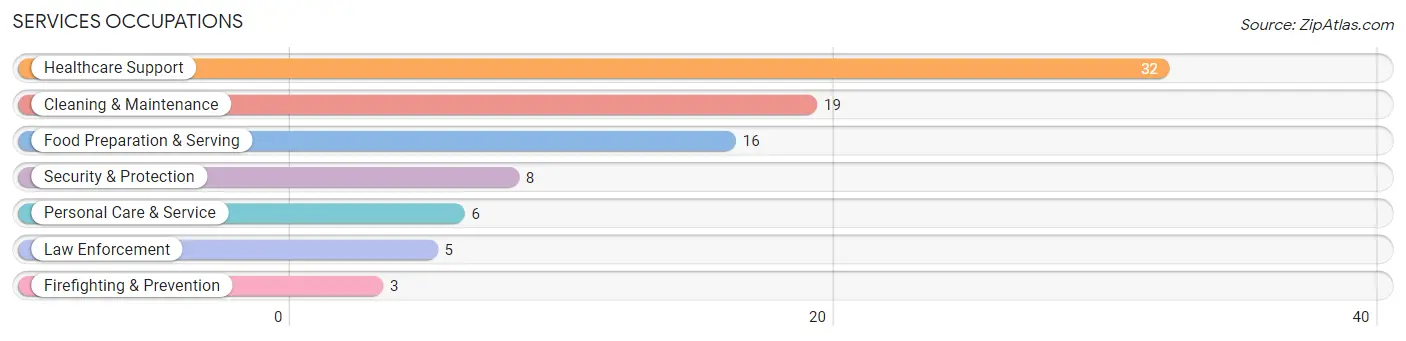
Services Occupations
The most common Services occupations in Fontana on Geneva Lake are Healthcare Support (32 | 4.3%), Cleaning & Maintenance (19 | 2.6%), Food Preparation & Serving (16 | 2.2%), Security & Protection (8 | 1.1%), and Personal Care & Service (6 | 0.8%).
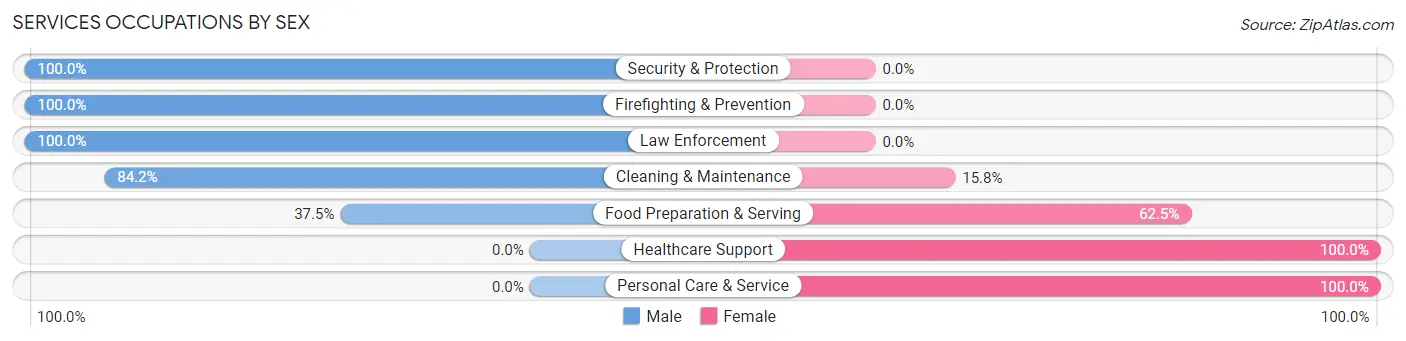
Services Occupations by Sex
Within the Services occupations in Fontana on Geneva Lake, the most male-oriented occupations are Security & Protection (100.0%), Firefighting & Prevention (100.0%), and Law Enforcement (100.0%), while the most female-oriented occupations are Healthcare Support (100.0%), Personal Care & Service (100.0%), and Food Preparation & Serving (62.5%).
| Occupation | Male | Female |
| Healthcare Support | 0 (0.0%) | 32 (100.0%) |
| Security & Protection | 8 (100.0%) | 0 (0.0%) |
| Firefighting & Prevention | 3 (100.0%) | 0 (0.0%) |
| Law Enforcement | 5 (100.0%) | 0 (0.0%) |
| Food Preparation & Serving | 6 (37.5%) | 10 (62.5%) |
| Cleaning & Maintenance | 16 (84.2%) | 3 (15.8%) |
| Personal Care & Service | 0 (0.0%) | 6 (100.0%) |
| Total (Category) | 30 (37.0%) | 51 (63.0%) |
| Total (Overall) | 371 (50.4%) | 365 (49.6%) |
Sales and Office Occupations
The most common Sales and Office occupations in Fontana on Geneva Lake are Sales & Related (115 | 15.6%), and Office & Administration (39 | 5.3%).
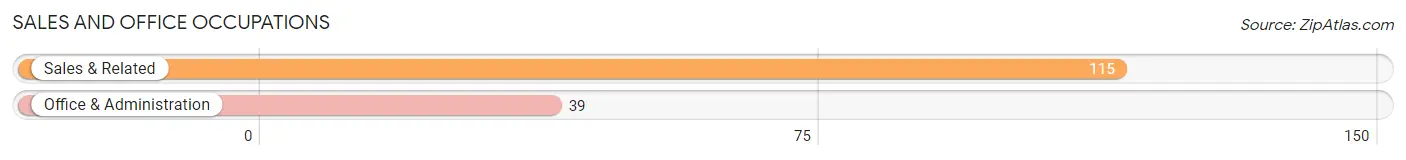
Sales and Office Occupations by Sex
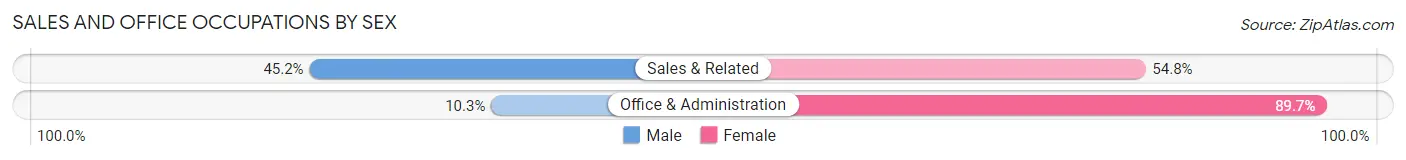
| Occupation | Male | Female |
| Sales & Related | 52 (45.2%) | 63 (54.8%) |
| Office & Administration | 4 (10.3%) | 35 (89.7%) |
| Total (Category) | 56 (36.4%) | 98 (63.6%) |
| Total (Overall) | 371 (50.4%) | 365 (49.6%) |
Natural Resources, Construction and Maintenance Occupations
The most common Natural Resources, Construction and Maintenance occupations in Fontana on Geneva Lake are Construction & Extraction (21 | 2.9%), and Installation, Maintenance & Repair (6 | 0.8%).
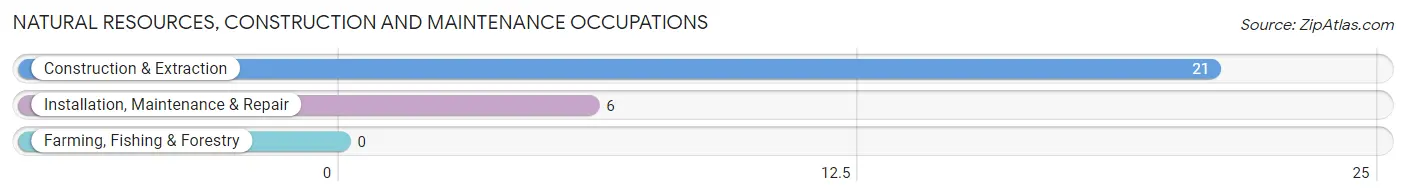
Natural Resources, Construction and Maintenance Occupations by Sex
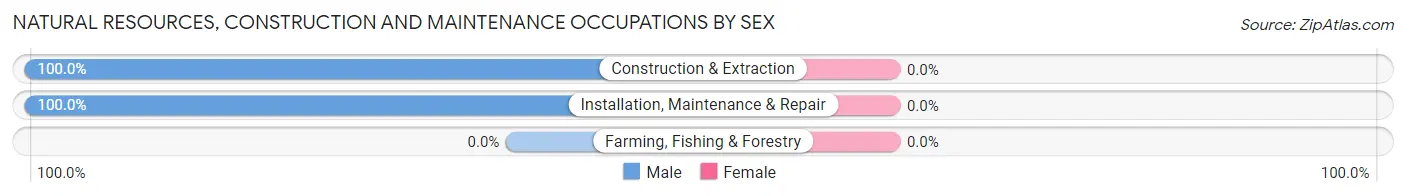
| Occupation | Male | Female |
| Farming, Fishing & Forestry | 0 (0.0%) | 0 (0.0%) |
| Construction & Extraction | 21 (100.0%) | 0 (0.0%) |
| Installation, Maintenance & Repair | 6 (100.0%) | 0 (0.0%) |
| Total (Category) | 27 (100.0%) | 0 (0.0%) |
| Total (Overall) | 371 (50.4%) | 365 (49.6%) |
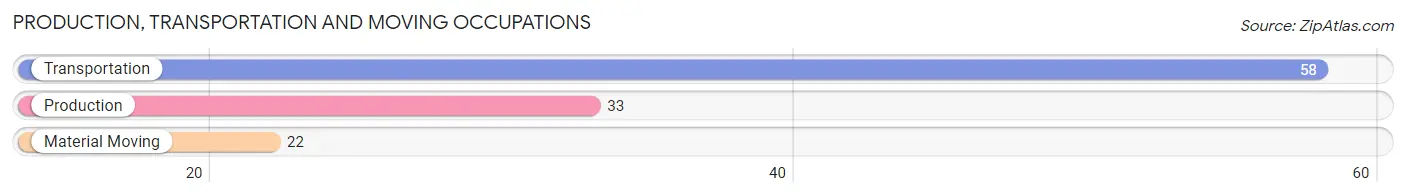
Production, Transportation and Moving Occupations
The most common Production, Transportation and Moving occupations in Fontana on Geneva Lake are Transportation (58 | 7.9%), Production (33 | 4.5%), and Material Moving (22 | 3.0%).
Production, Transportation and Moving Occupations by Sex
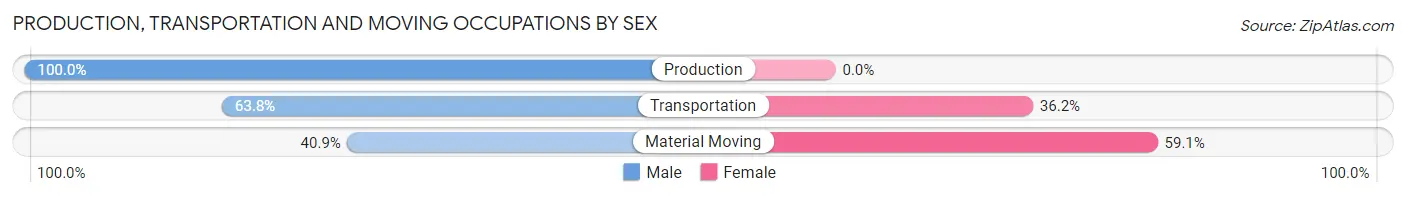
| Occupation | Male | Female |
| Production | 33 (100.0%) | 0 (0.0%) |
| Transportation | 37 (63.8%) | 21 (36.2%) |
| Material Moving | 9 (40.9%) | 13 (59.1%) |
| Total (Category) | 79 (69.9%) | 34 (30.1%) |
| Total (Overall) | 371 (50.4%) | 365 (49.6%) |
Employment Industries by Sex in Fontana on Geneva Lake
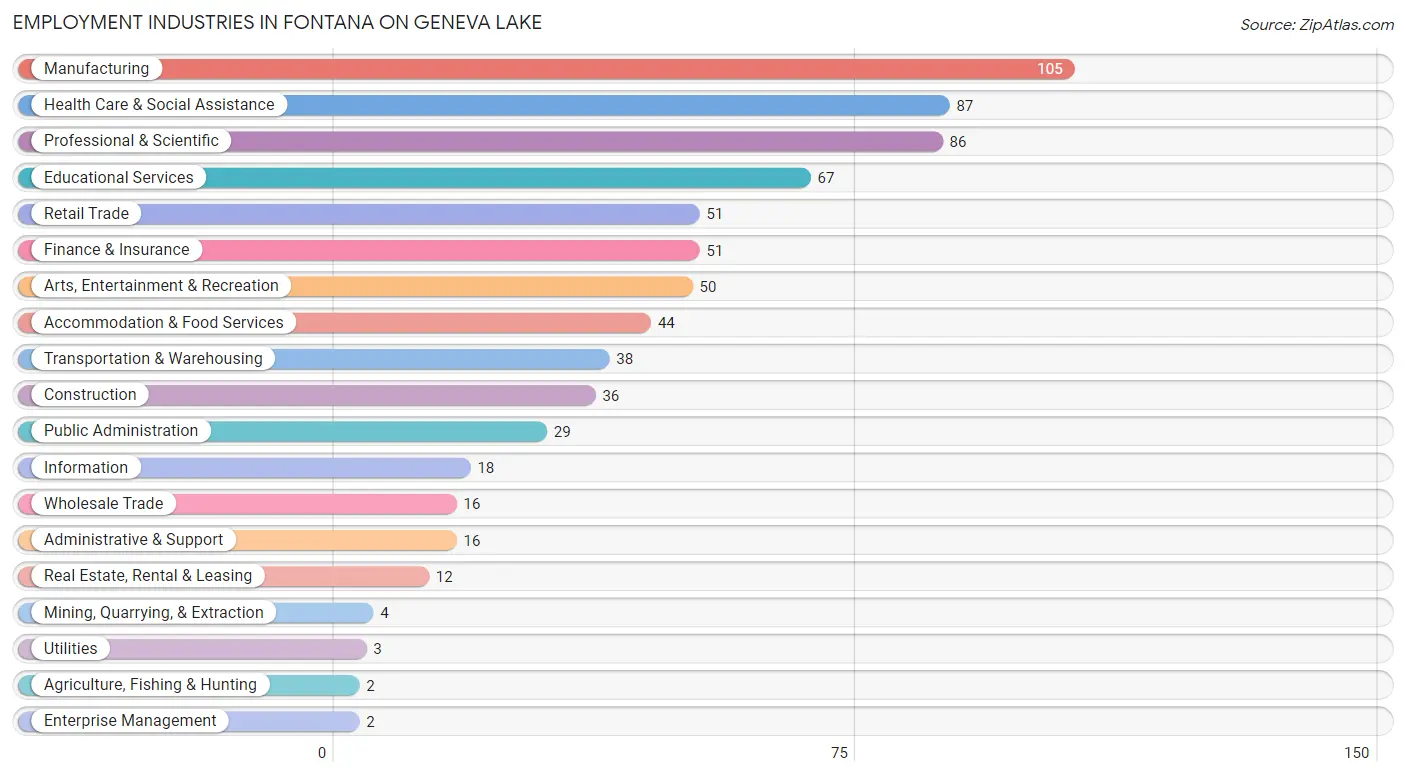
Employment Industries in Fontana on Geneva Lake
The major employment industries in Fontana on Geneva Lake include Manufacturing (105 | 14.3%), Health Care & Social Assistance (87 | 11.8%), Professional & Scientific (86 | 11.7%), Educational Services (67 | 9.1%), and Retail Trade (51 | 6.9%).
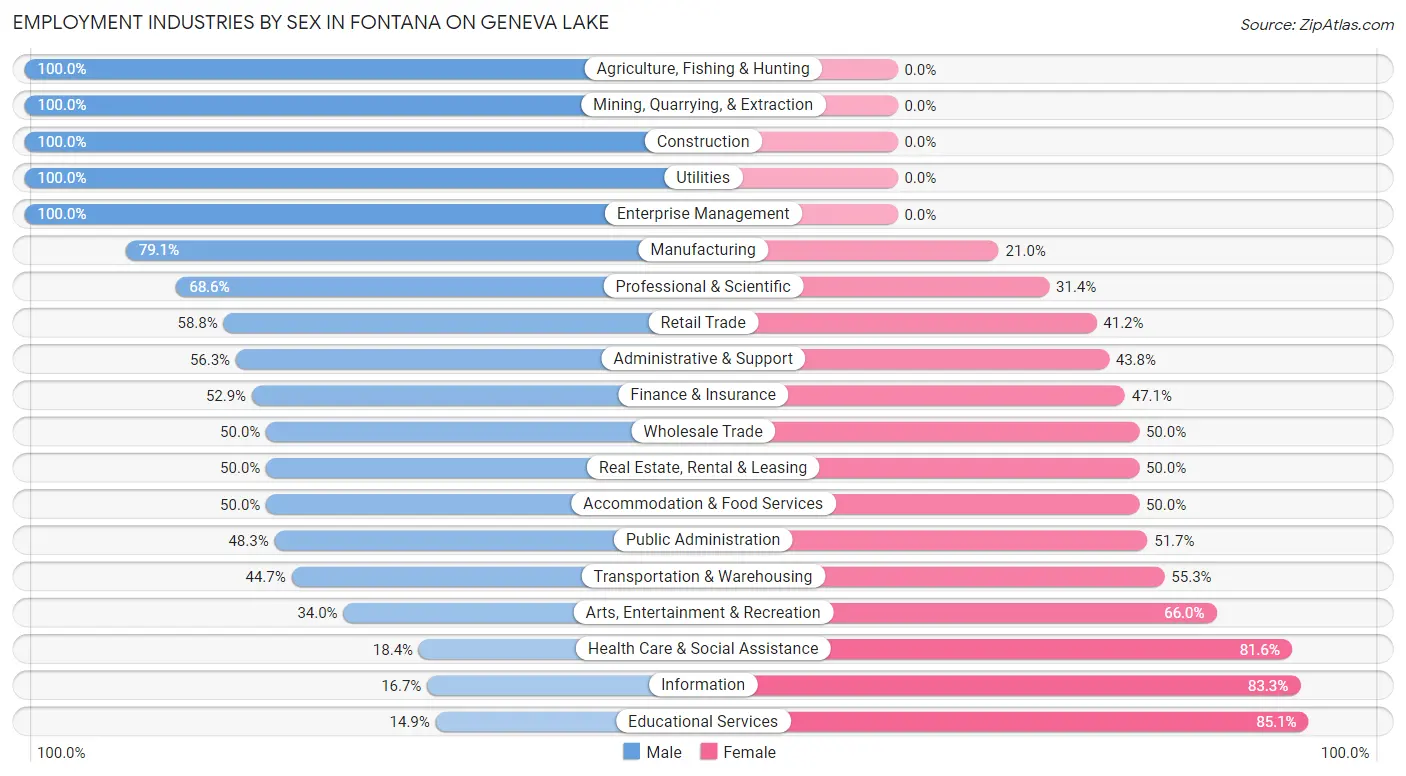
Employment Industries by Sex in Fontana on Geneva Lake
The Fontana on Geneva Lake industries that see more men than women are Agriculture, Fishing & Hunting (100.0%), Mining, Quarrying, & Extraction (100.0%), and Construction (100.0%), whereas the industries that tend to have a higher number of women are Educational Services (85.1%), Information (83.3%), and Health Care & Social Assistance (81.6%).
| Industry | Male | Female |
| Agriculture, Fishing & Hunting | 2 (100.0%) | 0 (0.0%) |
| Mining, Quarrying, & Extraction | 4 (100.0%) | 0 (0.0%) |
| Construction | 36 (100.0%) | 0 (0.0%) |
| Manufacturing | 83 (79.0%) | 22 (20.9%) |
| Wholesale Trade | 8 (50.0%) | 8 (50.0%) |
| Retail Trade | 30 (58.8%) | 21 (41.2%) |
| Transportation & Warehousing | 17 (44.7%) | 21 (55.3%) |
| Utilities | 3 (100.0%) | 0 (0.0%) |
| Information | 3 (16.7%) | 15 (83.3%) |
| Finance & Insurance | 27 (52.9%) | 24 (47.1%) |
| Real Estate, Rental & Leasing | 6 (50.0%) | 6 (50.0%) |
| Professional & Scientific | 59 (68.6%) | 27 (31.4%) |
| Enterprise Management | 2 (100.0%) | 0 (0.0%) |
| Administrative & Support | 9 (56.2%) | 7 (43.8%) |
| Educational Services | 10 (14.9%) | 57 (85.1%) |
| Health Care & Social Assistance | 16 (18.4%) | 71 (81.6%) |
| Arts, Entertainment & Recreation | 17 (34.0%) | 33 (66.0%) |
| Accommodation & Food Services | 22 (50.0%) | 22 (50.0%) |
| Public Administration | 14 (48.3%) | 15 (51.7%) |
| Total | 371 (50.4%) | 365 (49.6%) |
Education in Fontana on Geneva Lake
School Enrollment in Fontana on Geneva Lake
The most common levels of schooling among the 237 students in Fontana on Geneva Lake are high school (100 | 42.2%), elementary school (52 | 21.9%), and college / undergraduate (49 | 20.7%).
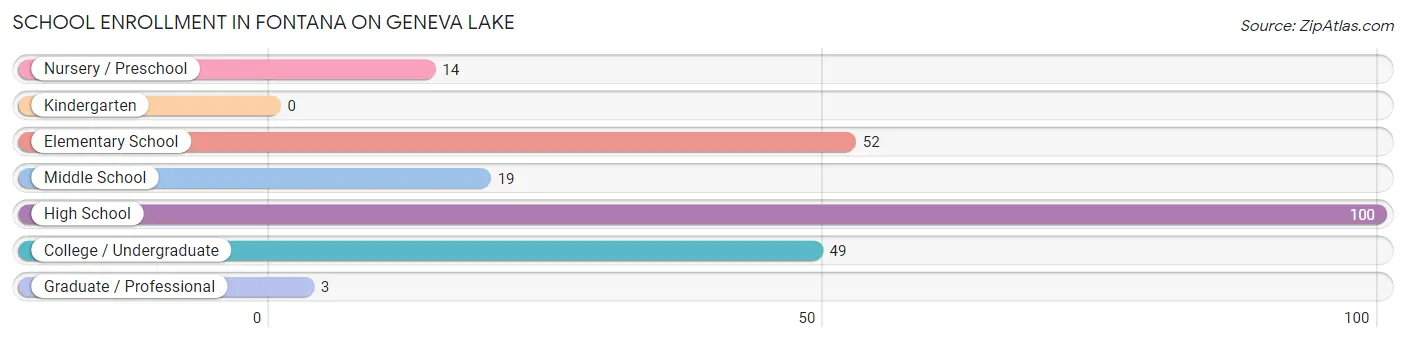
| School Level | # Students | % Students |
| Nursery / Preschool | 14 | 5.9% |
| Kindergarten | 0 | 0.0% |
| Elementary School | 52 | 21.9% |
| Middle School | 19 | 8.0% |
| High School | 100 | 42.2% |
| College / Undergraduate | 49 | 20.7% |
| Graduate / Professional | 3 | 1.3% |
| Total | 237 | 100.0% |
School Enrollment by Age by Funding Source in Fontana on Geneva Lake
Out of a total of 237 students who are enrolled in schools in Fontana on Geneva Lake, 12 (5.1%) attend a private institution, while the remaining 225 (94.9%) are enrolled in public schools. The age group of 25 to 34 year olds has the highest likelihood of being enrolled in private schools, with 3 (100.0% in the age bracket) enrolled. Conversely, the age group of 3 to 4 year olds has the lowest likelihood of being enrolled in a private school, with 12 (100.0% in the age bracket) attending a public institution.
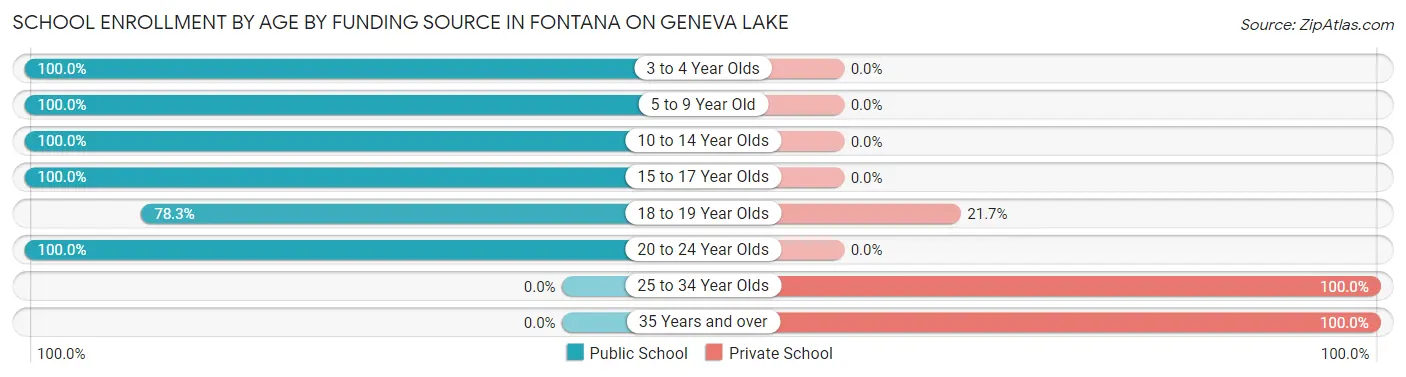
| Age Bracket | Public School | Private School |
| 3 to 4 Year Olds | 12 (100.0%) | 0 (0.0%) |
| 5 to 9 Year Old | 39 (100.0%) | 0 (0.0%) |
| 10 to 14 Year Olds | 62 (100.0%) | 0 (0.0%) |
| 15 to 17 Year Olds | 62 (100.0%) | 0 (0.0%) |
| 18 to 19 Year Olds | 18 (78.3%) | 5 (21.7%) |
| 20 to 24 Year Olds | 32 (100.0%) | 0 (0.0%) |
| 25 to 34 Year Olds | 0 (0.0%) | 3 (100.0%) |
| 35 Years and over | 0 (0.0%) | 4 (100.0%) |
| Total | 225 (94.9%) | 12 (5.1%) |
Educational Attainment by Field of Study in Fontana on Geneva Lake
Business (135 | 17.6%), education (118 | 15.4%), social sciences (72 | 9.4%), arts & humanities (53 | 6.9%), and science & technology (50 | 6.5%) are the most common fields of study among 767 individuals in Fontana on Geneva Lake who have obtained a bachelor's degree or higher.
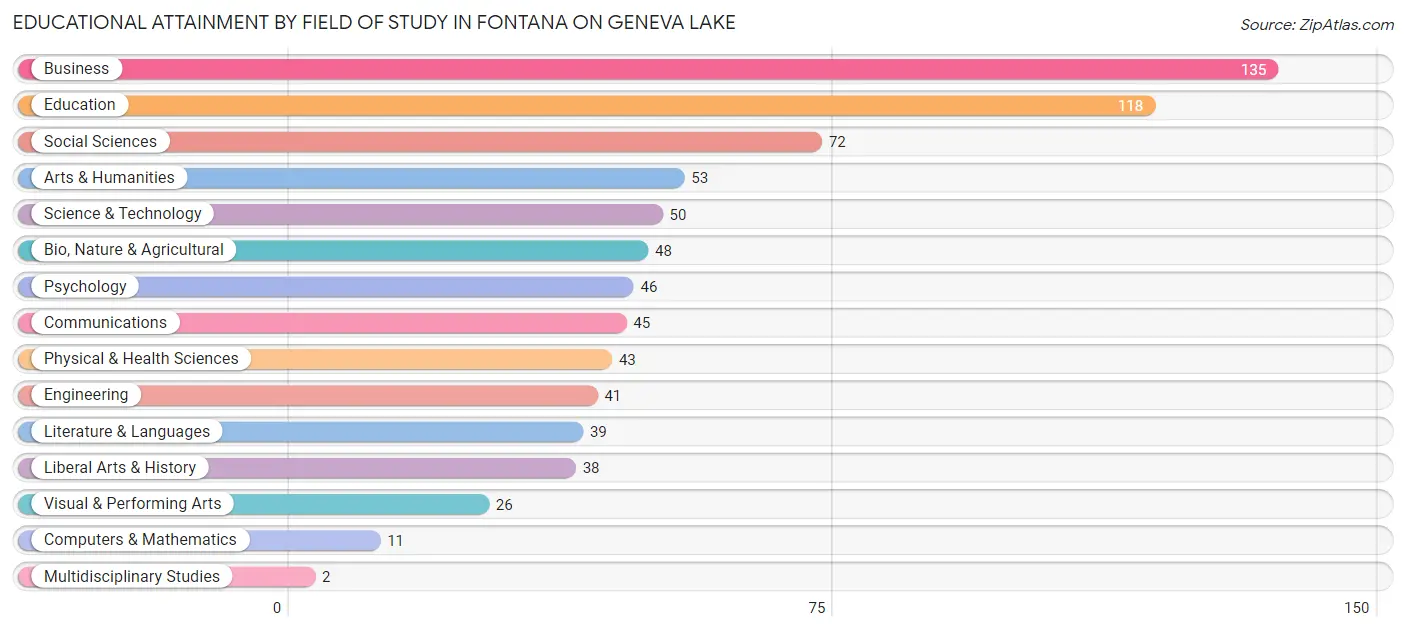
| Field of Study | # Graduates | % Graduates |
| Computers & Mathematics | 11 | 1.4% |
| Bio, Nature & Agricultural | 48 | 6.3% |
| Physical & Health Sciences | 43 | 5.6% |
| Psychology | 46 | 6.0% |
| Social Sciences | 72 | 9.4% |
| Engineering | 41 | 5.3% |
| Multidisciplinary Studies | 2 | 0.3% |
| Science & Technology | 50 | 6.5% |
| Business | 135 | 17.6% |
| Education | 118 | 15.4% |
| Literature & Languages | 39 | 5.1% |
| Liberal Arts & History | 38 | 5.0% |
| Visual & Performing Arts | 26 | 3.4% |
| Communications | 45 | 5.9% |
| Arts & Humanities | 53 | 6.9% |
| Total | 767 | 100.0% |
Transportation & Commute in Fontana on Geneva Lake
Vehicle Availability by Sex in Fontana on Geneva Lake
The most prevalent vehicle ownership categories in Fontana on Geneva Lake are males with 2 vehicles (170, accounting for 46.3%) and females with 2 vehicles (160, making up 47.0%).
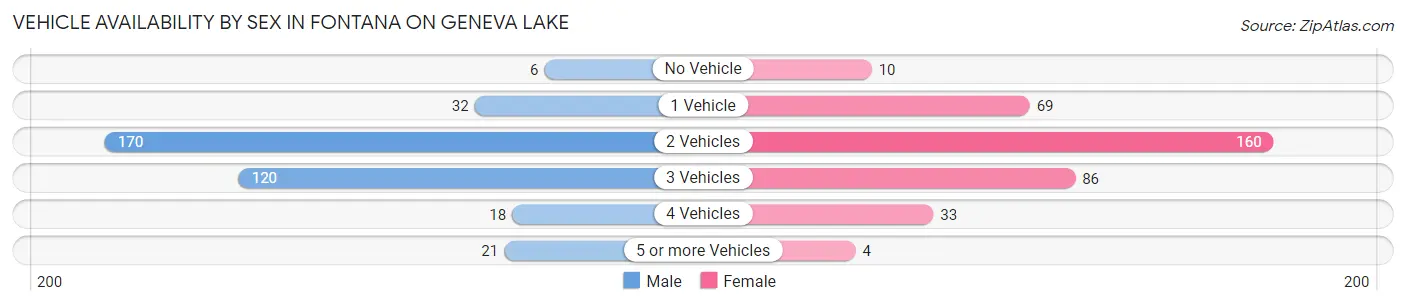
| Vehicles Available | Male | Female |
| No Vehicle | 6 (1.6%) | 10 (2.8%) |
| 1 Vehicle | 32 (8.7%) | 69 (19.1%) |
| 2 Vehicles | 170 (46.3%) | 160 (44.2%) |
| 3 Vehicles | 120 (32.7%) | 86 (23.8%) |
| 4 Vehicles | 18 (4.9%) | 33 (9.1%) |
| 5 or more Vehicles | 21 (5.7%) | 4 (1.1%) |
| Total | 367 (100.0%) | 362 (100.0%) |
Commute Time in Fontana on Geneva Lake
The most frequently occuring commute durations in Fontana on Geneva Lake are 5 to 9 minutes (100 commuters, 17.4%), 15 to 19 minutes (71 commuters, 12.3%), and 10 to 14 minutes (69 commuters, 12.0%).
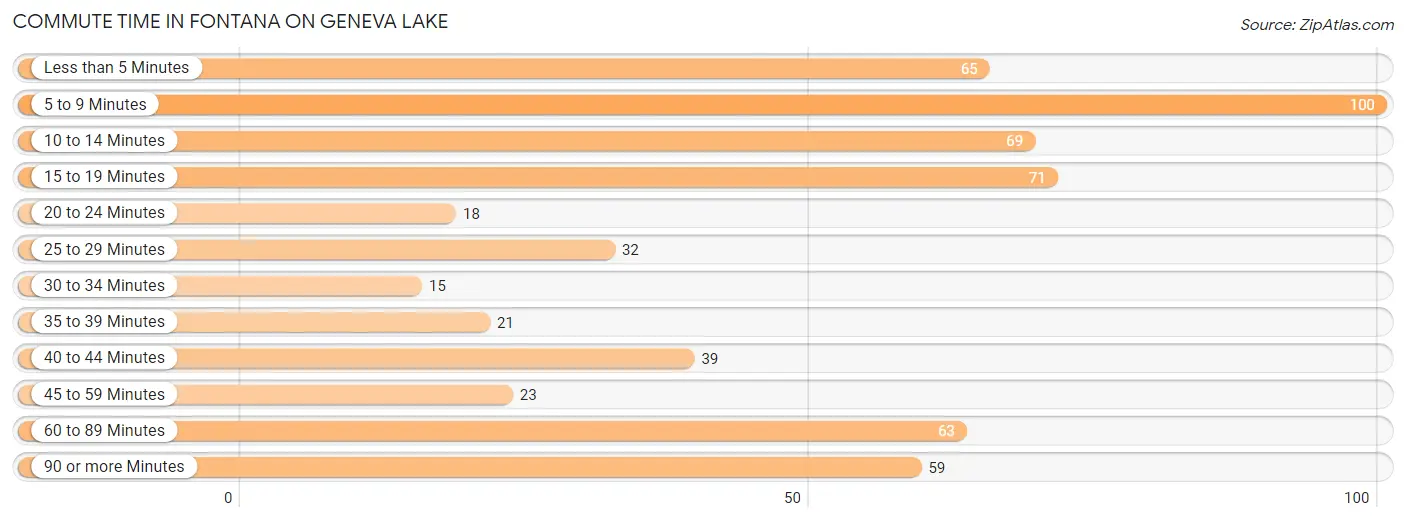
| Commute Time | # Commuters | % Commuters |
| Less than 5 Minutes | 65 | 11.3% |
| 5 to 9 Minutes | 100 | 17.4% |
| 10 to 14 Minutes | 69 | 12.0% |
| 15 to 19 Minutes | 71 | 12.3% |
| 20 to 24 Minutes | 18 | 3.1% |
| 25 to 29 Minutes | 32 | 5.6% |
| 30 to 34 Minutes | 15 | 2.6% |
| 35 to 39 Minutes | 21 | 3.6% |
| 40 to 44 Minutes | 39 | 6.8% |
| 45 to 59 Minutes | 23 | 4.0% |
| 60 to 89 Minutes | 63 | 11.0% |
| 90 or more Minutes | 59 | 10.3% |
Commute Time by Sex in Fontana on Geneva Lake
The most common commute times in Fontana on Geneva Lake are 5 to 9 minutes (56 commuters, 19.9%) for males and 10 to 14 minutes (52 commuters, 17.7%) for females.
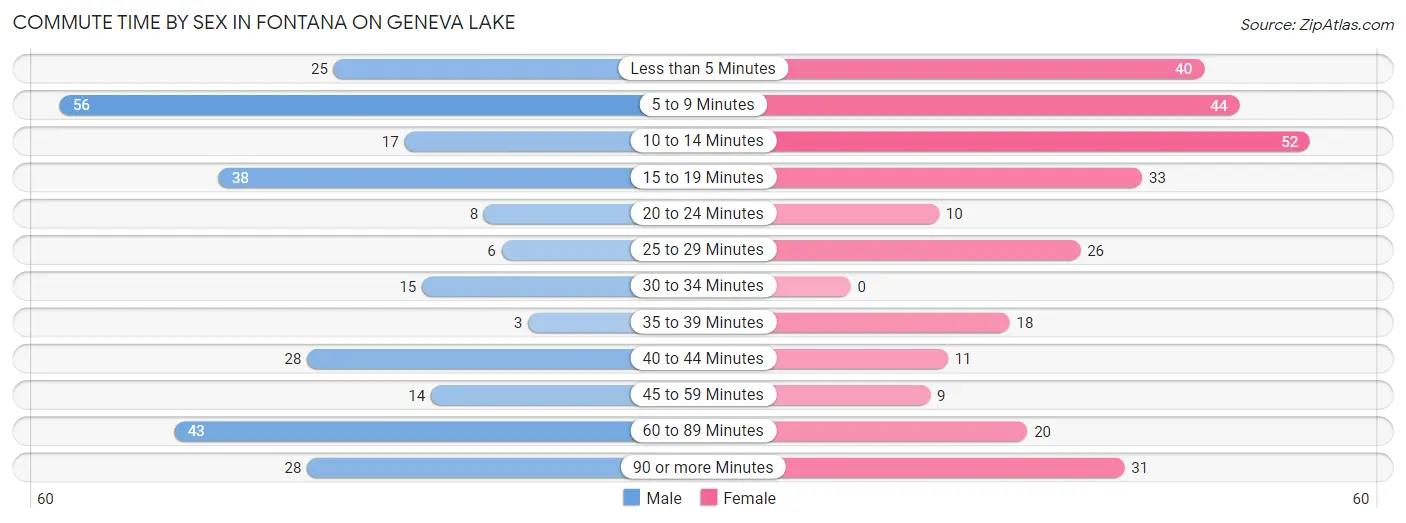
| Commute Time | Male | Female |
| Less than 5 Minutes | 25 (8.9%) | 40 (13.6%) |
| 5 to 9 Minutes | 56 (19.9%) | 44 (15.0%) |
| 10 to 14 Minutes | 17 (6.0%) | 52 (17.7%) |
| 15 to 19 Minutes | 38 (13.5%) | 33 (11.2%) |
| 20 to 24 Minutes | 8 (2.9%) | 10 (3.4%) |
| 25 to 29 Minutes | 6 (2.1%) | 26 (8.8%) |
| 30 to 34 Minutes | 15 (5.3%) | 0 (0.0%) |
| 35 to 39 Minutes | 3 (1.1%) | 18 (6.1%) |
| 40 to 44 Minutes | 28 (10.0%) | 11 (3.7%) |
| 45 to 59 Minutes | 14 (5.0%) | 9 (3.1%) |
| 60 to 89 Minutes | 43 (15.3%) | 20 (6.8%) |
| 90 or more Minutes | 28 (10.0%) | 31 (10.5%) |
Time of Departure to Work by Sex in Fontana on Geneva Lake
The most frequent times of departure to work in Fontana on Geneva Lake are 8:00 AM to 8:29 AM (67, 23.8%) for males and 7:00 AM to 7:29 AM (73, 24.8%) for females.
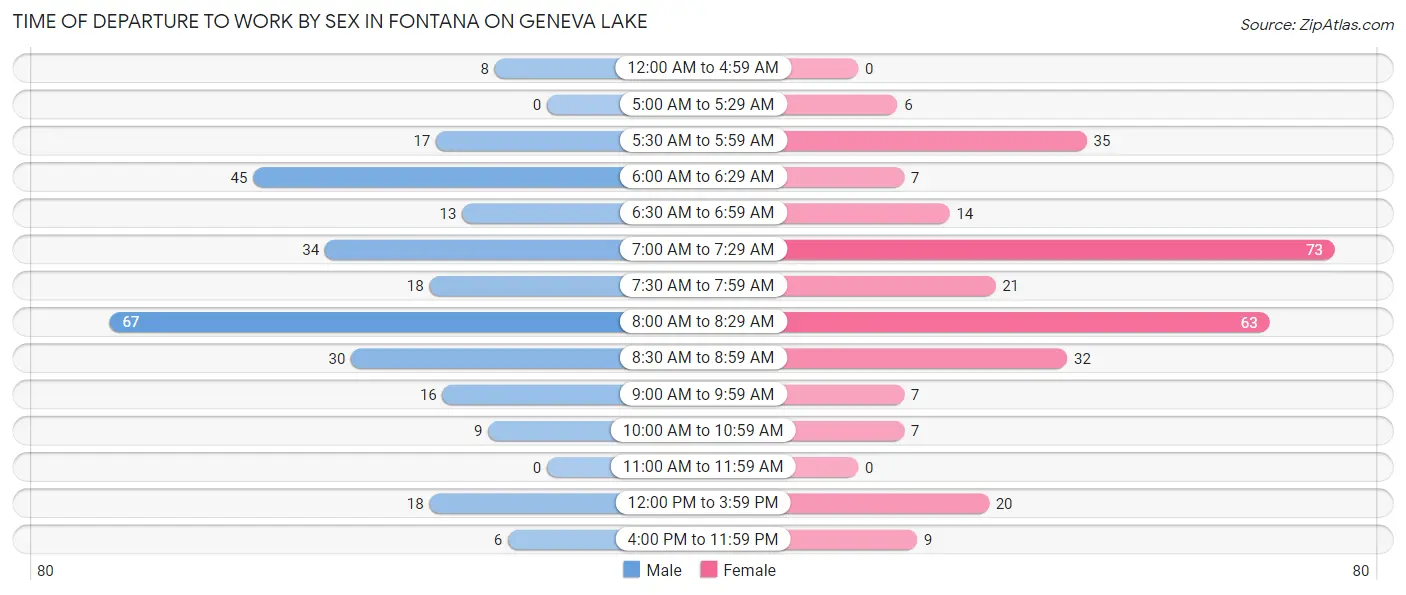
| Time of Departure | Male | Female |
| 12:00 AM to 4:59 AM | 8 (2.9%) | 0 (0.0%) |
| 5:00 AM to 5:29 AM | 0 (0.0%) | 6 (2.0%) |
| 5:30 AM to 5:59 AM | 17 (6.0%) | 35 (11.9%) |
| 6:00 AM to 6:29 AM | 45 (16.0%) | 7 (2.4%) |
| 6:30 AM to 6:59 AM | 13 (4.6%) | 14 (4.8%) |
| 7:00 AM to 7:29 AM | 34 (12.1%) | 73 (24.8%) |
| 7:30 AM to 7:59 AM | 18 (6.4%) | 21 (7.1%) |
| 8:00 AM to 8:29 AM | 67 (23.8%) | 63 (21.4%) |
| 8:30 AM to 8:59 AM | 30 (10.7%) | 32 (10.9%) |
| 9:00 AM to 9:59 AM | 16 (5.7%) | 7 (2.4%) |
| 10:00 AM to 10:59 AM | 9 (3.2%) | 7 (2.4%) |
| 11:00 AM to 11:59 AM | 0 (0.0%) | 0 (0.0%) |
| 12:00 PM to 3:59 PM | 18 (6.4%) | 20 (6.8%) |
| 4:00 PM to 11:59 PM | 6 (2.1%) | 9 (3.1%) |
| Total | 281 (100.0%) | 294 (100.0%) |
Housing Occupancy in Fontana on Geneva Lake
Occupancy by Ownership in Fontana on Geneva Lake
Of the total 670 dwellings in Fontana on Geneva Lake, owner-occupied units account for 575 (85.8%), while renter-occupied units make up 95 (14.2%).
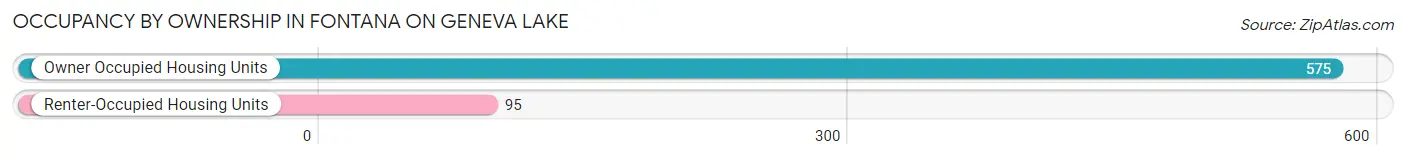
| Occupancy | # Housing Units | % Housing Units |
| Owner Occupied Housing Units | 575 | 85.8% |
| Renter-Occupied Housing Units | 95 | 14.2% |
| Total Occupied Housing Units | 670 | 100.0% |
Occupancy by Household Size in Fontana on Geneva Lake
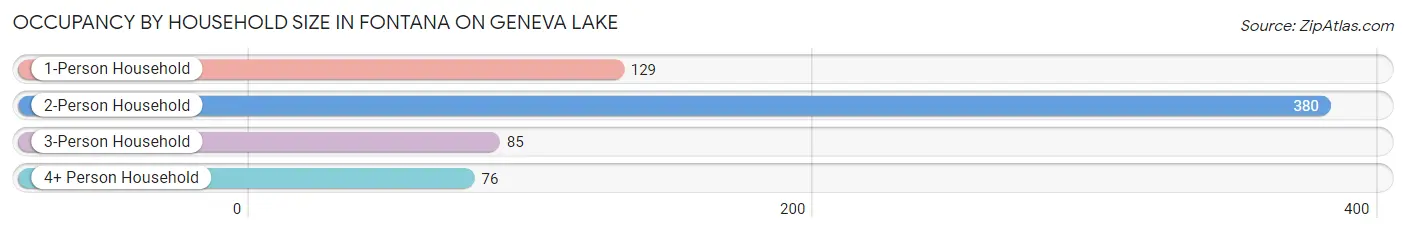
| Household Size | # Housing Units | % Housing Units |
| 1-Person Household | 129 | 19.3% |
| 2-Person Household | 380 | 56.7% |
| 3-Person Household | 85 | 12.7% |
| 4+ Person Household | 76 | 11.3% |
| Total Housing Units | 670 | 100.0% |
Occupancy by Ownership by Household Size in Fontana on Geneva Lake
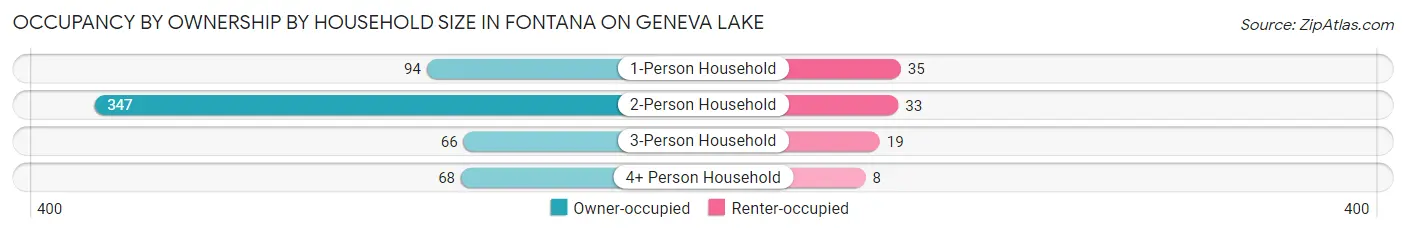
| Household Size | Owner-occupied | Renter-occupied |
| 1-Person Household | 94 (72.9%) | 35 (27.1%) |
| 2-Person Household | 347 (91.3%) | 33 (8.7%) |
| 3-Person Household | 66 (77.6%) | 19 (22.4%) |
| 4+ Person Household | 68 (89.5%) | 8 (10.5%) |
| Total Housing Units | 575 (85.8%) | 95 (14.2%) |
Occupancy by Educational Attainment in Fontana on Geneva Lake
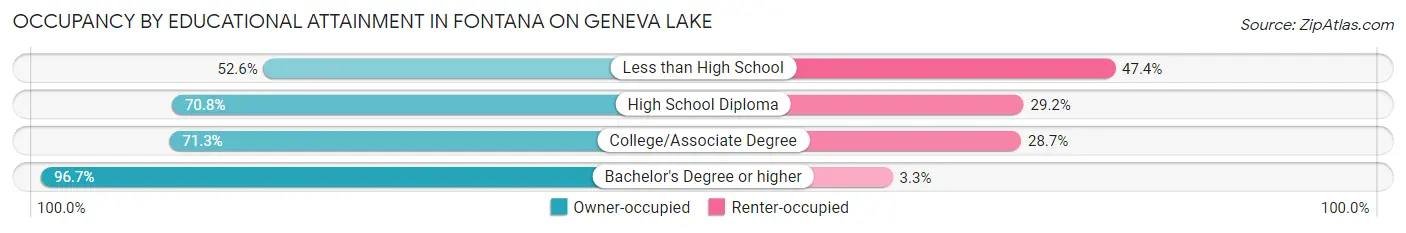
| Household Size | Owner-occupied | Renter-occupied |
| Less than High School | 10 (52.6%) | 9 (47.4%) |
| High School Diploma | 46 (70.8%) | 19 (29.2%) |
| College/Associate Degree | 134 (71.3%) | 54 (28.7%) |
| Bachelor's Degree or higher | 385 (96.7%) | 13 (3.3%) |
Occupancy by Age of Householder in Fontana on Geneva Lake
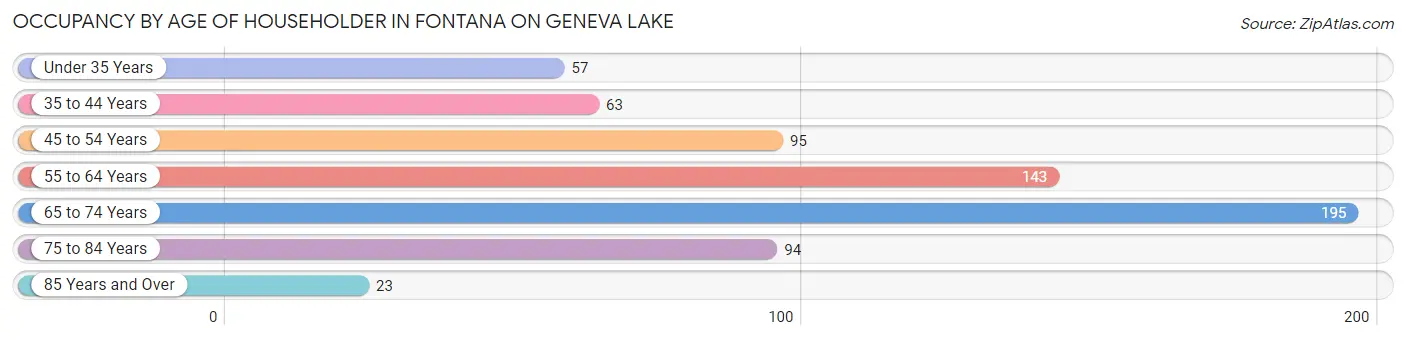
| Age Bracket | # Households | % Households |
| Under 35 Years | 57 | 8.5% |
| 35 to 44 Years | 63 | 9.4% |
| 45 to 54 Years | 95 | 14.2% |
| 55 to 64 Years | 143 | 21.3% |
| 65 to 74 Years | 195 | 29.1% |
| 75 to 84 Years | 94 | 14.0% |
| 85 Years and Over | 23 | 3.4% |
| Total | 670 | 100.0% |
Housing Finances in Fontana on Geneva Lake
Median Income by Occupancy in Fontana on Geneva Lake
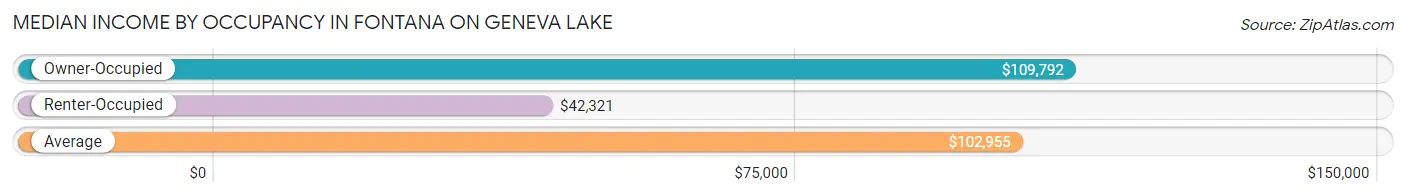
| Occupancy Type | # Households | Median Income |
| Owner-Occupied | 575 (85.8%) | $109,792 |
| Renter-Occupied | 95 (14.2%) | $42,321 |
| Average | 670 (100.0%) | $102,955 |
Occupancy by Householder Income Bracket in Fontana on Geneva Lake
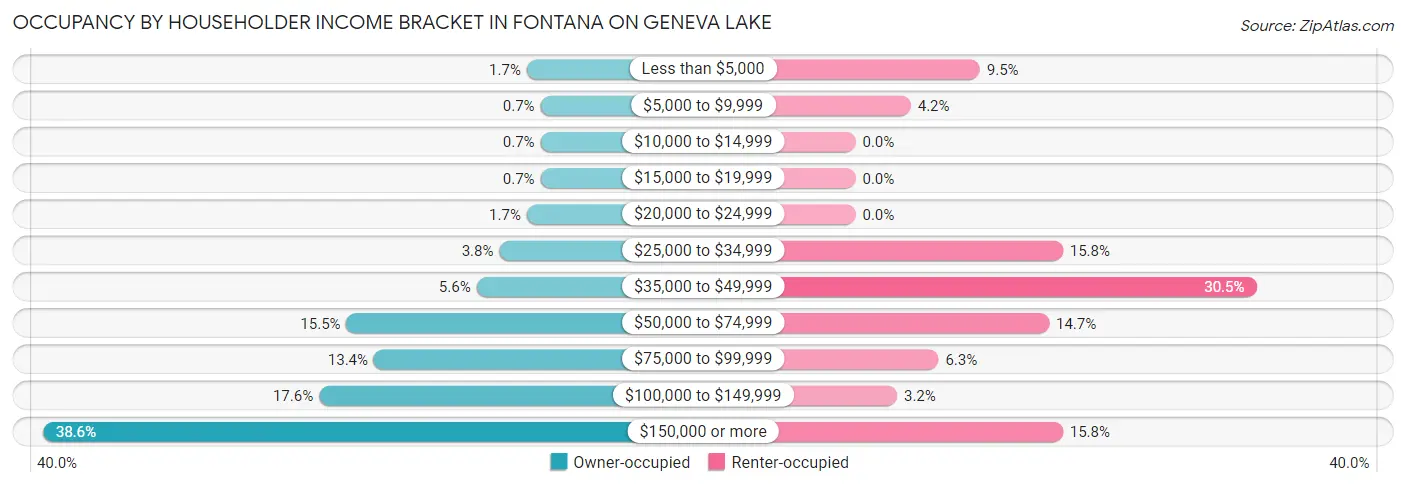
| Income Bracket | Owner-occupied | Renter-occupied |
| Less than $5,000 | 10 (1.7%) | 9 (9.5%) |
| $5,000 to $9,999 | 4 (0.7%) | 4 (4.2%) |
| $10,000 to $14,999 | 4 (0.7%) | 0 (0.0%) |
| $15,000 to $19,999 | 4 (0.7%) | 0 (0.0%) |
| $20,000 to $24,999 | 10 (1.7%) | 0 (0.0%) |
| $25,000 to $34,999 | 22 (3.8%) | 15 (15.8%) |
| $35,000 to $49,999 | 32 (5.6%) | 29 (30.5%) |
| $50,000 to $74,999 | 89 (15.5%) | 14 (14.7%) |
| $75,000 to $99,999 | 77 (13.4%) | 6 (6.3%) |
| $100,000 to $149,999 | 101 (17.6%) | 3 (3.2%) |
| $150,000 or more | 222 (38.6%) | 15 (15.8%) |
| Total | 575 (100.0%) | 95 (100.0%) |
Monthly Housing Cost Tiers in Fontana on Geneva Lake
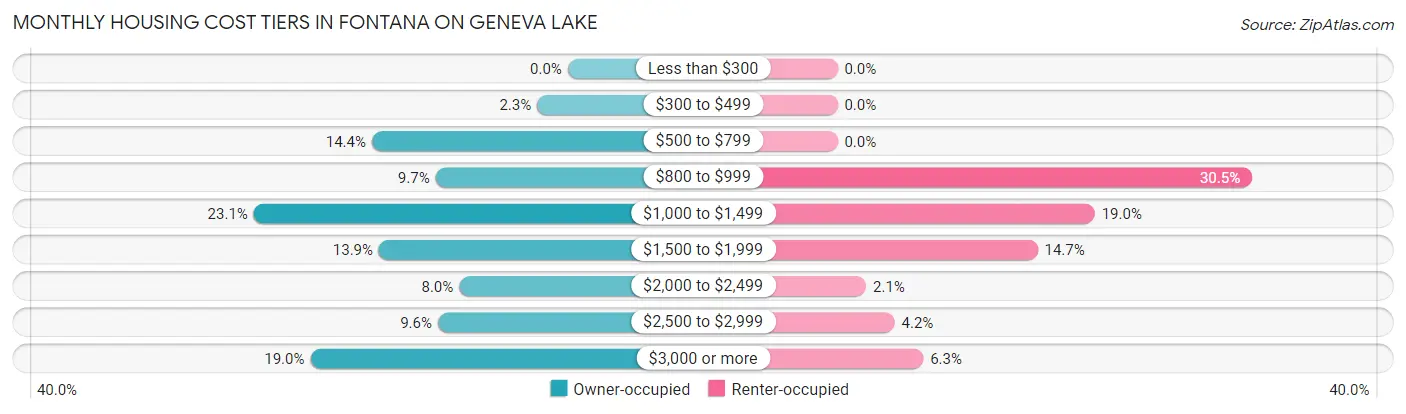
| Monthly Cost | Owner-occupied | Renter-occupied |
| Less than $300 | 0 (0.0%) | 0 (0.0%) |
| $300 to $499 | 13 (2.3%) | 0 (0.0%) |
| $500 to $799 | 83 (14.4%) | 0 (0.0%) |
| $800 to $999 | 56 (9.7%) | 29 (30.5%) |
| $1,000 to $1,499 | 133 (23.1%) | 18 (19.0%) |
| $1,500 to $1,999 | 80 (13.9%) | 14 (14.7%) |
| $2,000 to $2,499 | 46 (8.0%) | 2 (2.1%) |
| $2,500 to $2,999 | 55 (9.6%) | 4 (4.2%) |
| $3,000 or more | 109 (19.0%) | 6 (6.3%) |
| Total | 575 (100.0%) | 95 (100.0%) |
Physical Housing Characteristics in Fontana on Geneva Lake
Housing Structures in Fontana on Geneva Lake
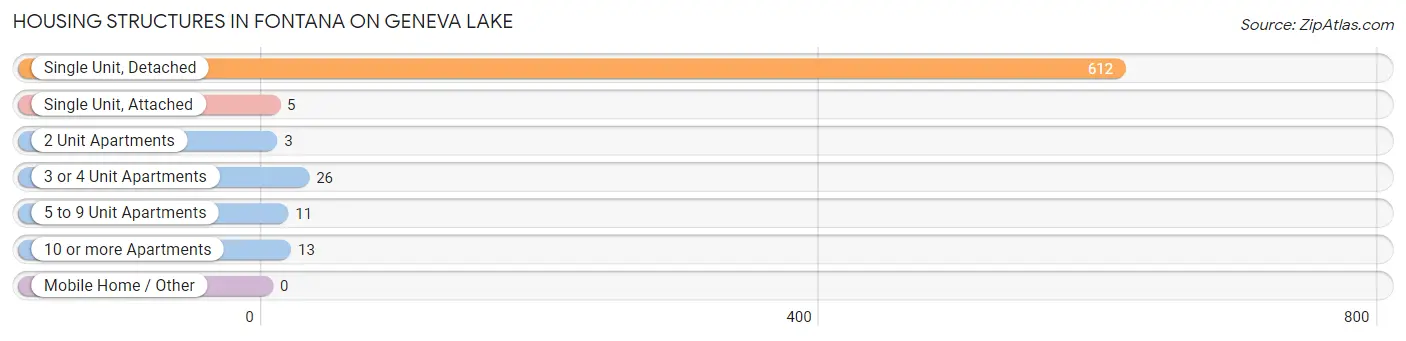
| Structure Type | # Housing Units | % Housing Units |
| Single Unit, Detached | 612 | 91.3% |
| Single Unit, Attached | 5 | 0.7% |
| 2 Unit Apartments | 3 | 0.4% |
| 3 or 4 Unit Apartments | 26 | 3.9% |
| 5 to 9 Unit Apartments | 11 | 1.6% |
| 10 or more Apartments | 13 | 1.9% |
| Mobile Home / Other | 0 | 0.0% |
| Total | 670 | 100.0% |
Housing Structures by Occupancy in Fontana on Geneva Lake
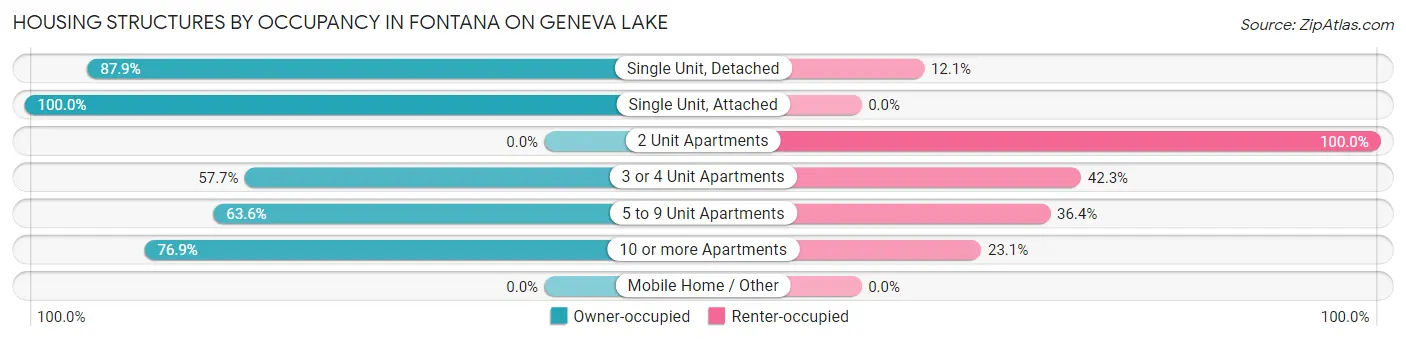
| Structure Type | Owner-occupied | Renter-occupied |
| Single Unit, Detached | 538 (87.9%) | 74 (12.1%) |
| Single Unit, Attached | 5 (100.0%) | 0 (0.0%) |
| 2 Unit Apartments | 0 (0.0%) | 3 (100.0%) |
| 3 or 4 Unit Apartments | 15 (57.7%) | 11 (42.3%) |
| 5 to 9 Unit Apartments | 7 (63.6%) | 4 (36.4%) |
| 10 or more Apartments | 10 (76.9%) | 3 (23.1%) |
| Mobile Home / Other | 0 (0.0%) | 0 (0.0%) |
| Total | 575 (85.8%) | 95 (14.2%) |
Housing Structures by Number of Rooms in Fontana on Geneva Lake
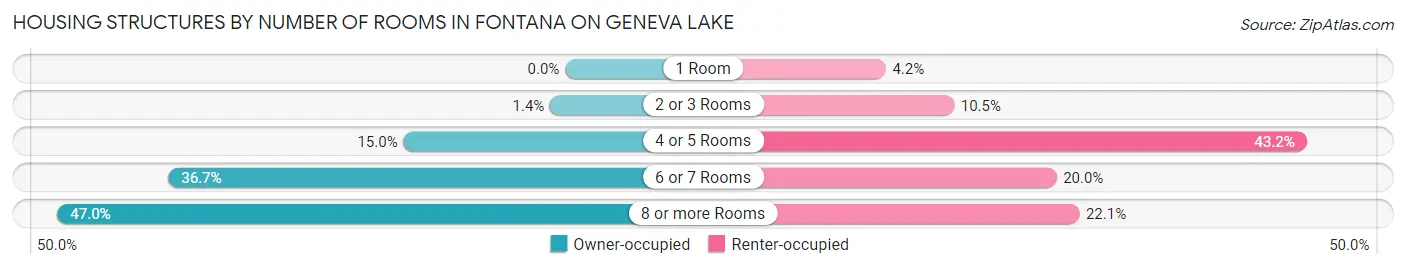
| Number of Rooms | Owner-occupied | Renter-occupied |
| 1 Room | 0 (0.0%) | 4 (4.2%) |
| 2 or 3 Rooms | 8 (1.4%) | 10 (10.5%) |
| 4 or 5 Rooms | 86 (15.0%) | 41 (43.2%) |
| 6 or 7 Rooms | 211 (36.7%) | 19 (20.0%) |
| 8 or more Rooms | 270 (47.0%) | 21 (22.1%) |
| Total | 575 (100.0%) | 95 (100.0%) |
Housing Structure by Heating Type in Fontana on Geneva Lake
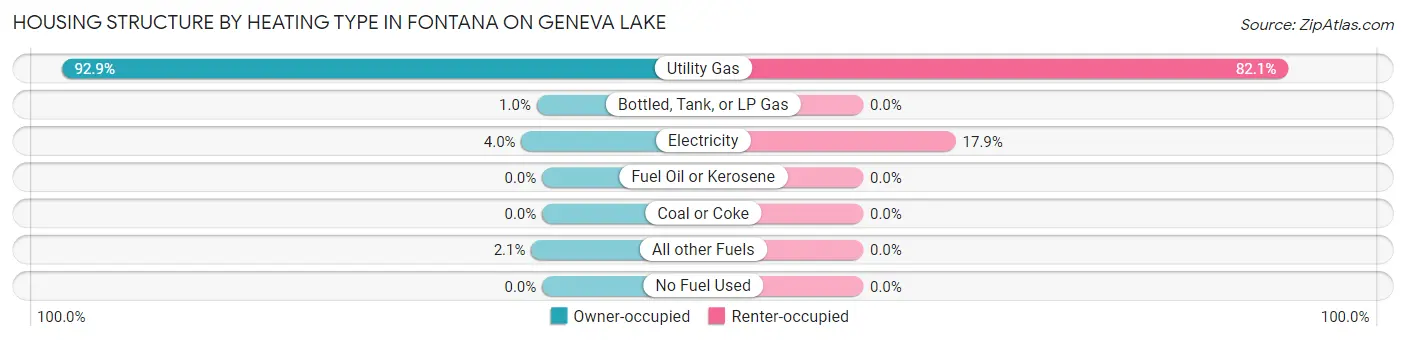
| Heating Type | Owner-occupied | Renter-occupied |
| Utility Gas | 534 (92.9%) | 78 (82.1%) |
| Bottled, Tank, or LP Gas | 6 (1.0%) | 0 (0.0%) |
| Electricity | 23 (4.0%) | 17 (17.9%) |
| Fuel Oil or Kerosene | 0 (0.0%) | 0 (0.0%) |
| Coal or Coke | 0 (0.0%) | 0 (0.0%) |
| All other Fuels | 12 (2.1%) | 0 (0.0%) |
| No Fuel Used | 0 (0.0%) | 0 (0.0%) |
| Total | 575 (100.0%) | 95 (100.0%) |
Household Vehicle Usage in Fontana on Geneva Lake
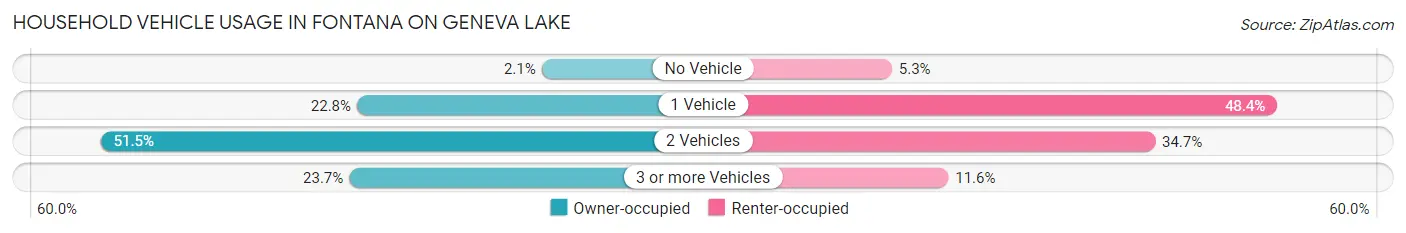
| Vehicles per Household | Owner-occupied | Renter-occupied |
| No Vehicle | 12 (2.1%) | 5 (5.3%) |
| 1 Vehicle | 131 (22.8%) | 46 (48.4%) |
| 2 Vehicles | 296 (51.5%) | 33 (34.7%) |
| 3 or more Vehicles | 136 (23.6%) | 11 (11.6%) |
| Total | 575 (100.0%) | 95 (100.0%) |
Real Estate & Mortgages in Fontana on Geneva Lake
Real Estate and Mortgage Overview in Fontana on Geneva Lake
| Characteristic | Without Mortgage | With Mortgage |
| Housing Units | 230 | 345 |
| Median Property Value | $541,000 | $555,700 |
| Median Household Income | $95,833 | $152 |
| Monthly Housing Costs | $877 | $108 |
| Real Estate Taxes | $5,746 | $0 |
Property Value by Mortgage Status in Fontana on Geneva Lake
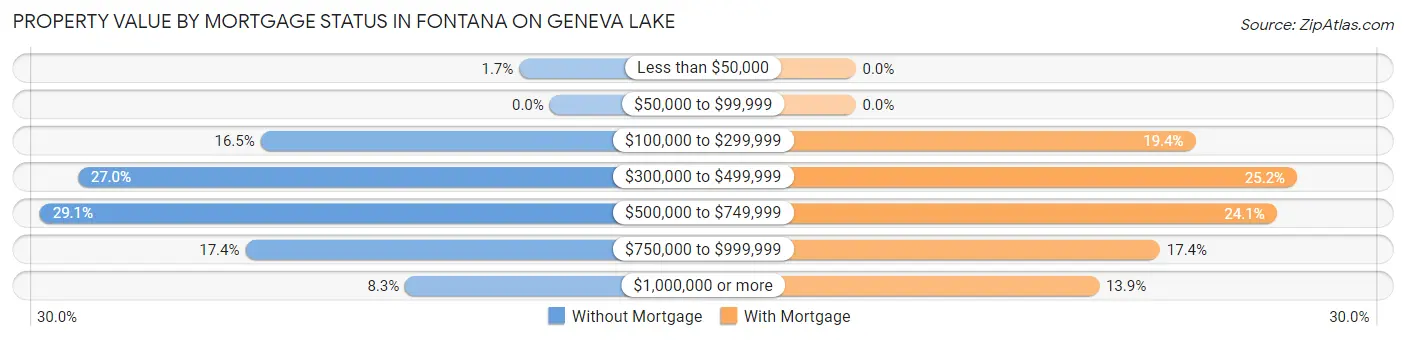
| Property Value | Without Mortgage | With Mortgage |
| Less than $50,000 | 4 (1.7%) | 0 (0.0%) |
| $50,000 to $99,999 | 0 (0.0%) | 0 (0.0%) |
| $100,000 to $299,999 | 38 (16.5%) | 67 (19.4%) |
| $300,000 to $499,999 | 62 (27.0%) | 87 (25.2%) |
| $500,000 to $749,999 | 67 (29.1%) | 83 (24.1%) |
| $750,000 to $999,999 | 40 (17.4%) | 60 (17.4%) |
| $1,000,000 or more | 19 (8.3%) | 48 (13.9%) |
| Total | 230 (100.0%) | 345 (100.0%) |
Household Income by Mortgage Status in Fontana on Geneva Lake
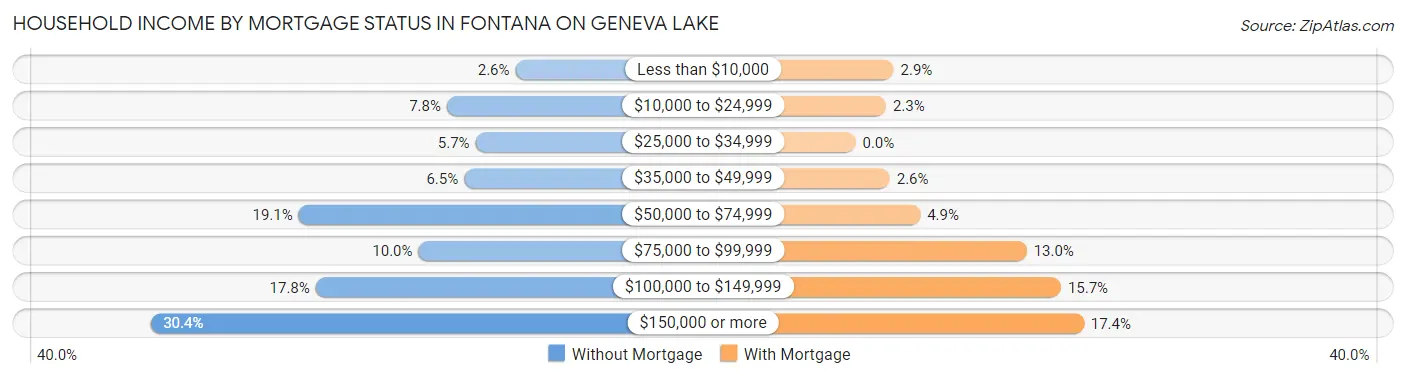
| Household Income | Without Mortgage | With Mortgage |
| Less than $10,000 | 6 (2.6%) | 10 (2.9%) |
| $10,000 to $24,999 | 18 (7.8%) | 8 (2.3%) |
| $25,000 to $34,999 | 13 (5.7%) | 0 (0.0%) |
| $35,000 to $49,999 | 15 (6.5%) | 9 (2.6%) |
| $50,000 to $74,999 | 44 (19.1%) | 17 (4.9%) |
| $75,000 to $99,999 | 23 (10.0%) | 45 (13.0%) |
| $100,000 to $149,999 | 41 (17.8%) | 54 (15.7%) |
| $150,000 or more | 70 (30.4%) | 60 (17.4%) |
| Total | 230 (100.0%) | 345 (100.0%) |
Property Value to Household Income Ratio in Fontana on Geneva Lake
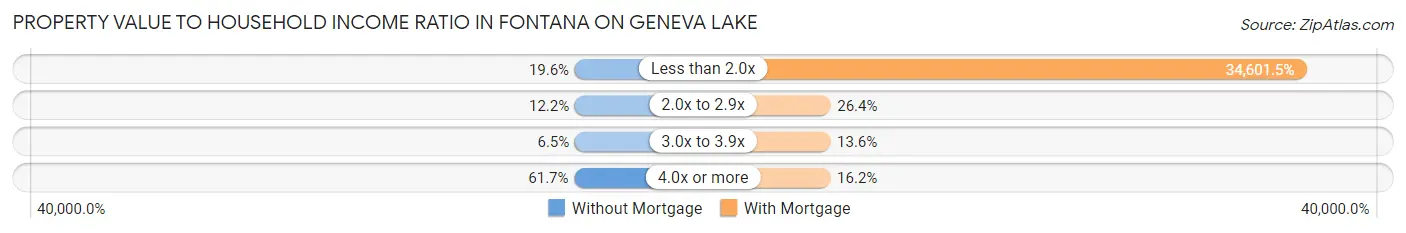
| Value-to-Income Ratio | Without Mortgage | With Mortgage |
| Less than 2.0x | 45 (19.6%) | 119,375 (34,601.4%) |
| 2.0x to 2.9x | 28 (12.2%) | 91 (26.4%) |
| 3.0x to 3.9x | 15 (6.5%) | 47 (13.6%) |
| 4.0x or more | 142 (61.7%) | 56 (16.2%) |
| Total | 230 (100.0%) | 345 (100.0%) |
Real Estate Taxes by Mortgage Status in Fontana on Geneva Lake
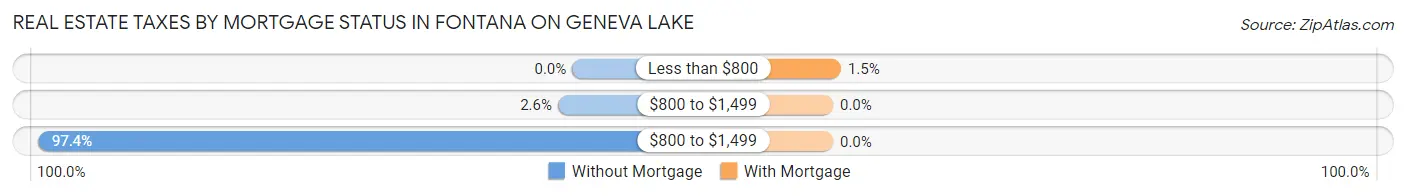
| Property Taxes | Without Mortgage | With Mortgage |
| Less than $800 | 0 (0.0%) | 5 (1.5%) |
| $800 to $1,499 | 6 (2.6%) | 0 (0.0%) |
| $800 to $1,499 | 224 (97.4%) | 0 (0.0%) |
| Total | 230 (100.0%) | 345 (100.0%) |
Health & Disability in Fontana on Geneva Lake
Health Insurance Coverage by Age in Fontana on Geneva Lake
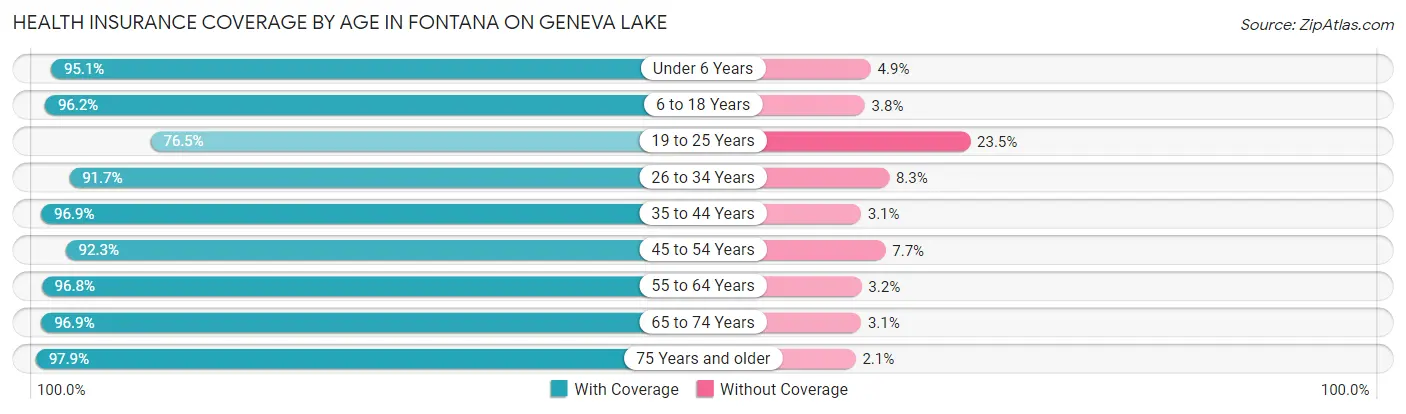
| Age Bracket | With Coverage | Without Coverage |
| Under 6 Years | 58 (95.1%) | 3 (4.9%) |
| 6 to 18 Years | 177 (96.2%) | 7 (3.8%) |
| 19 to 25 Years | 62 (76.5%) | 19 (23.5%) |
| 26 to 34 Years | 77 (91.7%) | 7 (8.3%) |
| 35 to 44 Years | 126 (96.9%) | 4 (3.1%) |
| 45 to 54 Years | 193 (92.3%) | 16 (7.7%) |
| 55 to 64 Years | 273 (96.8%) | 9 (3.2%) |
| 65 to 74 Years | 312 (96.9%) | 10 (3.1%) |
| 75 Years and older | 188 (97.9%) | 4 (2.1%) |
| Total | 1,466 (94.9%) | 79 (5.1%) |
Health Insurance Coverage by Citizenship Status in Fontana on Geneva Lake

| Citizenship Status | With Coverage | Without Coverage |
| Native Born | 58 (95.1%) | 3 (4.9%) |
| Foreign Born, Citizen | 177 (96.2%) | 7 (3.8%) |
| Foreign Born, not a Citizen | 62 (76.5%) | 19 (23.5%) |
Health Insurance Coverage by Household Income in Fontana on Geneva Lake
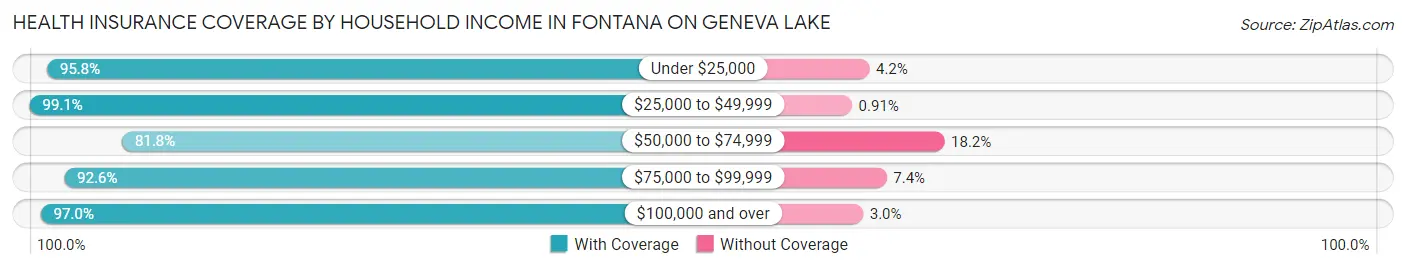
| Household Income | With Coverage | Without Coverage |
| Under $25,000 | 69 (95.8%) | 3 (4.2%) |
| $25,000 to $49,999 | 217 (99.1%) | 2 (0.9%) |
| $50,000 to $74,999 | 157 (81.8%) | 35 (18.2%) |
| $75,000 to $99,999 | 150 (92.6%) | 12 (7.4%) |
| $100,000 and over | 873 (97.0%) | 27 (3.0%) |
Public vs Private Health Insurance Coverage by Age in Fontana on Geneva Lake
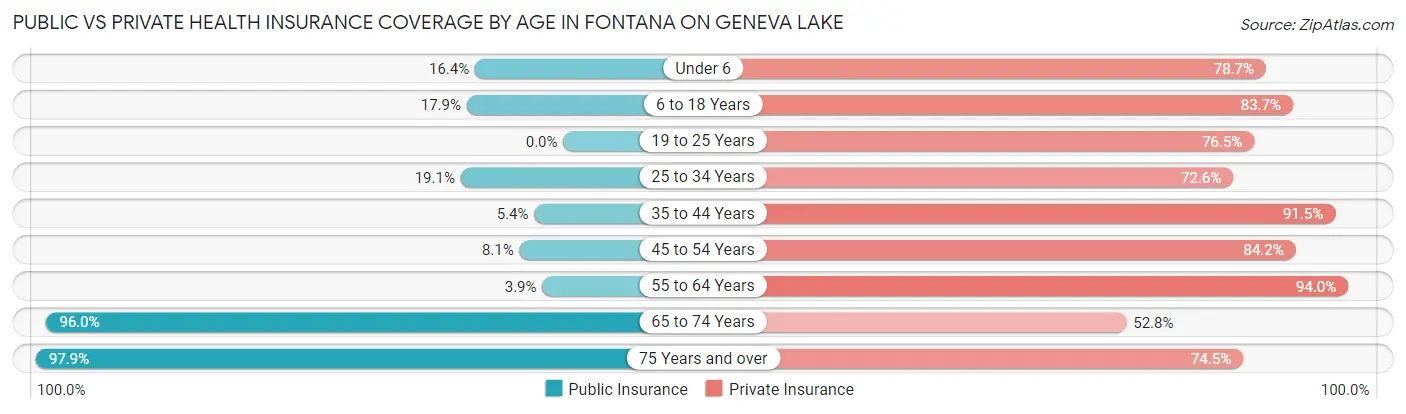
| Age Bracket | Public Insurance | Private Insurance |
| Under 6 | 10 (16.4%) | 48 (78.7%) |
| 6 to 18 Years | 33 (17.9%) | 154 (83.7%) |
| 19 to 25 Years | 0 (0.0%) | 62 (76.5%) |
| 25 to 34 Years | 16 (19.1%) | 61 (72.6%) |
| 35 to 44 Years | 7 (5.4%) | 119 (91.5%) |
| 45 to 54 Years | 17 (8.1%) | 176 (84.2%) |
| 55 to 64 Years | 11 (3.9%) | 265 (94.0%) |
| 65 to 74 Years | 309 (96.0%) | 170 (52.8%) |
| 75 Years and over | 188 (97.9%) | 143 (74.5%) |
| Total | 591 (38.3%) | 1,198 (77.5%) |
Disability Status by Sex by Age in Fontana on Geneva Lake
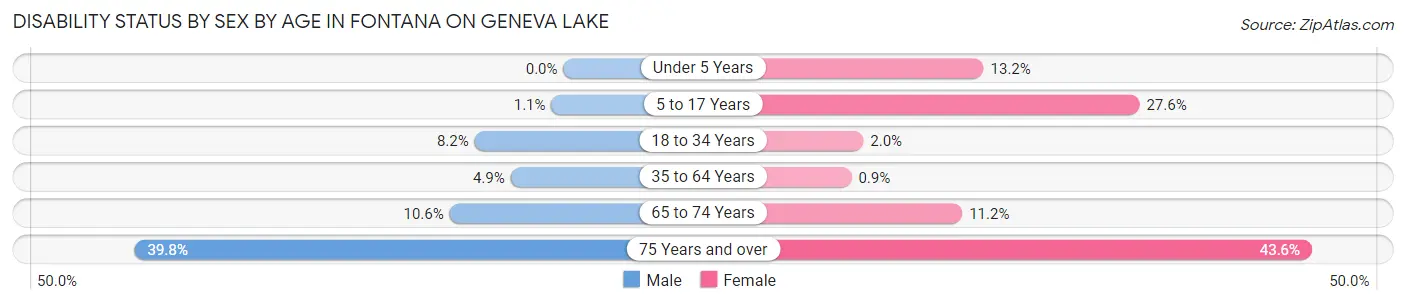
| Age Bracket | Male | Female |
| Under 5 Years | 0 (0.0%) | 5 (13.2%) |
| 5 to 17 Years | 1 (1.1%) | 21 (27.6%) |
| 18 to 34 Years | 7 (8.2%) | 2 (2.0%) |
| 35 to 64 Years | 14 (4.9%) | 3 (0.9%) |
| 65 to 74 Years | 17 (10.6%) | 18 (11.2%) |
| 75 Years and over | 39 (39.8%) | 41 (43.6%) |
Disability Class by Sex by Age in Fontana on Geneva Lake
Disability Class: Hearing Difficulty
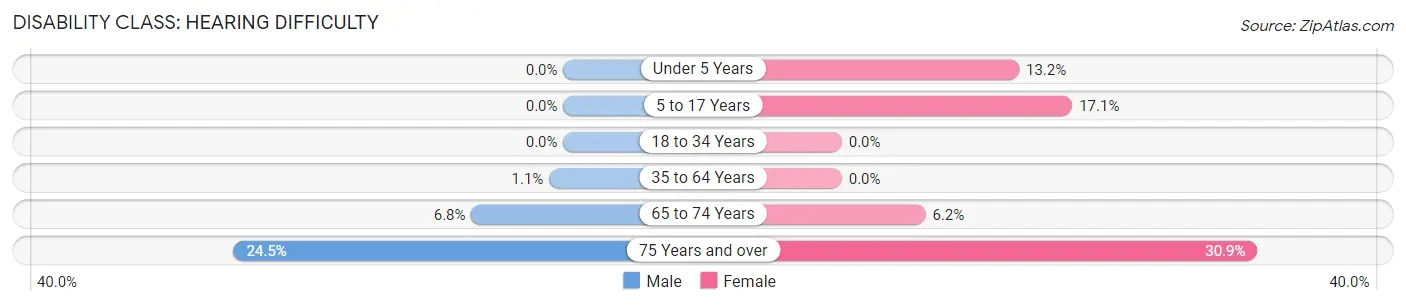
| Age Bracket | Male | Female |
| Under 5 Years | 0 (0.0%) | 5 (13.2%) |
| 5 to 17 Years | 0 (0.0%) | 13 (17.1%) |
| 18 to 34 Years | 0 (0.0%) | 0 (0.0%) |
| 35 to 64 Years | 3 (1.1%) | 0 (0.0%) |
| 65 to 74 Years | 11 (6.8%) | 10 (6.2%) |
| 75 Years and over | 24 (24.5%) | 29 (30.8%) |
Disability Class: Vision Difficulty
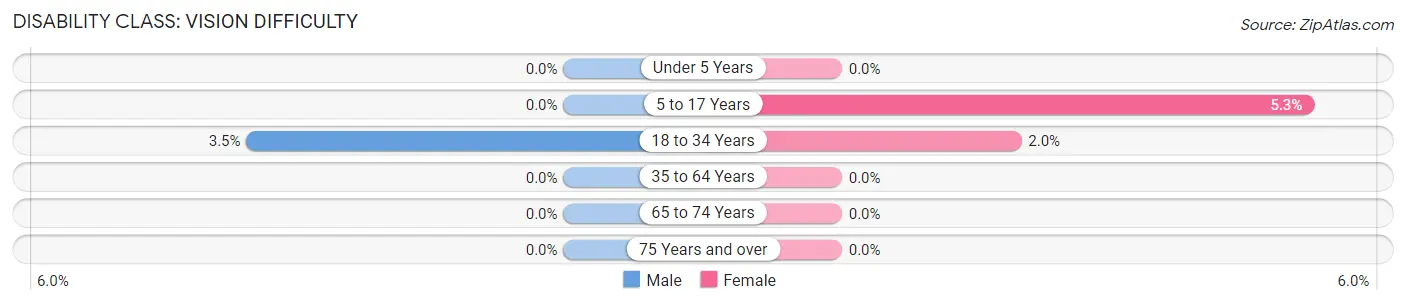
| Age Bracket | Male | Female |
| Under 5 Years | 0 (0.0%) | 0 (0.0%) |
| 5 to 17 Years | 0 (0.0%) | 4 (5.3%) |
| 18 to 34 Years | 3 (3.5%) | 2 (2.0%) |
| 35 to 64 Years | 0 (0.0%) | 0 (0.0%) |
| 65 to 74 Years | 0 (0.0%) | 0 (0.0%) |
| 75 Years and over | 0 (0.0%) | 0 (0.0%) |
Disability Class: Cognitive Difficulty
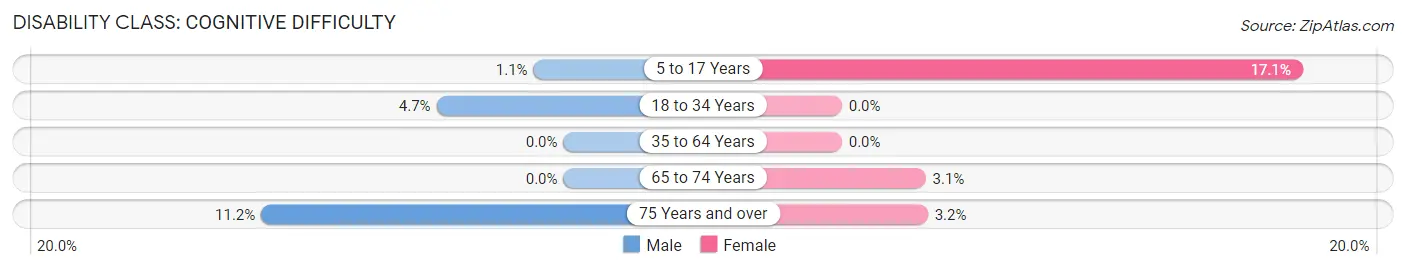
| Age Bracket | Male | Female |
| 5 to 17 Years | 1 (1.1%) | 13 (17.1%) |
| 18 to 34 Years | 4 (4.7%) | 0 (0.0%) |
| 35 to 64 Years | 0 (0.0%) | 0 (0.0%) |
| 65 to 74 Years | 0 (0.0%) | 5 (3.1%) |
| 75 Years and over | 11 (11.2%) | 3 (3.2%) |
Disability Class: Ambulatory Difficulty
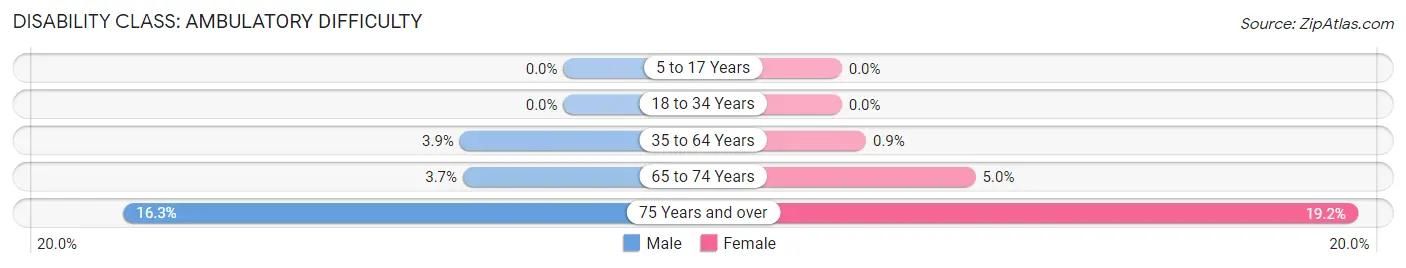
| Age Bracket | Male | Female |
| 5 to 17 Years | 0 (0.0%) | 0 (0.0%) |
| 18 to 34 Years | 0 (0.0%) | 0 (0.0%) |
| 35 to 64 Years | 11 (3.8%) | 3 (0.9%) |
| 65 to 74 Years | 6 (3.7%) | 8 (5.0%) |
| 75 Years and over | 16 (16.3%) | 18 (19.2%) |
Disability Class: Self-Care Difficulty
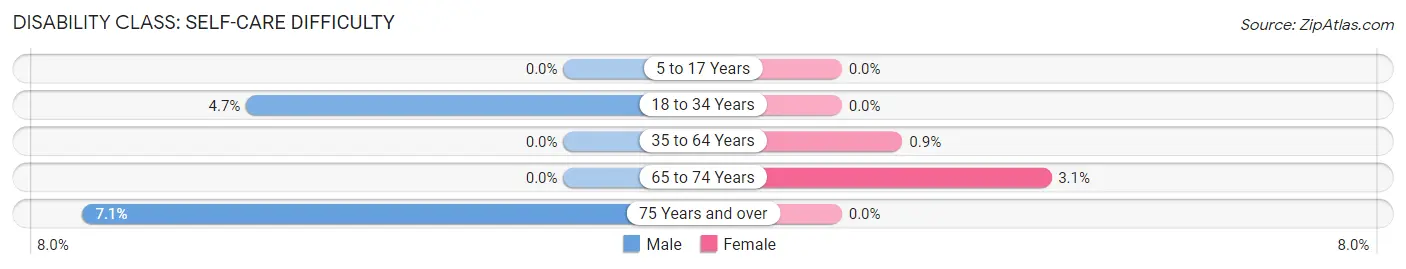
| Age Bracket | Male | Female |
| 5 to 17 Years | 0 (0.0%) | 0 (0.0%) |
| 18 to 34 Years | 4 (4.7%) | 0 (0.0%) |
| 35 to 64 Years | 0 (0.0%) | 3 (0.9%) |
| 65 to 74 Years | 0 (0.0%) | 5 (3.1%) |
| 75 Years and over | 7 (7.1%) | 0 (0.0%) |
Technology Access in Fontana on Geneva Lake
Computing Device Access in Fontana on Geneva Lake
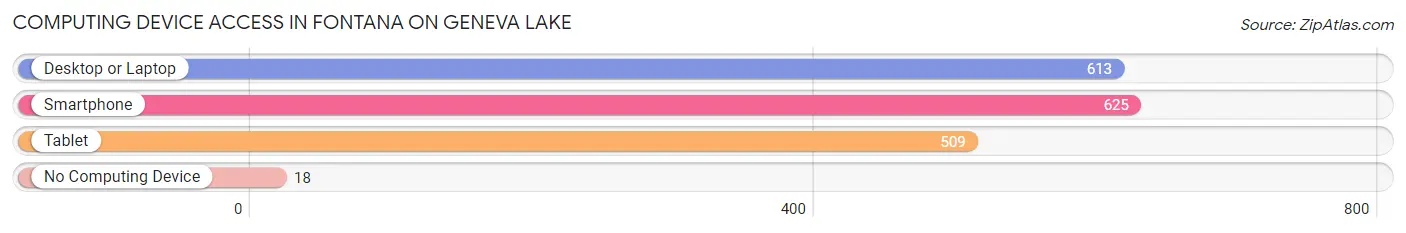
| Device Type | # Households | % Households |
| Desktop or Laptop | 613 | 91.5% |
| Smartphone | 625 | 93.3% |
| Tablet | 509 | 76.0% |
| No Computing Device | 18 | 2.7% |
| Total | 670 | 100.0% |
Internet Access in Fontana on Geneva Lake
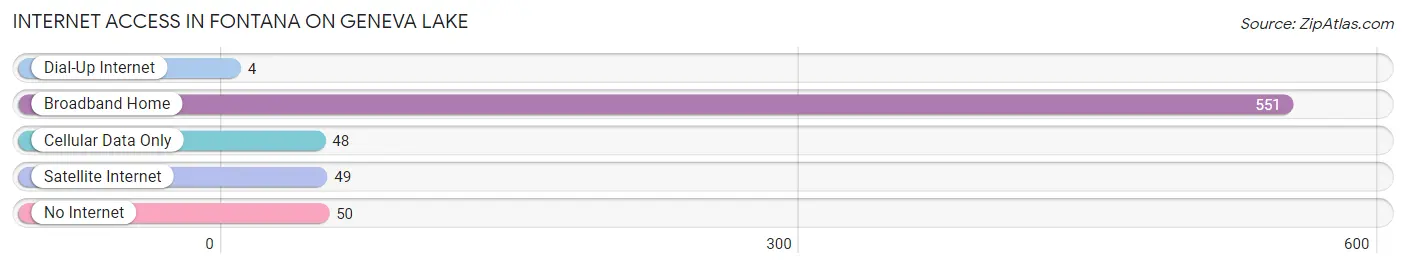
| Internet Type | # Households | % Households |
| Dial-Up Internet | 4 | 0.6% |
| Broadband Home | 551 | 82.2% |
| Cellular Data Only | 48 | 7.2% |
| Satellite Internet | 49 | 7.3% |
| No Internet | 50 | 7.5% |
| Total | 670 | 100.0% |
Fontana on Geneva Lake Summary
Fontana on Geneva Lake is a village located in Walworth County, Wisconsin, United States. The village is situated on the western shore of Geneva Lake, a natural freshwater lake located in southeastern Wisconsin. As of the 2010 census, the village had a population of 1,541.
History
Fontana on Geneva Lake was first settled in the early 19th century by settlers from New England. The village was originally known as "Fontana Station" and was a stop on the Chicago and Northwestern Railroad. The village was incorporated in 1891 and was named after the Italian word for fountain, due to the numerous springs in the area.
In the late 19th century, Fontana on Geneva Lake became a popular summer resort destination for wealthy Chicagoans. The village was home to several grand hotels, including the Geneva Hotel, the Fontana Hotel, and the Grand Geneva Resort. The village also became a popular destination for boating and fishing.
Geography
Fontana on Geneva Lake is located at 42°35'25"N 88°30'45"W (42.590278, -88.5125). The village is situated on the western shore of Geneva Lake, a natural freshwater lake located in southeastern Wisconsin. The lake is approximately 8 miles long and 2 miles wide, with a maximum depth of 135 feet.
The village is located within the Town of Linn, and is bordered by the Town of Geneva to the north and the Town of Bloomfield to the south. The village is approximately 45 miles southwest of Milwaukee and 60 miles northwest of Chicago.
Economy
The economy of Fontana on Geneva Lake is largely driven by tourism. The village is home to several resorts, including the Grand Geneva Resort, the Abbey Resort, and the Geneva Inn. The village is also home to several marinas, boat rental companies, and other recreational businesses.
In addition to tourism, Fontana on Geneva Lake is home to several small businesses, including restaurants, retail stores, and professional services. The village is also home to several manufacturing companies, including a plastics manufacturer and a metal fabrication company.
Demographics
As of the 2010 census, the village had a population of 1,541. The racial makeup of the village was 97.2% White, 0.7% African American, 0.3% Native American, 0.4% Asian, 0.2% from other races, and 1.2% from two or more races. Hispanic or Latino of any race were 1.2% of the population.
The median household income in Fontana on Geneva Lake was $62,917, and the median family income was $76,250. The per capita income for the village was $37,945. About 4.2% of families and 6.2% of the population were below the poverty line, including 8.2% of those under age 18 and 4.2% of those age 65 or over.
Common Questions
What is Per Capita Income in Fontana on Geneva Lake?
Per Capita income in Fontana on Geneva Lake is $74,144.
What is the Median Family Income in Fontana on Geneva Lake?
Median Family Income in Fontana on Geneva Lake is $112,583.
What is the Median Household income in Fontana on Geneva Lake?
Median Household Income in Fontana on Geneva Lake is $102,955.
What is Income or Wage Gap in Fontana on Geneva Lake?
Income or Wage Gap in Fontana on Geneva Lake is 42.7%.
Women in Fontana on Geneva Lake earn 57.3 cents for every dollar earned by a man.
What is Family Income Deficit in Fontana on Geneva Lake?
Family Income Deficit in Fontana on Geneva Lake is $8,327.
Families that are below poverty line in Fontana on Geneva Lake earn $8,327 less on average than the poverty threshold level.
What is Inequality or Gini Index in Fontana on Geneva Lake?
Inequality or Gini Index in Fontana on Geneva Lake is 0.51.
What is the Total Population of Fontana on Geneva Lake?
Total Population of Fontana on Geneva Lake is 1,545.
What is the Total Male Population of Fontana on Geneva Lake?
Total Male Population of Fontana on Geneva Lake is 741.
What is the Total Female Population of Fontana on Geneva Lake?
Total Female Population of Fontana on Geneva Lake is 804.
What is the Ratio of Males per 100 Females in Fontana on Geneva Lake?
There are 92.16 Males per 100 Females in Fontana on Geneva Lake.
What is the Ratio of Females per 100 Males in Fontana on Geneva Lake?
There are 108.50 Females per 100 Males in Fontana on Geneva Lake.
What is the Median Population Age in Fontana on Geneva Lake?
Median Population Age in Fontana on Geneva Lake is 55.6 Years.
What is the Average Family Size in Fontana on Geneva Lake
Average Family Size in Fontana on Geneva Lake is 2.6 People.
What is the Average Household Size in Fontana on Geneva Lake
Average Household Size in Fontana on Geneva Lake is 2.3 People.
How Large is the Labor Force in Fontana on Geneva Lake?
There are 765 People in the Labor Forcein in Fontana on Geneva Lake.
What is the Percentage of People in the Labor Force in Fontana on Geneva Lake?
56.3% of People are in the Labor Force in Fontana on Geneva Lake.
What is the Unemployment Rate in Fontana on Geneva Lake?
Unemployment Rate in Fontana on Geneva Lake is 3.8%.