Slinger, WI Map & Demographics
Slinger Map
Slinger Overview
$49,013
PER CAPITA INCOME
$105,503
AVG FAMILY INCOME
$92,984
AVG HOUSEHOLD INCOME
35.5%
WAGE / INCOME GAP [ % ]
64.5¢/ $1
WAGE / INCOME GAP [ $ ]
0.39
INEQUALITY / GINI INDEX
6,055
TOTAL POPULATION
3,041
MALE POPULATION
3,014
FEMALE POPULATION
100.90
MALES / 100 FEMALES
99.11
FEMALES / 100 MALES
43.5
MEDIAN AGE
2.9
AVG FAMILY SIZE
2.3
AVG HOUSEHOLD SIZE
3,645
LABOR FORCE [ PEOPLE ]
74.9%
PERCENT IN LABOR FORCE
5.4%
UNEMPLOYMENT RATE
Slinger Zip Codes
Slinger Area Codes
Income in Slinger
Income Overview in Slinger
Per Capita Income in Slinger is $49,013, while median incomes of families and households are $105,503 and $92,984 respectively.
| Characteristic | Number | Measure |
| Per Capita Income | 6,055 | $49,013 |
| Median Family Income | 1,593 | $105,503 |
| Mean Family Income | 1,593 | $131,201 |
| Median Household Income | 2,660 | $92,984 |
| Mean Household Income | 2,660 | $111,008 |
| Income Deficit | 1,593 | $0 |
| Wage / Income Gap (%) | 6,055 | 35.53% |
| Wage / Income Gap ($) | 6,055 | 64.47¢ per $1 |
| Gini / Inequality Index | 6,055 | 0.39 |
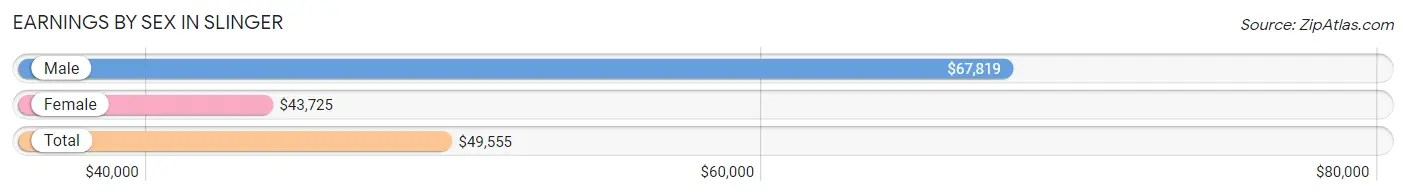
Earnings by Sex in Slinger
Average Earnings in Slinger are $49,555, $67,819 for men and $43,725 for women, a difference of 35.5%.
| Sex | Number | Average Earnings |
| Male | 1,929 (51.9%) | $67,819 |
| Female | 1,788 (48.1%) | $43,725 |
| Total | 3,717 (100.0%) | $49,555 |
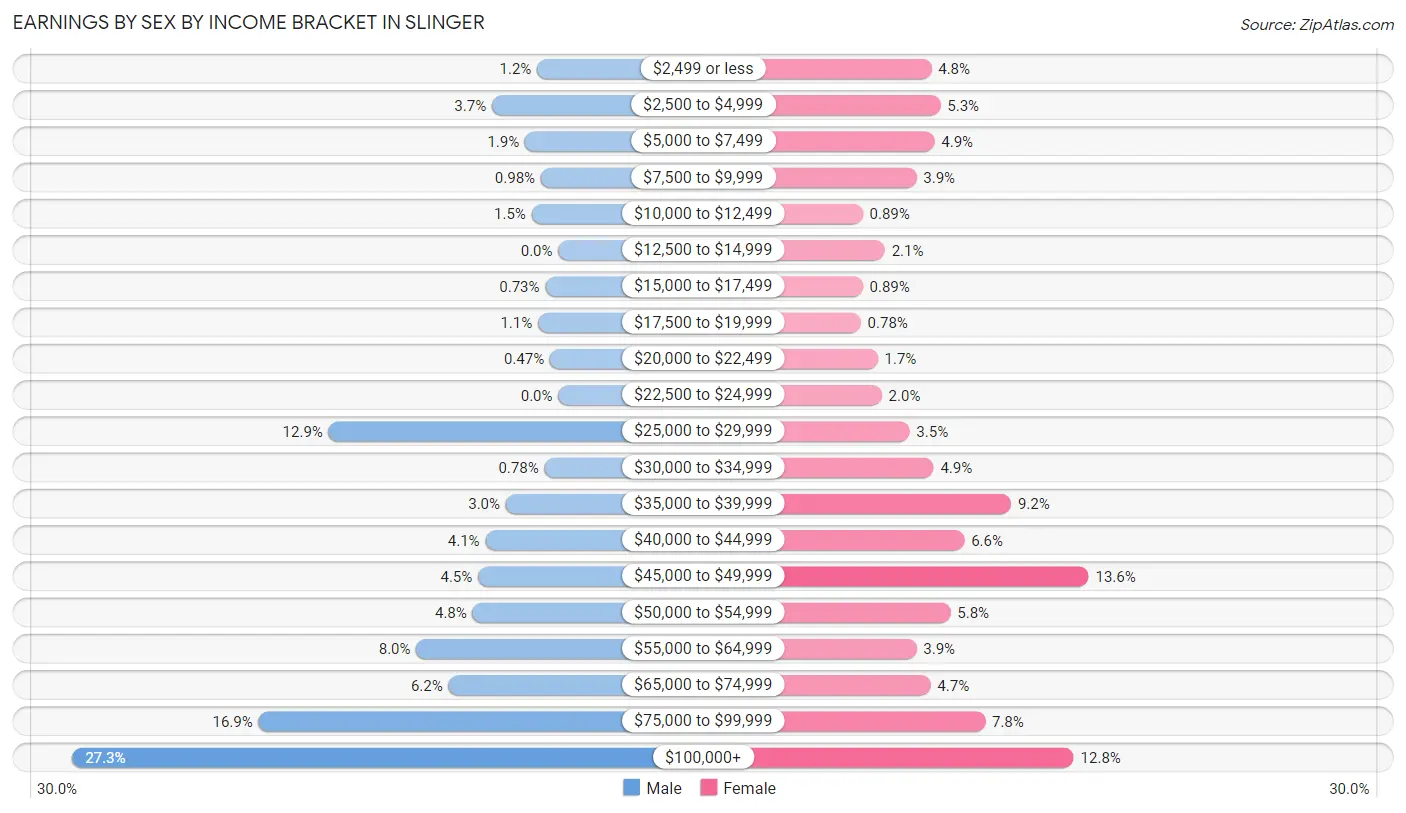
Earnings by Sex by Income Bracket in Slinger
The most common earnings brackets in Slinger are $100,000+ for men (527 | 27.3%) and $45,000 to $49,999 for women (243 | 13.6%).
| Income | Male | Female |
| $2,499 or less | 23 (1.2%) | 85 (4.8%) |
| $2,500 to $4,999 | 72 (3.7%) | 94 (5.3%) |
| $5,000 to $7,499 | 36 (1.9%) | 88 (4.9%) |
| $7,500 to $9,999 | 19 (1.0%) | 70 (3.9%) |
| $10,000 to $12,499 | 29 (1.5%) | 16 (0.9%) |
| $12,500 to $14,999 | 0 (0.0%) | 38 (2.1%) |
| $15,000 to $17,499 | 14 (0.7%) | 16 (0.9%) |
| $17,500 to $19,999 | 22 (1.1%) | 14 (0.8%) |
| $20,000 to $22,499 | 9 (0.5%) | 31 (1.7%) |
| $22,500 to $24,999 | 0 (0.0%) | 35 (2.0%) |
| $25,000 to $29,999 | 249 (12.9%) | 63 (3.5%) |
| $30,000 to $34,999 | 15 (0.8%) | 87 (4.9%) |
| $35,000 to $39,999 | 57 (2.9%) | 165 (9.2%) |
| $40,000 to $44,999 | 79 (4.1%) | 118 (6.6%) |
| $45,000 to $49,999 | 87 (4.5%) | 243 (13.6%) |
| $50,000 to $54,999 | 93 (4.8%) | 104 (5.8%) |
| $55,000 to $64,999 | 154 (8.0%) | 70 (3.9%) |
| $65,000 to $74,999 | 119 (6.2%) | 84 (4.7%) |
| $75,000 to $99,999 | 325 (16.9%) | 139 (7.8%) |
| $100,000+ | 527 (27.3%) | 228 (12.8%) |
| Total | 1,929 (100.0%) | 1,788 (100.0%) |
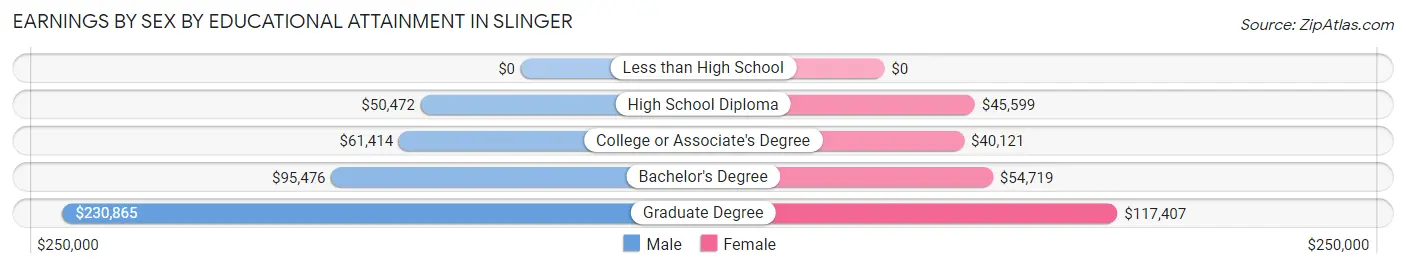
Earnings by Sex by Educational Attainment in Slinger
Average earnings in Slinger are $69,877 for men and $47,210 for women, a difference of 32.4%. Men with an educational attainment of graduate degree enjoy the highest average annual earnings of $230,865, while those with high school diploma education earn the least with $50,472. Women with an educational attainment of graduate degree earn the most with the average annual earnings of $117,407, while those with college or associate's degree education have the smallest earnings of $40,121.
| Educational Attainment | Male Income | Female Income |
| Less than High School | - | - |
| High School Diploma | $50,472 | $45,599 |
| College or Associate's Degree | $61,414 | $40,121 |
| Bachelor's Degree | $95,476 | $54,719 |
| Graduate Degree | $230,865 | $117,407 |
| Total | $69,877 | $47,210 |
Family Income in Slinger
Family Income Brackets in Slinger
According to the Slinger family income data, there are 323 families falling into the $100,000 to $149,999 income range, which is the most common income bracket and makes up 20.3% of all families.
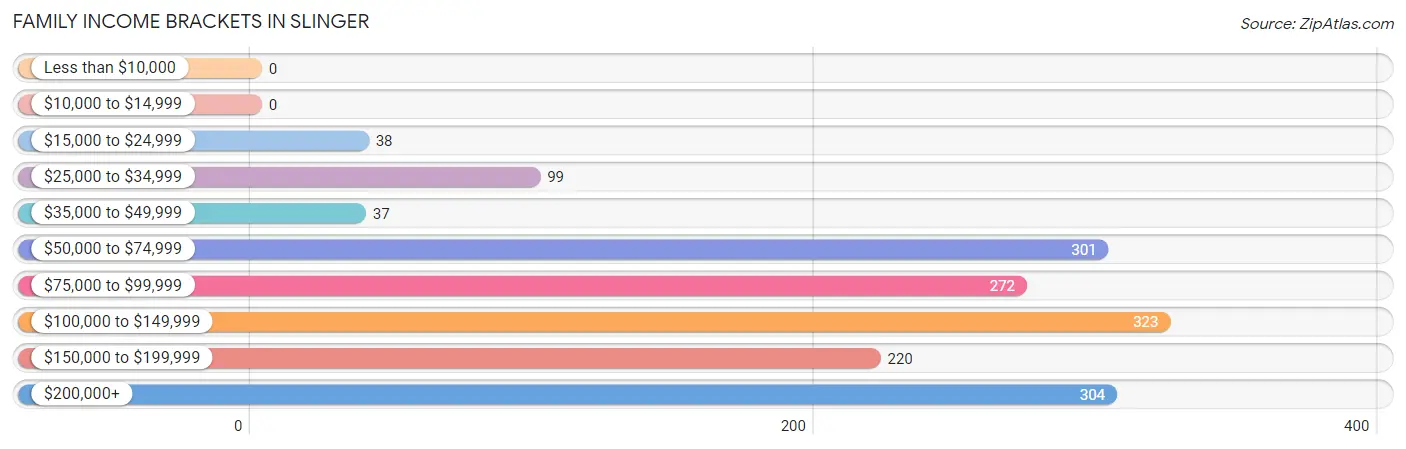
| Income Bracket | # Families | % Families |
| Less than $10,000 | 0 | 0.0% |
| $10,000 to $14,999 | 0 | 0.0% |
| $15,000 to $24,999 | 38 | 2.4% |
| $25,000 to $34,999 | 99 | 6.2% |
| $35,000 to $49,999 | 37 | 2.3% |
| $50,000 to $74,999 | 301 | 18.9% |
| $75,000 to $99,999 | 272 | 17.1% |
| $100,000 to $149,999 | 323 | 20.3% |
| $150,000 to $199,999 | 220 | 13.8% |
| $200,000+ | 304 | 19.1% |
Family Income by Famaliy Size in Slinger
5-person families (172 | 10.8%) account for the highest median family income in Slinger with $155,663 per family, while 2-person families (850 | 53.4%) have the highest median income of $46,748 per family member.
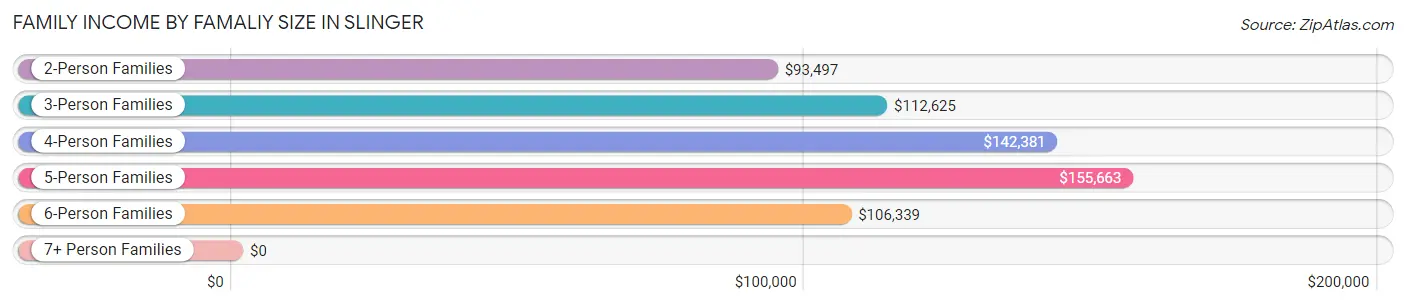
| Income Bracket | # Families | Median Income |
| 2-Person Families | 850 (53.4%) | $93,497 |
| 3-Person Families | 216 (13.6%) | $112,625 |
| 4-Person Families | 274 (17.2%) | $142,381 |
| 5-Person Families | 172 (10.8%) | $155,663 |
| 6-Person Families | 45 (2.8%) | $106,339 |
| 7+ Person Families | 36 (2.3%) | $0 |
| Total | 1,593 (100.0%) | $105,503 |
Family Income by Number of Earners in Slinger
The median family income in Slinger is $105,503, with families comprising 3+ earners (209) having the highest median family income of $248,750, while families with 1 earner (513) have the lowest median family income of $68,986, accounting for 13.1% and 32.2% of families, respectively.
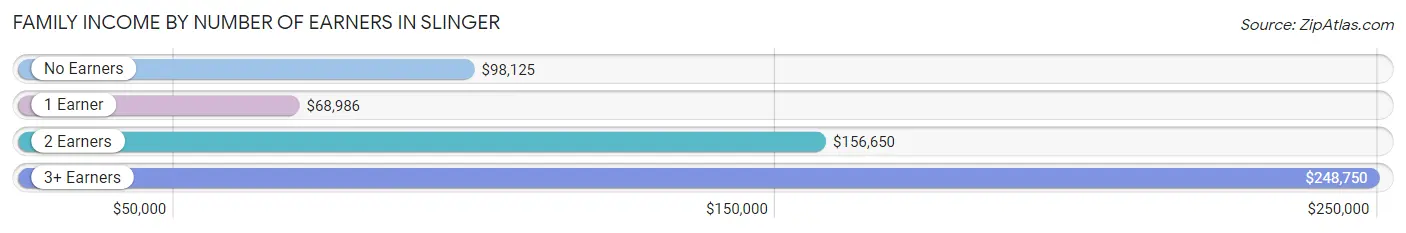
| Number of Earners | # Families | Median Income |
| No Earners | 217 (13.6%) | $98,125 |
| 1 Earner | 513 (32.2%) | $68,986 |
| 2 Earners | 654 (41.0%) | $156,650 |
| 3+ Earners | 209 (13.1%) | $248,750 |
| Total | 1,593 (100.0%) | $105,503 |
Household Income in Slinger
Household Income Brackets in Slinger
With 508 households falling in the category, the $50,000 to $74,999 income range is the most frequent in Slinger, accounting for 19.1% of all households. In contrast, only 16 households (0.6%) fall into the less than $10,000 income bracket, making it the least populous group.
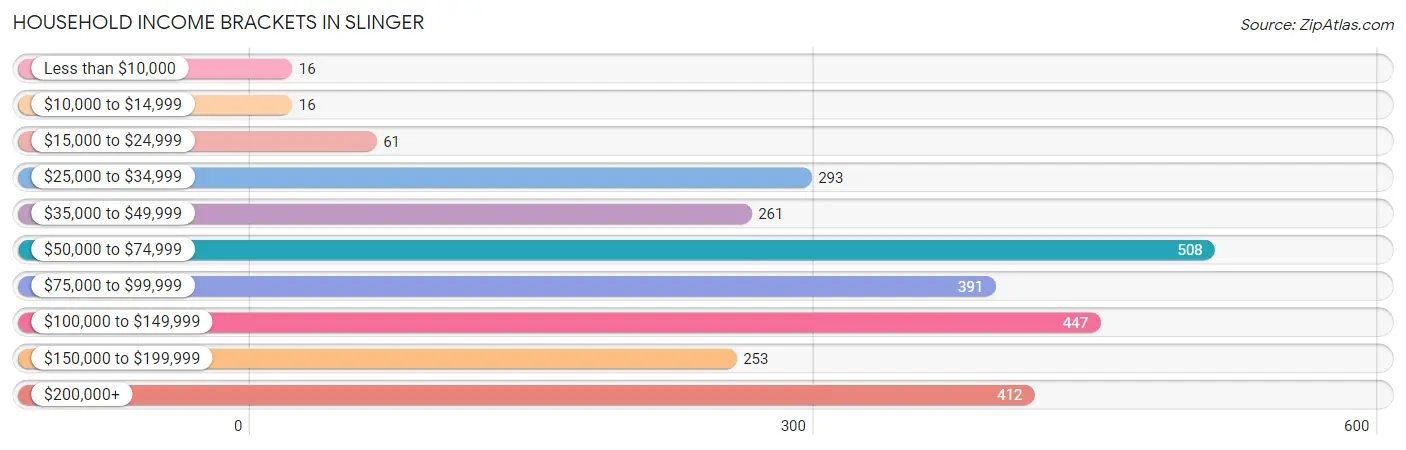
| Income Bracket | # Households | % Households |
| Less than $10,000 | 16 | 0.6% |
| $10,000 to $14,999 | 16 | 0.6% |
| $15,000 to $24,999 | 61 | 2.3% |
| $25,000 to $34,999 | 293 | 11.0% |
| $35,000 to $49,999 | 261 | 9.8% |
| $50,000 to $74,999 | 508 | 19.1% |
| $75,000 to $99,999 | 391 | 14.7% |
| $100,000 to $149,999 | 447 | 16.8% |
| $150,000 to $199,999 | 253 | 9.5% |
| $200,000+ | 412 | 15.5% |
Household Income by Householder Age in Slinger
The median household income in Slinger is $92,984, with the highest median household income of $111,886 found in the 25 to 44 years age bracket for the primary householder. A total of 604 households (22.7%) fall into this category. Meanwhile, the 15 to 24 years age bracket for the primary householder has the lowest median household income of $0, with 159 households (6.0%) in this group.
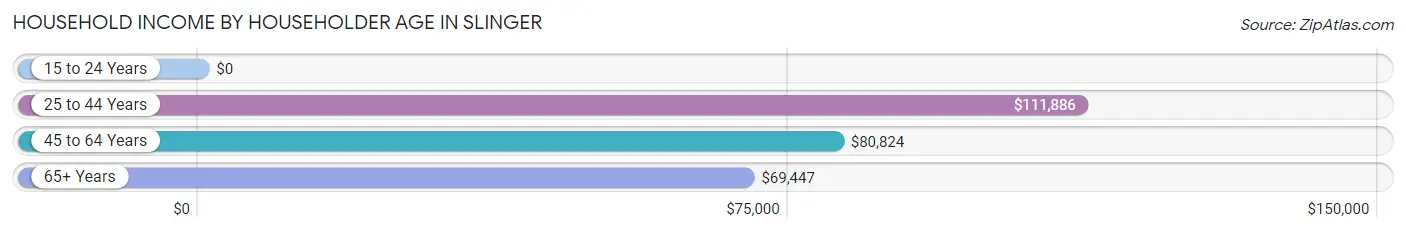
| Income Bracket | # Households | Median Income |
| 15 to 24 Years | 159 (6.0%) | $0 |
| 25 to 44 Years | 604 (22.7%) | $111,886 |
| 45 to 64 Years | 1,123 (42.2%) | $80,824 |
| 65+ Years | 774 (29.1%) | $69,447 |
| Total | 2,660 (100.0%) | $92,984 |
Poverty in Slinger
Income Below Poverty by Sex and Age in Slinger
With 0.6% poverty level for males and 1.6% for females among the residents of Slinger, 75 year old and over males and 65 to 74 year old females are the most vulnerable to poverty, with 13 males (14.8%) and 28 females (10.6%) in their respective age groups living below the poverty level.
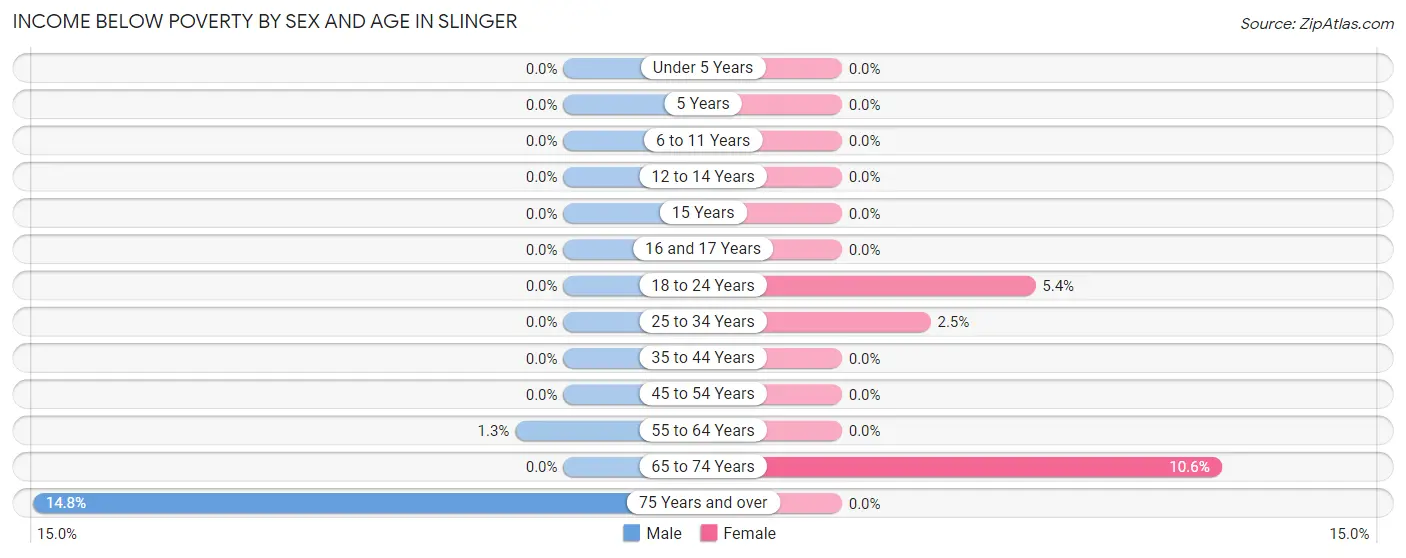
| Age Bracket | Male | Female |
| Under 5 Years | 0 (0.0%) | 0 (0.0%) |
| 5 Years | 0 (0.0%) | 0 (0.0%) |
| 6 to 11 Years | 0 (0.0%) | 0 (0.0%) |
| 12 to 14 Years | 0 (0.0%) | 0 (0.0%) |
| 15 Years | 0 (0.0%) | 0 (0.0%) |
| 16 and 17 Years | 0 (0.0%) | 0 (0.0%) |
| 18 to 24 Years | 0 (0.0%) | 16 (5.4%) |
| 25 to 34 Years | 0 (0.0%) | 4 (2.5%) |
| 35 to 44 Years | 0 (0.0%) | 0 (0.0%) |
| 45 to 54 Years | 0 (0.0%) | 0 (0.0%) |
| 55 to 64 Years | 4 (1.3%) | 0 (0.0%) |
| 65 to 74 Years | 0 (0.0%) | 28 (10.6%) |
| 75 Years and over | 13 (14.8%) | 0 (0.0%) |
| Total | 17 (0.6%) | 48 (1.6%) |
Income Above Poverty by Sex and Age in Slinger
According to the poverty statistics in Slinger, males aged under 5 years and females aged under 5 years are the age groups that are most secure financially, with 100.0% of males and 100.0% of females in these age groups living above the poverty line.
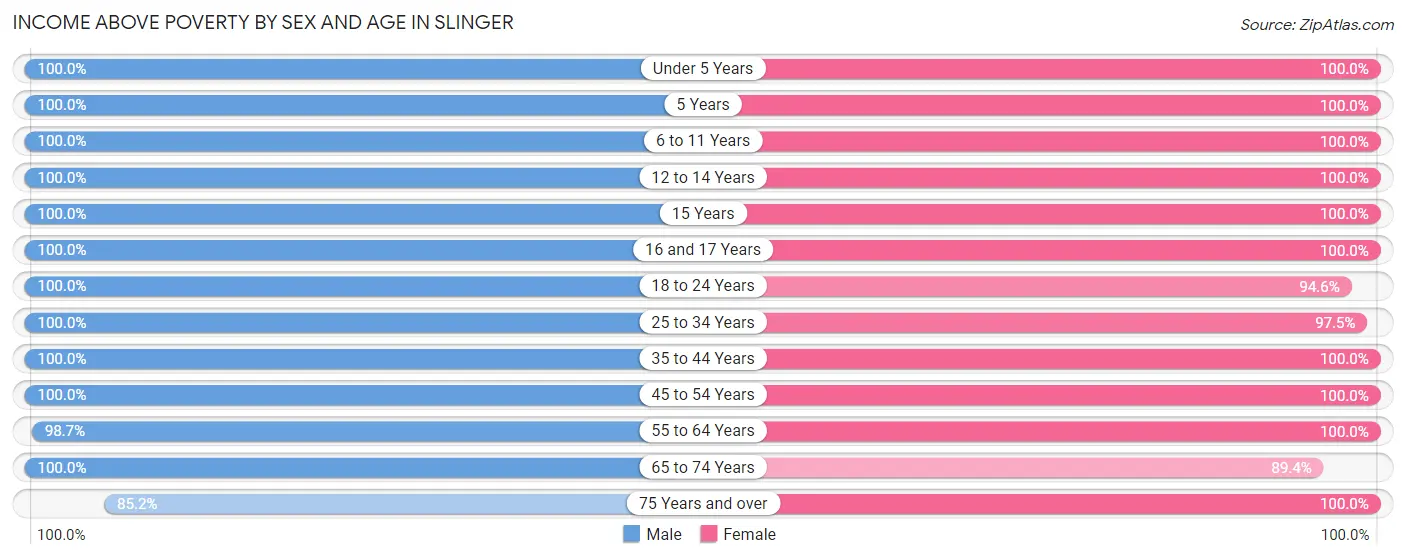
| Age Bracket | Male | Female |
| Under 5 Years | 109 (100.0%) | 101 (100.0%) |
| 5 Years | 90 (100.0%) | 14 (100.0%) |
| 6 to 11 Years | 230 (100.0%) | 227 (100.0%) |
| 12 to 14 Years | 202 (100.0%) | 118 (100.0%) |
| 15 Years | 29 (100.0%) | 54 (100.0%) |
| 16 and 17 Years | 69 (100.0%) | 116 (100.0%) |
| 18 to 24 Years | 448 (100.0%) | 281 (94.6%) |
| 25 to 34 Years | 160 (100.0%) | 158 (97.5%) |
| 35 to 44 Years | 437 (100.0%) | 389 (100.0%) |
| 45 to 54 Years | 490 (100.0%) | 581 (100.0%) |
| 55 to 64 Years | 294 (98.7%) | 374 (100.0%) |
| 65 to 74 Years | 391 (100.0%) | 237 (89.4%) |
| 75 Years and over | 75 (85.2%) | 301 (100.0%) |
| Total | 3,024 (99.4%) | 2,951 (98.4%) |
Income Below Poverty Among Married-Couple Families in Slinger
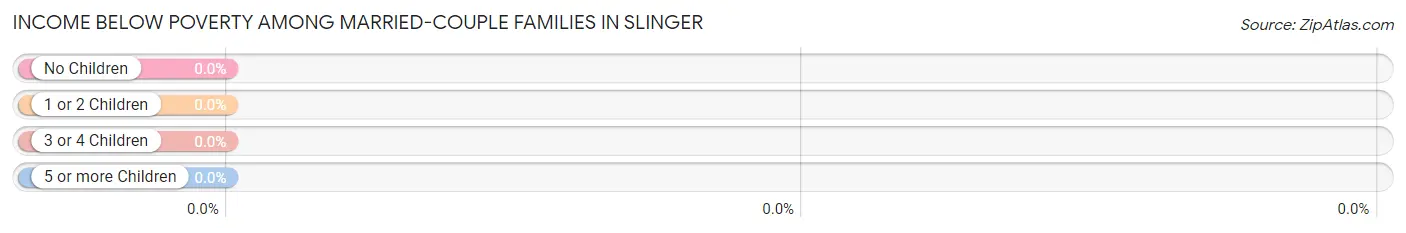
| Children | Above Poverty | Below Poverty |
| No Children | 586 (100.0%) | 0 (0.0%) |
| 1 or 2 Children | 480 (100.0%) | 0 (0.0%) |
| 3 or 4 Children | 64 (100.0%) | 0 (0.0%) |
| 5 or more Children | 27 (100.0%) | 0 (0.0%) |
| Total | 1,157 (100.0%) | 0 (0.0%) |
Income Below Poverty Among Single-Parent Households in Slinger
| Children | Single Father | Single Mother |
| No Children | 0 (0.0%) | 0 (0.0%) |
| 1 or 2 Children | 0 (0.0%) | 0 (0.0%) |
| 3 or 4 Children | 0 (0.0%) | 0 (0.0%) |
| 5 or more Children | 0 (0.0%) | 0 (0.0%) |
| Total | 0 (0.0%) | 0 (0.0%) |
Income Below Poverty Among Married-Couple vs Single-Parent Households in Slinger
| Children | Married-Couple Families | Single-Parent Households |
| No Children | 0 (0.0%) | 0 (0.0%) |
| 1 or 2 Children | 0 (0.0%) | 0 (0.0%) |
| 3 or 4 Children | 0 (0.0%) | 0 (0.0%) |
| 5 or more Children | 0 (0.0%) | 0 (0.0%) |
| Total | 0 (0.0%) | 0 (0.0%) |
Race in Slinger
The most populous races in Slinger are White / Caucasian (5,802 | 95.8%), Hispanic or Latino (178 | 2.9%), and Asian (123 | 2.0%).
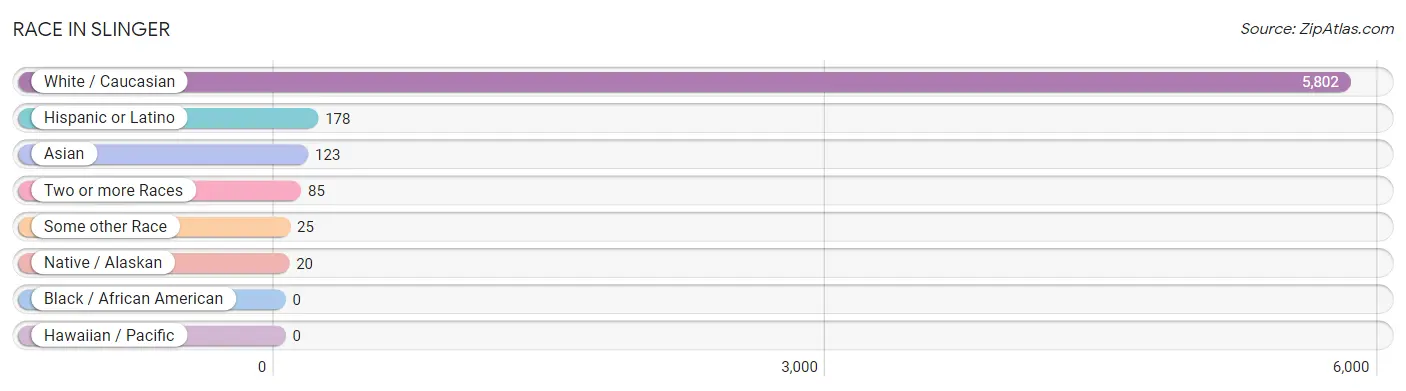
| Race | # Population | % Population |
| Asian | 123 | 2.0% |
| Black / African American | 0 | 0.0% |
| Hawaiian / Pacific | 0 | 0.0% |
| Hispanic or Latino | 178 | 2.9% |
| Native / Alaskan | 20 | 0.3% |
| White / Caucasian | 5,802 | 95.8% |
| Two or more Races | 85 | 1.4% |
| Some other Race | 25 | 0.4% |
| Total | 6,055 | 100.0% |
Ancestry in Slinger
The most populous ancestries reported in Slinger are German (3,608 | 59.6%), Polish (618 | 10.2%), Irish (595 | 9.8%), Italian (280 | 4.6%), and French (195 | 3.2%), together accounting for 87.5% of all Slinger residents.
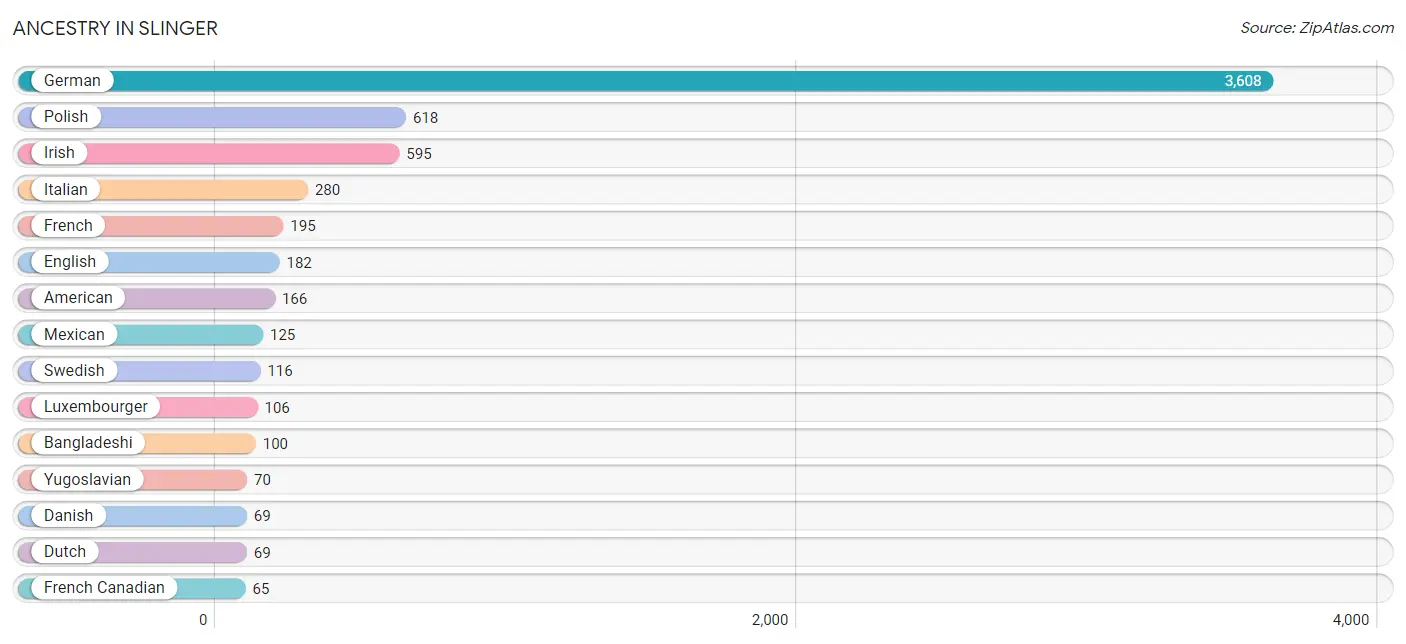
| Ancestry | # Population | % Population |
| Aleut | 4 | 0.1% |
| American | 166 | 2.7% |
| Bangladeshi | 100 | 1.7% |
| Bulgarian | 24 | 0.4% |
| Burmese | 7 | 0.1% |
| Chippewa | 16 | 0.3% |
| Czech | 13 | 0.2% |
| Czechoslovakian | 32 | 0.5% |
| Danish | 69 | 1.1% |
| Dutch | 69 | 1.1% |
| Eastern European | 15 | 0.3% |
| English | 182 | 3.0% |
| European | 14 | 0.2% |
| Finnish | 16 | 0.3% |
| French | 195 | 3.2% |
| French Canadian | 65 | 1.1% |
| German | 3,608 | 59.6% |
| Hungarian | 18 | 0.3% |
| Irish | 595 | 9.8% |
| Italian | 280 | 4.6% |
| Lithuanian | 17 | 0.3% |
| Luxembourger | 106 | 1.8% |
| Mexican | 125 | 2.1% |
| Norwegian | 49 | 0.8% |
| Polish | 618 | 10.2% |
| Romanian | 50 | 0.8% |
| Russian | 48 | 0.8% |
| Scandinavian | 60 | 1.0% |
| Scottish | 29 | 0.5% |
| Serbian | 1 | 0.0% |
| Swedish | 116 | 1.9% |
| Swiss | 38 | 0.6% |
| Thai | 16 | 0.3% |
| Welsh | 8 | 0.1% |
| Yugoslavian | 70 | 1.2% | View All 35 Rows |
Immigrants in Slinger
The most numerous immigrant groups reported in Slinger came from Eastern Europe (122 | 2.0%), Europe (122 | 2.0%), Bosnia and Herzegovina (72 | 1.2%), Asia (60 | 1.0%), and Laos (37 | 0.6%), together accounting for 6.8% of all Slinger residents.
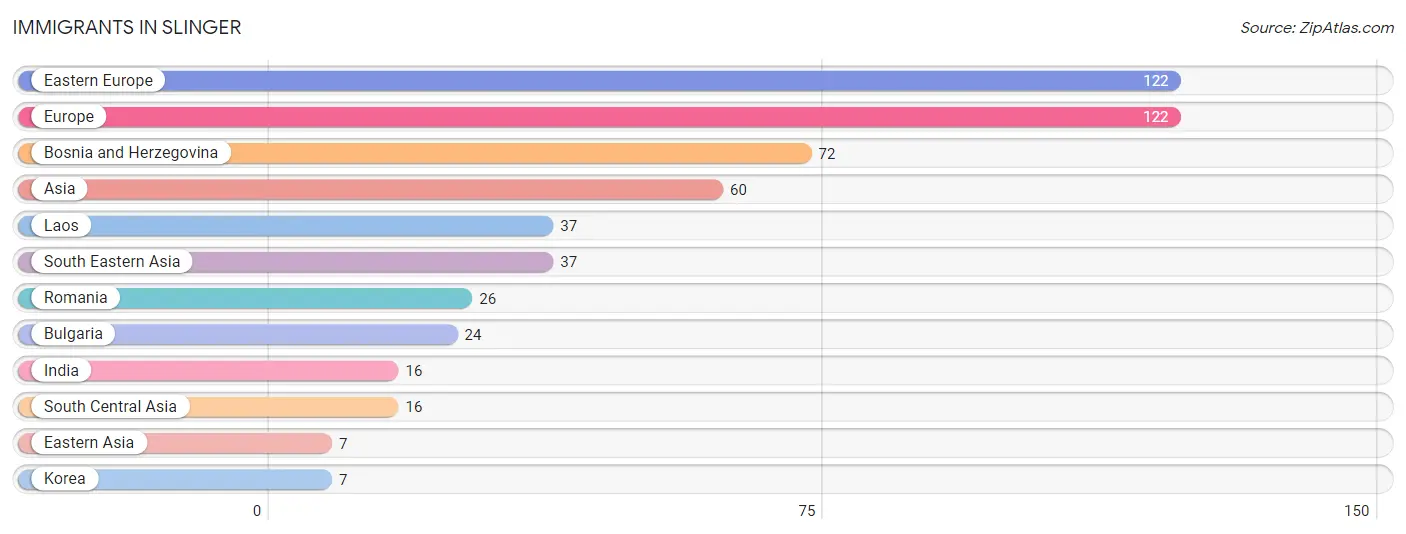
| Immigration Origin | # Population | % Population |
| Asia | 60 | 1.0% |
| Bosnia and Herzegovina | 72 | 1.2% |
| Bulgaria | 24 | 0.4% |
| Eastern Asia | 7 | 0.1% |
| Eastern Europe | 122 | 2.0% |
| Europe | 122 | 2.0% |
| India | 16 | 0.3% |
| Korea | 7 | 0.1% |
| Laos | 37 | 0.6% |
| Romania | 26 | 0.4% |
| South Central Asia | 16 | 0.3% |
| South Eastern Asia | 37 | 0.6% | View All 12 Rows |
Sex and Age in Slinger
Sex and Age in Slinger
The most populous age groups in Slinger are 10 to 14 Years (321 | 10.6%) for men and 45 to 49 Years (310 | 10.3%) for women.
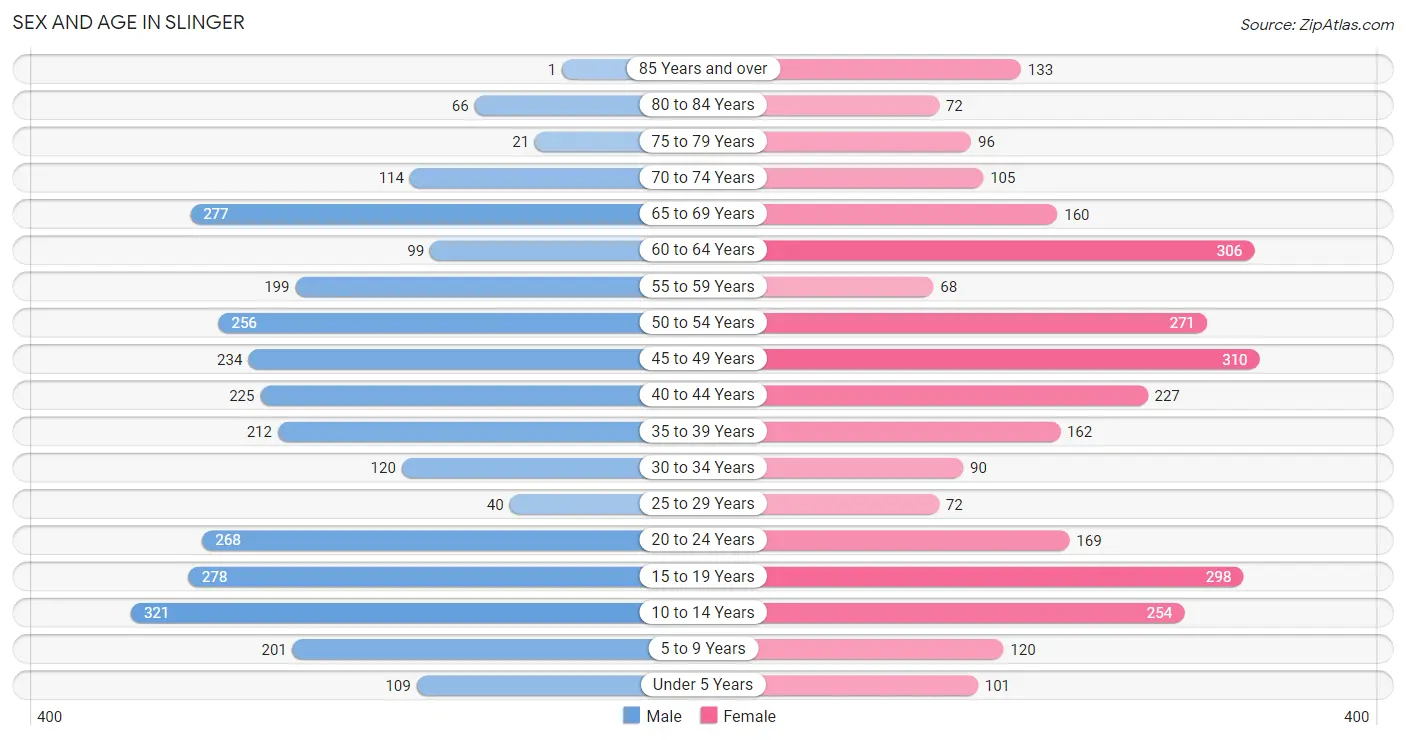
| Age Bracket | Male | Female |
| Under 5 Years | 109 (3.6%) | 101 (3.4%) |
| 5 to 9 Years | 201 (6.6%) | 120 (4.0%) |
| 10 to 14 Years | 321 (10.6%) | 254 (8.4%) |
| 15 to 19 Years | 278 (9.1%) | 298 (9.9%) |
| 20 to 24 Years | 268 (8.8%) | 169 (5.6%) |
| 25 to 29 Years | 40 (1.3%) | 72 (2.4%) |
| 30 to 34 Years | 120 (4.0%) | 90 (3.0%) |
| 35 to 39 Years | 212 (7.0%) | 162 (5.4%) |
| 40 to 44 Years | 225 (7.4%) | 227 (7.5%) |
| 45 to 49 Years | 234 (7.7%) | 310 (10.3%) |
| 50 to 54 Years | 256 (8.4%) | 271 (9.0%) |
| 55 to 59 Years | 199 (6.5%) | 68 (2.3%) |
| 60 to 64 Years | 99 (3.3%) | 306 (10.2%) |
| 65 to 69 Years | 277 (9.1%) | 160 (5.3%) |
| 70 to 74 Years | 114 (3.7%) | 105 (3.5%) |
| 75 to 79 Years | 21 (0.7%) | 96 (3.2%) |
| 80 to 84 Years | 66 (2.2%) | 72 (2.4%) |
| 85 Years and over | 1 (0.0%) | 133 (4.4%) |
| Total | 3,041 (100.0%) | 3,014 (100.0%) |
Families and Households in Slinger
Median Family Size in Slinger
The median family size in Slinger is 2.94 persons per family, with married-couple families (1,157 | 72.6%) accounting for the largest median family size of 3.09 persons per family. On the other hand, single female/mother families (415 | 26.1%) represent the smallest median family size with 2.52 persons per family.
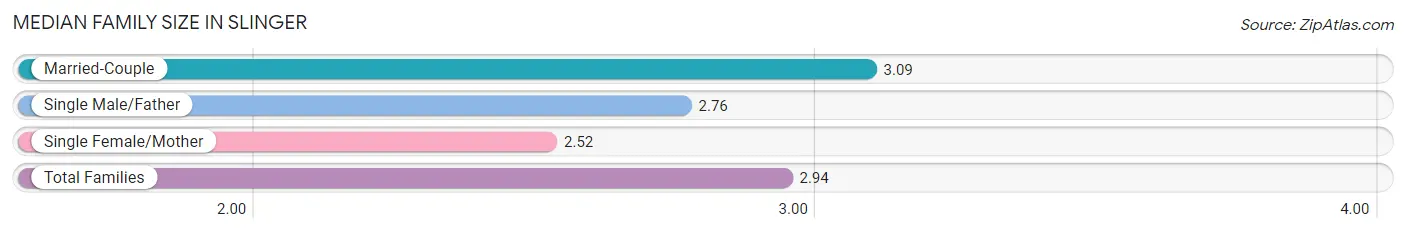
| Family Type | # Families | Family Size |
| Married-Couple | 1,157 (72.6%) | 3.09 |
| Single Male/Father | 21 (1.3%) | 2.76 |
| Single Female/Mother | 415 (26.1%) | 2.52 |
| Total Families | 1,593 (100.0%) | 2.94 |
Median Household Size in Slinger
The median household size in Slinger is 2.28 persons per household, with married-couple households (1,157 | 43.5%) accounting for the largest median household size of 3.09 persons per household. non-family households (1,067 | 40.1%) represent the smallest median household size with 1.29 persons per household.
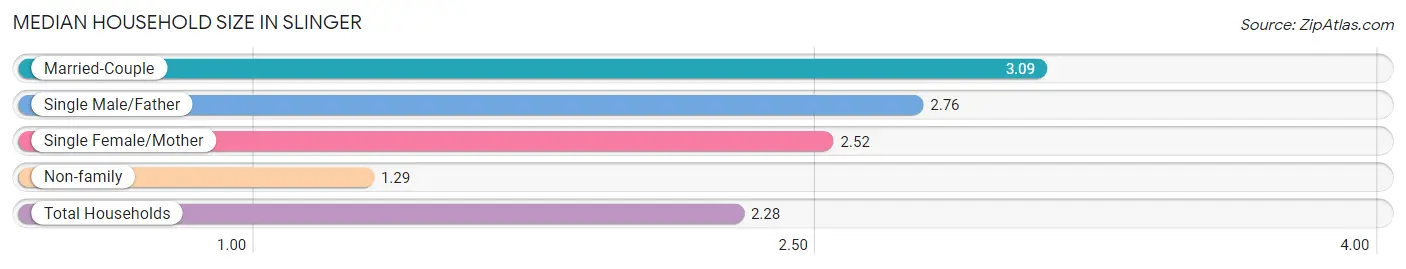
| Household Type | # Households | Household Size |
| Married-Couple | 1,157 (43.5%) | 3.09 |
| Single Male/Father | 21 (0.8%) | 2.76 |
| Single Female/Mother | 415 (15.6%) | 2.52 |
| Non-family | 1,067 (40.1%) | 1.29 |
| Total Households | 2,660 (100.0%) | 2.28 |
Household Size by Marriage Status in Slinger
Out of a total of 2,660 households in Slinger, 1,593 (59.9%) are family households, while 1,067 (40.1%) are nonfamily households. The most numerous type of family households are 2-person households, comprising 850, and the most common type of nonfamily households are 1-person households, comprising 829.
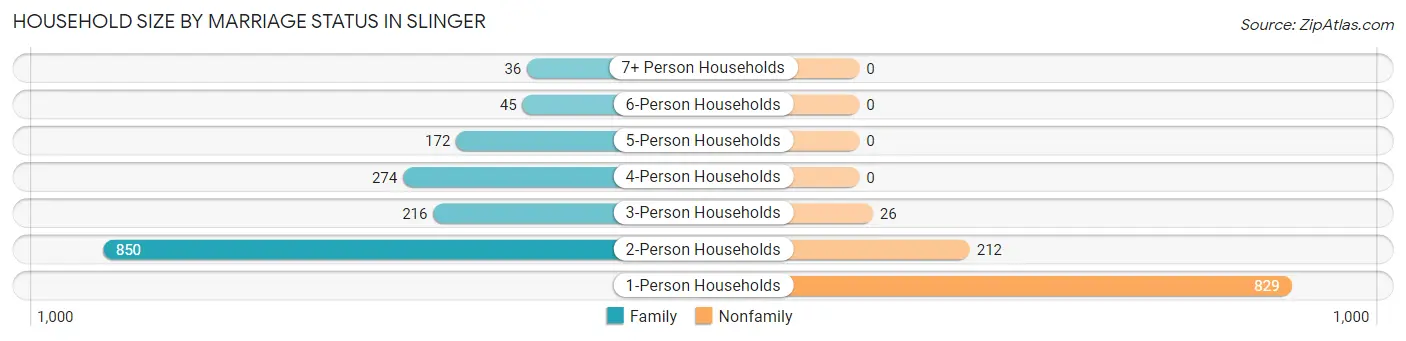
| Household Size | Family Households | Nonfamily Households |
| 1-Person Households | - | 829 (31.2%) |
| 2-Person Households | 850 (32.0%) | 212 (8.0%) |
| 3-Person Households | 216 (8.1%) | 26 (1.0%) |
| 4-Person Households | 274 (10.3%) | 0 (0.0%) |
| 5-Person Households | 172 (6.5%) | 0 (0.0%) |
| 6-Person Households | 45 (1.7%) | 0 (0.0%) |
| 7+ Person Households | 36 (1.3%) | 0 (0.0%) |
| Total | 1,593 (59.9%) | 1,067 (40.1%) |
Female Fertility in Slinger
Fertility by Age in Slinger
Average fertility rate in Slinger is 29.0 births per 1,000 women. Women in the age bracket of 20 to 34 years have the highest fertility rate with 45.0 births per 1,000 women. Women in the age bracket of 35 to 50 years acount for 64.3% of all women with births.
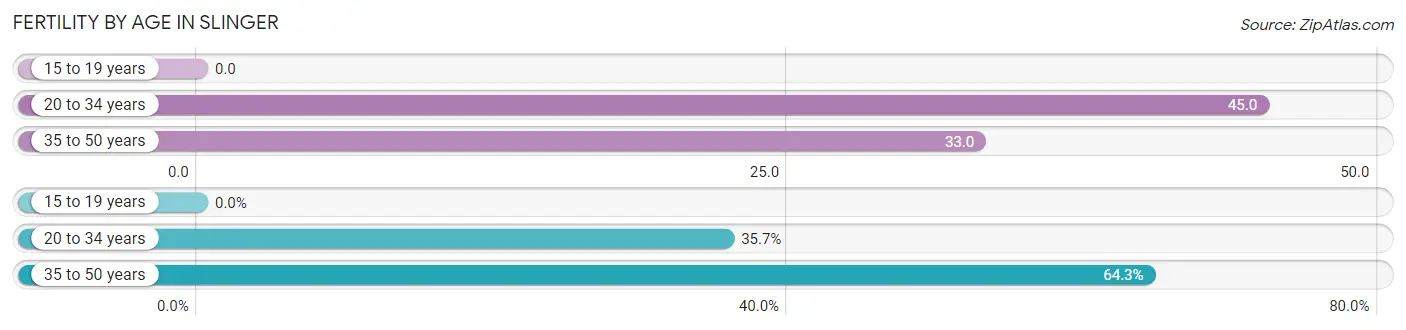
| Age Bracket | Women with Births | Births / 1,000 Women |
| 15 to 19 years | 0 (0.0%) | 0.0 |
| 20 to 34 years | 15 (35.7%) | 45.0 |
| 35 to 50 years | 27 (64.3%) | 33.0 |
| Total | 42 (100.0%) | 29.0 |
Fertility by Age by Marriage Status in Slinger
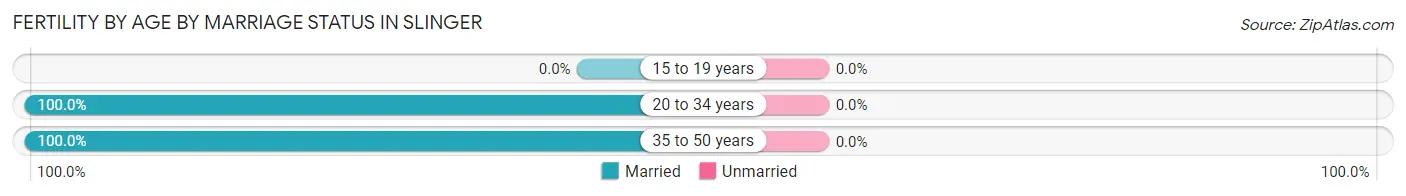
| Age Bracket | Married | Unmarried |
| 15 to 19 years | 0 (0.0%) | 0 (0.0%) |
| 20 to 34 years | 15 (100.0%) | 0 (0.0%) |
| 35 to 50 years | 27 (100.0%) | 0 (0.0%) |
| Total | 42 (100.0%) | 0 (0.0%) |
Fertility by Education in Slinger
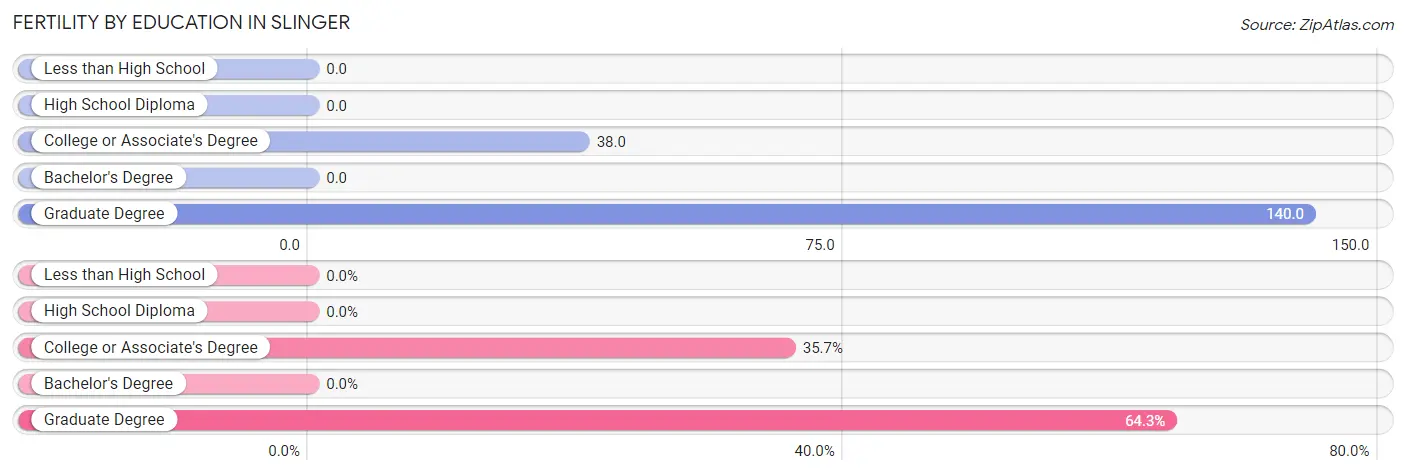
| Educational Attainment | Women with Births | Births / 1,000 Women |
| Less than High School | 0 (0.0%) | 0.0 |
| High School Diploma | 0 (0.0%) | 0.0 |
| College or Associate's Degree | 15 (35.7%) | 38.0 |
| Bachelor's Degree | 0 (0.0%) | 0.0 |
| Graduate Degree | 27 (64.3%) | 140.0 |
| Total | 42 (100.0%) | 29.0 |
Fertility by Education by Marriage Status in Slinger
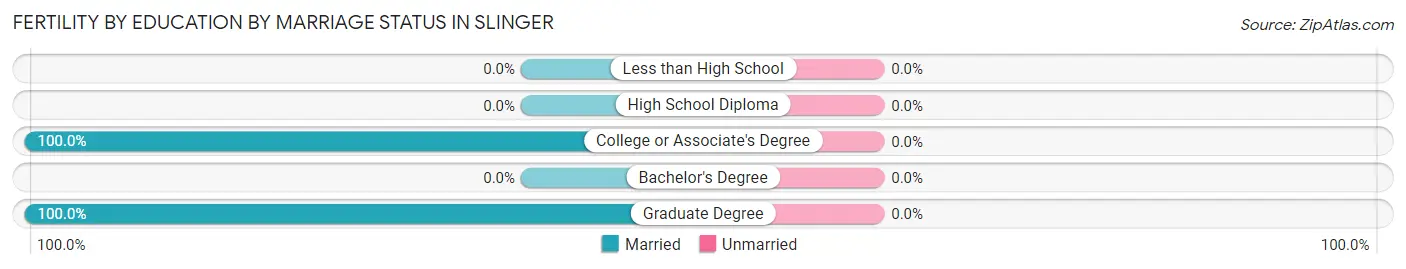
| Educational Attainment | Married | Unmarried |
| Less than High School | 0 (0.0%) | 0 (0.0%) |
| High School Diploma | 0 (0.0%) | 0 (0.0%) |
| College or Associate's Degree | 15 (100.0%) | 0 (0.0%) |
| Bachelor's Degree | 0 (0.0%) | 0 (0.0%) |
| Graduate Degree | 27 (100.0%) | 0 (0.0%) |
| Total | 42 (100.0%) | 0 (0.0%) |
Employment Characteristics in Slinger
Employment by Class of Employer in Slinger
Among the 3,447 employed individuals in Slinger, private company employees (2,673 | 77.5%), not-for-profit organizations (313 | 9.1%), and self-employed (incorporated) (141 | 4.1%) make up the most common classes of employment.
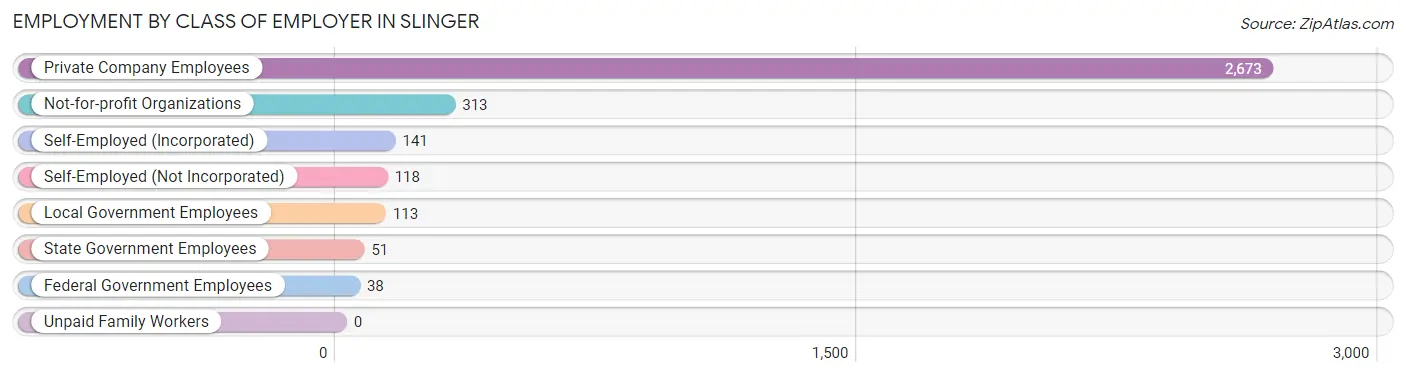
| Employer Class | # Employees | % Employees |
| Private Company Employees | 2,673 | 77.5% |
| Self-Employed (Incorporated) | 141 | 4.1% |
| Self-Employed (Not Incorporated) | 118 | 3.4% |
| Not-for-profit Organizations | 313 | 9.1% |
| Local Government Employees | 113 | 3.3% |
| State Government Employees | 51 | 1.5% |
| Federal Government Employees | 38 | 1.1% |
| Unpaid Family Workers | 0 | 0.0% |
| Total | 3,447 | 100.0% |
Employment Status by Age in Slinger
According to the labor force statistics for Slinger, out of the total population over 16 years of age (4,866), 74.9% or 3,645 individuals are in the labor force, with 5.4% or 197 of them unemployed. The age group with the highest labor force participation rate is 35 to 44 years, with 97.6% or 806 individuals in the labor force. Within the labor force, the 65 to 74 years age range has the highest percentage of unemployed individuals, with 43.4% or 129 of them being unemployed.
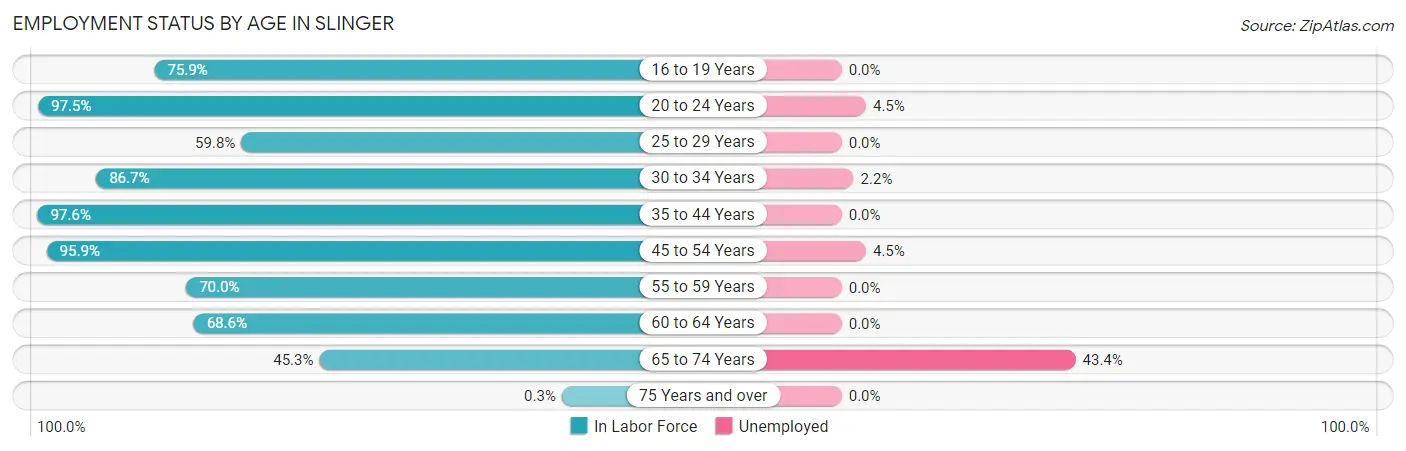
| Age Bracket | In Labor Force | Unemployed |
| 16 to 19 Years | 374 (75.9%) | 0 (0.0%) |
| 20 to 24 Years | 426 (97.5%) | 19 (4.5%) |
| 25 to 29 Years | 67 (59.8%) | 0 (0.0%) |
| 30 to 34 Years | 182 (86.7%) | 4 (2.2%) |
| 35 to 44 Years | 806 (97.6%) | 0 (0.0%) |
| 45 to 54 Years | 1,027 (95.9%) | 46 (4.5%) |
| 55 to 59 Years | 187 (70.0%) | 0 (0.0%) |
| 60 to 64 Years | 278 (68.6%) | 0 (0.0%) |
| 65 to 74 Years | 297 (45.3%) | 129 (43.4%) |
| 75 Years and over | 1 (0.3%) | 0 (0.0%) |
| Total | 3,645 (74.9%) | 197 (5.4%) |
Employment Status by Educational Attainment in Slinger
According to labor force statistics for Slinger, 88.1% of individuals (2,547) out of the total population between 25 and 64 years of age (2,891) are in the labor force, with 2.0% or 51 of them being unemployed. The group with the highest labor force participation rate are those with the educational attainment of less than high school, with 100.0% or 28 individuals in the labor force. Within the labor force, individuals with college / associate degree education have the highest percentage of unemployment, with 5.0% or 36 of them being unemployed.
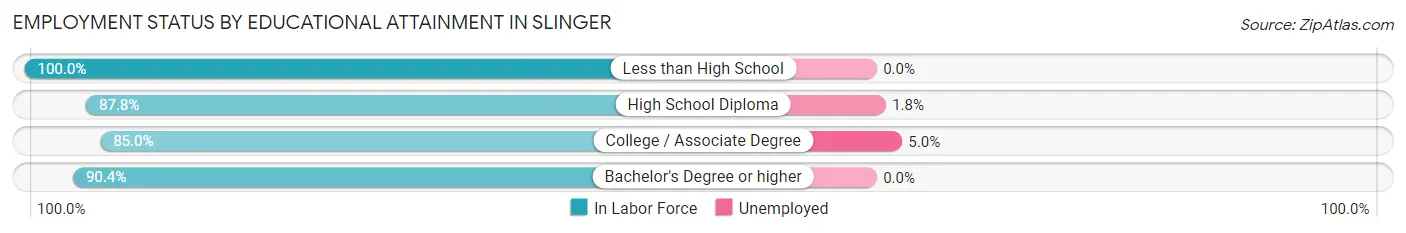
| Educational Attainment | In Labor Force | Unemployed |
| Less than High School | 28 (100.0%) | 0 (0.0%) |
| High School Diploma | 786 (87.8%) | 16 (1.8%) |
| College / Associate Degree | 724 (85.0%) | 43 (5.0%) |
| Bachelor's Degree or higher | 1,009 (90.4%) | 0 (0.0%) |
| Total | 2,547 (88.1%) | 58 (2.0%) |
Employment Occupations by Sex in Slinger
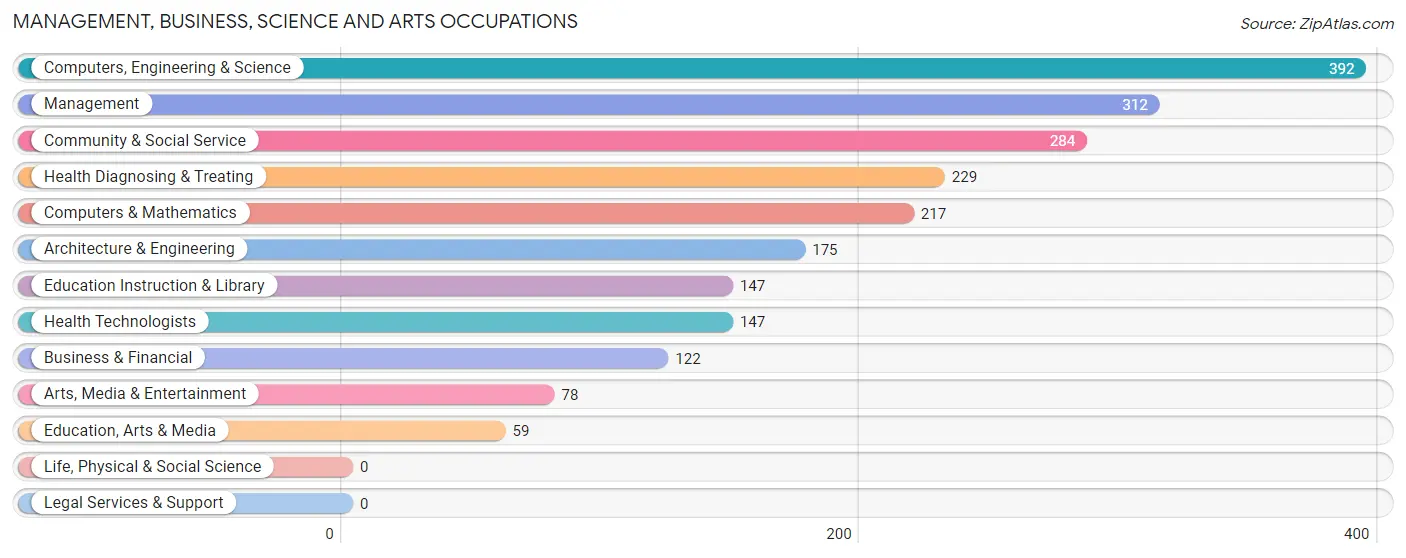
Management, Business, Science and Arts Occupations
The most common Management, Business, Science and Arts occupations in Slinger are Computers, Engineering & Science (392 | 11.4%), Management (312 | 9.0%), Community & Social Service (284 | 8.2%), Health Diagnosing & Treating (229 | 6.6%), and Computers & Mathematics (217 | 6.3%).
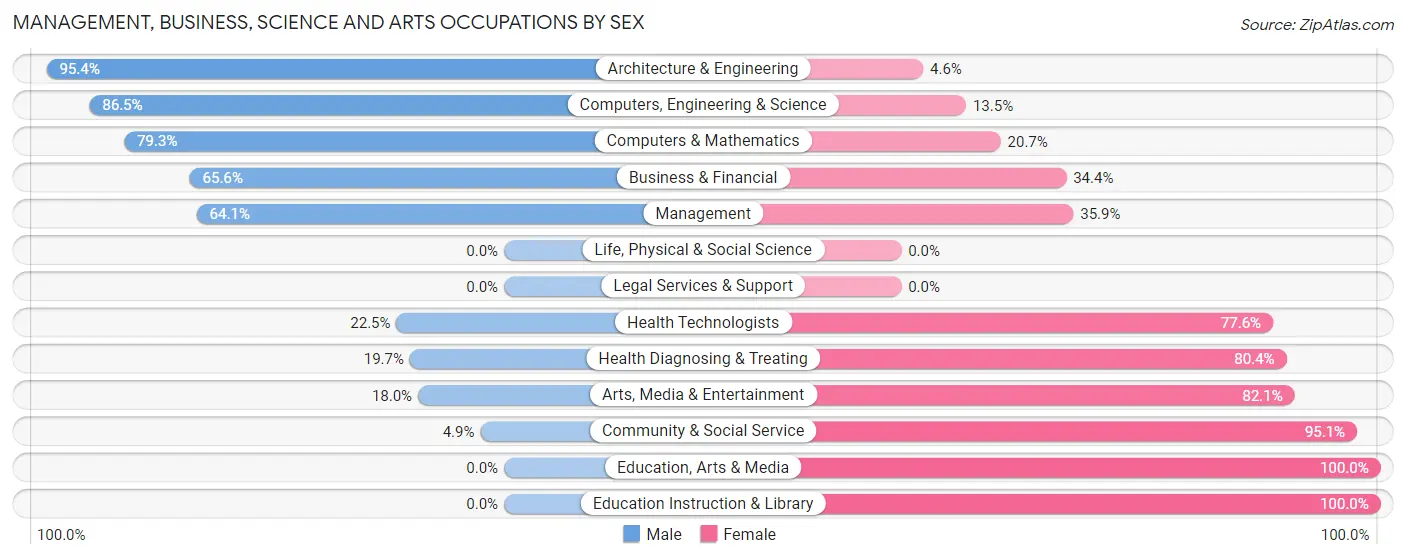
Management, Business, Science and Arts Occupations by Sex
Within the Management, Business, Science and Arts occupations in Slinger, the most male-oriented occupations are Architecture & Engineering (95.4%), Computers, Engineering & Science (86.5%), and Computers & Mathematics (79.3%), while the most female-oriented occupations are Education, Arts & Media (100.0%), Education Instruction & Library (100.0%), and Community & Social Service (95.1%).
| Occupation | Male | Female |
| Management | 200 (64.1%) | 112 (35.9%) |
| Business & Financial | 80 (65.6%) | 42 (34.4%) |
| Computers, Engineering & Science | 339 (86.5%) | 53 (13.5%) |
| Computers & Mathematics | 172 (79.3%) | 45 (20.7%) |
| Architecture & Engineering | 167 (95.4%) | 8 (4.6%) |
| Life, Physical & Social Science | 0 (0.0%) | 0 (0.0%) |
| Community & Social Service | 14 (4.9%) | 270 (95.1%) |
| Education, Arts & Media | 0 (0.0%) | 59 (100.0%) |
| Legal Services & Support | 0 (0.0%) | 0 (0.0%) |
| Education Instruction & Library | 0 (0.0%) | 147 (100.0%) |
| Arts, Media & Entertainment | 14 (17.9%) | 64 (82.1%) |
| Health Diagnosing & Treating | 45 (19.7%) | 184 (80.3%) |
| Health Technologists | 33 (22.5%) | 114 (77.5%) |
| Total (Category) | 678 (50.6%) | 661 (49.4%) |
| Total (Overall) | 1,754 (50.9%) | 1,693 (49.1%) |
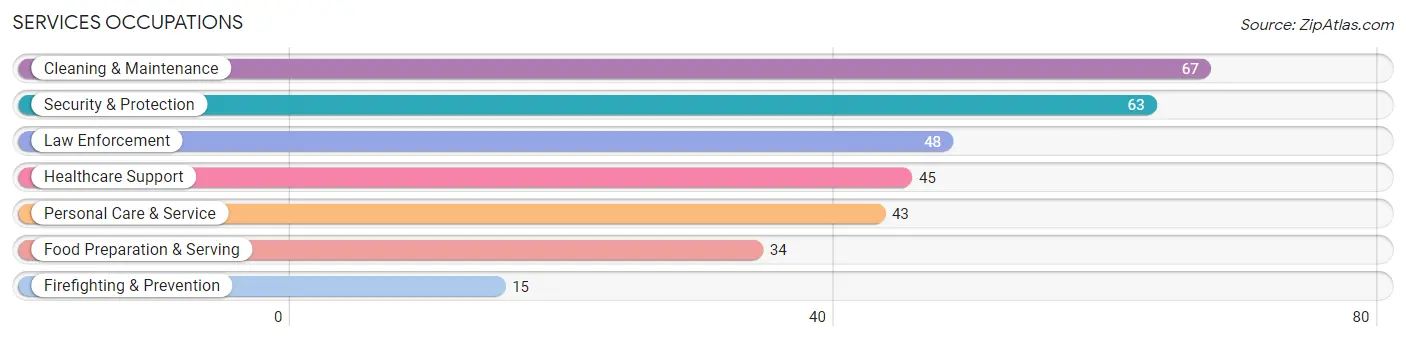
Services Occupations
The most common Services occupations in Slinger are Cleaning & Maintenance (67 | 1.9%), Security & Protection (63 | 1.8%), Law Enforcement (48 | 1.4%), Healthcare Support (45 | 1.3%), and Personal Care & Service (43 | 1.3%).
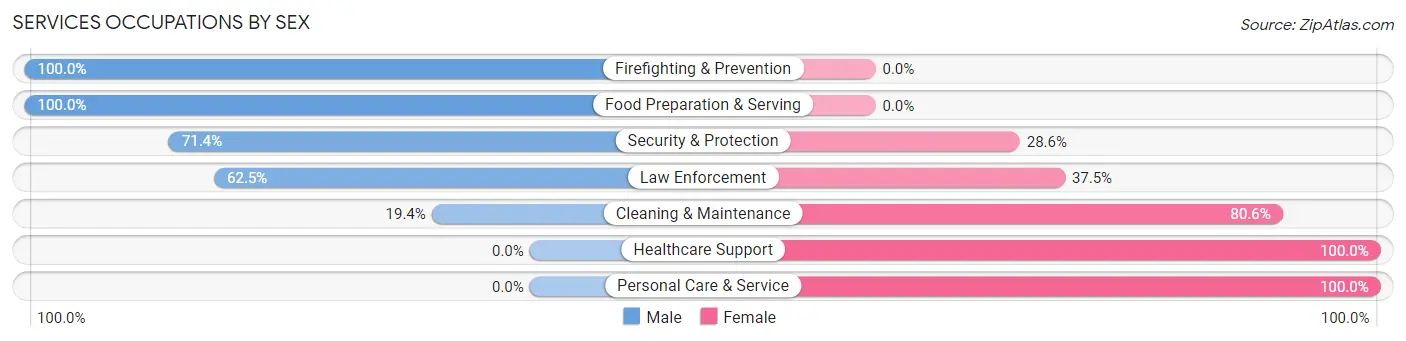
Services Occupations by Sex
Within the Services occupations in Slinger, the most male-oriented occupations are Firefighting & Prevention (100.0%), Food Preparation & Serving (100.0%), and Security & Protection (71.4%), while the most female-oriented occupations are Healthcare Support (100.0%), Personal Care & Service (100.0%), and Cleaning & Maintenance (80.6%).
| Occupation | Male | Female |
| Healthcare Support | 0 (0.0%) | 45 (100.0%) |
| Security & Protection | 45 (71.4%) | 18 (28.6%) |
| Firefighting & Prevention | 15 (100.0%) | 0 (0.0%) |
| Law Enforcement | 30 (62.5%) | 18 (37.5%) |
| Food Preparation & Serving | 34 (100.0%) | 0 (0.0%) |
| Cleaning & Maintenance | 13 (19.4%) | 54 (80.6%) |
| Personal Care & Service | 0 (0.0%) | 43 (100.0%) |
| Total (Category) | 92 (36.5%) | 160 (63.5%) |
| Total (Overall) | 1,754 (50.9%) | 1,693 (49.1%) |
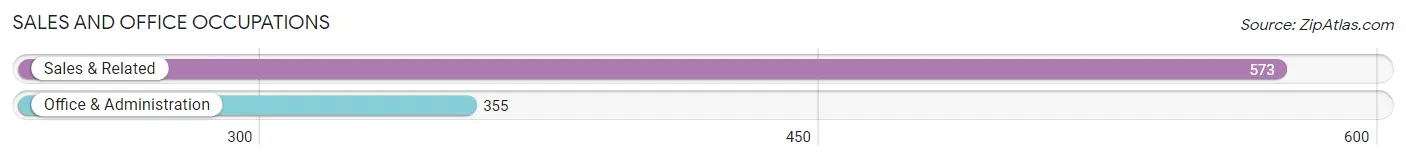
Sales and Office Occupations
The most common Sales and Office occupations in Slinger are Sales & Related (573 | 16.6%), and Office & Administration (355 | 10.3%).
Sales and Office Occupations by Sex
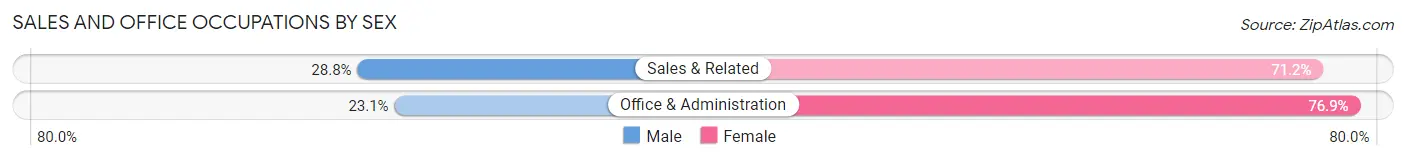
| Occupation | Male | Female |
| Sales & Related | 165 (28.8%) | 408 (71.2%) |
| Office & Administration | 82 (23.1%) | 273 (76.9%) |
| Total (Category) | 247 (26.6%) | 681 (73.4%) |
| Total (Overall) | 1,754 (50.9%) | 1,693 (49.1%) |
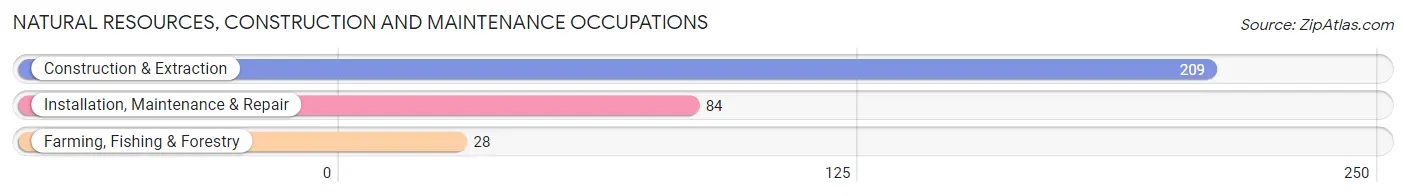
Natural Resources, Construction and Maintenance Occupations
The most common Natural Resources, Construction and Maintenance occupations in Slinger are Construction & Extraction (209 | 6.1%), Installation, Maintenance & Repair (84 | 2.4%), and Farming, Fishing & Forestry (28 | 0.8%).
Natural Resources, Construction and Maintenance Occupations by Sex
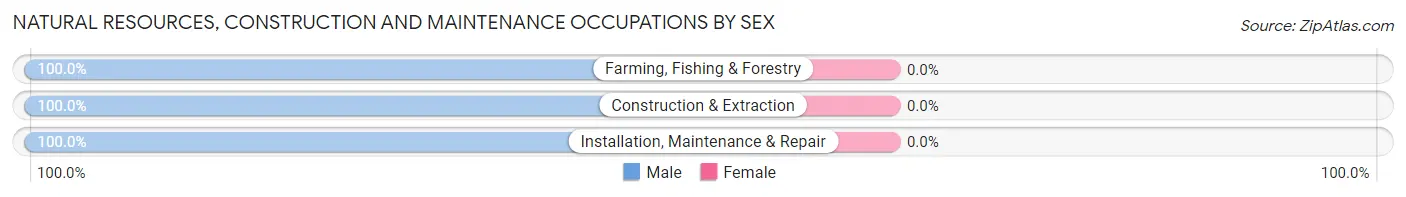
| Occupation | Male | Female |
| Farming, Fishing & Forestry | 28 (100.0%) | 0 (0.0%) |
| Construction & Extraction | 209 (100.0%) | 0 (0.0%) |
| Installation, Maintenance & Repair | 84 (100.0%) | 0 (0.0%) |
| Total (Category) | 321 (100.0%) | 0 (0.0%) |
| Total (Overall) | 1,754 (50.9%) | 1,693 (49.1%) |
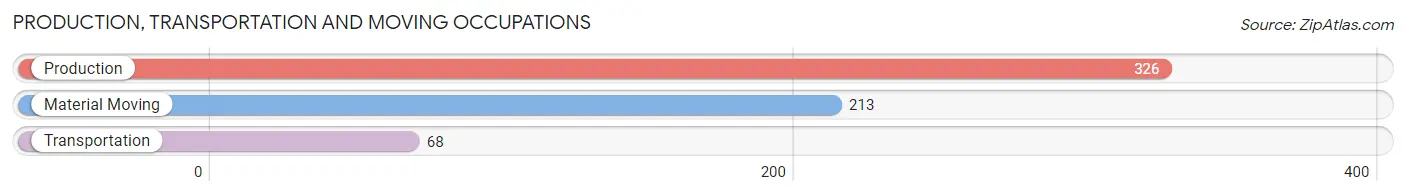
Production, Transportation and Moving Occupations
The most common Production, Transportation and Moving occupations in Slinger are Production (326 | 9.5%), Material Moving (213 | 6.2%), and Transportation (68 | 2.0%).
Production, Transportation and Moving Occupations by Sex
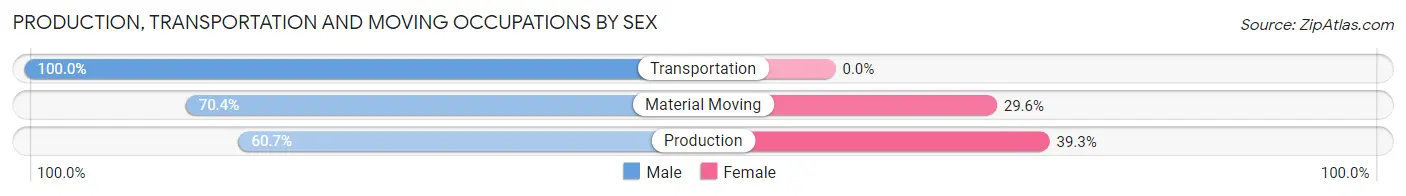
| Occupation | Male | Female |
| Production | 198 (60.7%) | 128 (39.3%) |
| Transportation | 68 (100.0%) | 0 (0.0%) |
| Material Moving | 150 (70.4%) | 63 (29.6%) |
| Total (Category) | 416 (68.5%) | 191 (31.5%) |
| Total (Overall) | 1,754 (50.9%) | 1,693 (49.1%) |
Employment Industries by Sex in Slinger
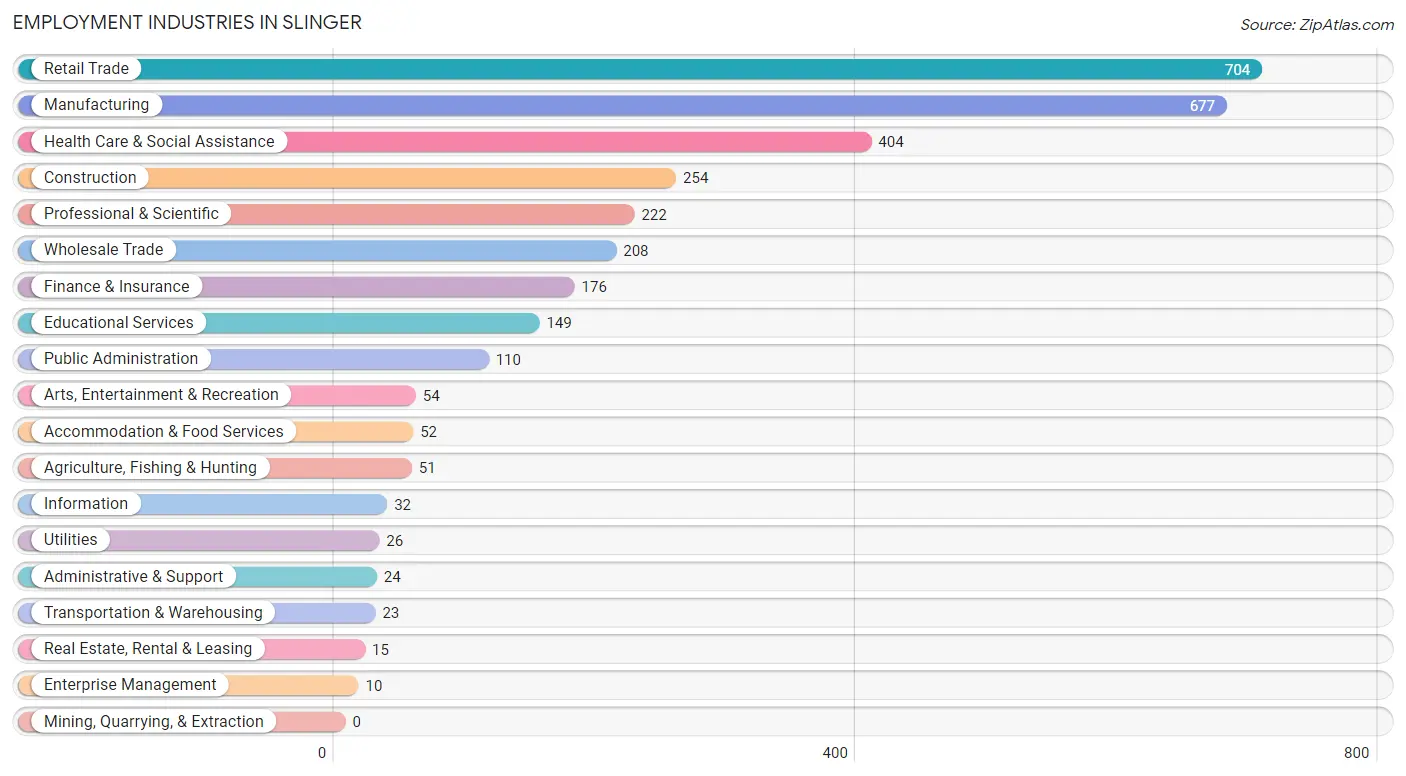
Employment Industries in Slinger
The major employment industries in Slinger include Retail Trade (704 | 20.4%), Manufacturing (677 | 19.6%), Health Care & Social Assistance (404 | 11.7%), Construction (254 | 7.4%), and Professional & Scientific (222 | 6.4%).
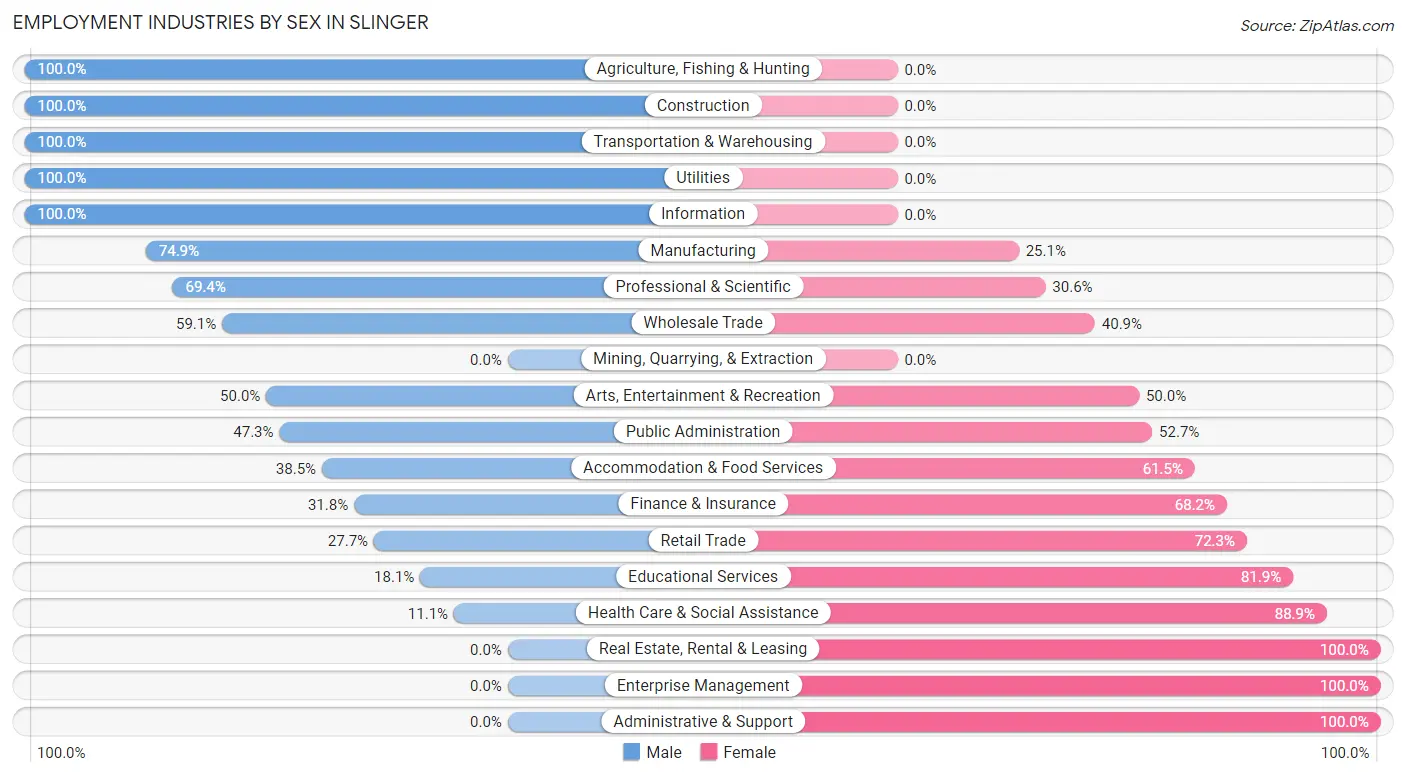
Employment Industries by Sex in Slinger
The Slinger industries that see more men than women are Agriculture, Fishing & Hunting (100.0%), Construction (100.0%), and Transportation & Warehousing (100.0%), whereas the industries that tend to have a higher number of women are Real Estate, Rental & Leasing (100.0%), Enterprise Management (100.0%), and Administrative & Support (100.0%).
| Industry | Male | Female |
| Agriculture, Fishing & Hunting | 51 (100.0%) | 0 (0.0%) |
| Mining, Quarrying, & Extraction | 0 (0.0%) | 0 (0.0%) |
| Construction | 254 (100.0%) | 0 (0.0%) |
| Manufacturing | 507 (74.9%) | 170 (25.1%) |
| Wholesale Trade | 123 (59.1%) | 85 (40.9%) |
| Retail Trade | 195 (27.7%) | 509 (72.3%) |
| Transportation & Warehousing | 23 (100.0%) | 0 (0.0%) |
| Utilities | 26 (100.0%) | 0 (0.0%) |
| Information | 32 (100.0%) | 0 (0.0%) |
| Finance & Insurance | 56 (31.8%) | 120 (68.2%) |
| Real Estate, Rental & Leasing | 0 (0.0%) | 15 (100.0%) |
| Professional & Scientific | 154 (69.4%) | 68 (30.6%) |
| Enterprise Management | 0 (0.0%) | 10 (100.0%) |
| Administrative & Support | 0 (0.0%) | 24 (100.0%) |
| Educational Services | 27 (18.1%) | 122 (81.9%) |
| Health Care & Social Assistance | 45 (11.1%) | 359 (88.9%) |
| Arts, Entertainment & Recreation | 27 (50.0%) | 27 (50.0%) |
| Accommodation & Food Services | 20 (38.5%) | 32 (61.5%) |
| Public Administration | 52 (47.3%) | 58 (52.7%) |
| Total | 1,754 (50.9%) | 1,693 (49.1%) |
Education in Slinger
School Enrollment in Slinger
The most common levels of schooling among the 1,486 students in Slinger are high school (542 | 36.5%), middle school (488 | 32.8%), and elementary school (228 | 15.3%).
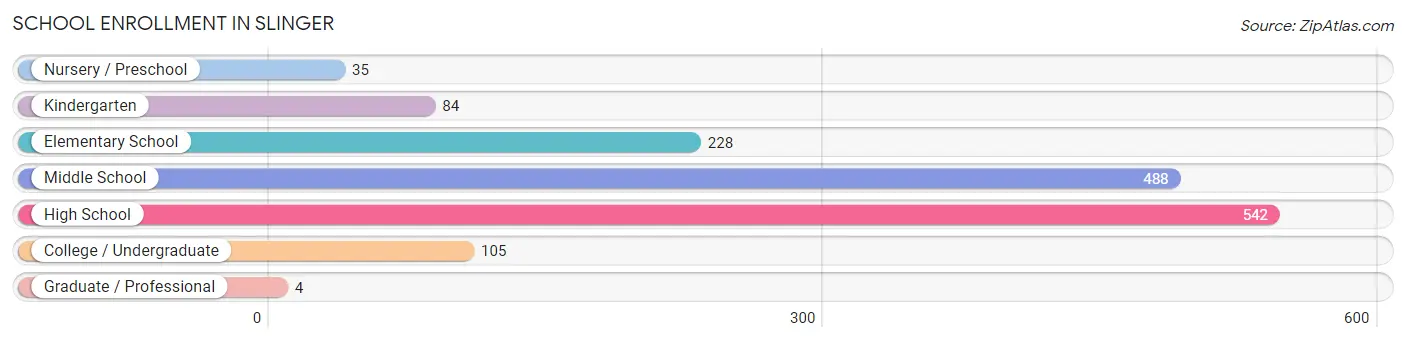
| School Level | # Students | % Students |
| Nursery / Preschool | 35 | 2.4% |
| Kindergarten | 84 | 5.7% |
| Elementary School | 228 | 15.3% |
| Middle School | 488 | 32.8% |
| High School | 542 | 36.5% |
| College / Undergraduate | 105 | 7.1% |
| Graduate / Professional | 4 | 0.3% |
| Total | 1,486 | 100.0% |
School Enrollment by Age by Funding Source in Slinger
Out of a total of 1,486 students who are enrolled in schools in Slinger, 282 (19.0%) attend a private institution, while the remaining 1,204 (81.0%) are enrolled in public schools. The age group of 5 to 9 year old has the highest likelihood of being enrolled in private schools, with 119 (37.1% in the age bracket) enrolled. Conversely, the age group of 3 to 4 year olds has the lowest likelihood of being enrolled in a private school, with 8 (100.0% in the age bracket) attending a public institution.
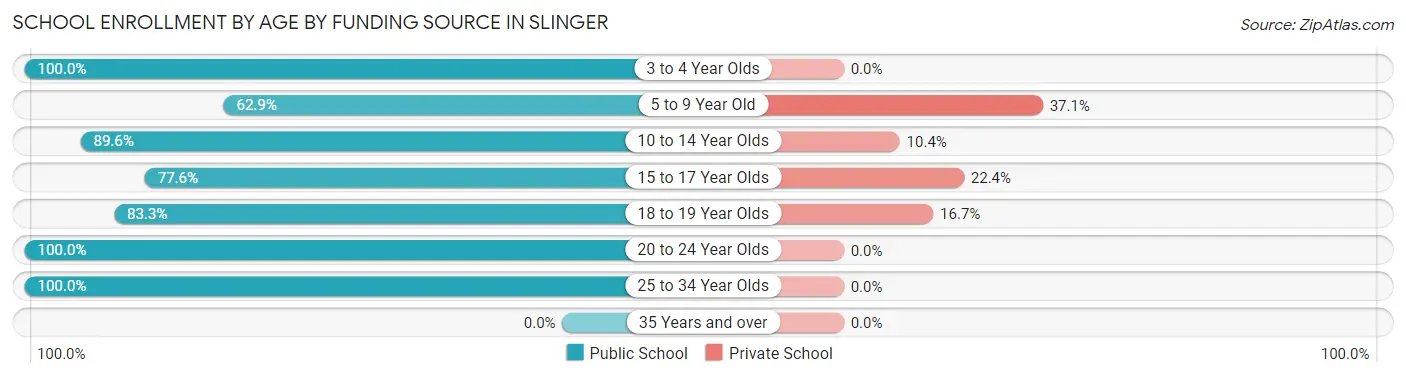
| Age Bracket | Public School | Private School |
| 3 to 4 Year Olds | 8 (100.0%) | 0 (0.0%) |
| 5 to 9 Year Old | 202 (62.9%) | 119 (37.1%) |
| 10 to 14 Year Olds | 515 (89.6%) | 60 (10.4%) |
| 15 to 17 Year Olds | 208 (77.6%) | 60 (22.4%) |
| 18 to 19 Year Olds | 220 (83.3%) | 44 (16.7%) |
| 20 to 24 Year Olds | 46 (100.0%) | 0 (0.0%) |
| 25 to 34 Year Olds | 4 (100.0%) | 0 (0.0%) |
| 35 Years and over | 0 (0.0%) | 0 (0.0%) |
| Total | 1,204 (81.0%) | 282 (19.0%) |
Educational Attainment by Field of Study in Slinger
Communications (206 | 13.4%), business (170 | 11.0%), education (167 | 10.8%), engineering (153 | 9.9%), and bio, nature & agricultural (141 | 9.2%) are the most common fields of study among 1,540 individuals in Slinger who have obtained a bachelor's degree or higher.
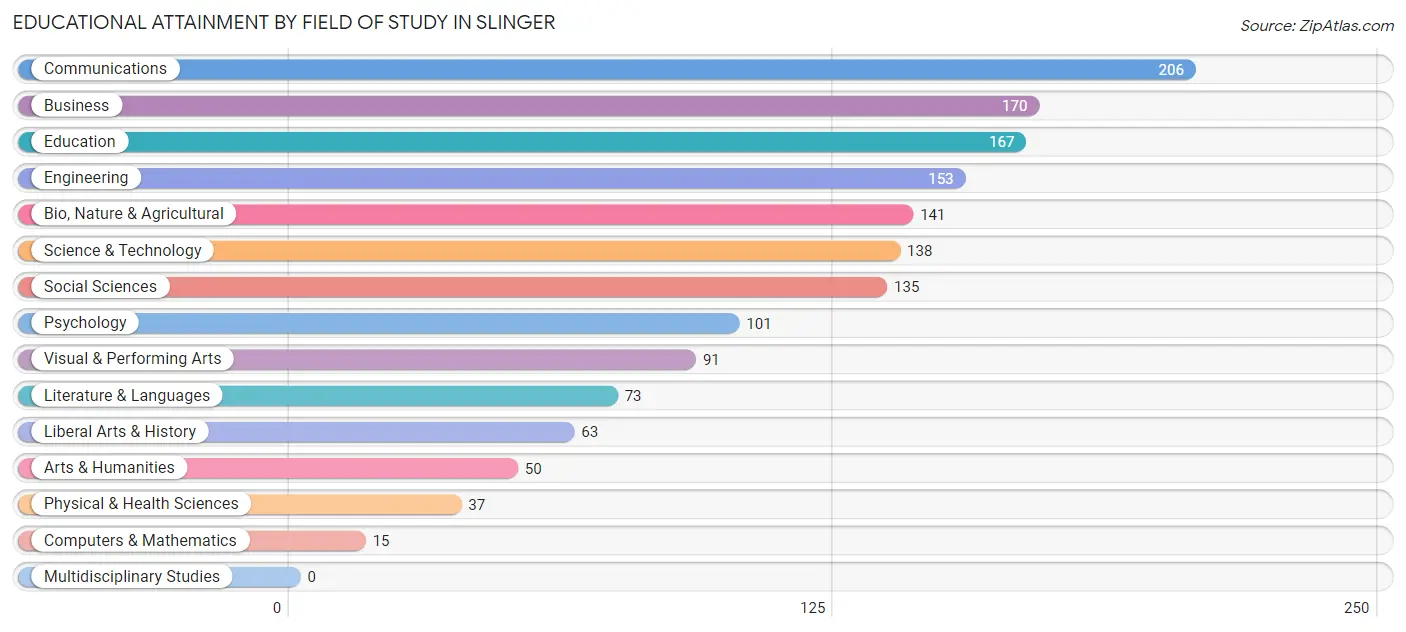
| Field of Study | # Graduates | % Graduates |
| Computers & Mathematics | 15 | 1.0% |
| Bio, Nature & Agricultural | 141 | 9.2% |
| Physical & Health Sciences | 37 | 2.4% |
| Psychology | 101 | 6.6% |
| Social Sciences | 135 | 8.8% |
| Engineering | 153 | 9.9% |
| Multidisciplinary Studies | 0 | 0.0% |
| Science & Technology | 138 | 9.0% |
| Business | 170 | 11.0% |
| Education | 167 | 10.8% |
| Literature & Languages | 73 | 4.7% |
| Liberal Arts & History | 63 | 4.1% |
| Visual & Performing Arts | 91 | 5.9% |
| Communications | 206 | 13.4% |
| Arts & Humanities | 50 | 3.3% |
| Total | 1,540 | 100.0% |
Transportation & Commute in Slinger
Vehicle Availability by Sex in Slinger
The most prevalent vehicle ownership categories in Slinger are males with 2 vehicles (834, accounting for 47.5%) and females with 2 vehicles (674, making up 49.3%).
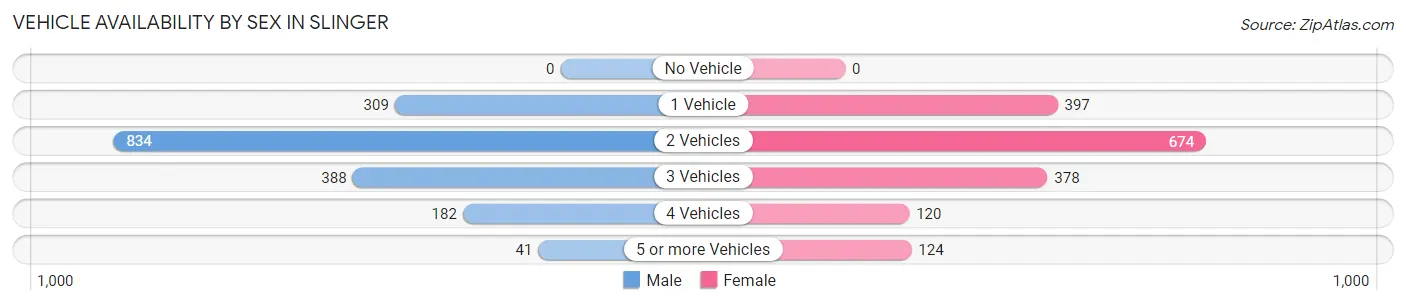
| Vehicles Available | Male | Female |
| No Vehicle | 0 (0.0%) | 0 (0.0%) |
| 1 Vehicle | 309 (17.6%) | 397 (23.4%) |
| 2 Vehicles | 834 (47.5%) | 674 (39.8%) |
| 3 Vehicles | 388 (22.1%) | 378 (22.3%) |
| 4 Vehicles | 182 (10.4%) | 120 (7.1%) |
| 5 or more Vehicles | 41 (2.3%) | 124 (7.3%) |
| Total | 1,754 (100.0%) | 1,693 (100.0%) |
Commute Time in Slinger
The most frequently occuring commute durations in Slinger are 30 to 34 minutes (1,006 commuters, 31.4%), 20 to 24 minutes (485 commuters, 15.1%), and 45 to 59 minutes (381 commuters, 11.9%).
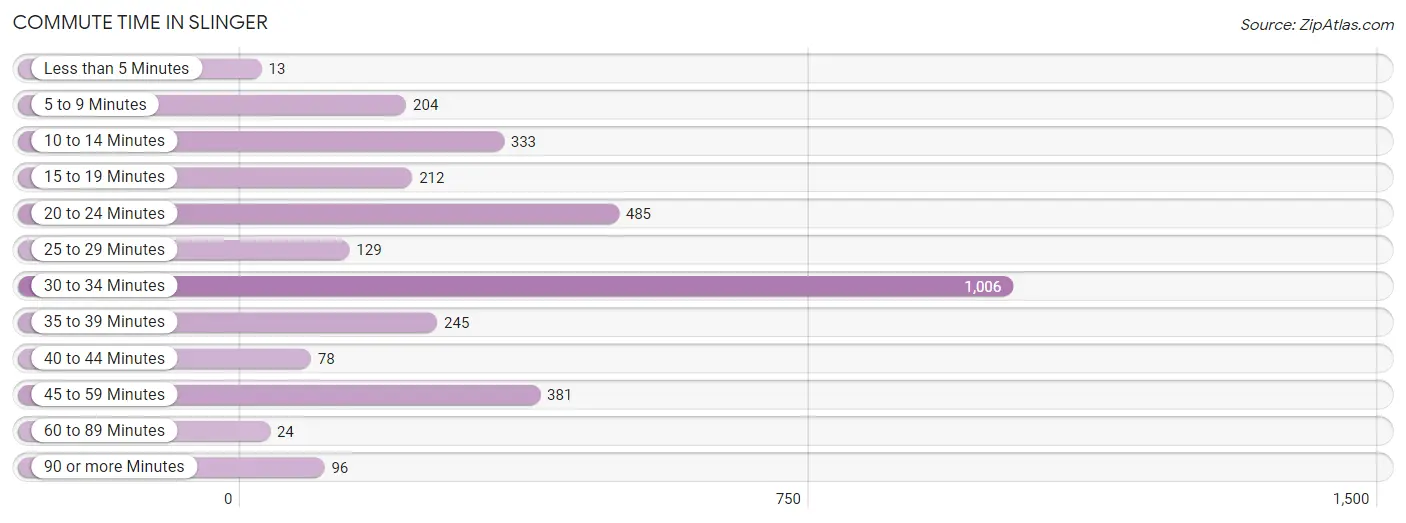
| Commute Time | # Commuters | % Commuters |
| Less than 5 Minutes | 13 | 0.4% |
| 5 to 9 Minutes | 204 | 6.4% |
| 10 to 14 Minutes | 333 | 10.4% |
| 15 to 19 Minutes | 212 | 6.6% |
| 20 to 24 Minutes | 485 | 15.1% |
| 25 to 29 Minutes | 129 | 4.0% |
| 30 to 34 Minutes | 1,006 | 31.4% |
| 35 to 39 Minutes | 245 | 7.6% |
| 40 to 44 Minutes | 78 | 2.4% |
| 45 to 59 Minutes | 381 | 11.9% |
| 60 to 89 Minutes | 24 | 0.7% |
| 90 or more Minutes | 96 | 3.0% |
Commute Time by Sex in Slinger
The most common commute times in Slinger are 30 to 34 minutes (584 commuters, 34.5%) for males and 30 to 34 minutes (422 commuters, 27.9%) for females.
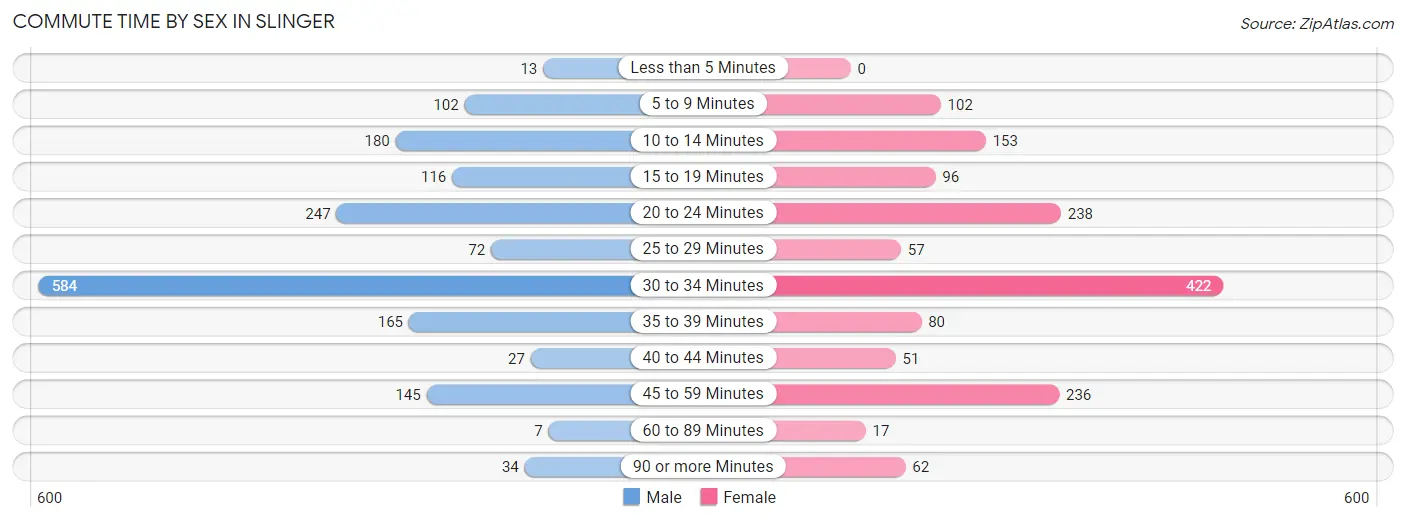
| Commute Time | Male | Female |
| Less than 5 Minutes | 13 (0.8%) | 0 (0.0%) |
| 5 to 9 Minutes | 102 (6.0%) | 102 (6.7%) |
| 10 to 14 Minutes | 180 (10.6%) | 153 (10.1%) |
| 15 to 19 Minutes | 116 (6.9%) | 96 (6.3%) |
| 20 to 24 Minutes | 247 (14.6%) | 238 (15.7%) |
| 25 to 29 Minutes | 72 (4.3%) | 57 (3.8%) |
| 30 to 34 Minutes | 584 (34.5%) | 422 (27.9%) |
| 35 to 39 Minutes | 165 (9.8%) | 80 (5.3%) |
| 40 to 44 Minutes | 27 (1.6%) | 51 (3.4%) |
| 45 to 59 Minutes | 145 (8.6%) | 236 (15.6%) |
| 60 to 89 Minutes | 7 (0.4%) | 17 (1.1%) |
| 90 or more Minutes | 34 (2.0%) | 62 (4.1%) |
Time of Departure to Work by Sex in Slinger
The most frequent times of departure to work in Slinger are 6:30 AM to 6:59 AM (345, 20.4%) for males and 7:00 AM to 7:29 AM (452, 29.8%) for females.
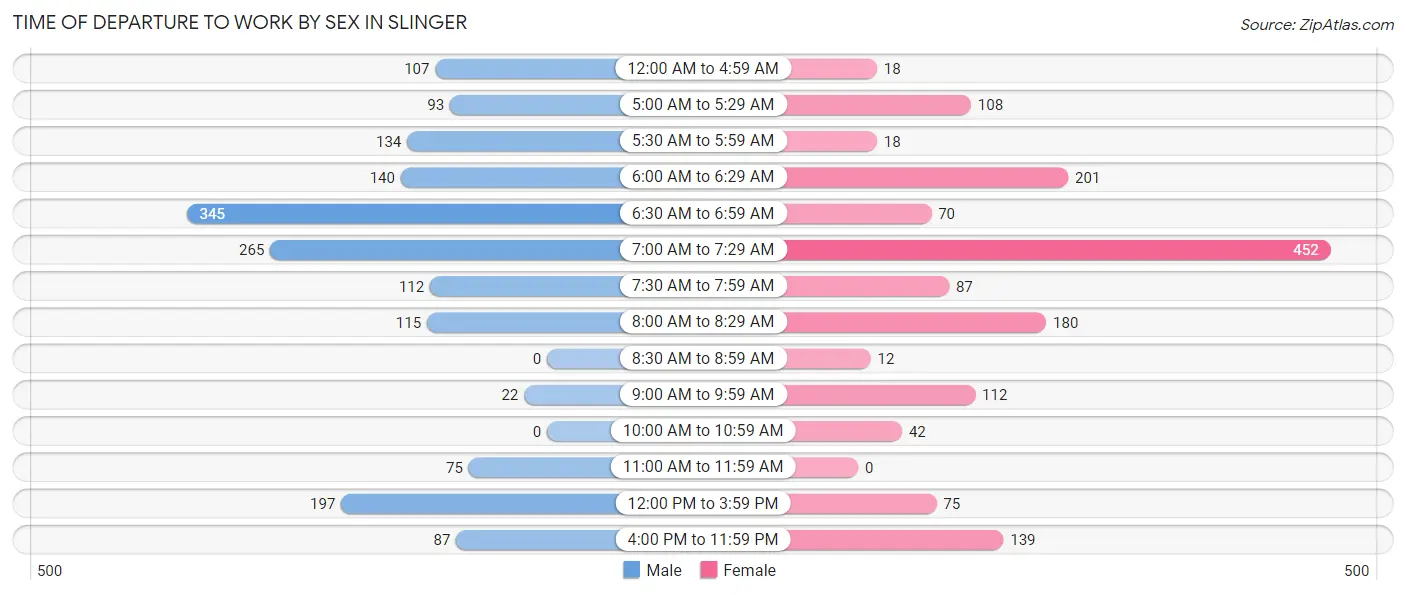
| Time of Departure | Male | Female |
| 12:00 AM to 4:59 AM | 107 (6.3%) | 18 (1.2%) |
| 5:00 AM to 5:29 AM | 93 (5.5%) | 108 (7.1%) |
| 5:30 AM to 5:59 AM | 134 (7.9%) | 18 (1.2%) |
| 6:00 AM to 6:29 AM | 140 (8.3%) | 201 (13.3%) |
| 6:30 AM to 6:59 AM | 345 (20.4%) | 70 (4.6%) |
| 7:00 AM to 7:29 AM | 265 (15.7%) | 452 (29.8%) |
| 7:30 AM to 7:59 AM | 112 (6.6%) | 87 (5.8%) |
| 8:00 AM to 8:29 AM | 115 (6.8%) | 180 (11.9%) |
| 8:30 AM to 8:59 AM | 0 (0.0%) | 12 (0.8%) |
| 9:00 AM to 9:59 AM | 22 (1.3%) | 112 (7.4%) |
| 10:00 AM to 10:59 AM | 0 (0.0%) | 42 (2.8%) |
| 11:00 AM to 11:59 AM | 75 (4.4%) | 0 (0.0%) |
| 12:00 PM to 3:59 PM | 197 (11.6%) | 75 (5.0%) |
| 4:00 PM to 11:59 PM | 87 (5.1%) | 139 (9.2%) |
| Total | 1,692 (100.0%) | 1,514 (100.0%) |
Housing Occupancy in Slinger
Occupancy by Ownership in Slinger
Of the total 2,660 dwellings in Slinger, owner-occupied units account for 1,843 (69.3%), while renter-occupied units make up 817 (30.7%).
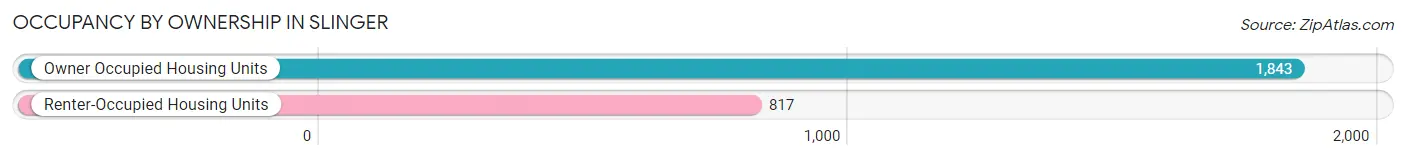
| Occupancy | # Housing Units | % Housing Units |
| Owner Occupied Housing Units | 1,843 | 69.3% |
| Renter-Occupied Housing Units | 817 | 30.7% |
| Total Occupied Housing Units | 2,660 | 100.0% |
Occupancy by Household Size in Slinger
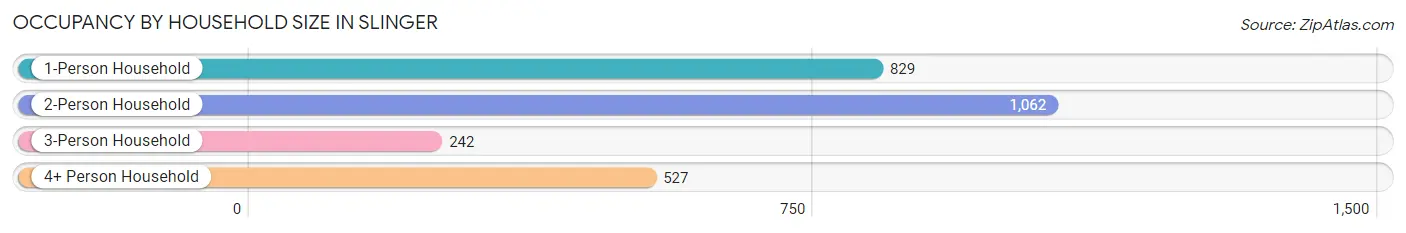
| Household Size | # Housing Units | % Housing Units |
| 1-Person Household | 829 | 31.2% |
| 2-Person Household | 1,062 | 39.9% |
| 3-Person Household | 242 | 9.1% |
| 4+ Person Household | 527 | 19.8% |
| Total Housing Units | 2,660 | 100.0% |
Occupancy by Ownership by Household Size in Slinger
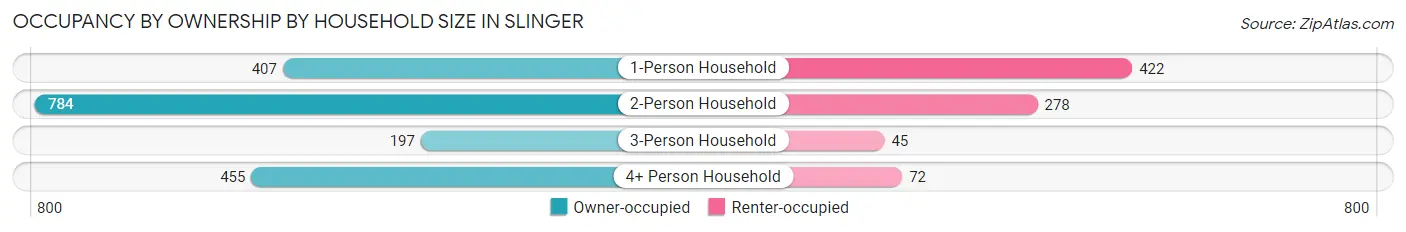
| Household Size | Owner-occupied | Renter-occupied |
| 1-Person Household | 407 (49.1%) | 422 (50.9%) |
| 2-Person Household | 784 (73.8%) | 278 (26.2%) |
| 3-Person Household | 197 (81.4%) | 45 (18.6%) |
| 4+ Person Household | 455 (86.3%) | 72 (13.7%) |
| Total Housing Units | 1,843 (69.3%) | 817 (30.7%) |
Occupancy by Educational Attainment in Slinger
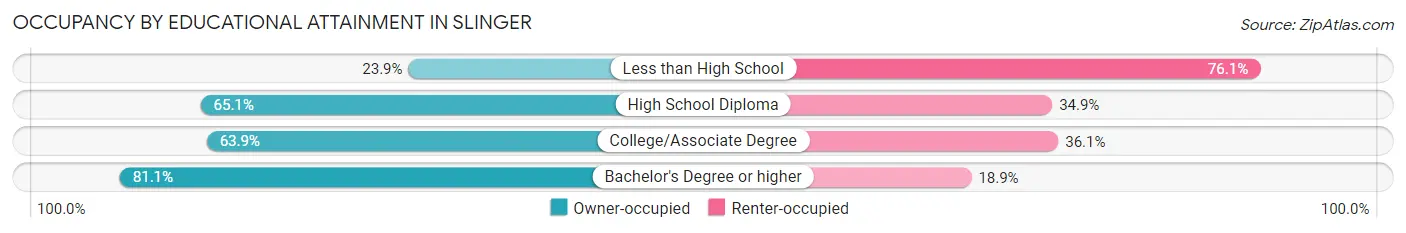
| Household Size | Owner-occupied | Renter-occupied |
| Less than High School | 22 (23.9%) | 70 (76.1%) |
| High School Diploma | 485 (65.1%) | 260 (34.9%) |
| College/Associate Degree | 529 (63.9%) | 299 (36.1%) |
| Bachelor's Degree or higher | 807 (81.1%) | 188 (18.9%) |
Occupancy by Age of Householder in Slinger
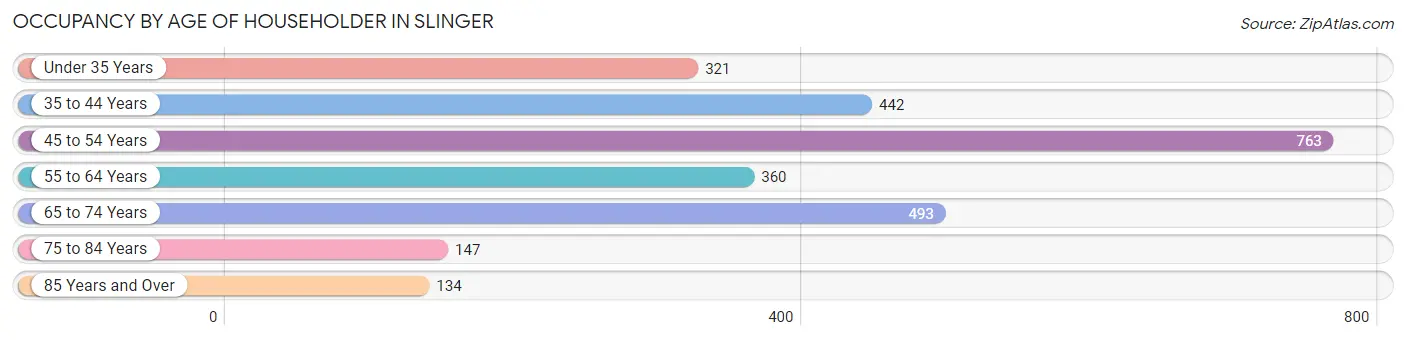
| Age Bracket | # Households | % Households |
| Under 35 Years | 321 | 12.1% |
| 35 to 44 Years | 442 | 16.6% |
| 45 to 54 Years | 763 | 28.7% |
| 55 to 64 Years | 360 | 13.5% |
| 65 to 74 Years | 493 | 18.5% |
| 75 to 84 Years | 147 | 5.5% |
| 85 Years and Over | 134 | 5.0% |
| Total | 2,660 | 100.0% |
Housing Finances in Slinger
Median Income by Occupancy in Slinger
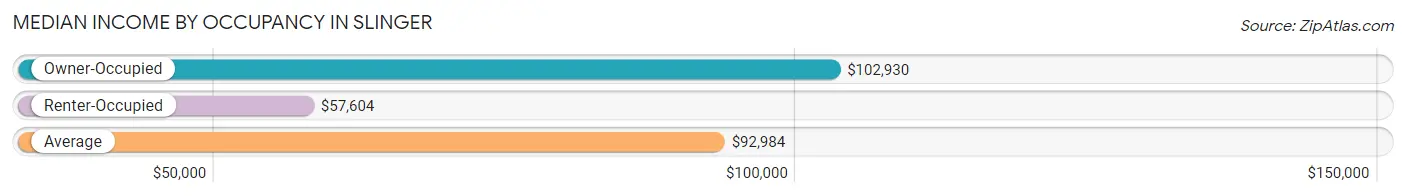
| Occupancy Type | # Households | Median Income |
| Owner-Occupied | 1,843 (69.3%) | $102,930 |
| Renter-Occupied | 817 (30.7%) | $57,604 |
| Average | 2,660 (100.0%) | $92,984 |
Occupancy by Householder Income Bracket in Slinger
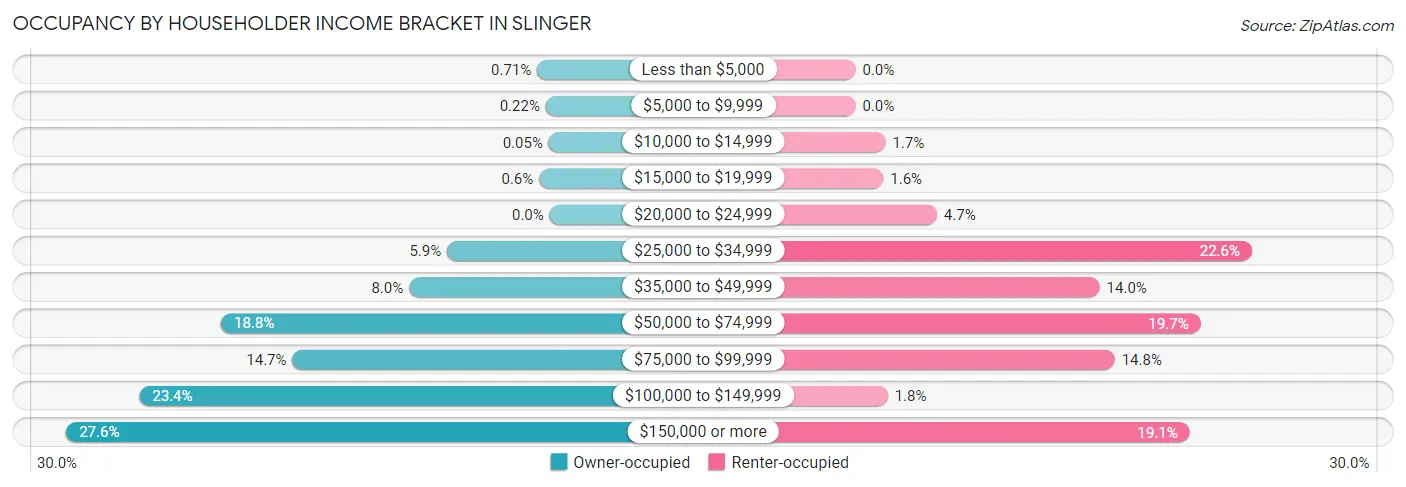
| Income Bracket | Owner-occupied | Renter-occupied |
| Less than $5,000 | 13 (0.7%) | 0 (0.0%) |
| $5,000 to $9,999 | 4 (0.2%) | 0 (0.0%) |
| $10,000 to $14,999 | 1 (0.1%) | 14 (1.7%) |
| $15,000 to $19,999 | 11 (0.6%) | 13 (1.6%) |
| $20,000 to $24,999 | 0 (0.0%) | 38 (4.6%) |
| $25,000 to $34,999 | 108 (5.9%) | 185 (22.6%) |
| $35,000 to $49,999 | 148 (8.0%) | 114 (14.0%) |
| $50,000 to $74,999 | 346 (18.8%) | 161 (19.7%) |
| $75,000 to $99,999 | 271 (14.7%) | 121 (14.8%) |
| $100,000 to $149,999 | 432 (23.4%) | 15 (1.8%) |
| $150,000 or more | 509 (27.6%) | 156 (19.1%) |
| Total | 1,843 (100.0%) | 817 (100.0%) |
Monthly Housing Cost Tiers in Slinger
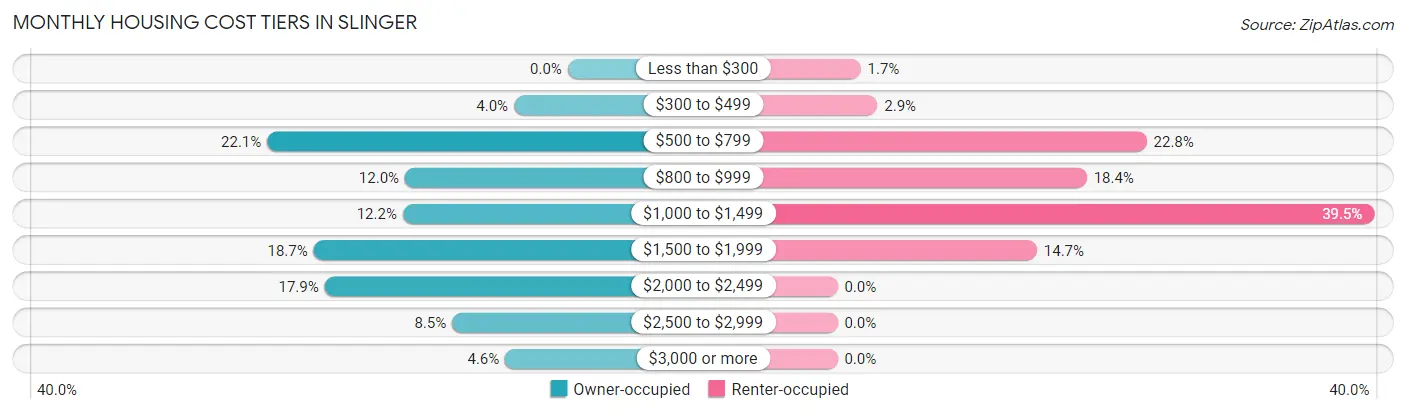
| Monthly Cost | Owner-occupied | Renter-occupied |
| Less than $300 | 0 (0.0%) | 14 (1.7%) |
| $300 to $499 | 73 (4.0%) | 24 (2.9%) |
| $500 to $799 | 408 (22.1%) | 186 (22.8%) |
| $800 to $999 | 221 (12.0%) | 150 (18.4%) |
| $1,000 to $1,499 | 224 (12.1%) | 323 (39.5%) |
| $1,500 to $1,999 | 345 (18.7%) | 120 (14.7%) |
| $2,000 to $2,499 | 330 (17.9%) | 0 (0.0%) |
| $2,500 to $2,999 | 157 (8.5%) | 0 (0.0%) |
| $3,000 or more | 85 (4.6%) | 0 (0.0%) |
| Total | 1,843 (100.0%) | 817 (100.0%) |
Physical Housing Characteristics in Slinger
Housing Structures in Slinger
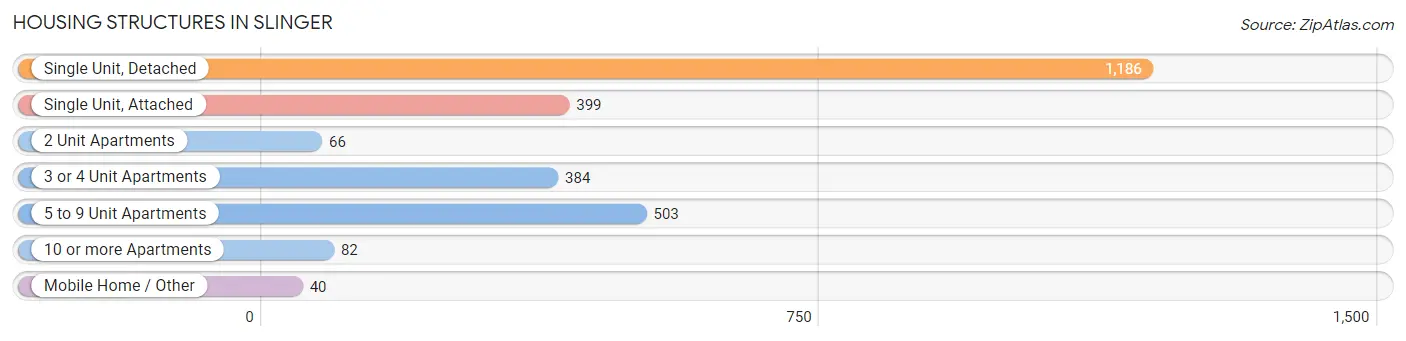
| Structure Type | # Housing Units | % Housing Units |
| Single Unit, Detached | 1,186 | 44.6% |
| Single Unit, Attached | 399 | 15.0% |
| 2 Unit Apartments | 66 | 2.5% |
| 3 or 4 Unit Apartments | 384 | 14.4% |
| 5 to 9 Unit Apartments | 503 | 18.9% |
| 10 or more Apartments | 82 | 3.1% |
| Mobile Home / Other | 40 | 1.5% |
| Total | 2,660 | 100.0% |
Housing Structures by Occupancy in Slinger
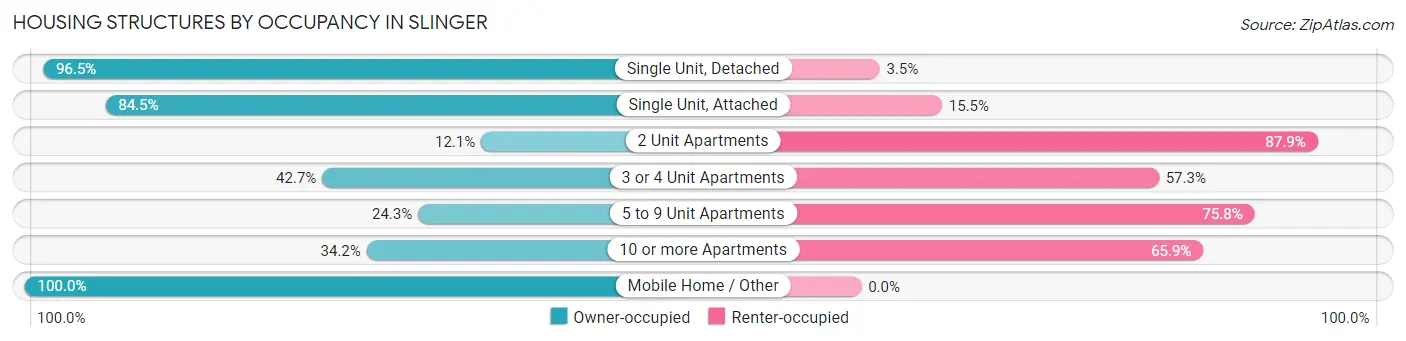
| Structure Type | Owner-occupied | Renter-occupied |
| Single Unit, Detached | 1,144 (96.5%) | 42 (3.5%) |
| Single Unit, Attached | 337 (84.5%) | 62 (15.5%) |
| 2 Unit Apartments | 8 (12.1%) | 58 (87.9%) |
| 3 or 4 Unit Apartments | 164 (42.7%) | 220 (57.3%) |
| 5 to 9 Unit Apartments | 122 (24.2%) | 381 (75.7%) |
| 10 or more Apartments | 28 (34.2%) | 54 (65.8%) |
| Mobile Home / Other | 40 (100.0%) | 0 (0.0%) |
| Total | 1,843 (69.3%) | 817 (30.7%) |
Housing Structures by Number of Rooms in Slinger
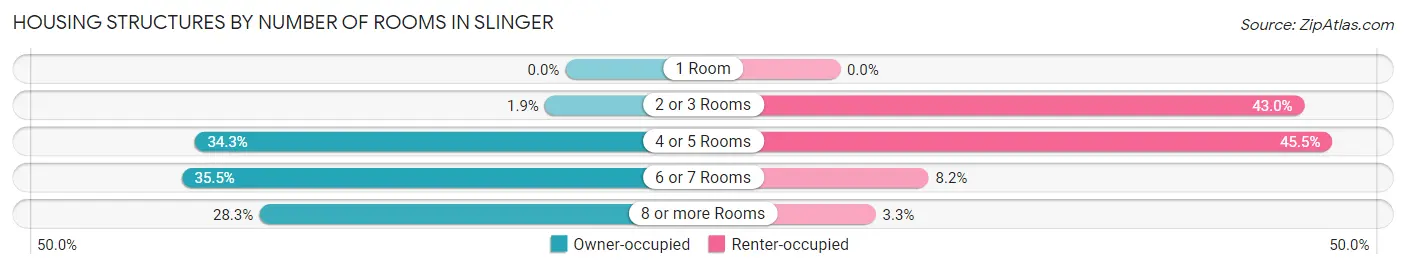
| Number of Rooms | Owner-occupied | Renter-occupied |
| 1 Room | 0 (0.0%) | 0 (0.0%) |
| 2 or 3 Rooms | 35 (1.9%) | 351 (43.0%) |
| 4 or 5 Rooms | 632 (34.3%) | 372 (45.5%) |
| 6 or 7 Rooms | 654 (35.5%) | 67 (8.2%) |
| 8 or more Rooms | 522 (28.3%) | 27 (3.3%) |
| Total | 1,843 (100.0%) | 817 (100.0%) |
Housing Structure by Heating Type in Slinger
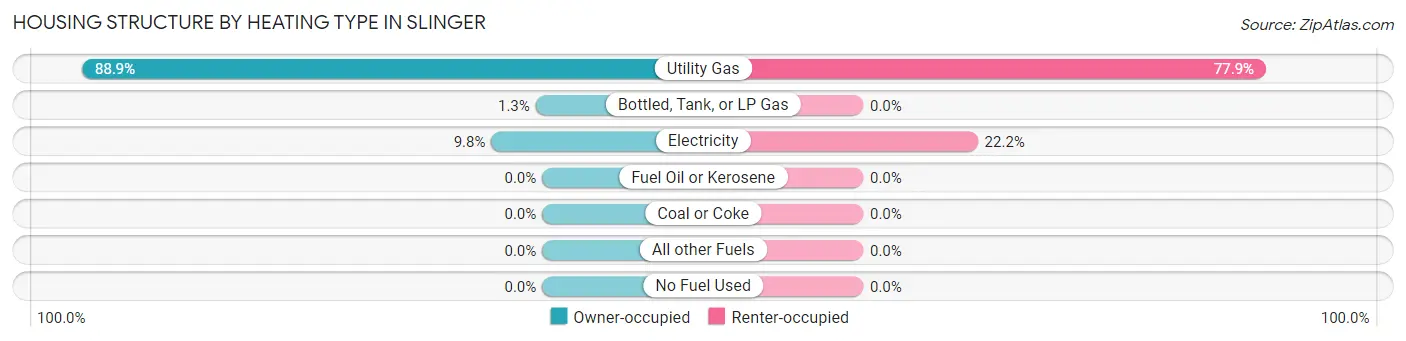
| Heating Type | Owner-occupied | Renter-occupied |
| Utility Gas | 1,639 (88.9%) | 636 (77.8%) |
| Bottled, Tank, or LP Gas | 23 (1.3%) | 0 (0.0%) |
| Electricity | 181 (9.8%) | 181 (22.2%) |
| Fuel Oil or Kerosene | 0 (0.0%) | 0 (0.0%) |
| Coal or Coke | 0 (0.0%) | 0 (0.0%) |
| All other Fuels | 0 (0.0%) | 0 (0.0%) |
| No Fuel Used | 0 (0.0%) | 0 (0.0%) |
| Total | 1,843 (100.0%) | 817 (100.0%) |
Household Vehicle Usage in Slinger
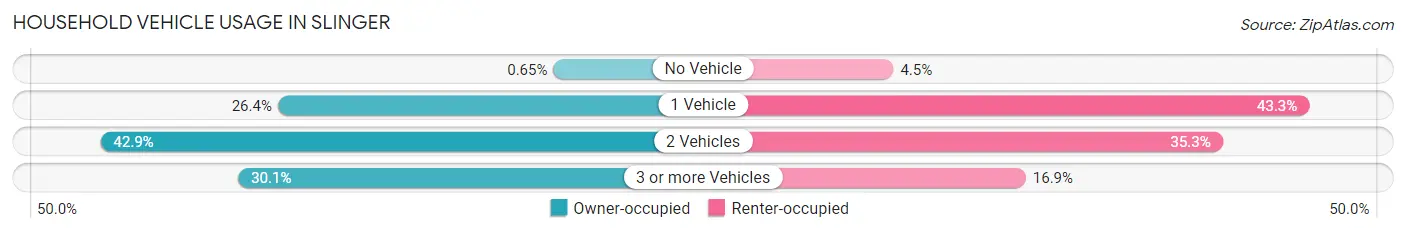
| Vehicles per Household | Owner-occupied | Renter-occupied |
| No Vehicle | 12 (0.6%) | 37 (4.5%) |
| 1 Vehicle | 486 (26.4%) | 354 (43.3%) |
| 2 Vehicles | 791 (42.9%) | 288 (35.2%) |
| 3 or more Vehicles | 554 (30.1%) | 138 (16.9%) |
| Total | 1,843 (100.0%) | 817 (100.0%) |
Real Estate & Mortgages in Slinger
Real Estate and Mortgage Overview in Slinger
| Characteristic | Without Mortgage | With Mortgage |
| Housing Units | 621 | 1,222 |
| Median Property Value | $268,700 | $311,500 |
| Median Household Income | $69,887 | $408 |
| Monthly Housing Costs | $687 | $85 |
| Real Estate Taxes | $4,074 | $38 |
Property Value by Mortgage Status in Slinger
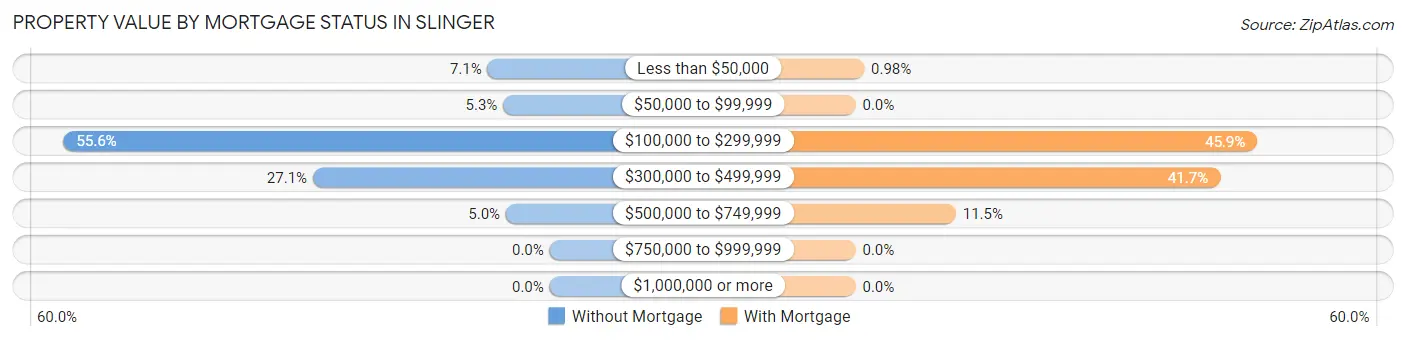
| Property Value | Without Mortgage | With Mortgage |
| Less than $50,000 | 44 (7.1%) | 12 (1.0%) |
| $50,000 to $99,999 | 33 (5.3%) | 0 (0.0%) |
| $100,000 to $299,999 | 345 (55.6%) | 561 (45.9%) |
| $300,000 to $499,999 | 168 (27.1%) | 509 (41.6%) |
| $500,000 to $749,999 | 31 (5.0%) | 140 (11.5%) |
| $750,000 to $999,999 | 0 (0.0%) | 0 (0.0%) |
| $1,000,000 or more | 0 (0.0%) | 0 (0.0%) |
| Total | 621 (100.0%) | 1,222 (100.0%) |
Household Income by Mortgage Status in Slinger
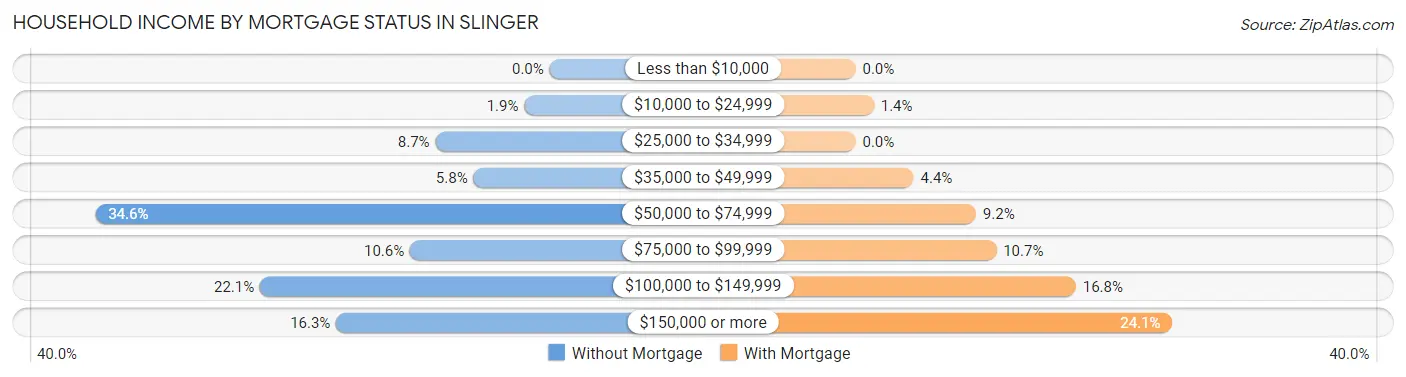
| Household Income | Without Mortgage | With Mortgage |
| Less than $10,000 | 0 (0.0%) | 0 (0.0%) |
| $10,000 to $24,999 | 12 (1.9%) | 17 (1.4%) |
| $25,000 to $34,999 | 54 (8.7%) | 0 (0.0%) |
| $35,000 to $49,999 | 36 (5.8%) | 54 (4.4%) |
| $50,000 to $74,999 | 215 (34.6%) | 112 (9.2%) |
| $75,000 to $99,999 | 66 (10.6%) | 131 (10.7%) |
| $100,000 to $149,999 | 137 (22.1%) | 205 (16.8%) |
| $150,000 or more | 101 (16.3%) | 295 (24.1%) |
| Total | 621 (100.0%) | 1,222 (100.0%) |
Property Value to Household Income Ratio in Slinger
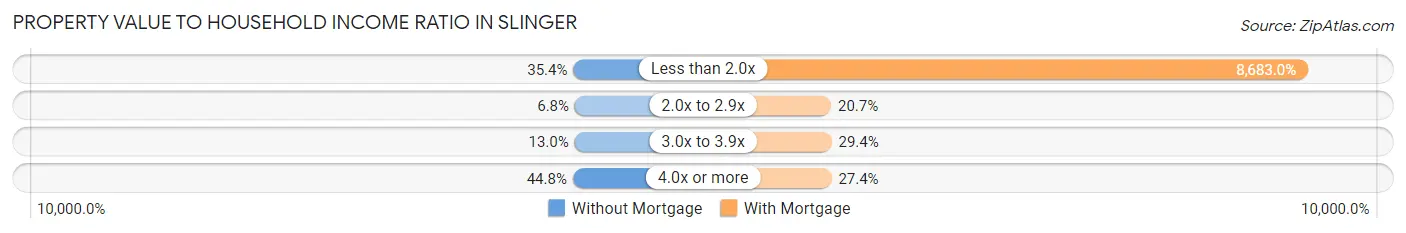
| Value-to-Income Ratio | Without Mortgage | With Mortgage |
| Less than 2.0x | 220 (35.4%) | 106,106 (8,683.0%) |
| 2.0x to 2.9x | 42 (6.8%) | 253 (20.7%) |
| 3.0x to 3.9x | 81 (13.0%) | 359 (29.4%) |
| 4.0x or more | 278 (44.8%) | 335 (27.4%) |
| Total | 621 (100.0%) | 1,222 (100.0%) |
Real Estate Taxes by Mortgage Status in Slinger
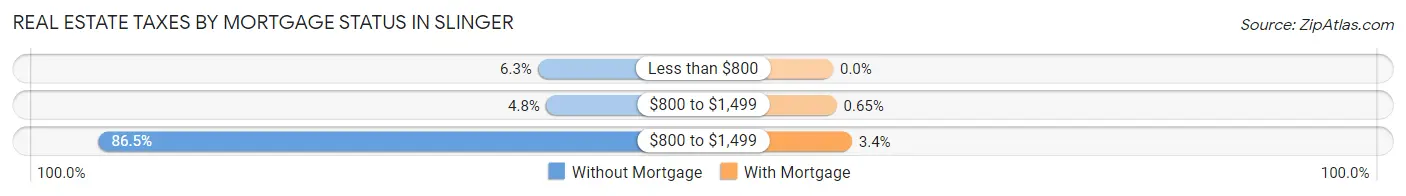
| Property Taxes | Without Mortgage | With Mortgage |
| Less than $800 | 39 (6.3%) | 0 (0.0%) |
| $800 to $1,499 | 30 (4.8%) | 8 (0.6%) |
| $800 to $1,499 | 537 (86.5%) | 42 (3.4%) |
| Total | 621 (100.0%) | 1,222 (100.0%) |
Health & Disability in Slinger
Health Insurance Coverage by Age in Slinger
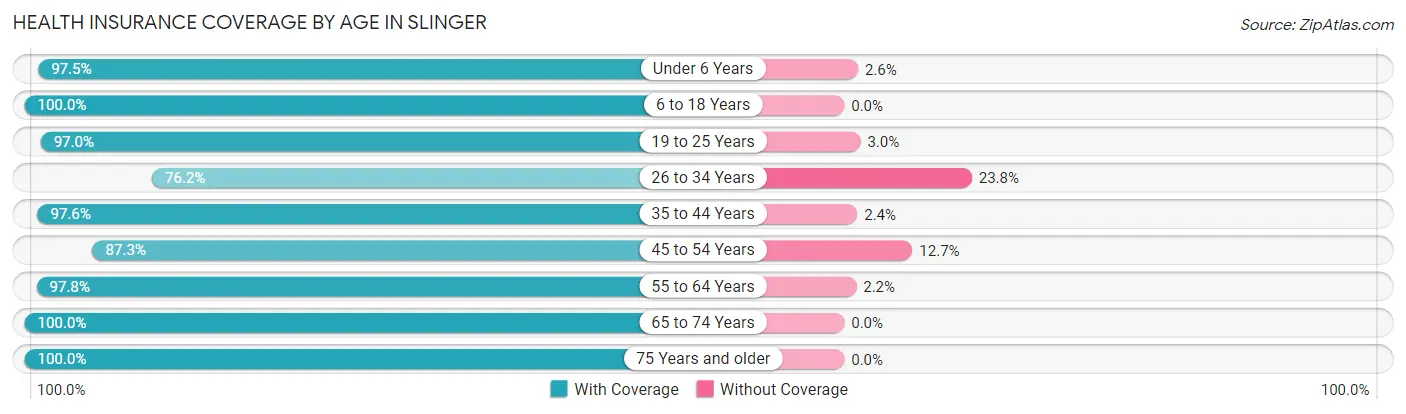
| Age Bracket | With Coverage | Without Coverage |
| Under 6 Years | 306 (97.5%) | 8 (2.5%) |
| 6 to 18 Years | 1,289 (100.0%) | 0 (0.0%) |
| 19 to 25 Years | 515 (97.0%) | 16 (3.0%) |
| 26 to 34 Years | 234 (76.2%) | 73 (23.8%) |
| 35 to 44 Years | 806 (97.6%) | 20 (2.4%) |
| 45 to 54 Years | 935 (87.3%) | 136 (12.7%) |
| 55 to 64 Years | 657 (97.8%) | 15 (2.2%) |
| 65 to 74 Years | 656 (100.0%) | 0 (0.0%) |
| 75 Years and older | 389 (100.0%) | 0 (0.0%) |
| Total | 5,787 (95.6%) | 268 (4.4%) |
Health Insurance Coverage by Citizenship Status in Slinger
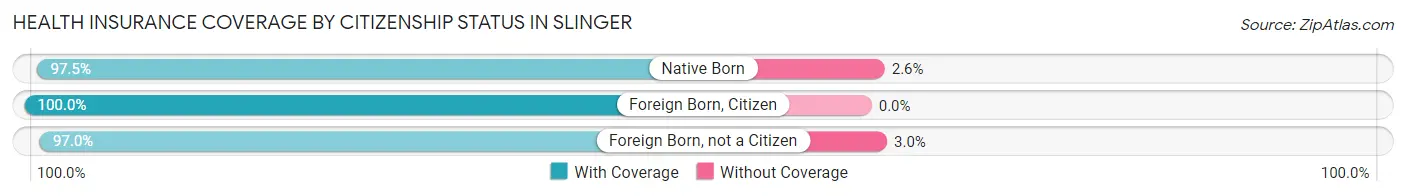
| Citizenship Status | With Coverage | Without Coverage |
| Native Born | 306 (97.5%) | 8 (2.5%) |
| Foreign Born, Citizen | 1,289 (100.0%) | 0 (0.0%) |
| Foreign Born, not a Citizen | 515 (97.0%) | 16 (3.0%) |
Health Insurance Coverage by Household Income in Slinger
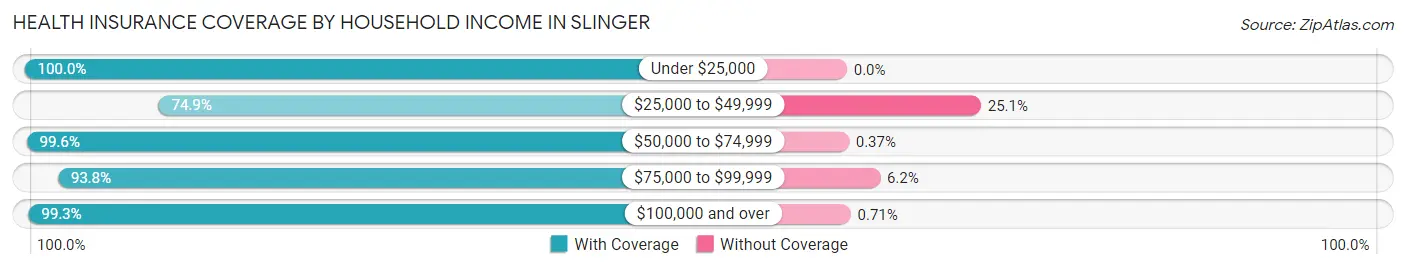
| Household Income | With Coverage | Without Coverage |
| Under $25,000 | 132 (100.0%) | 0 (0.0%) |
| $25,000 to $49,999 | 585 (74.9%) | 196 (25.1%) |
| $50,000 to $74,999 | 1,069 (99.6%) | 4 (0.4%) |
| $75,000 to $99,999 | 663 (93.8%) | 44 (6.2%) |
| $100,000 and over | 3,338 (99.3%) | 24 (0.7%) |
Public vs Private Health Insurance Coverage by Age in Slinger
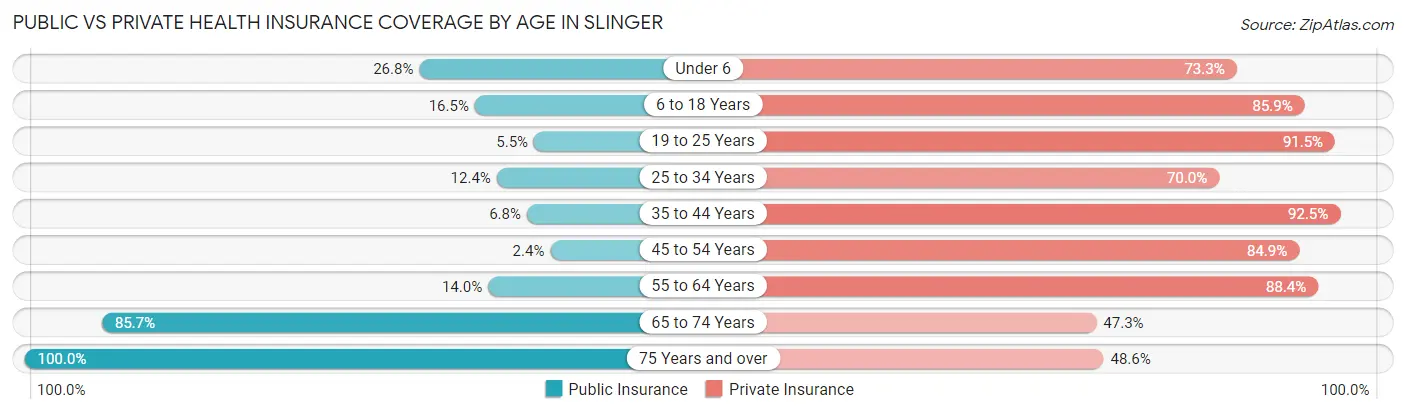
| Age Bracket | Public Insurance | Private Insurance |
| Under 6 | 84 (26.8%) | 230 (73.3%) |
| 6 to 18 Years | 212 (16.5%) | 1,107 (85.9%) |
| 19 to 25 Years | 29 (5.5%) | 486 (91.5%) |
| 25 to 34 Years | 38 (12.4%) | 215 (70.0%) |
| 35 to 44 Years | 56 (6.8%) | 764 (92.5%) |
| 45 to 54 Years | 26 (2.4%) | 909 (84.9%) |
| 55 to 64 Years | 94 (14.0%) | 594 (88.4%) |
| 65 to 74 Years | 562 (85.7%) | 310 (47.3%) |
| 75 Years and over | 389 (100.0%) | 189 (48.6%) |
| Total | 1,490 (24.6%) | 4,804 (79.3%) |
Disability Status by Sex by Age in Slinger
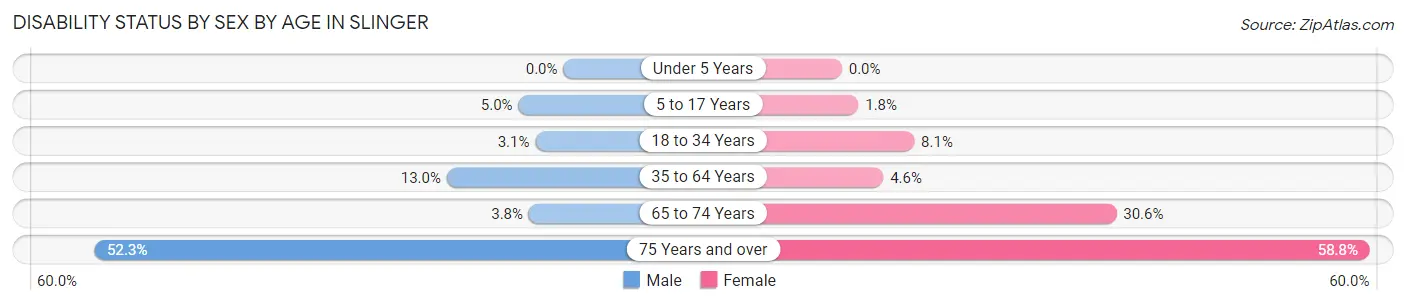
| Age Bracket | Male | Female |
| Under 5 Years | 0 (0.0%) | 0 (0.0%) |
| 5 to 17 Years | 31 (5.0%) | 10 (1.8%) |
| 18 to 34 Years | 19 (3.1%) | 37 (8.1%) |
| 35 to 64 Years | 159 (13.0%) | 62 (4.6%) |
| 65 to 74 Years | 15 (3.8%) | 81 (30.6%) |
| 75 Years and over | 46 (52.3%) | 177 (58.8%) |
Disability Class by Sex by Age in Slinger
Disability Class: Hearing Difficulty
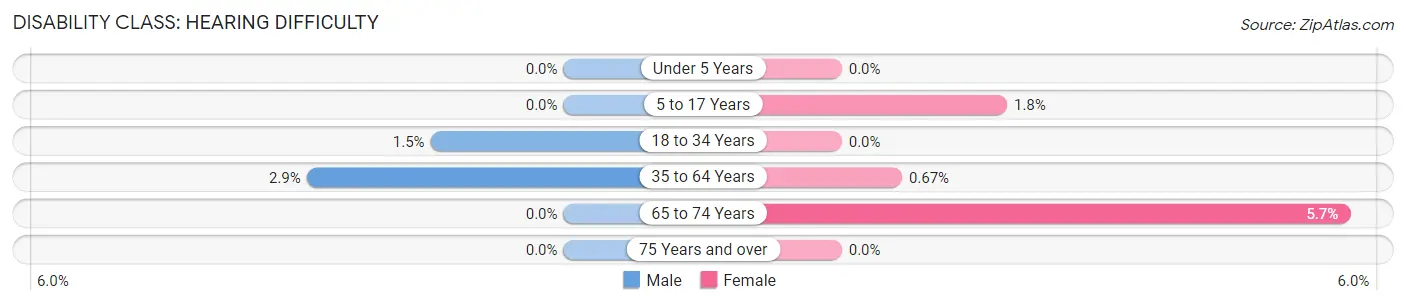
| Age Bracket | Male | Female |
| Under 5 Years | 0 (0.0%) | 0 (0.0%) |
| 5 to 17 Years | 0 (0.0%) | 10 (1.8%) |
| 18 to 34 Years | 9 (1.5%) | 0 (0.0%) |
| 35 to 64 Years | 35 (2.9%) | 9 (0.7%) |
| 65 to 74 Years | 0 (0.0%) | 15 (5.7%) |
| 75 Years and over | 0 (0.0%) | 0 (0.0%) |
Disability Class: Vision Difficulty
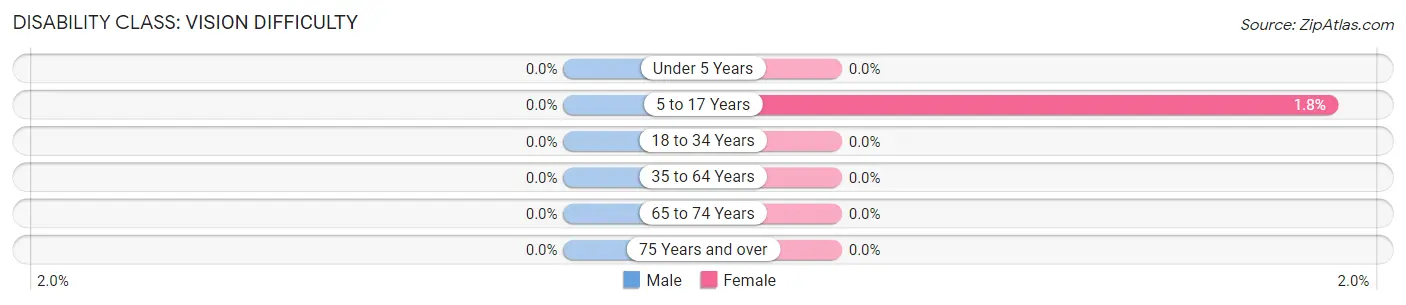
| Age Bracket | Male | Female |
| Under 5 Years | 0 (0.0%) | 0 (0.0%) |
| 5 to 17 Years | 0 (0.0%) | 10 (1.8%) |
| 18 to 34 Years | 0 (0.0%) | 0 (0.0%) |
| 35 to 64 Years | 0 (0.0%) | 0 (0.0%) |
| 65 to 74 Years | 0 (0.0%) | 0 (0.0%) |
| 75 Years and over | 0 (0.0%) | 0 (0.0%) |
Disability Class: Cognitive Difficulty
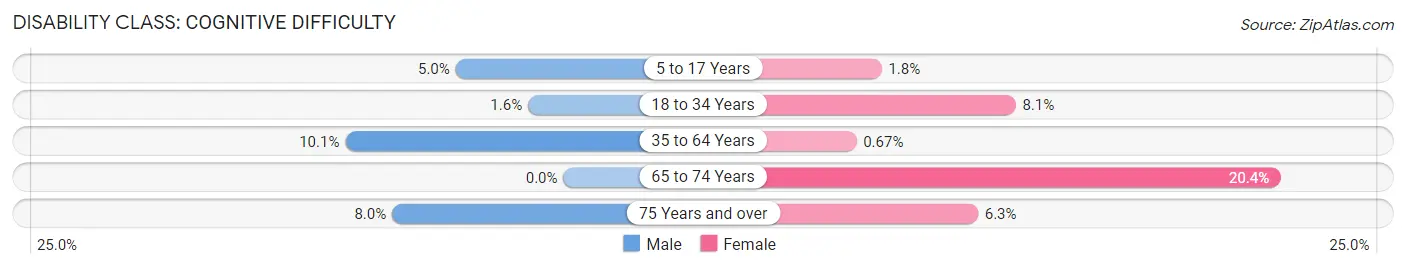
| Age Bracket | Male | Female |
| 5 to 17 Years | 31 (5.0%) | 10 (1.8%) |
| 18 to 34 Years | 10 (1.6%) | 37 (8.1%) |
| 35 to 64 Years | 124 (10.1%) | 9 (0.7%) |
| 65 to 74 Years | 0 (0.0%) | 54 (20.4%) |
| 75 Years and over | 7 (8.0%) | 19 (6.3%) |
Disability Class: Ambulatory Difficulty
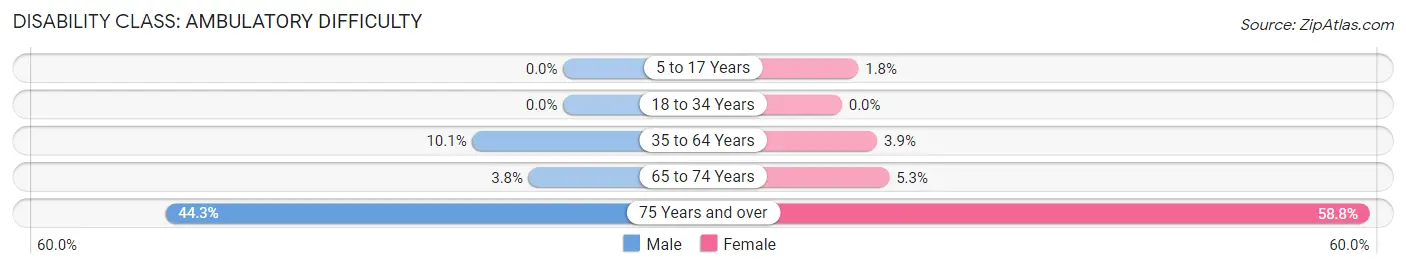
| Age Bracket | Male | Female |
| 5 to 17 Years | 0 (0.0%) | 10 (1.8%) |
| 18 to 34 Years | 0 (0.0%) | 0 (0.0%) |
| 35 to 64 Years | 124 (10.1%) | 53 (3.9%) |
| 65 to 74 Years | 15 (3.8%) | 14 (5.3%) |
| 75 Years and over | 39 (44.3%) | 177 (58.8%) |
Disability Class: Self-Care Difficulty
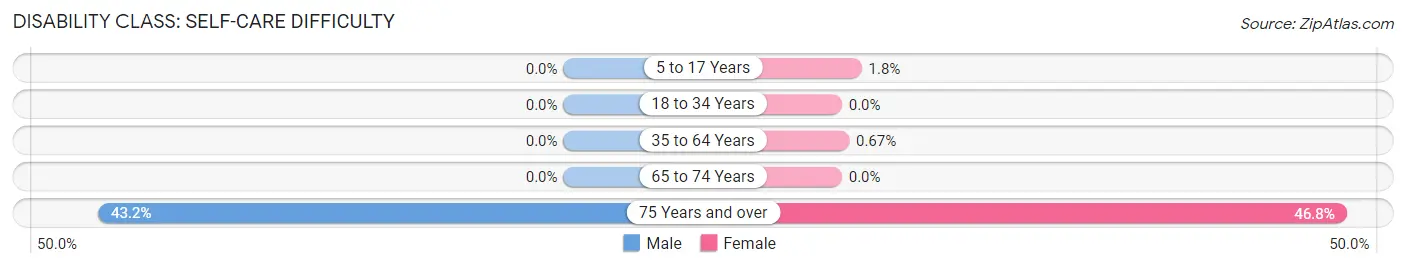
| Age Bracket | Male | Female |
| 5 to 17 Years | 0 (0.0%) | 10 (1.8%) |
| 18 to 34 Years | 0 (0.0%) | 0 (0.0%) |
| 35 to 64 Years | 0 (0.0%) | 9 (0.7%) |
| 65 to 74 Years | 0 (0.0%) | 0 (0.0%) |
| 75 Years and over | 38 (43.2%) | 141 (46.8%) |
Technology Access in Slinger
Computing Device Access in Slinger
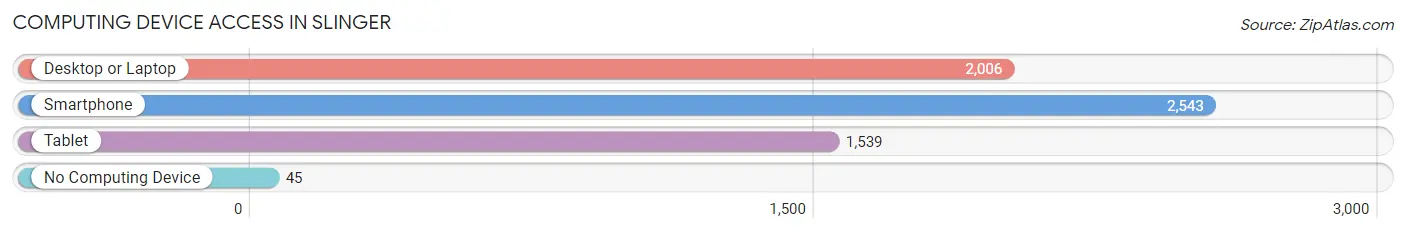
| Device Type | # Households | % Households |
| Desktop or Laptop | 2,006 | 75.4% |
| Smartphone | 2,543 | 95.6% |
| Tablet | 1,539 | 57.9% |
| No Computing Device | 45 | 1.7% |
| Total | 2,660 | 100.0% |
Internet Access in Slinger
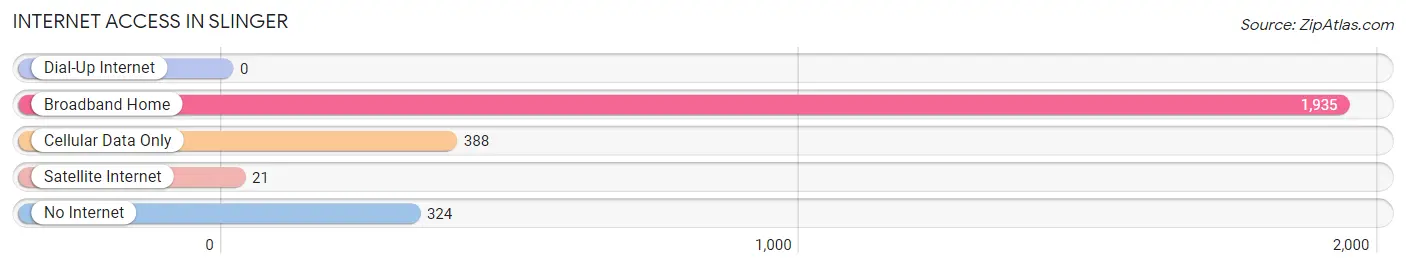
| Internet Type | # Households | % Households |
| Dial-Up Internet | 0 | 0.0% |
| Broadband Home | 1,935 | 72.7% |
| Cellular Data Only | 388 | 14.6% |
| Satellite Internet | 21 | 0.8% |
| No Internet | 324 | 12.2% |
| Total | 2,660 | 100.0% |
Slinger Summary
Slinger, Wisconsin is a small village located in Washington County, Wisconsin. It is situated about 25 miles northwest of Milwaukee and is part of the Milwaukee metropolitan area. The village has a population of 5,719 as of the 2010 census.
History
Slinger was first settled in 1845 by German immigrants. The village was originally known as “Slinger’s Station” and was named after the Slinger family who owned the land. The village was officially incorporated in 1891.
In the early 1900s, Slinger was a thriving agricultural community. The village was home to several dairy farms, as well as a number of small businesses. The village also had a train station, which was used to transport goods and passengers to and from Milwaukee.
In the 1950s, Slinger began to experience a population boom as people moved to the area from Milwaukee and other parts of Wisconsin. This growth was largely due to the construction of Interstate 41, which made it easier for people to commute to and from Milwaukee.
Geography
Slinger is located in southeastern Wisconsin, about 25 miles northwest of Milwaukee. The village is situated in the Kettle Moraine State Forest, which is a popular destination for outdoor recreation. The village is also located near the Slinger River, which is a tributary of the Milwaukee River.
The village has a total area of 2.3 square miles, all of which is land. The terrain is mostly flat, with some rolling hills. The village is located at an elevation of 890 feet above sea level.
Economy
Slinger’s economy is largely based on agriculture and tourism. The village is home to several dairy farms, as well as a number of small businesses. The village also has a number of restaurants, bars, and other retail establishments.
The village is also home to a number of manufacturing companies, including Slinger Manufacturing, which produces industrial equipment. The village is also home to a number of technology companies, including Slinger Technologies, which produces software and hardware for the medical industry.
Demographics
As of the 2010 census, Slinger had a population of 5,719. The racial makeup of the village was 95.3% White, 0.7% African American, 0.3% Native American, 1.2% Asian, 0.1% Pacific Islander, 1.2% from other races, and 1.4% from two or more races. Hispanic or Latino of any race were 3.2% of the population.
The median income for a household in the village was $54,917, and the median income for a family was $63,917. The per capita income for the village was $25,917. About 4.2% of families and 5.3% of the population were below the poverty line, including 6.2% of those under age 18 and 4.2% of those age 65 or over.
Slinger is a small village with a rich history and a vibrant economy. The village is home to a number of small businesses, as well as a number of manufacturing and technology companies. The village is also home to a diverse population, with a variety of racial and ethnic backgrounds.
Common Questions
What is Per Capita Income in Slinger?
Per Capita income in Slinger is $49,013.
What is the Median Family Income in Slinger?
Median Family Income in Slinger is $105,503.
What is the Median Household income in Slinger?
Median Household Income in Slinger is $92,984.
What is Income or Wage Gap in Slinger?
Income or Wage Gap in Slinger is 35.5%.
Women in Slinger earn 64.5 cents for every dollar earned by a man.
What is Inequality or Gini Index in Slinger?
Inequality or Gini Index in Slinger is 0.39.
What is the Total Population of Slinger?
Total Population of Slinger is 6,055.
What is the Total Male Population of Slinger?
Total Male Population of Slinger is 3,041.
What is the Total Female Population of Slinger?
Total Female Population of Slinger is 3,014.
What is the Ratio of Males per 100 Females in Slinger?
There are 100.90 Males per 100 Females in Slinger.
What is the Ratio of Females per 100 Males in Slinger?
There are 99.11 Females per 100 Males in Slinger.
What is the Median Population Age in Slinger?
Median Population Age in Slinger is 43.5 Years.
What is the Average Family Size in Slinger
Average Family Size in Slinger is 2.9 People.
What is the Average Household Size in Slinger
Average Household Size in Slinger is 2.3 People.
How Large is the Labor Force in Slinger?
There are 3,645 People in the Labor Forcein in Slinger.
What is the Percentage of People in the Labor Force in Slinger?
74.9% of People are in the Labor Force in Slinger.
What is the Unemployment Rate in Slinger?
Unemployment Rate in Slinger is 5.4%.