Arcadia, WI Map & Demographics
Arcadia Map
Arcadia Overview
$27,603
PER CAPITA INCOME
$76,250
AVG FAMILY INCOME
$62,008
AVG HOUSEHOLD INCOME
7.5%
WAGE / INCOME GAP [ % ]
92.5¢/ $1
WAGE / INCOME GAP [ $ ]
0.41
INEQUALITY / GINI INDEX
3,669
TOTAL POPULATION
2,092
MALE POPULATION
1,577
FEMALE POPULATION
132.66
MALES / 100 FEMALES
75.38
FEMALES / 100 MALES
29.2
MEDIAN AGE
4.2
AVG FAMILY SIZE
2.8
AVG HOUSEHOLD SIZE
1,618
LABOR FORCE [ PEOPLE ]
69.4%
PERCENT IN LABOR FORCE
4.4%
UNEMPLOYMENT RATE
Arcadia Zip Codes
Arcadia Area Codes
Income in Arcadia
Income Overview in Arcadia
Per Capita Income in Arcadia is $27,603, while median incomes of families and households are $76,250 and $62,008 respectively.
| Characteristic | Number | Measure |
| Per Capita Income | 3,669 | $27,603 |
| Median Family Income | 695 | $76,250 |
| Mean Family Income | 695 | $91,887 |
| Median Household Income | 1,301 | $62,008 |
| Mean Household Income | 1,301 | $79,526 |
| Income Deficit | 695 | $0 |
| Wage / Income Gap (%) | 3,669 | 7.48% |
| Wage / Income Gap ($) | 3,669 | 92.52¢ per $1 |
| Gini / Inequality Index | 3,669 | 0.41 |
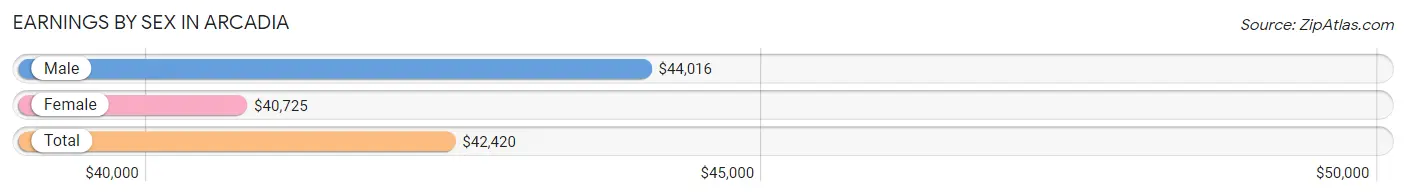
Earnings by Sex in Arcadia
Average Earnings in Arcadia are $42,420, $44,016 for men and $40,725 for women, a difference of 7.5%.
| Sex | Number | Average Earnings |
| Male | 1,101 (65.6%) | $44,016 |
| Female | 577 (34.4%) | $40,725 |
| Total | 1,678 (100.0%) | $42,420 |
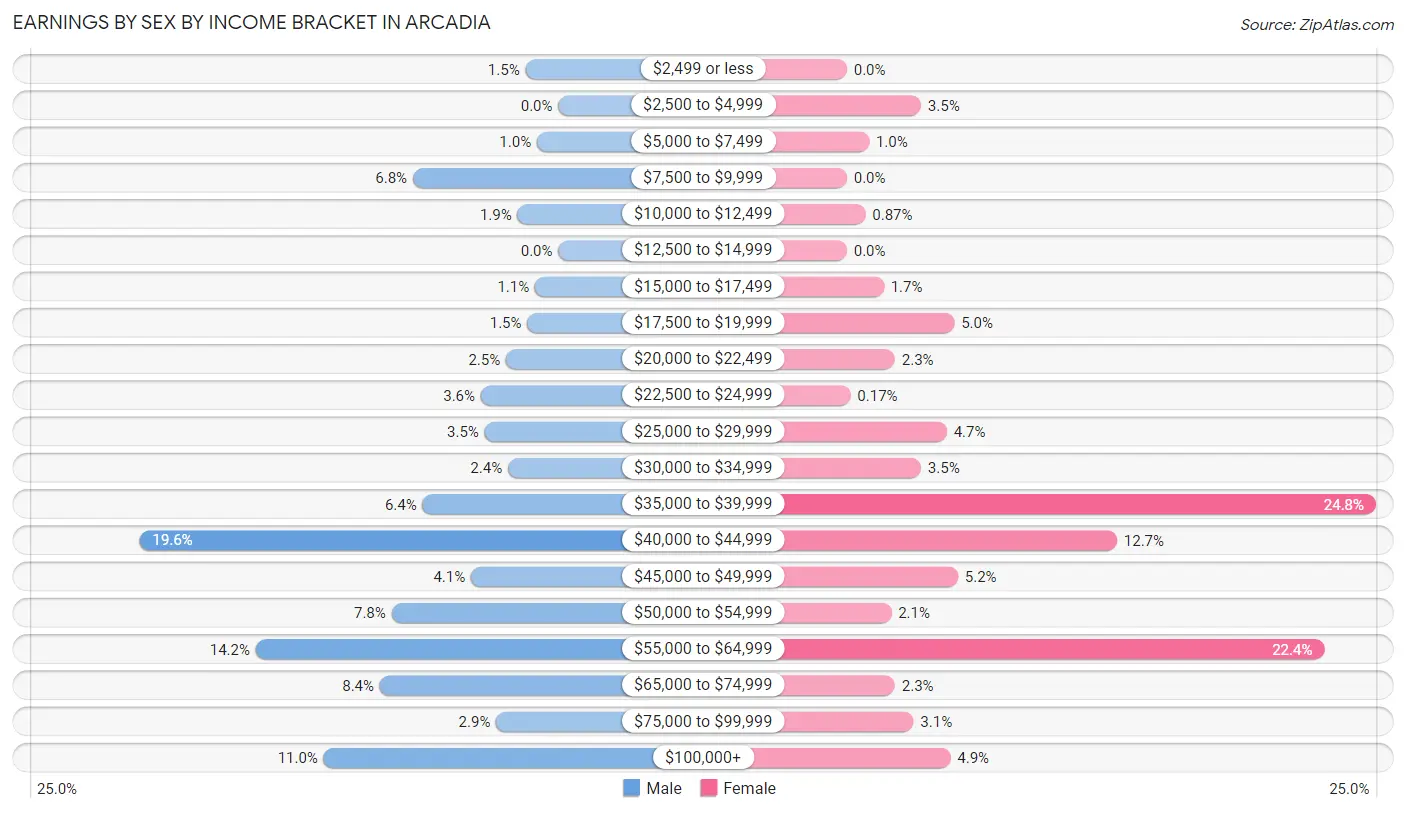
Earnings by Sex by Income Bracket in Arcadia
The most common earnings brackets in Arcadia are $40,000 to $44,999 for men (216 | 19.6%) and $35,000 to $39,999 for women (143 | 24.8%).
| Income | Male | Female |
| $2,499 or less | 17 (1.5%) | 0 (0.0%) |
| $2,500 to $4,999 | 0 (0.0%) | 20 (3.5%) |
| $5,000 to $7,499 | 11 (1.0%) | 6 (1.0%) |
| $7,500 to $9,999 | 75 (6.8%) | 0 (0.0%) |
| $10,000 to $12,499 | 21 (1.9%) | 5 (0.9%) |
| $12,500 to $14,999 | 0 (0.0%) | 0 (0.0%) |
| $15,000 to $17,499 | 12 (1.1%) | 10 (1.7%) |
| $17,500 to $19,999 | 16 (1.5%) | 29 (5.0%) |
| $20,000 to $22,499 | 27 (2.5%) | 13 (2.2%) |
| $22,500 to $24,999 | 40 (3.6%) | 1 (0.2%) |
| $25,000 to $29,999 | 38 (3.5%) | 27 (4.7%) |
| $30,000 to $34,999 | 26 (2.4%) | 20 (3.5%) |
| $35,000 to $39,999 | 70 (6.4%) | 143 (24.8%) |
| $40,000 to $44,999 | 216 (19.6%) | 73 (12.7%) |
| $45,000 to $49,999 | 45 (4.1%) | 30 (5.2%) |
| $50,000 to $54,999 | 86 (7.8%) | 12 (2.1%) |
| $55,000 to $64,999 | 156 (14.2%) | 129 (22.4%) |
| $65,000 to $74,999 | 92 (8.4%) | 13 (2.2%) |
| $75,000 to $99,999 | 32 (2.9%) | 18 (3.1%) |
| $100,000+ | 121 (11.0%) | 28 (4.9%) |
| Total | 1,101 (100.0%) | 577 (100.0%) |
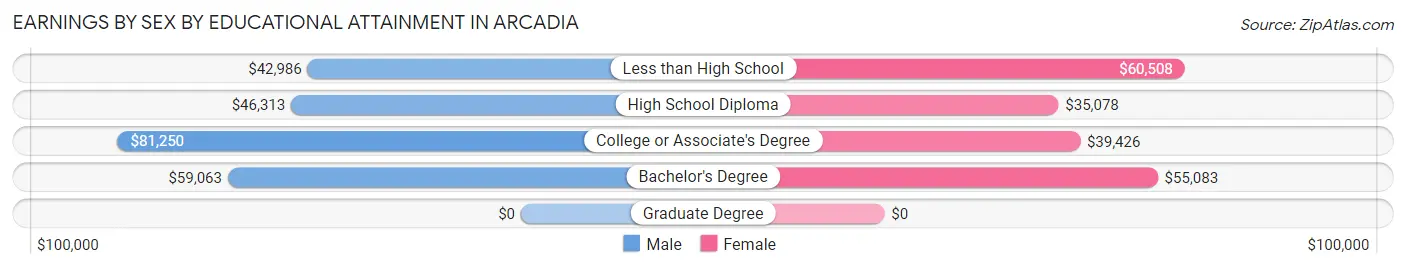
Earnings by Sex by Educational Attainment in Arcadia
Average earnings in Arcadia are $50,542 for men and $41,600 for women, a difference of 17.7%. Men with an educational attainment of college or associate's degree enjoy the highest average annual earnings of $81,250, while those with less than high school education earn the least with $42,986. Women with an educational attainment of less than high school earn the most with the average annual earnings of $60,508, while those with high school diploma education have the smallest earnings of $35,078.
| Educational Attainment | Male Income | Female Income |
| Less than High School | $42,986 | $60,508 |
| High School Diploma | $46,313 | $35,078 |
| College or Associate's Degree | $81,250 | $39,426 |
| Bachelor's Degree | $59,063 | $55,083 |
| Graduate Degree | - | - |
| Total | $50,542 | $41,600 |
Family Income in Arcadia
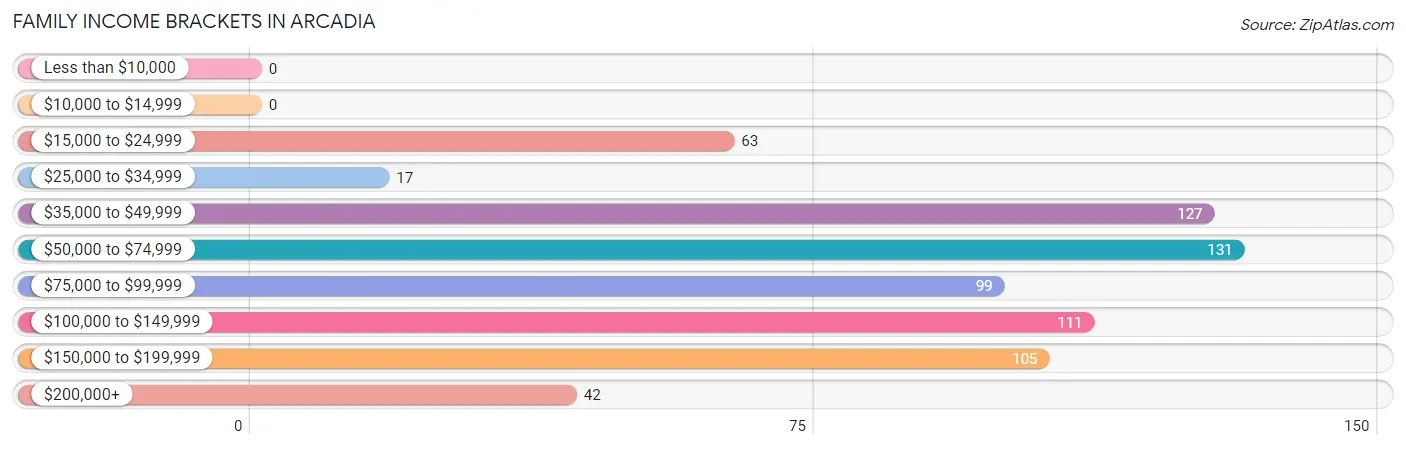
Family Income Brackets in Arcadia
According to the Arcadia family income data, there are 131 families falling into the $50,000 to $74,999 income range, which is the most common income bracket and makes up 18.9% of all families.
| Income Bracket | # Families | % Families |
| Less than $10,000 | 0 | 0.0% |
| $10,000 to $14,999 | 0 | 0.0% |
| $15,000 to $24,999 | 63 | 9.1% |
| $25,000 to $34,999 | 17 | 2.4% |
| $35,000 to $49,999 | 127 | 18.3% |
| $50,000 to $74,999 | 131 | 18.8% |
| $75,000 to $99,999 | 99 | 14.2% |
| $100,000 to $149,999 | 111 | 16.0% |
| $150,000 to $199,999 | 105 | 15.1% |
| $200,000+ | 42 | 6.0% |
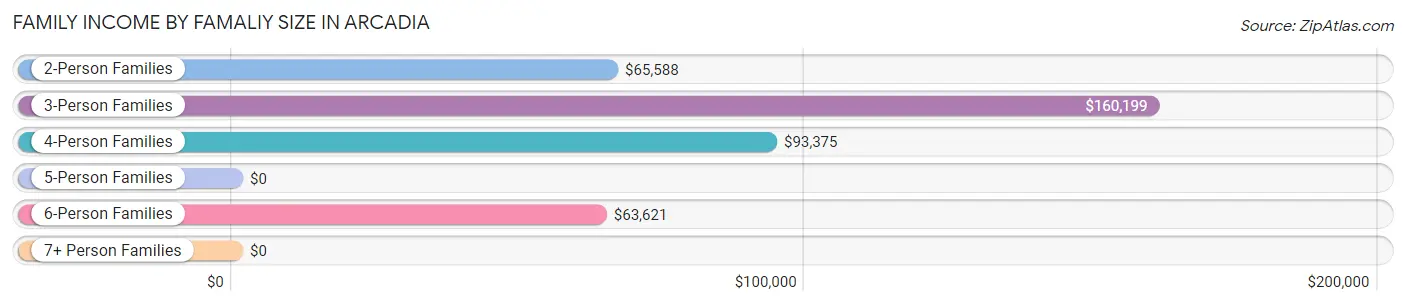
Family Income by Famaliy Size in Arcadia
3-person families (127 | 18.3%) account for the highest median family income in Arcadia with $160,199 per family, while 3-person families (127 | 18.3%) have the highest median income of $53,400 per family member.
| Income Bracket | # Families | Median Income |
| 2-Person Families | 240 (34.5%) | $65,588 |
| 3-Person Families | 127 (18.3%) | $160,199 |
| 4-Person Families | 149 (21.4%) | $93,375 |
| 5-Person Families | 111 (16.0%) | $0 |
| 6-Person Families | 56 (8.1%) | $63,621 |
| 7+ Person Families | 12 (1.7%) | $0 |
| Total | 695 (100.0%) | $76,250 |
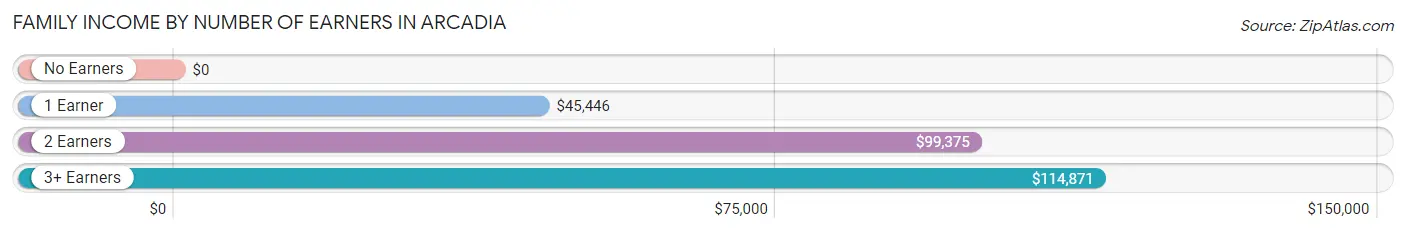
Family Income by Number of Earners in Arcadia
| Number of Earners | # Families | Median Income |
| No Earners | 36 (5.2%) | $0 |
| 1 Earner | 309 (44.5%) | $45,446 |
| 2 Earners | 237 (34.1%) | $99,375 |
| 3+ Earners | 113 (16.3%) | $114,871 |
| Total | 695 (100.0%) | $76,250 |
Household Income in Arcadia
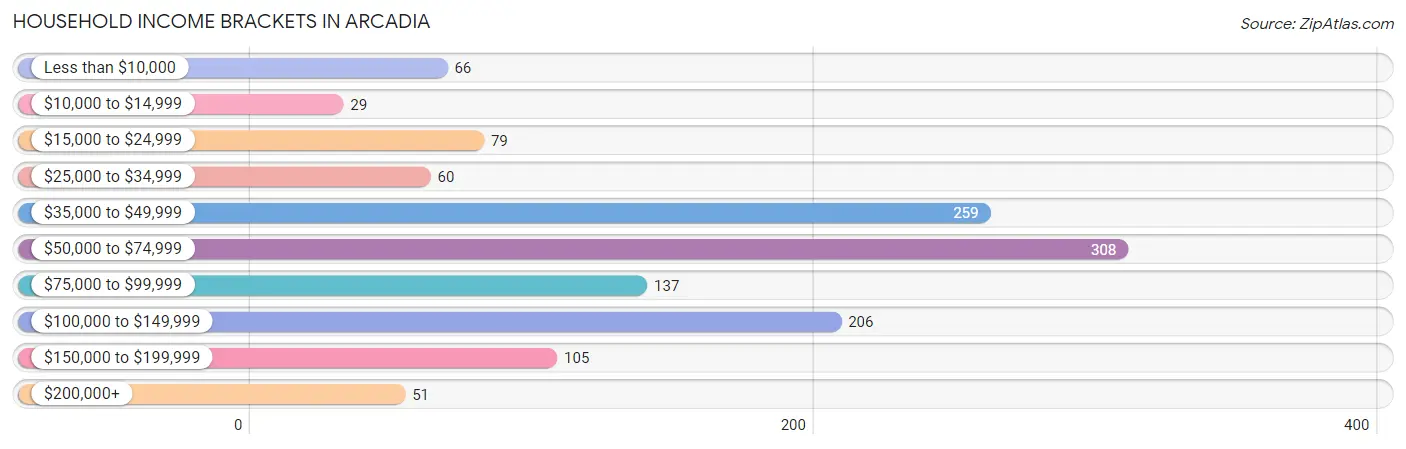
Household Income Brackets in Arcadia
With 308 households falling in the category, the $50,000 to $74,999 income range is the most frequent in Arcadia, accounting for 23.7% of all households. In contrast, only 29 households (2.2%) fall into the $10,000 to $14,999 income bracket, making it the least populous group.
| Income Bracket | # Households | % Households |
| Less than $10,000 | 66 | 5.1% |
| $10,000 to $14,999 | 29 | 2.2% |
| $15,000 to $24,999 | 79 | 6.1% |
| $25,000 to $34,999 | 60 | 4.6% |
| $35,000 to $49,999 | 259 | 19.9% |
| $50,000 to $74,999 | 308 | 23.7% |
| $75,000 to $99,999 | 137 | 10.5% |
| $100,000 to $149,999 | 206 | 15.8% |
| $150,000 to $199,999 | 105 | 8.1% |
| $200,000+ | 51 | 3.9% |
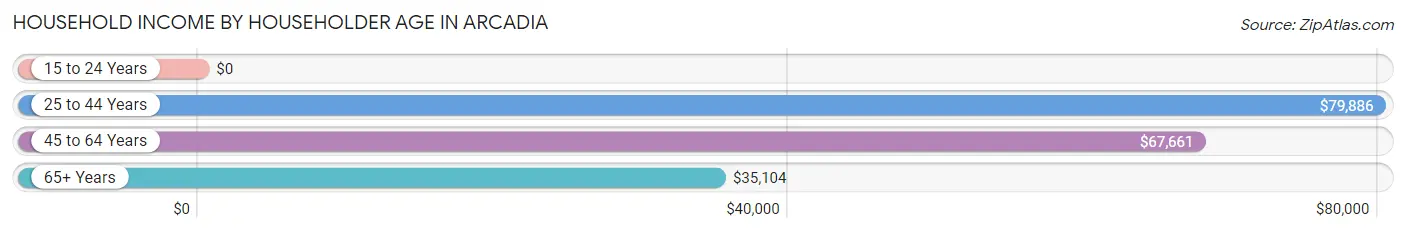
Household Income by Householder Age in Arcadia
The median household income in Arcadia is $62,008, with the highest median household income of $79,886 found in the 25 to 44 years age bracket for the primary householder. A total of 434 households (33.4%) fall into this category. Meanwhile, the 15 to 24 years age bracket for the primary householder has the lowest median household income of $0, with 94 households (7.2%) in this group.
| Income Bracket | # Households | Median Income |
| 15 to 24 Years | 94 (7.2%) | $0 |
| 25 to 44 Years | 434 (33.4%) | $79,886 |
| 45 to 64 Years | 514 (39.5%) | $67,661 |
| 65+ Years | 259 (19.9%) | $35,104 |
| Total | 1,301 (100.0%) | $62,008 |
Poverty in Arcadia
Income Below Poverty by Sex and Age in Arcadia
With 4.4% poverty level for males and 6.3% for females among the residents of Arcadia, 18 to 24 year old males and 75 year old and over females are the most vulnerable to poverty, with 56 males (29.0%) and 17 females (23.6%) in their respective age groups living below the poverty level.
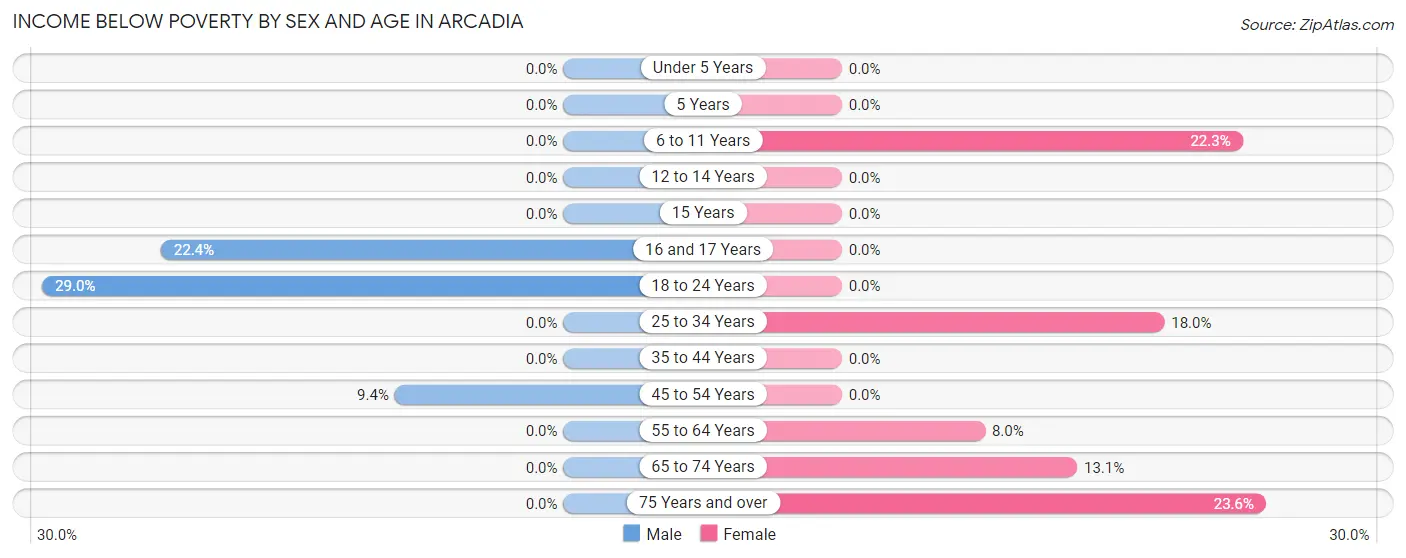
| Age Bracket | Male | Female |
| Under 5 Years | 0 (0.0%) | 0 (0.0%) |
| 5 Years | 0 (0.0%) | 0 (0.0%) |
| 6 to 11 Years | 0 (0.0%) | 29 (22.3%) |
| 12 to 14 Years | 0 (0.0%) | 0 (0.0%) |
| 15 Years | 0 (0.0%) | 0 (0.0%) |
| 16 and 17 Years | 13 (22.4%) | 0 (0.0%) |
| 18 to 24 Years | 56 (29.0%) | 0 (0.0%) |
| 25 to 34 Years | 0 (0.0%) | 30 (18.0%) |
| 35 to 44 Years | 0 (0.0%) | 0 (0.0%) |
| 45 to 54 Years | 23 (9.4%) | 0 (0.0%) |
| 55 to 64 Years | 0 (0.0%) | 11 (8.0%) |
| 65 to 74 Years | 0 (0.0%) | 11 (13.1%) |
| 75 Years and over | 0 (0.0%) | 17 (23.6%) |
| Total | 92 (4.4%) | 98 (6.3%) |
Income Above Poverty by Sex and Age in Arcadia
According to the poverty statistics in Arcadia, males aged under 5 years and females aged under 5 years are the age groups that are most secure financially, with 100.0% of males and 100.0% of females in these age groups living above the poverty line.
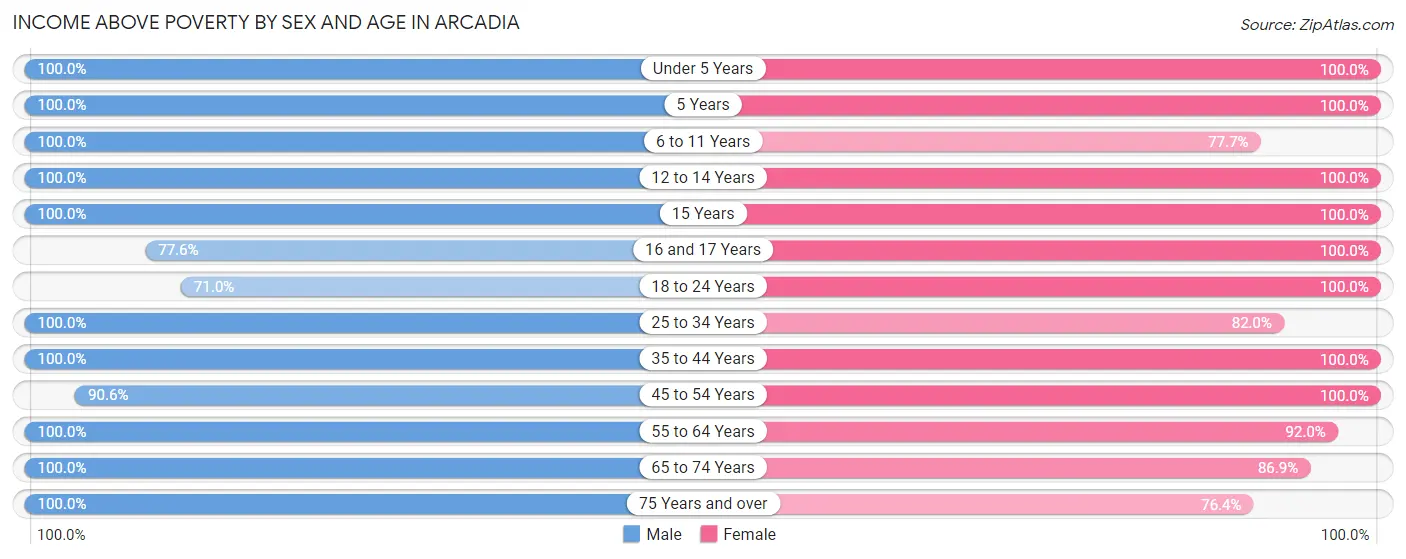
| Age Bracket | Male | Female |
| Under 5 Years | 246 (100.0%) | 291 (100.0%) |
| 5 Years | 31 (100.0%) | 18 (100.0%) |
| 6 to 11 Years | 251 (100.0%) | 101 (77.7%) |
| 12 to 14 Years | 129 (100.0%) | 141 (100.0%) |
| 15 Years | 35 (100.0%) | 65 (100.0%) |
| 16 and 17 Years | 45 (77.6%) | 9 (100.0%) |
| 18 to 24 Years | 137 (71.0%) | 58 (100.0%) |
| 25 to 34 Years | 190 (100.0%) | 137 (82.0%) |
| 35 to 44 Years | 339 (100.0%) | 170 (100.0%) |
| 45 to 54 Years | 222 (90.6%) | 222 (100.0%) |
| 55 to 64 Years | 164 (100.0%) | 127 (92.0%) |
| 65 to 74 Years | 74 (100.0%) | 73 (86.9%) |
| 75 Years and over | 137 (100.0%) | 55 (76.4%) |
| Total | 2,000 (95.6%) | 1,467 (93.7%) |
Income Below Poverty Among Married-Couple Families in Arcadia
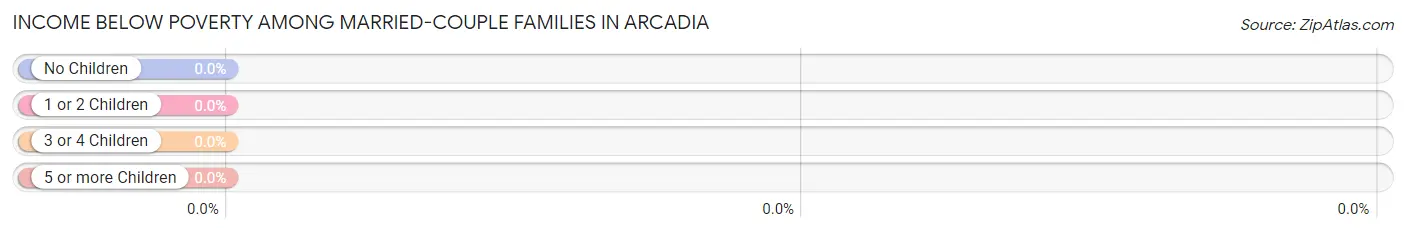
| Children | Above Poverty | Below Poverty |
| No Children | 243 (100.0%) | 0 (0.0%) |
| 1 or 2 Children | 196 (100.0%) | 0 (0.0%) |
| 3 or 4 Children | 156 (100.0%) | 0 (0.0%) |
| 5 or more Children | 0 (0.0%) | 0 (0.0%) |
| Total | 595 (100.0%) | 0 (0.0%) |
Income Below Poverty Among Single-Parent Households in Arcadia
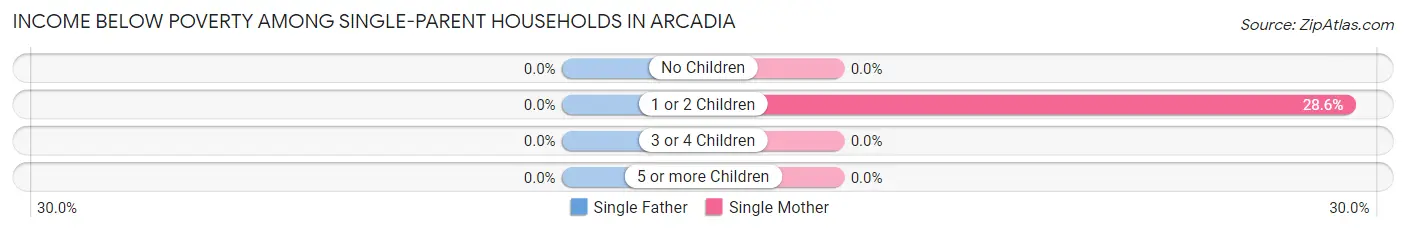
| Children | Single Father | Single Mother |
| No Children | 0 (0.0%) | 0 (0.0%) |
| 1 or 2 Children | 0 (0.0%) | 8 (28.6%) |
| 3 or 4 Children | 0 (0.0%) | 0 (0.0%) |
| 5 or more Children | 0 (0.0%) | 0 (0.0%) |
| Total | 0 (0.0%) | 8 (15.1%) |
Income Below Poverty Among Married-Couple vs Single-Parent Households in Arcadia
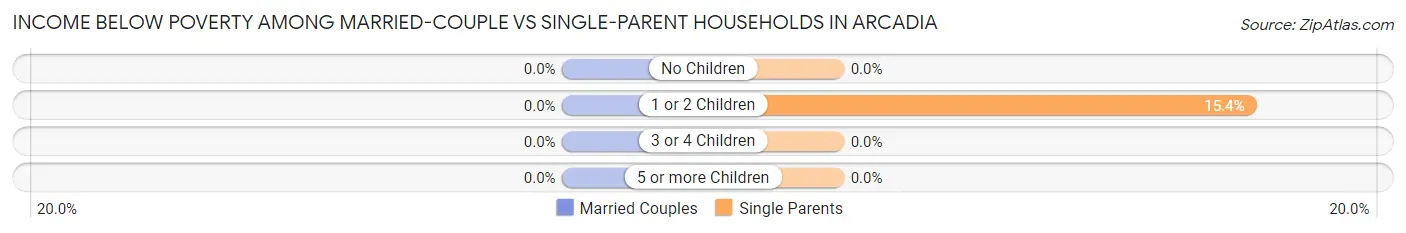
| Children | Married-Couple Families | Single-Parent Households |
| No Children | 0 (0.0%) | 0 (0.0%) |
| 1 or 2 Children | 0 (0.0%) | 8 (15.4%) |
| 3 or 4 Children | 0 (0.0%) | 0 (0.0%) |
| 5 or more Children | 0 (0.0%) | 0 (0.0%) |
| Total | 0 (0.0%) | 8 (8.0%) |
Race in Arcadia
The most populous races in Arcadia are White / Caucasian (2,300 | 62.7%), Hispanic or Latino (1,894 | 51.6%), and Some other Race (1,204 | 32.8%).
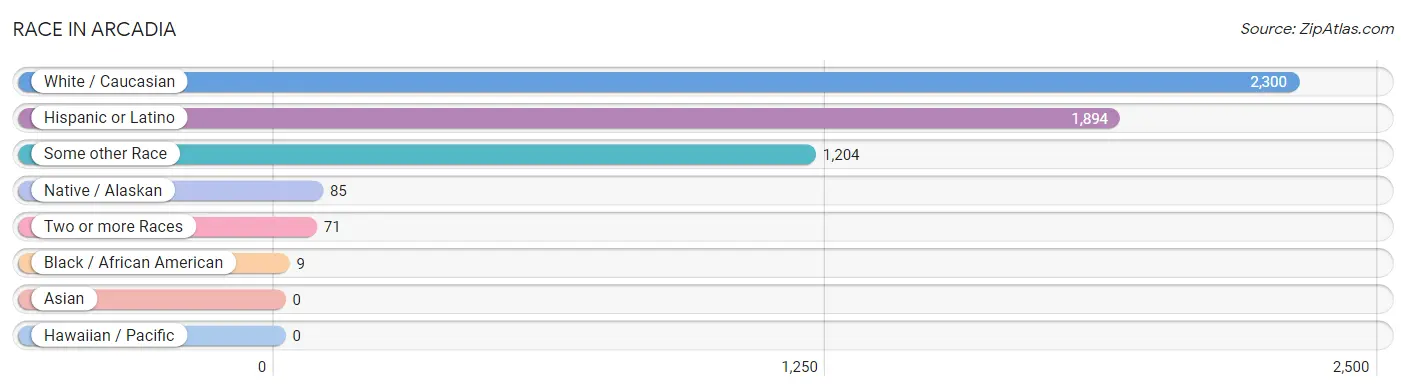
| Race | # Population | % Population |
| Asian | 0 | 0.0% |
| Black / African American | 9 | 0.3% |
| Hawaiian / Pacific | 0 | 0.0% |
| Hispanic or Latino | 1,894 | 51.6% |
| Native / Alaskan | 85 | 2.3% |
| White / Caucasian | 2,300 | 62.7% |
| Two or more Races | 71 | 1.9% |
| Some other Race | 1,204 | 32.8% |
| Total | 3,669 | 100.0% |
Ancestry in Arcadia
The most populous ancestries reported in Arcadia are Mexican (1,634 | 44.5%), German (976 | 26.6%), Polish (569 | 15.5%), Norwegian (383 | 10.4%), and Central American (239 | 6.5%), together accounting for 103.6% of all Arcadia residents.
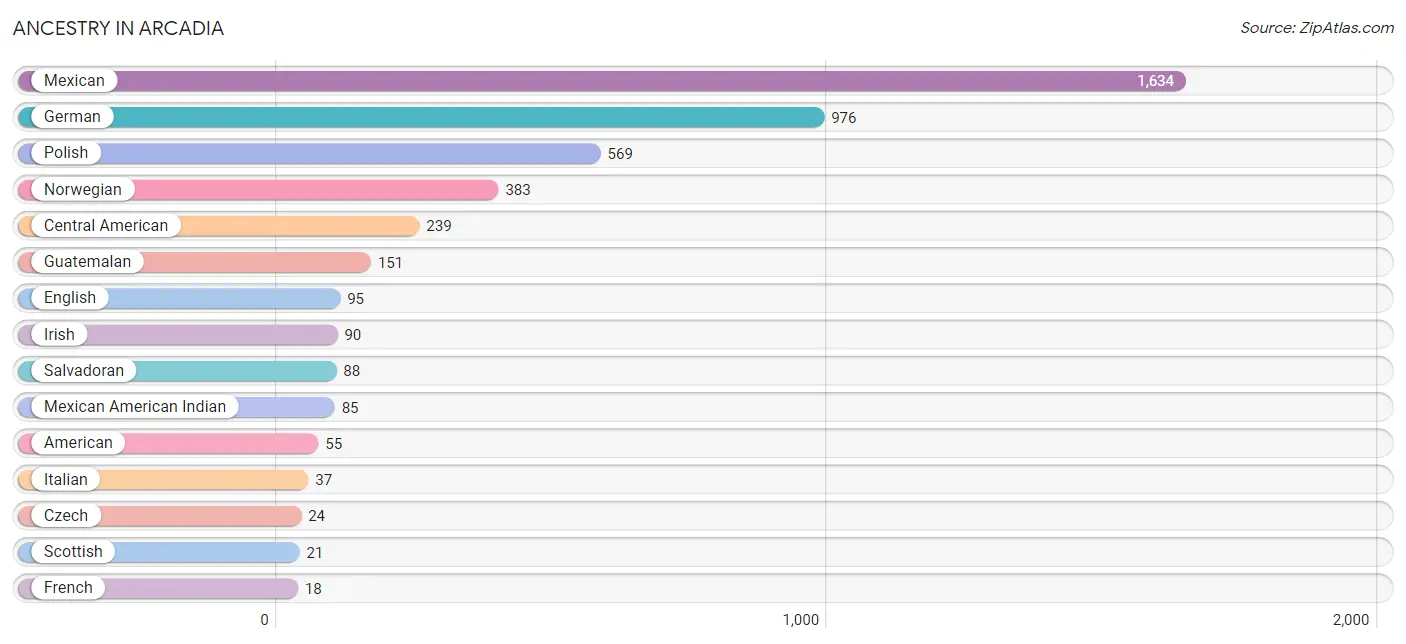
| Ancestry | # Population | % Population |
| American | 55 | 1.5% |
| Austrian | 9 | 0.3% |
| Central American | 239 | 6.5% |
| Cuban | 12 | 0.3% |
| Czech | 24 | 0.6% |
| Dutch | 8 | 0.2% |
| English | 95 | 2.6% |
| French | 18 | 0.5% |
| German | 976 | 26.6% |
| Guatemalan | 151 | 4.1% |
| Irish | 90 | 2.5% |
| Italian | 37 | 1.0% |
| Mexican | 1,634 | 44.5% |
| Mexican American Indian | 85 | 2.3% |
| Norwegian | 383 | 10.4% |
| Polish | 569 | 15.5% |
| Salvadoran | 88 | 2.4% |
| Scandinavian | 17 | 0.5% |
| Scottish | 21 | 0.6% |
| Spaniard | 9 | 0.3% | View All 20 Rows |
Immigrants in Arcadia
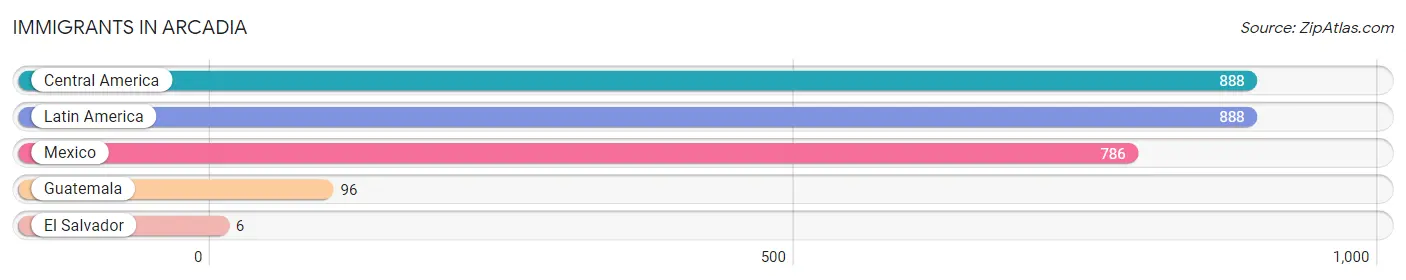
The most numerous immigrant groups reported in Arcadia came from Central America (888 | 24.2%), Latin America (888 | 24.2%), Mexico (786 | 21.4%), Guatemala (96 | 2.6%), and El Salvador (6 | 0.2%), together accounting for 72.6% of all Arcadia residents.
| Immigration Origin | # Population | % Population |
| Central America | 888 | 24.2% |
| El Salvador | 6 | 0.2% |
| Guatemala | 96 | 2.6% |
| Latin America | 888 | 24.2% |
| Mexico | 786 | 21.4% | View All 5 Rows |
Sex and Age in Arcadia
Sex and Age in Arcadia
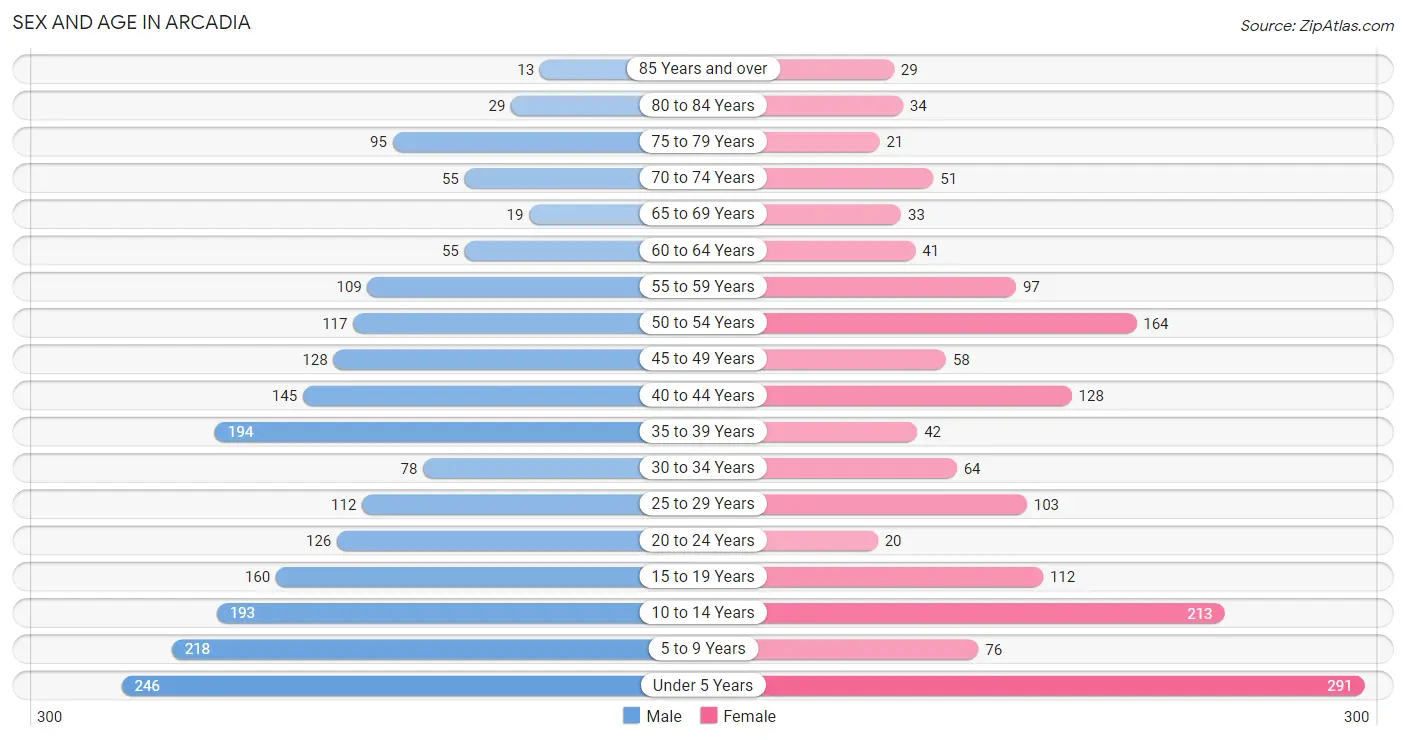
The most populous age groups in Arcadia are Under 5 Years (246 | 11.8%) for men and Under 5 Years (291 | 18.4%) for women.
| Age Bracket | Male | Female |
| Under 5 Years | 246 (11.8%) | 291 (18.4%) |
| 5 to 9 Years | 218 (10.4%) | 76 (4.8%) |
| 10 to 14 Years | 193 (9.2%) | 213 (13.5%) |
| 15 to 19 Years | 160 (7.6%) | 112 (7.1%) |
| 20 to 24 Years | 126 (6.0%) | 20 (1.3%) |
| 25 to 29 Years | 112 (5.3%) | 103 (6.5%) |
| 30 to 34 Years | 78 (3.7%) | 64 (4.1%) |
| 35 to 39 Years | 194 (9.3%) | 42 (2.7%) |
| 40 to 44 Years | 145 (6.9%) | 128 (8.1%) |
| 45 to 49 Years | 128 (6.1%) | 58 (3.7%) |
| 50 to 54 Years | 117 (5.6%) | 164 (10.4%) |
| 55 to 59 Years | 109 (5.2%) | 97 (6.1%) |
| 60 to 64 Years | 55 (2.6%) | 41 (2.6%) |
| 65 to 69 Years | 19 (0.9%) | 33 (2.1%) |
| 70 to 74 Years | 55 (2.6%) | 51 (3.2%) |
| 75 to 79 Years | 95 (4.5%) | 21 (1.3%) |
| 80 to 84 Years | 29 (1.4%) | 34 (2.2%) |
| 85 Years and over | 13 (0.6%) | 29 (1.8%) |
| Total | 2,092 (100.0%) | 1,577 (100.0%) |
Families and Households in Arcadia
Median Family Size in Arcadia
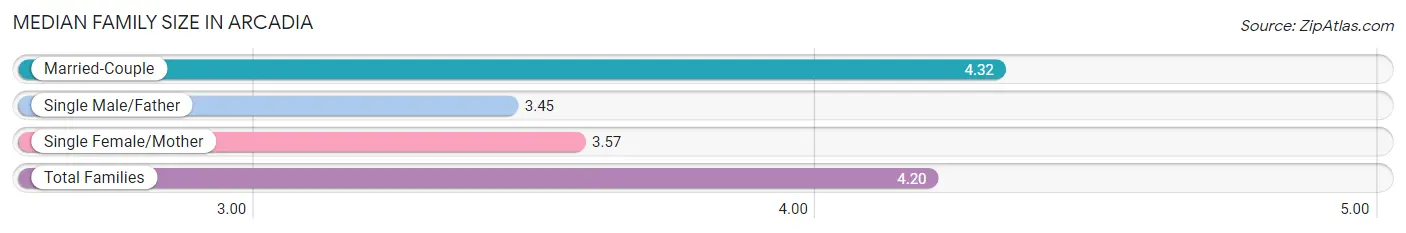
The median family size in Arcadia is 4.20 persons per family, with married-couple families (595 | 85.6%) accounting for the largest median family size of 4.32 persons per family. On the other hand, single male/father families (47 | 6.8%) represent the smallest median family size with 3.45 persons per family.
| Family Type | # Families | Family Size |
| Married-Couple | 595 (85.6%) | 4.32 |
| Single Male/Father | 47 (6.8%) | 3.45 |
| Single Female/Mother | 53 (7.6%) | 3.57 |
| Total Families | 695 (100.0%) | 4.20 |
Median Household Size in Arcadia
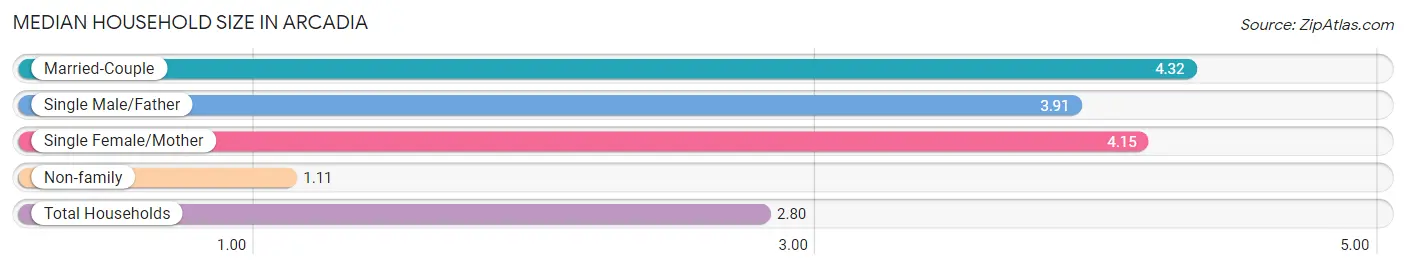
The median household size in Arcadia is 2.80 persons per household, with married-couple households (595 | 45.7%) accounting for the largest median household size of 4.32 persons per household. non-family households (606 | 46.6%) represent the smallest median household size with 1.11 persons per household.
| Household Type | # Households | Household Size |
| Married-Couple | 595 (45.7%) | 4.32 |
| Single Male/Father | 47 (3.6%) | 3.91 |
| Single Female/Mother | 53 (4.1%) | 4.15 |
| Non-family | 606 (46.6%) | 1.11 |
| Total Households | 1,301 (100.0%) | 2.80 |
Household Size by Marriage Status in Arcadia
Out of a total of 1,301 households in Arcadia, 695 (53.4%) are family households, while 606 (46.6%) are nonfamily households. The most numerous type of family households are 2-person households, comprising 240, and the most common type of nonfamily households are 1-person households, comprising 536.
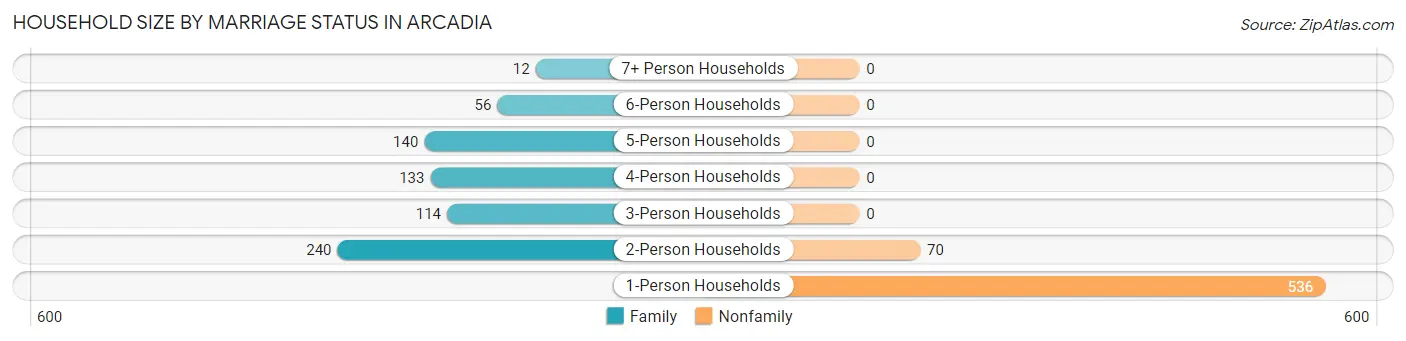
| Household Size | Family Households | Nonfamily Households |
| 1-Person Households | - | 536 (41.2%) |
| 2-Person Households | 240 (18.4%) | 70 (5.4%) |
| 3-Person Households | 114 (8.8%) | 0 (0.0%) |
| 4-Person Households | 133 (10.2%) | 0 (0.0%) |
| 5-Person Households | 140 (10.8%) | 0 (0.0%) |
| 6-Person Households | 56 (4.3%) | 0 (0.0%) |
| 7+ Person Households | 12 (0.9%) | 0 (0.0%) |
| Total | 695 (53.4%) | 606 (46.6%) |
Female Fertility in Arcadia
Fertility by Age in Arcadia
Average fertility rate in Arcadia is 46.0 births per 1,000 women. Women in the age bracket of 20 to 34 years have the highest fertility rate with 86.0 births per 1,000 women. Women in the age bracket of 20 to 34 years acount for 64.0% of all women with births.
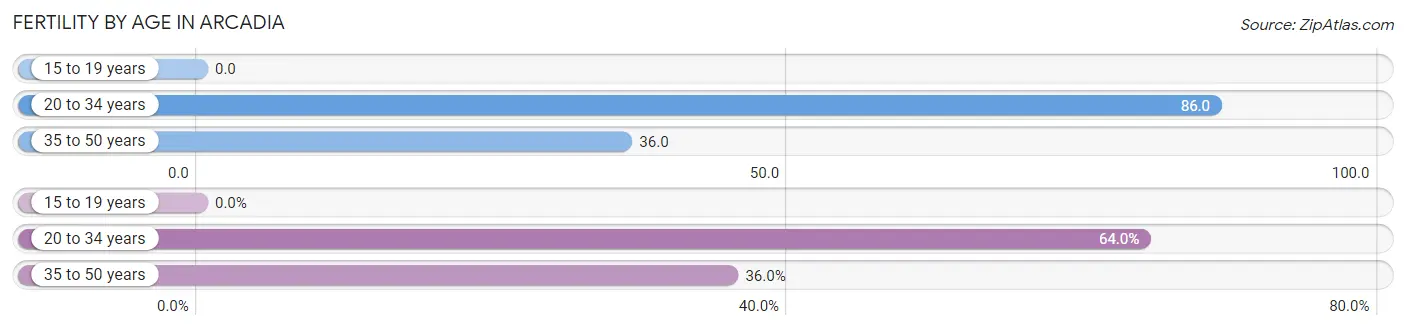
| Age Bracket | Women with Births | Births / 1,000 Women |
| 15 to 19 years | 0 (0.0%) | 0.0 |
| 20 to 34 years | 16 (64.0%) | 86.0 |
| 35 to 50 years | 9 (36.0%) | 36.0 |
| Total | 25 (100.0%) | 46.0 |
Fertility by Age by Marriage Status in Arcadia
80.0% of women with births (25) in Arcadia are married. The highest percentage of unmarried women with births falls into 20 to 34 years age bracket with 31.2% of them unmarried at the time of birth, while the lowest percentage of unmarried women with births belong to 35 to 50 years age bracket with 0.0% of them unmarried.
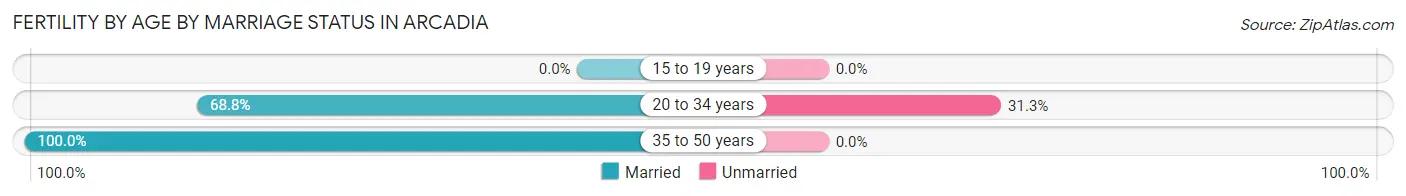
| Age Bracket | Married | Unmarried |
| 15 to 19 years | 0 (0.0%) | 0 (0.0%) |
| 20 to 34 years | 11 (68.8%) | 5 (31.2%) |
| 35 to 50 years | 9 (100.0%) | 0 (0.0%) |
| Total | 20 (80.0%) | 5 (20.0%) |
Fertility by Education in Arcadia
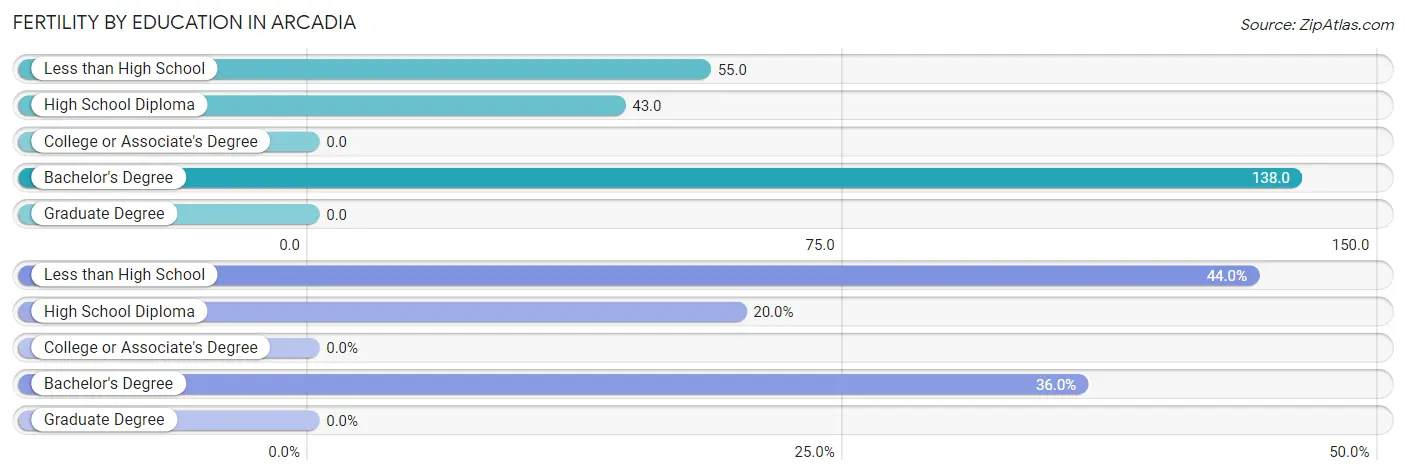
| Educational Attainment | Women with Births | Births / 1,000 Women |
| Less than High School | 11 (44.0%) | 55.0 |
| High School Diploma | 5 (20.0%) | 43.0 |
| College or Associate's Degree | 0 (0.0%) | 0.0 |
| Bachelor's Degree | 9 (36.0%) | 138.0 |
| Graduate Degree | 0 (0.0%) | 0.0 |
| Total | 25 (100.0%) | 46.0 |
Fertility by Education by Marriage Status in Arcadia
20.0% of women with births in Arcadia are unmarried. Women with the educational attainment of less than high school are most likely to be married with 100.0% of them married at childbirth, while women with the educational attainment of high school diploma are least likely to be married with 100.0% of them unmarried at childbirth.
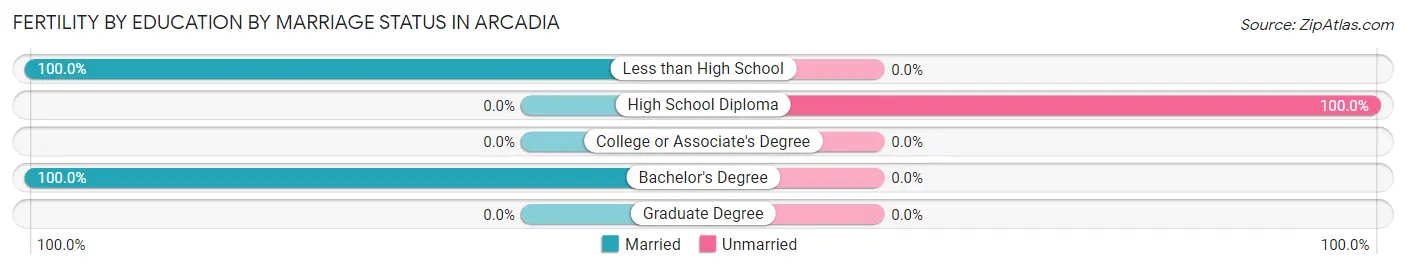
| Educational Attainment | Married | Unmarried |
| Less than High School | 11 (100.0%) | 0 (0.0%) |
| High School Diploma | 0 (0.0%) | 5 (100.0%) |
| College or Associate's Degree | 0 (0.0%) | 0 (0.0%) |
| Bachelor's Degree | 9 (100.0%) | 0 (0.0%) |
| Graduate Degree | 0 (0.0%) | 0 (0.0%) |
| Total | 20 (80.0%) | 5 (20.0%) |
Employment Characteristics in Arcadia
Employment by Class of Employer in Arcadia
Among the 1,522 employed individuals in Arcadia, private company employees (1,211 | 79.6%), local government employees (105 | 6.9%), and self-employed (not incorporated) (95 | 6.2%) make up the most common classes of employment.
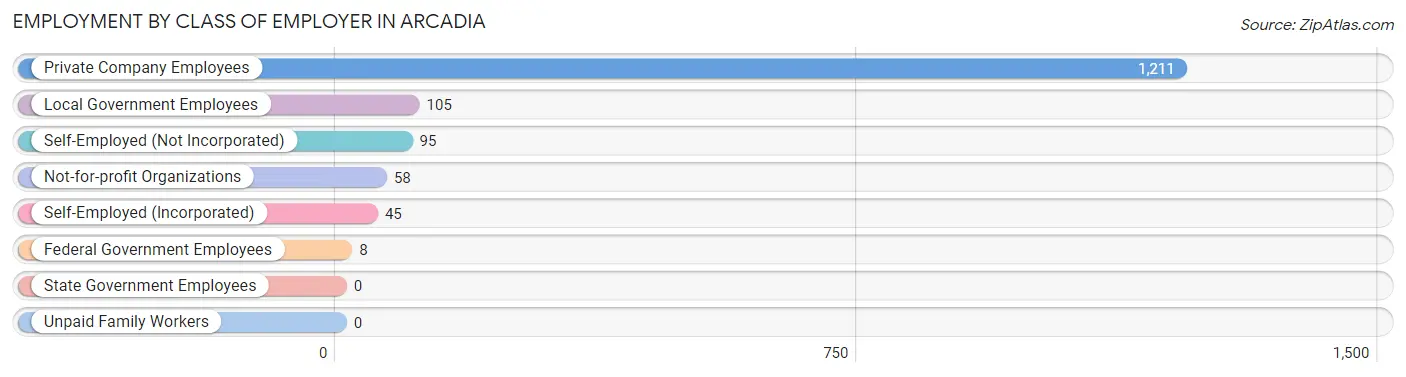
| Employer Class | # Employees | % Employees |
| Private Company Employees | 1,211 | 79.6% |
| Self-Employed (Incorporated) | 45 | 3.0% |
| Self-Employed (Not Incorporated) | 95 | 6.2% |
| Not-for-profit Organizations | 58 | 3.8% |
| Local Government Employees | 105 | 6.9% |
| State Government Employees | 0 | 0.0% |
| Federal Government Employees | 8 | 0.5% |
| Unpaid Family Workers | 0 | 0.0% |
| Total | 1,522 | 100.0% |
Employment Status by Age in Arcadia
According to the labor force statistics for Arcadia, out of the total population over 16 years of age (2,332), 69.4% or 1,618 individuals are in the labor force, with 4.4% or 71 of them unemployed. The age group with the highest labor force participation rate is 60 to 64 years, with 91.7% or 88 individuals in the labor force. Within the labor force, the 45 to 54 years age range has the highest percentage of unemployed individuals, with 16.2% or 69 of them being unemployed.
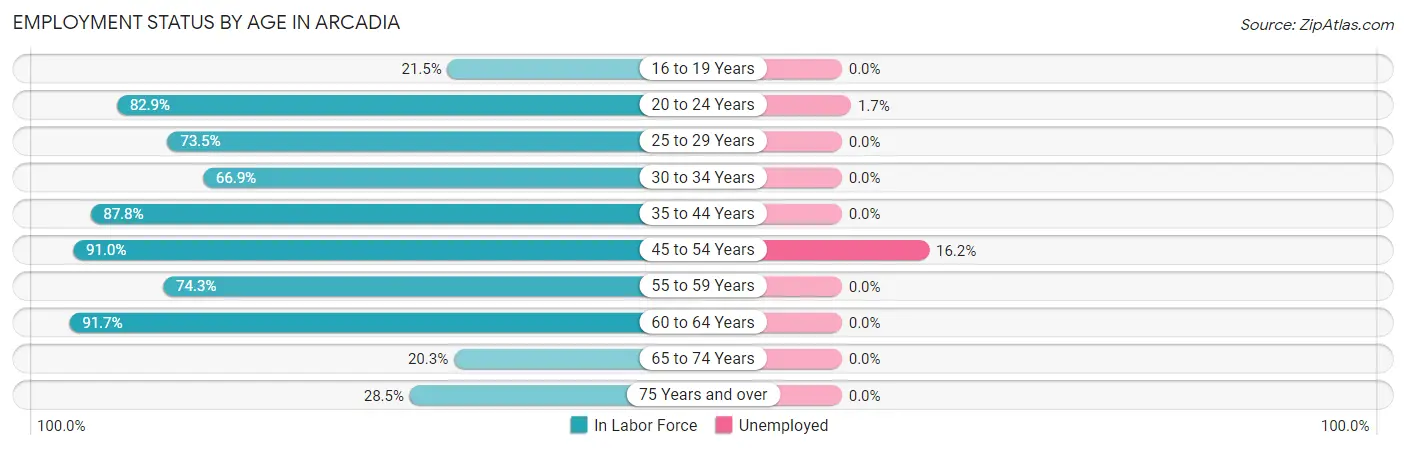
| Age Bracket | In Labor Force | Unemployed |
| 16 to 19 Years | 37 (21.5%) | 0 (0.0%) |
| 20 to 24 Years | 121 (82.9%) | 2 (1.7%) |
| 25 to 29 Years | 158 (73.5%) | 0 (0.0%) |
| 30 to 34 Years | 95 (66.9%) | 0 (0.0%) |
| 35 to 44 Years | 447 (87.8%) | 0 (0.0%) |
| 45 to 54 Years | 425 (91.0%) | 69 (16.2%) |
| 55 to 59 Years | 153 (74.3%) | 0 (0.0%) |
| 60 to 64 Years | 88 (91.7%) | 0 (0.0%) |
| 65 to 74 Years | 32 (20.3%) | 0 (0.0%) |
| 75 Years and over | 63 (28.5%) | 0 (0.0%) |
| Total | 1,618 (69.4%) | 71 (4.4%) |
Employment Status by Educational Attainment in Arcadia
According to labor force statistics for Arcadia, 83.5% of individuals (1,365) out of the total population between 25 and 64 years of age (1,635) are in the labor force, with 5.1% or 70 of them being unemployed. The group with the highest labor force participation rate are those with the educational attainment of bachelor's degree or higher, with 100.0% or 262 individuals in the labor force. Within the labor force, individuals with high school diploma education have the highest percentage of unemployment, with 16.4% or 69 of them being unemployed.
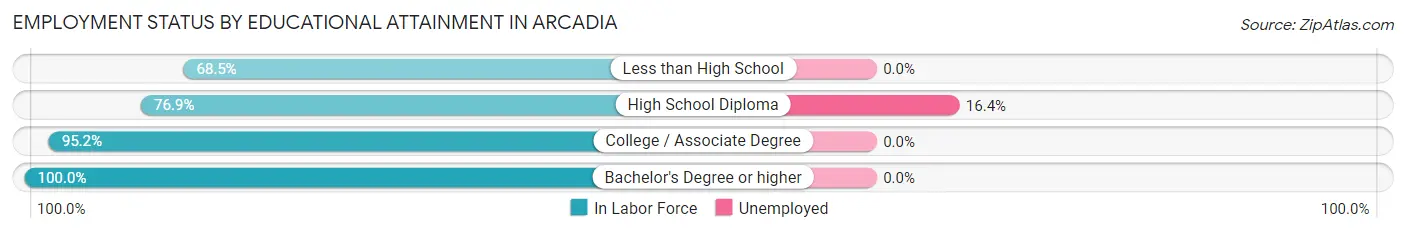
| Educational Attainment | In Labor Force | Unemployed |
| Less than High School | 265 (68.5%) | 0 (0.0%) |
| High School Diploma | 420 (76.9%) | 90 (16.4%) |
| College / Associate Degree | 419 (95.2%) | 0 (0.0%) |
| Bachelor's Degree or higher | 262 (100.0%) | 0 (0.0%) |
| Total | 1,365 (83.5%) | 83 (5.1%) |
Employment Occupations by Sex in Arcadia
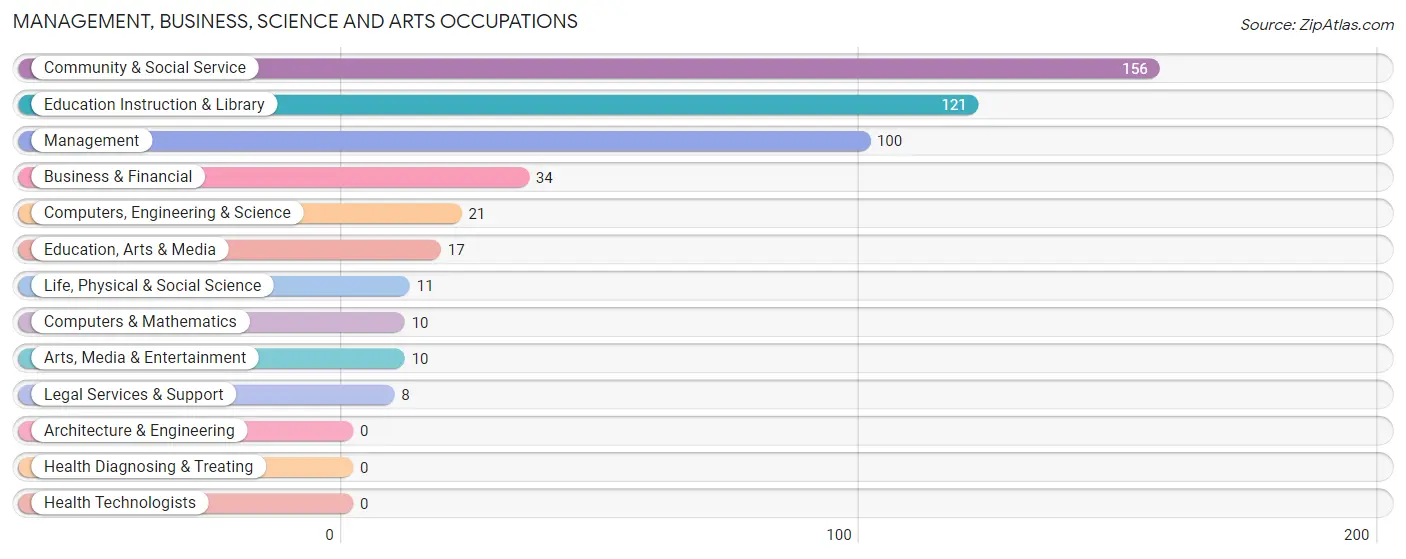
Management, Business, Science and Arts Occupations
The most common Management, Business, Science and Arts occupations in Arcadia are Community & Social Service (156 | 10.1%), Education Instruction & Library (121 | 7.8%), Management (100 | 6.5%), Business & Financial (34 | 2.2%), and Computers, Engineering & Science (21 | 1.4%).
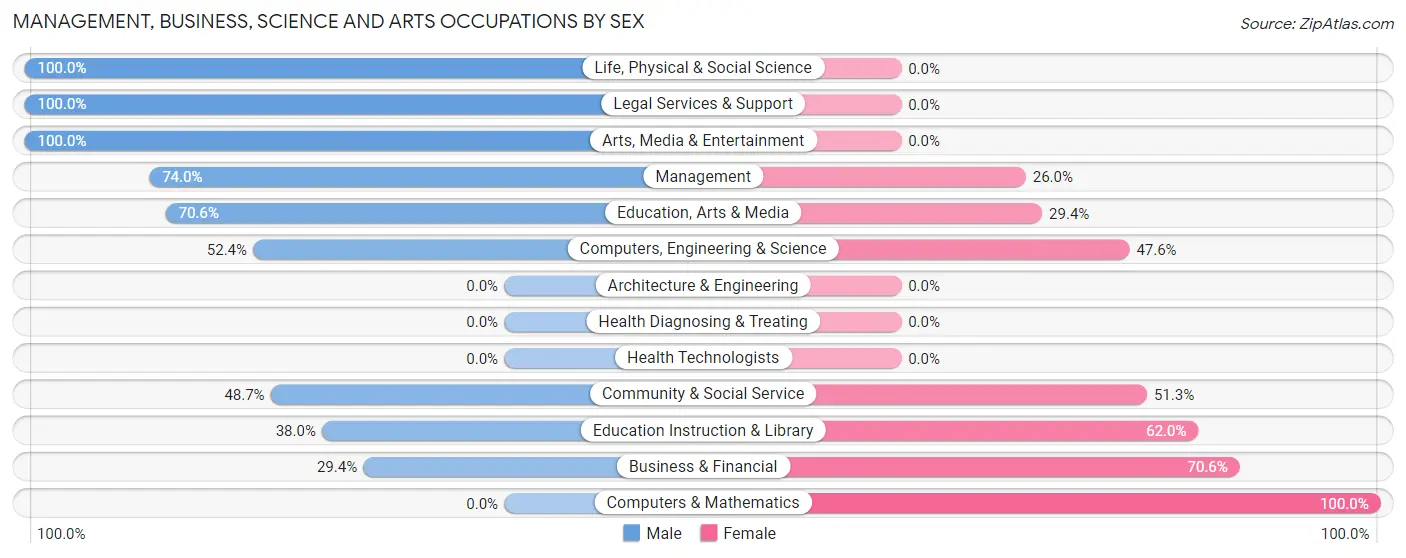
Management, Business, Science and Arts Occupations by Sex
Within the Management, Business, Science and Arts occupations in Arcadia, the most male-oriented occupations are Life, Physical & Social Science (100.0%), Legal Services & Support (100.0%), and Arts, Media & Entertainment (100.0%), while the most female-oriented occupations are Computers & Mathematics (100.0%), Business & Financial (70.6%), and Education Instruction & Library (62.0%).
| Occupation | Male | Female |
| Management | 74 (74.0%) | 26 (26.0%) |
| Business & Financial | 10 (29.4%) | 24 (70.6%) |
| Computers, Engineering & Science | 11 (52.4%) | 10 (47.6%) |
| Computers & Mathematics | 0 (0.0%) | 10 (100.0%) |
| Architecture & Engineering | 0 (0.0%) | 0 (0.0%) |
| Life, Physical & Social Science | 11 (100.0%) | 0 (0.0%) |
| Community & Social Service | 76 (48.7%) | 80 (51.3%) |
| Education, Arts & Media | 12 (70.6%) | 5 (29.4%) |
| Legal Services & Support | 8 (100.0%) | 0 (0.0%) |
| Education Instruction & Library | 46 (38.0%) | 75 (62.0%) |
| Arts, Media & Entertainment | 10 (100.0%) | 0 (0.0%) |
| Health Diagnosing & Treating | 0 (0.0%) | 0 (0.0%) |
| Health Technologists | 0 (0.0%) | 0 (0.0%) |
| Total (Category) | 171 (55.0%) | 140 (45.0%) |
| Total (Overall) | 991 (64.0%) | 557 (36.0%) |
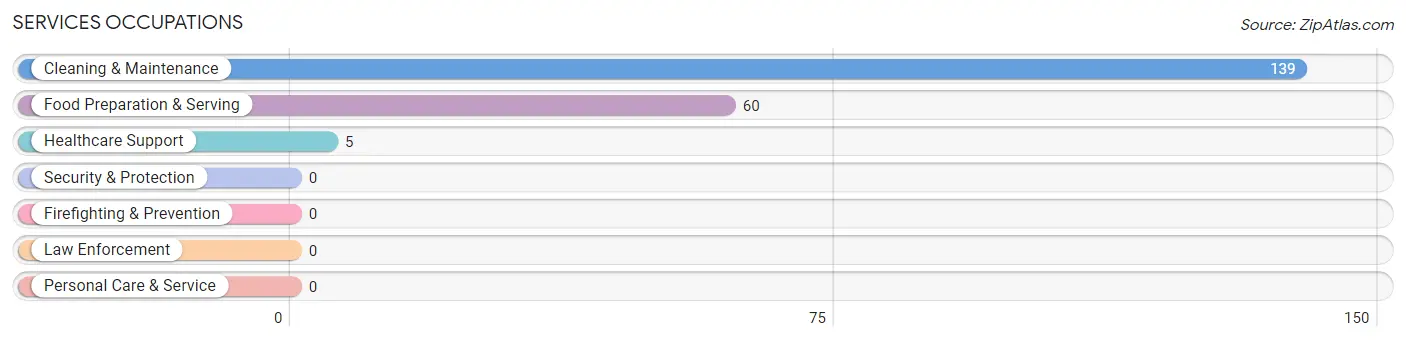
Services Occupations
The most common Services occupations in Arcadia are Cleaning & Maintenance (139 | 9.0%), Food Preparation & Serving (60 | 3.9%), and Healthcare Support (5 | 0.3%).
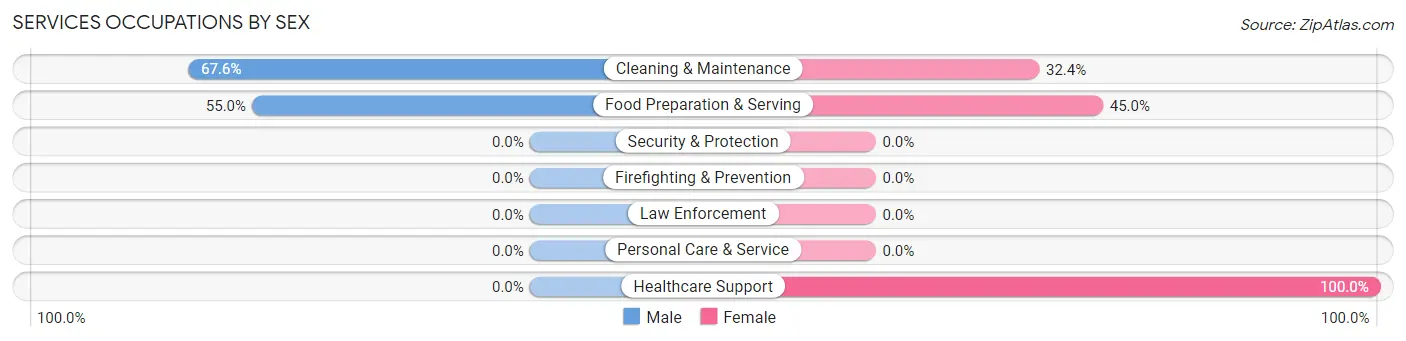
Services Occupations by Sex
Within the Services occupations in Arcadia, the most male-oriented occupations are Cleaning & Maintenance (67.6%), and Food Preparation & Serving (55.0%), while the most female-oriented occupations are Healthcare Support (100.0%), Food Preparation & Serving (45.0%), and Cleaning & Maintenance (32.4%).
| Occupation | Male | Female |
| Healthcare Support | 0 (0.0%) | 5 (100.0%) |
| Security & Protection | 0 (0.0%) | 0 (0.0%) |
| Firefighting & Prevention | 0 (0.0%) | 0 (0.0%) |
| Law Enforcement | 0 (0.0%) | 0 (0.0%) |
| Food Preparation & Serving | 33 (55.0%) | 27 (45.0%) |
| Cleaning & Maintenance | 94 (67.6%) | 45 (32.4%) |
| Personal Care & Service | 0 (0.0%) | 0 (0.0%) |
| Total (Category) | 127 (62.3%) | 77 (37.8%) |
| Total (Overall) | 991 (64.0%) | 557 (36.0%) |
Sales and Office Occupations
The most common Sales and Office occupations in Arcadia are Office & Administration (179 | 11.6%), and Sales & Related (40 | 2.6%).

Sales and Office Occupations by Sex

| Occupation | Male | Female |
| Sales & Related | 34 (85.0%) | 6 (15.0%) |
| Office & Administration | 24 (13.4%) | 155 (86.6%) |
| Total (Category) | 58 (26.5%) | 161 (73.5%) |
| Total (Overall) | 991 (64.0%) | 557 (36.0%) |
Natural Resources, Construction and Maintenance Occupations
The most common Natural Resources, Construction and Maintenance occupations in Arcadia are Farming, Fishing & Forestry (91 | 5.9%), Installation, Maintenance & Repair (51 | 3.3%), and Construction & Extraction (23 | 1.5%).
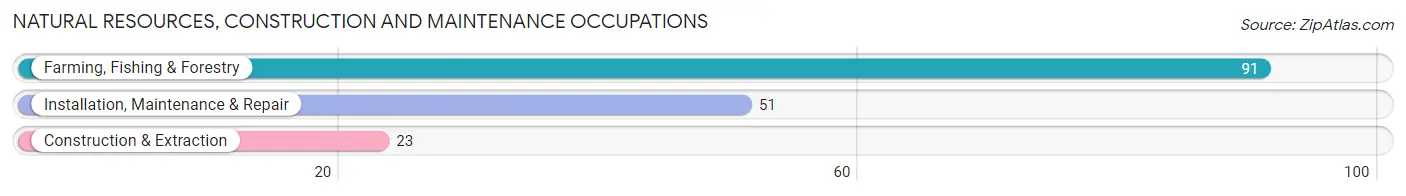
Natural Resources, Construction and Maintenance Occupations by Sex

| Occupation | Male | Female |
| Farming, Fishing & Forestry | 83 (91.2%) | 8 (8.8%) |
| Construction & Extraction | 23 (100.0%) | 0 (0.0%) |
| Installation, Maintenance & Repair | 20 (39.2%) | 31 (60.8%) |
| Total (Category) | 126 (76.4%) | 39 (23.6%) |
| Total (Overall) | 991 (64.0%) | 557 (36.0%) |
Production, Transportation and Moving Occupations
The most common Production, Transportation and Moving occupations in Arcadia are Production (410 | 26.5%), Material Moving (204 | 13.2%), and Transportation (35 | 2.3%).
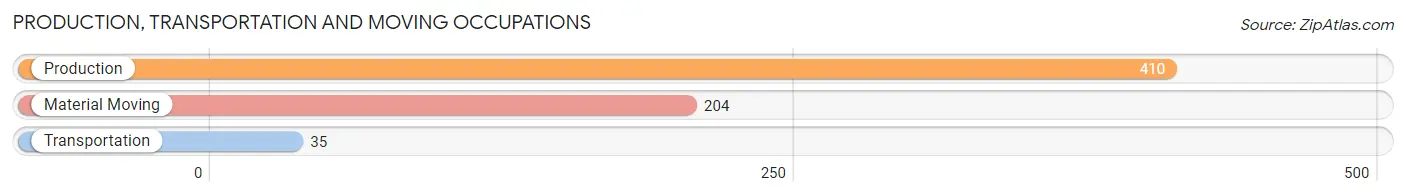
Production, Transportation and Moving Occupations by Sex
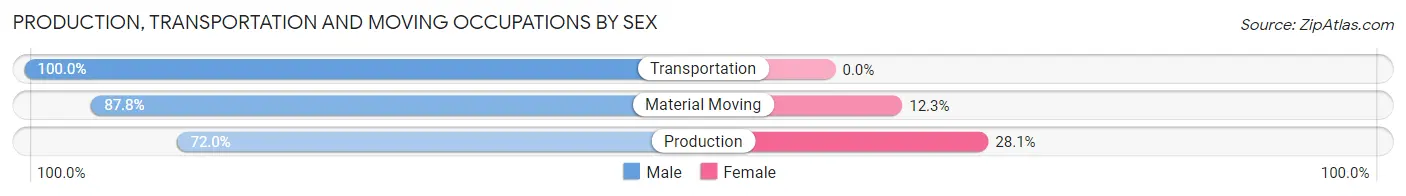
| Occupation | Male | Female |
| Production | 295 (72.0%) | 115 (28.1%) |
| Transportation | 35 (100.0%) | 0 (0.0%) |
| Material Moving | 179 (87.7%) | 25 (12.2%) |
| Total (Category) | 509 (78.4%) | 140 (21.6%) |
| Total (Overall) | 991 (64.0%) | 557 (36.0%) |
Employment Industries by Sex in Arcadia
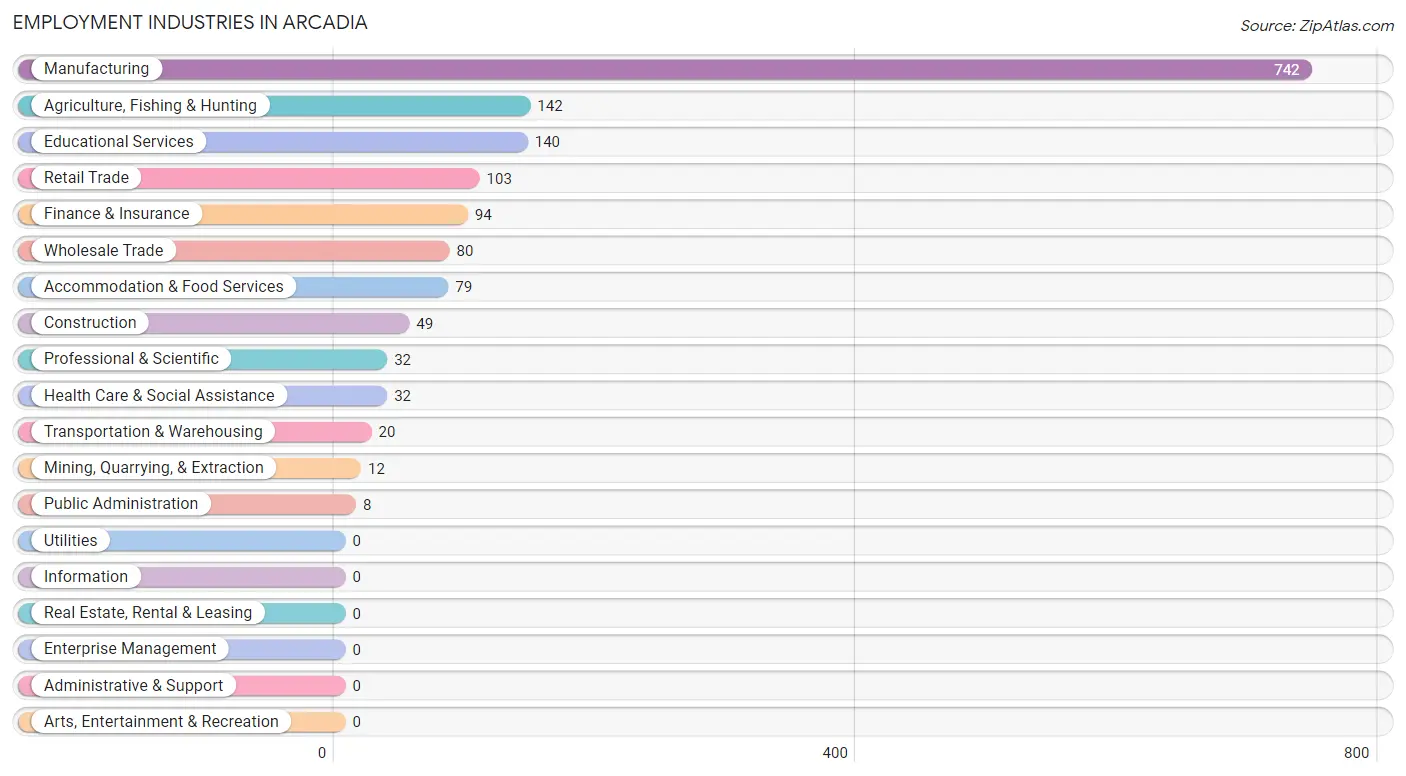
Employment Industries in Arcadia
The major employment industries in Arcadia include Manufacturing (742 | 47.9%), Agriculture, Fishing & Hunting (142 | 9.2%), Educational Services (140 | 9.0%), Retail Trade (103 | 6.7%), and Finance & Insurance (94 | 6.1%).
Employment Industries by Sex in Arcadia
The Arcadia industries that see more men than women are Mining, Quarrying, & Extraction (100.0%), Construction (100.0%), and Retail Trade (94.2%), whereas the industries that tend to have a higher number of women are Finance & Insurance (100.0%), Health Care & Social Assistance (100.0%), and Public Administration (100.0%).
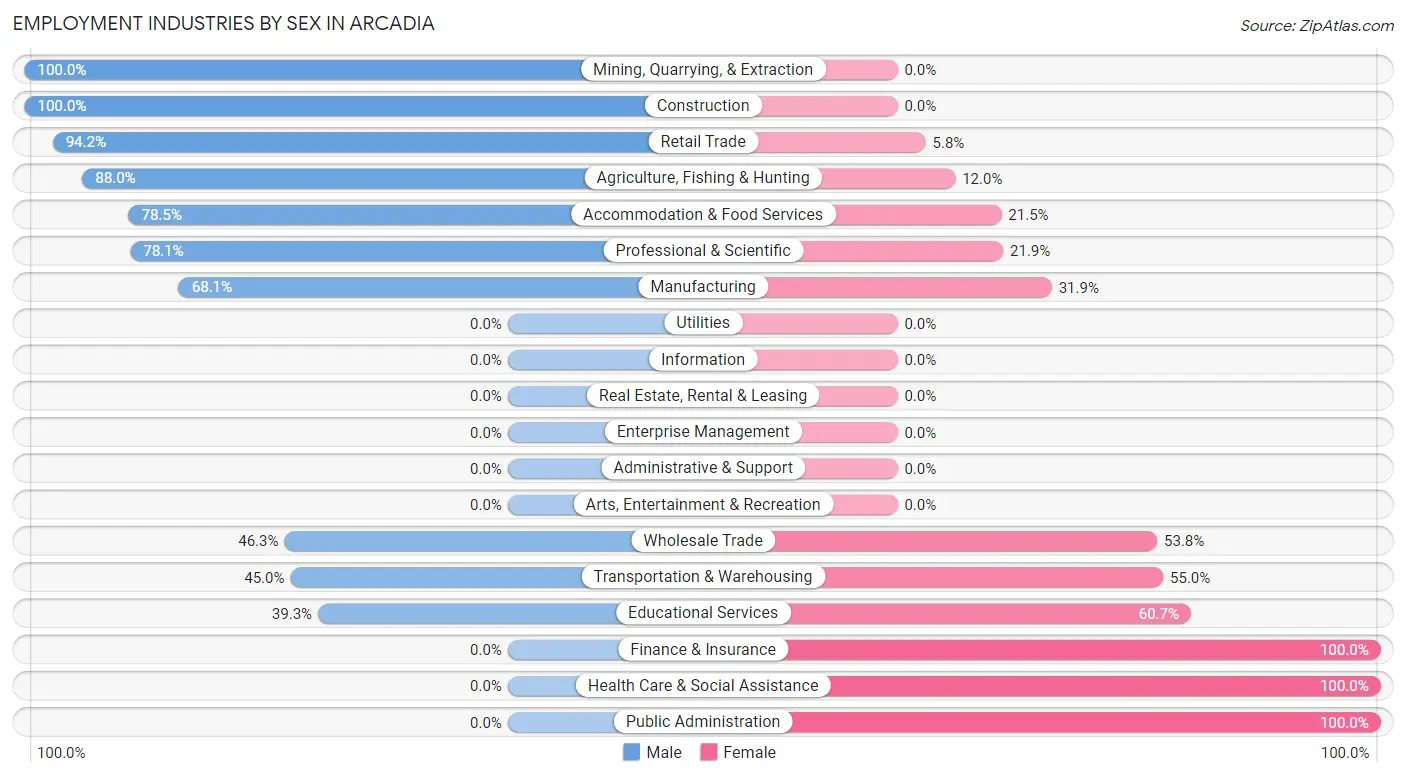
| Industry | Male | Female |
| Agriculture, Fishing & Hunting | 125 (88.0%) | 17 (12.0%) |
| Mining, Quarrying, & Extraction | 12 (100.0%) | 0 (0.0%) |
| Construction | 49 (100.0%) | 0 (0.0%) |
| Manufacturing | 505 (68.1%) | 237 (31.9%) |
| Wholesale Trade | 37 (46.3%) | 43 (53.7%) |
| Retail Trade | 97 (94.2%) | 6 (5.8%) |
| Transportation & Warehousing | 9 (45.0%) | 11 (55.0%) |
| Utilities | 0 (0.0%) | 0 (0.0%) |
| Information | 0 (0.0%) | 0 (0.0%) |
| Finance & Insurance | 0 (0.0%) | 94 (100.0%) |
| Real Estate, Rental & Leasing | 0 (0.0%) | 0 (0.0%) |
| Professional & Scientific | 25 (78.1%) | 7 (21.9%) |
| Enterprise Management | 0 (0.0%) | 0 (0.0%) |
| Administrative & Support | 0 (0.0%) | 0 (0.0%) |
| Educational Services | 55 (39.3%) | 85 (60.7%) |
| Health Care & Social Assistance | 0 (0.0%) | 32 (100.0%) |
| Arts, Entertainment & Recreation | 0 (0.0%) | 0 (0.0%) |
| Accommodation & Food Services | 62 (78.5%) | 17 (21.5%) |
| Public Administration | 0 (0.0%) | 8 (100.0%) |
| Total | 991 (64.0%) | 557 (36.0%) |
Education in Arcadia
School Enrollment in Arcadia
The most common levels of schooling among the 1,013 students in Arcadia are middle school (317 | 31.3%), high school (249 | 24.6%), and elementary school (247 | 24.4%).
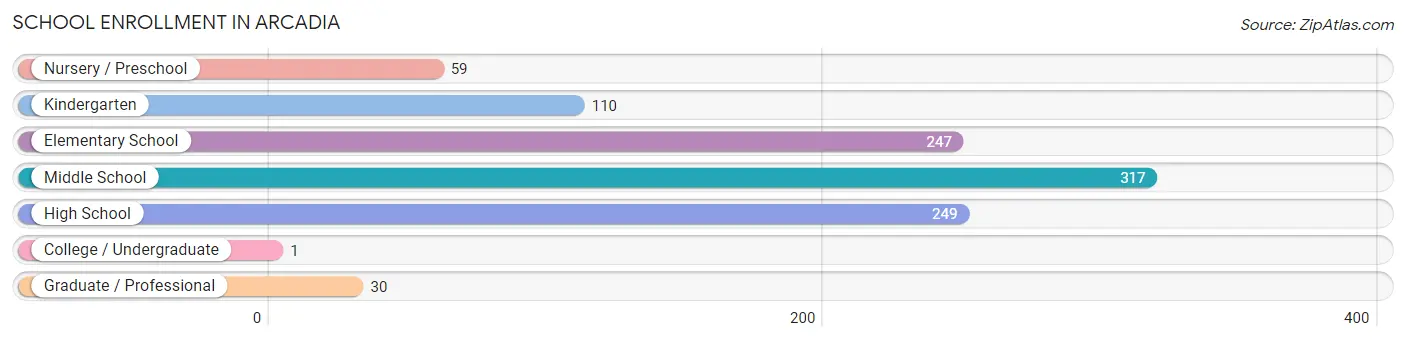
| School Level | # Students | % Students |
| Nursery / Preschool | 59 | 5.8% |
| Kindergarten | 110 | 10.9% |
| Elementary School | 247 | 24.4% |
| Middle School | 317 | 31.3% |
| High School | 249 | 24.6% |
| College / Undergraduate | 1 | 0.1% |
| Graduate / Professional | 30 | 3.0% |
| Total | 1,013 | 100.0% |
School Enrollment by Age by Funding Source in Arcadia
Out of a total of 1,013 students who are enrolled in schools in Arcadia, 67 (6.6%) attend a private institution, while the remaining 946 (93.4%) are enrolled in public schools. The age group of 25 to 34 year olds has the highest likelihood of being enrolled in private schools, with 9 (100.0% in the age bracket) enrolled. Conversely, the age group of 3 to 4 year olds has the lowest likelihood of being enrolled in a private school, with 41 (100.0% in the age bracket) attending a public institution.
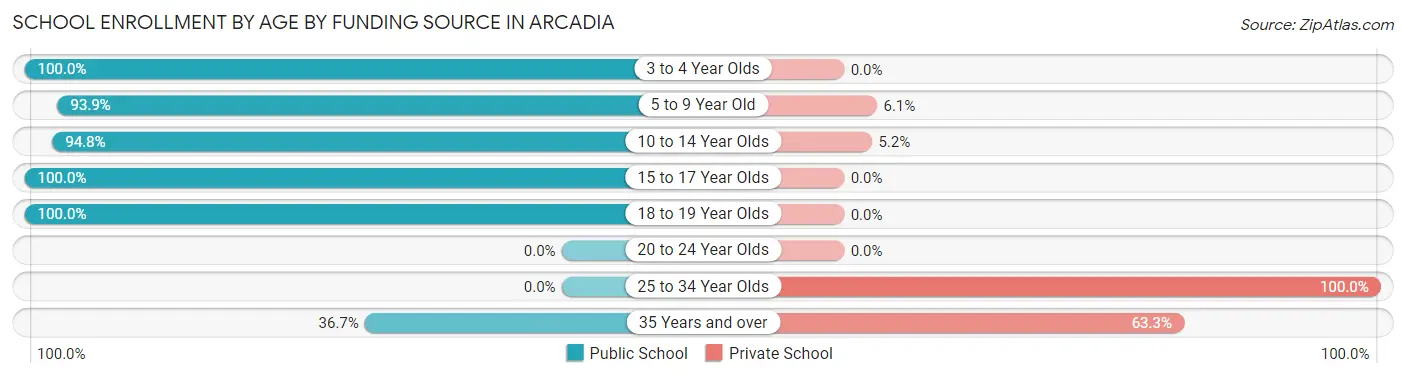
| Age Bracket | Public School | Private School |
| 3 to 4 Year Olds | 41 (100.0%) | 0 (0.0%) |
| 5 to 9 Year Old | 276 (93.9%) | 18 (6.1%) |
| 10 to 14 Year Olds | 385 (94.8%) | 21 (5.2%) |
| 15 to 17 Year Olds | 167 (100.0%) | 0 (0.0%) |
| 18 to 19 Year Olds | 66 (100.0%) | 0 (0.0%) |
| 20 to 24 Year Olds | 0 (0.0%) | 0 (0.0%) |
| 25 to 34 Year Olds | 0 (0.0%) | 9 (100.0%) |
| 35 Years and over | 11 (36.7%) | 19 (63.3%) |
| Total | 946 (93.4%) | 67 (6.6%) |
Educational Attainment by Field of Study in Arcadia
Business (107 | 28.2%), education (71 | 18.7%), liberal arts & history (61 | 16.1%), science & technology (30 | 7.9%), and social sciences (28 | 7.4%) are the most common fields of study among 379 individuals in Arcadia who have obtained a bachelor's degree or higher.
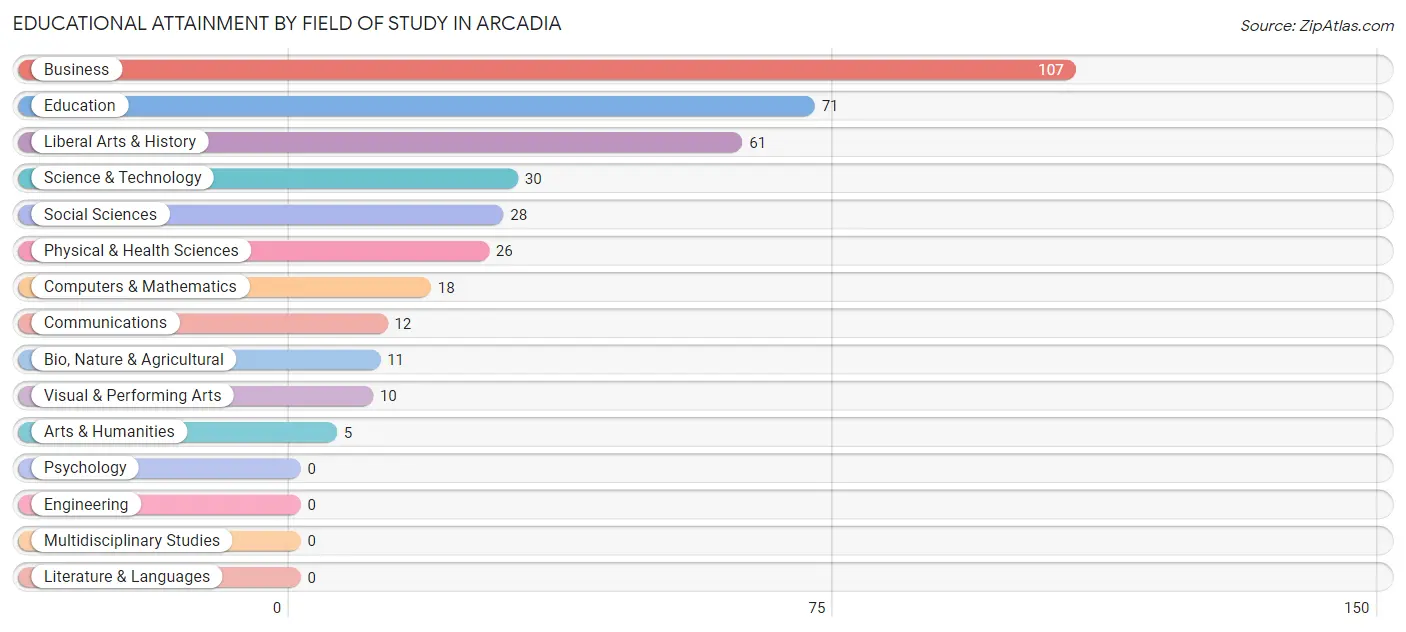
| Field of Study | # Graduates | % Graduates |
| Computers & Mathematics | 18 | 4.8% |
| Bio, Nature & Agricultural | 11 | 2.9% |
| Physical & Health Sciences | 26 | 6.9% |
| Psychology | 0 | 0.0% |
| Social Sciences | 28 | 7.4% |
| Engineering | 0 | 0.0% |
| Multidisciplinary Studies | 0 | 0.0% |
| Science & Technology | 30 | 7.9% |
| Business | 107 | 28.2% |
| Education | 71 | 18.7% |
| Literature & Languages | 0 | 0.0% |
| Liberal Arts & History | 61 | 16.1% |
| Visual & Performing Arts | 10 | 2.6% |
| Communications | 12 | 3.2% |
| Arts & Humanities | 5 | 1.3% |
| Total | 379 | 100.0% |
Transportation & Commute in Arcadia
Vehicle Availability by Sex in Arcadia
The most prevalent vehicle ownership categories in Arcadia are males with 2 vehicles (442, accounting for 45.5%) and females with 2 vehicles (210, making up 81.9%).
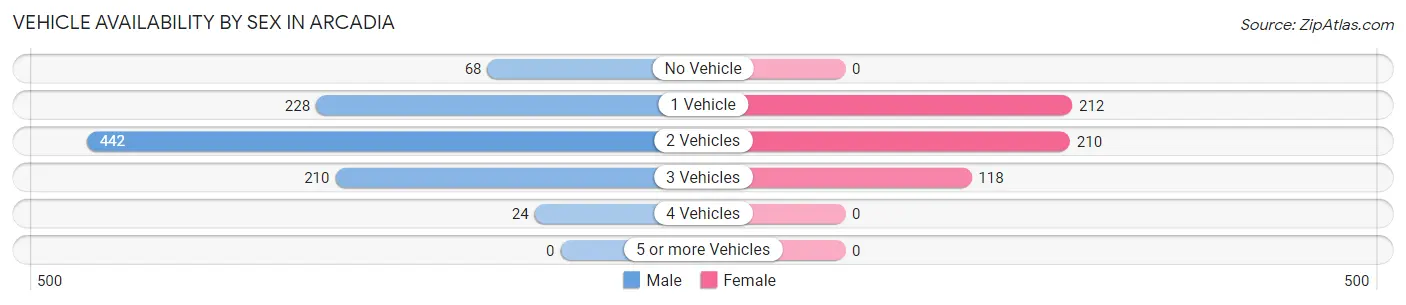
| Vehicles Available | Male | Female |
| No Vehicle | 68 (7.0%) | 0 (0.0%) |
| 1 Vehicle | 228 (23.5%) | 212 (39.3%) |
| 2 Vehicles | 442 (45.5%) | 210 (38.9%) |
| 3 Vehicles | 210 (21.6%) | 118 (21.8%) |
| 4 Vehicles | 24 (2.5%) | 0 (0.0%) |
| 5 or more Vehicles | 0 (0.0%) | 0 (0.0%) |
| Total | 972 (100.0%) | 540 (100.0%) |
Commute Time in Arcadia
The most frequently occuring commute durations in Arcadia are 5 to 9 minutes (661 commuters, 44.4%), 10 to 14 minutes (253 commuters, 17.0%), and less than 5 minutes (190 commuters, 12.8%).
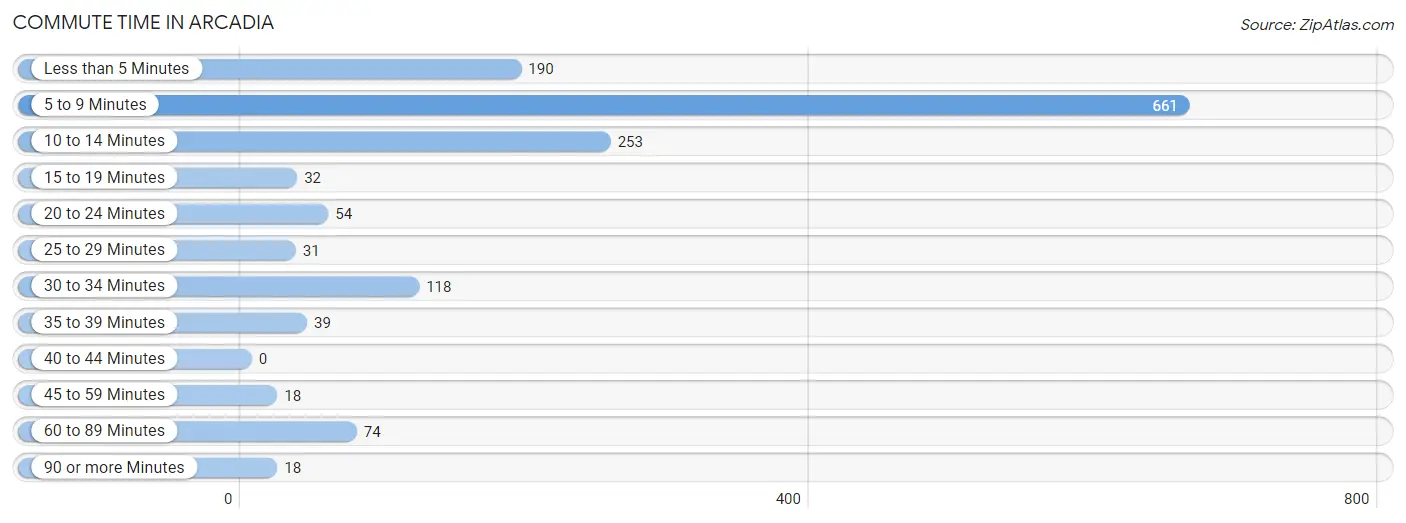
| Commute Time | # Commuters | % Commuters |
| Less than 5 Minutes | 190 | 12.8% |
| 5 to 9 Minutes | 661 | 44.4% |
| 10 to 14 Minutes | 253 | 17.0% |
| 15 to 19 Minutes | 32 | 2.1% |
| 20 to 24 Minutes | 54 | 3.6% |
| 25 to 29 Minutes | 31 | 2.1% |
| 30 to 34 Minutes | 118 | 7.9% |
| 35 to 39 Minutes | 39 | 2.6% |
| 40 to 44 Minutes | 0 | 0.0% |
| 45 to 59 Minutes | 18 | 1.2% |
| 60 to 89 Minutes | 74 | 5.0% |
| 90 or more Minutes | 18 | 1.2% |
Commute Time by Sex in Arcadia
The most common commute times in Arcadia are 5 to 9 minutes (435 commuters, 44.7%) for males and 5 to 9 minutes (226 commuters, 43.9%) for females.
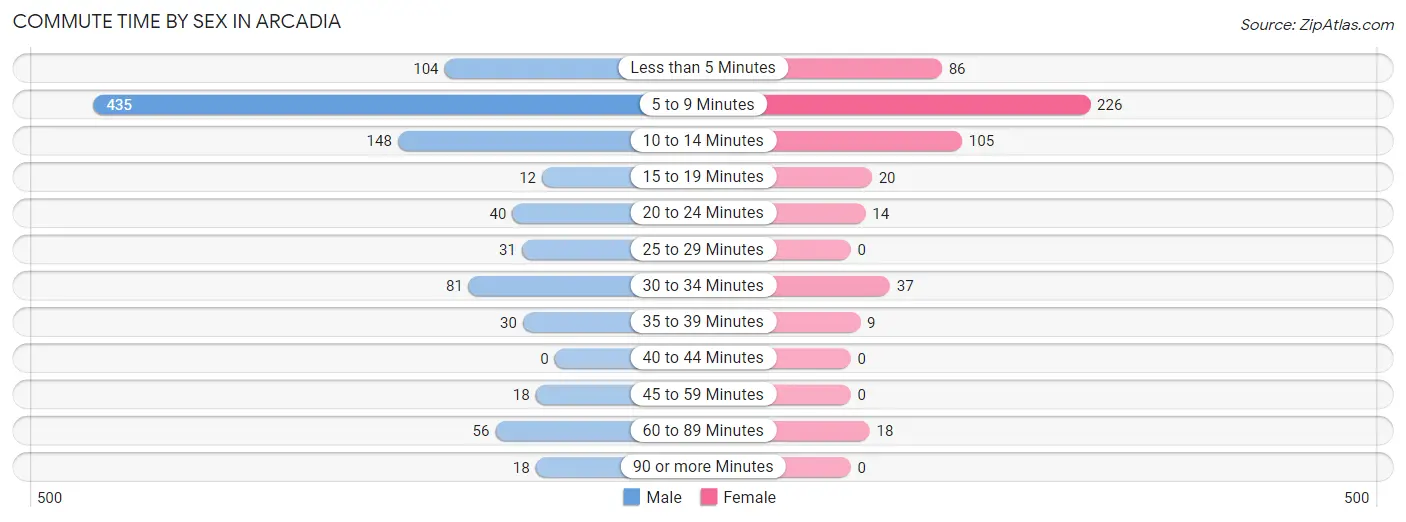
| Commute Time | Male | Female |
| Less than 5 Minutes | 104 (10.7%) | 86 (16.7%) |
| 5 to 9 Minutes | 435 (44.7%) | 226 (43.9%) |
| 10 to 14 Minutes | 148 (15.2%) | 105 (20.4%) |
| 15 to 19 Minutes | 12 (1.2%) | 20 (3.9%) |
| 20 to 24 Minutes | 40 (4.1%) | 14 (2.7%) |
| 25 to 29 Minutes | 31 (3.2%) | 0 (0.0%) |
| 30 to 34 Minutes | 81 (8.3%) | 37 (7.2%) |
| 35 to 39 Minutes | 30 (3.1%) | 9 (1.8%) |
| 40 to 44 Minutes | 0 (0.0%) | 0 (0.0%) |
| 45 to 59 Minutes | 18 (1.8%) | 0 (0.0%) |
| 60 to 89 Minutes | 56 (5.8%) | 18 (3.5%) |
| 90 or more Minutes | 18 (1.8%) | 0 (0.0%) |
Time of Departure to Work by Sex in Arcadia
The most frequent times of departure to work in Arcadia are 12:00 PM to 3:59 PM (284, 29.2%) for males and 7:30 AM to 7:59 AM (147, 28.5%) for females.
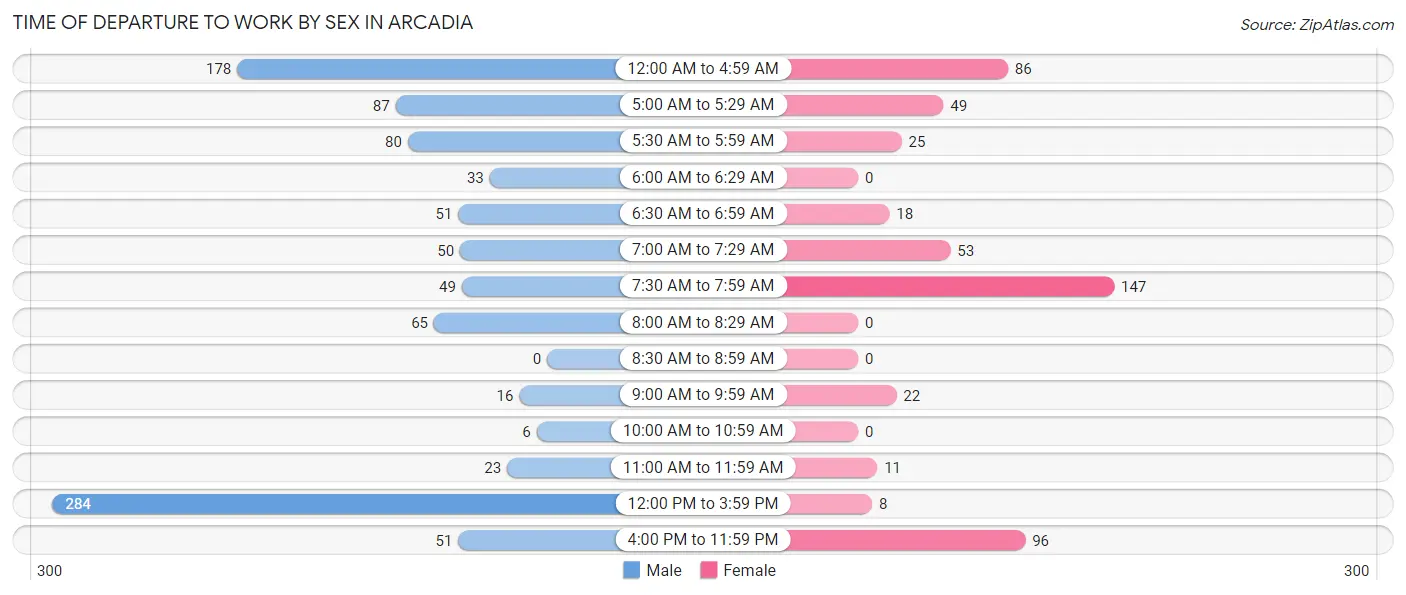
| Time of Departure | Male | Female |
| 12:00 AM to 4:59 AM | 178 (18.3%) | 86 (16.7%) |
| 5:00 AM to 5:29 AM | 87 (8.9%) | 49 (9.5%) |
| 5:30 AM to 5:59 AM | 80 (8.2%) | 25 (4.9%) |
| 6:00 AM to 6:29 AM | 33 (3.4%) | 0 (0.0%) |
| 6:30 AM to 6:59 AM | 51 (5.2%) | 18 (3.5%) |
| 7:00 AM to 7:29 AM | 50 (5.1%) | 53 (10.3%) |
| 7:30 AM to 7:59 AM | 49 (5.0%) | 147 (28.5%) |
| 8:00 AM to 8:29 AM | 65 (6.7%) | 0 (0.0%) |
| 8:30 AM to 8:59 AM | 0 (0.0%) | 0 (0.0%) |
| 9:00 AM to 9:59 AM | 16 (1.6%) | 22 (4.3%) |
| 10:00 AM to 10:59 AM | 6 (0.6%) | 0 (0.0%) |
| 11:00 AM to 11:59 AM | 23 (2.4%) | 11 (2.1%) |
| 12:00 PM to 3:59 PM | 284 (29.2%) | 8 (1.5%) |
| 4:00 PM to 11:59 PM | 51 (5.2%) | 96 (18.6%) |
| Total | 973 (100.0%) | 515 (100.0%) |
Housing Occupancy in Arcadia
Occupancy by Ownership in Arcadia
Of the total 1,301 dwellings in Arcadia, owner-occupied units account for 724 (55.6%), while renter-occupied units make up 577 (44.4%).
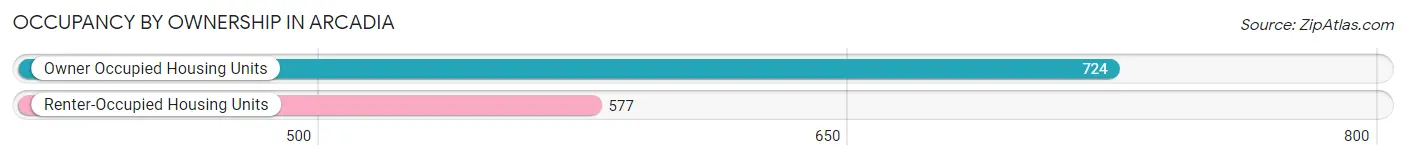
| Occupancy | # Housing Units | % Housing Units |
| Owner Occupied Housing Units | 724 | 55.6% |
| Renter-Occupied Housing Units | 577 | 44.4% |
| Total Occupied Housing Units | 1,301 | 100.0% |
Occupancy by Household Size in Arcadia
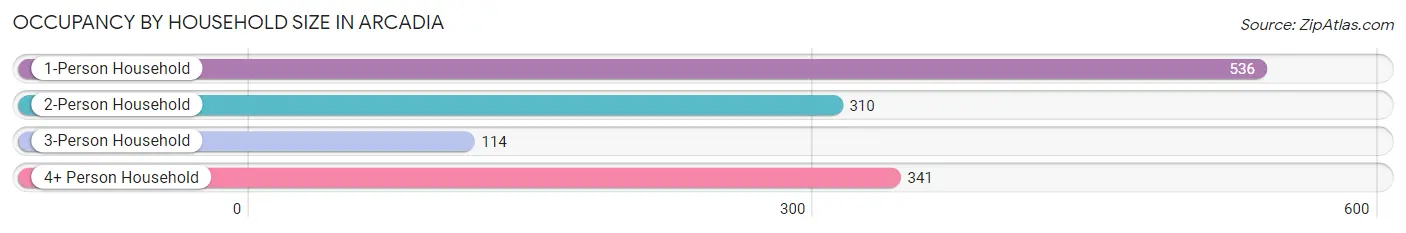
| Household Size | # Housing Units | % Housing Units |
| 1-Person Household | 536 | 41.2% |
| 2-Person Household | 310 | 23.8% |
| 3-Person Household | 114 | 8.8% |
| 4+ Person Household | 341 | 26.2% |
| Total Housing Units | 1,301 | 100.0% |
Occupancy by Ownership by Household Size in Arcadia
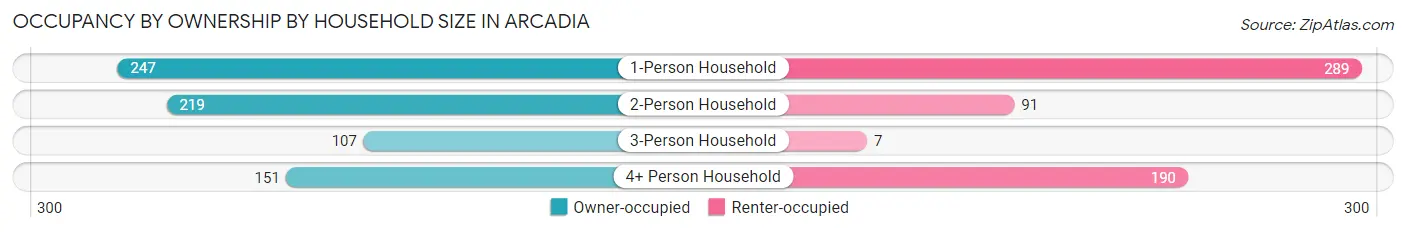
| Household Size | Owner-occupied | Renter-occupied |
| 1-Person Household | 247 (46.1%) | 289 (53.9%) |
| 2-Person Household | 219 (70.7%) | 91 (29.3%) |
| 3-Person Household | 107 (93.9%) | 7 (6.1%) |
| 4+ Person Household | 151 (44.3%) | 190 (55.7%) |
| Total Housing Units | 724 (55.6%) | 577 (44.4%) |
Occupancy by Educational Attainment in Arcadia
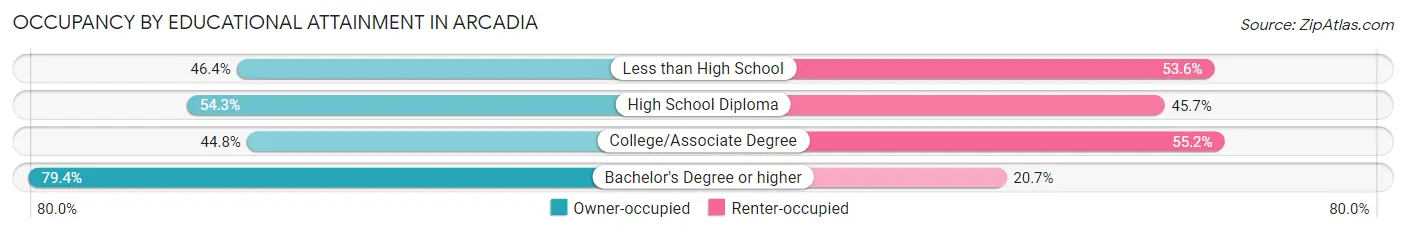
| Household Size | Owner-occupied | Renter-occupied |
| Less than High School | 109 (46.4%) | 126 (53.6%) |
| High School Diploma | 299 (54.3%) | 252 (45.7%) |
| College/Associate Degree | 120 (44.8%) | 148 (55.2%) |
| Bachelor's Degree or higher | 196 (79.3%) | 51 (20.6%) |
Occupancy by Age of Householder in Arcadia
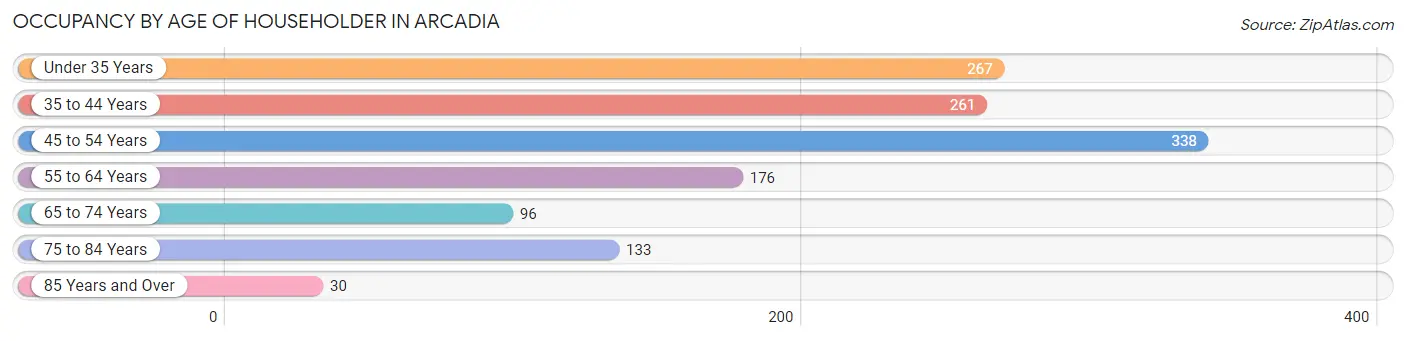
| Age Bracket | # Households | % Households |
| Under 35 Years | 267 | 20.5% |
| 35 to 44 Years | 261 | 20.1% |
| 45 to 54 Years | 338 | 26.0% |
| 55 to 64 Years | 176 | 13.5% |
| 65 to 74 Years | 96 | 7.4% |
| 75 to 84 Years | 133 | 10.2% |
| 85 Years and Over | 30 | 2.3% |
| Total | 1,301 | 100.0% |
Housing Finances in Arcadia
Median Income by Occupancy in Arcadia
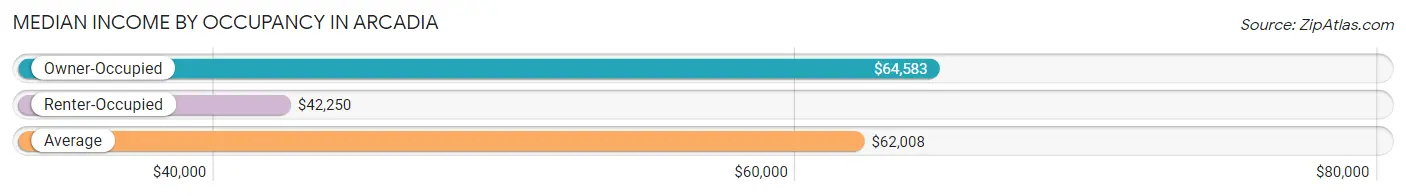
| Occupancy Type | # Households | Median Income |
| Owner-Occupied | 724 (55.6%) | $64,583 |
| Renter-Occupied | 577 (44.4%) | $42,250 |
| Average | 1,301 (100.0%) | $62,008 |
Occupancy by Householder Income Bracket in Arcadia
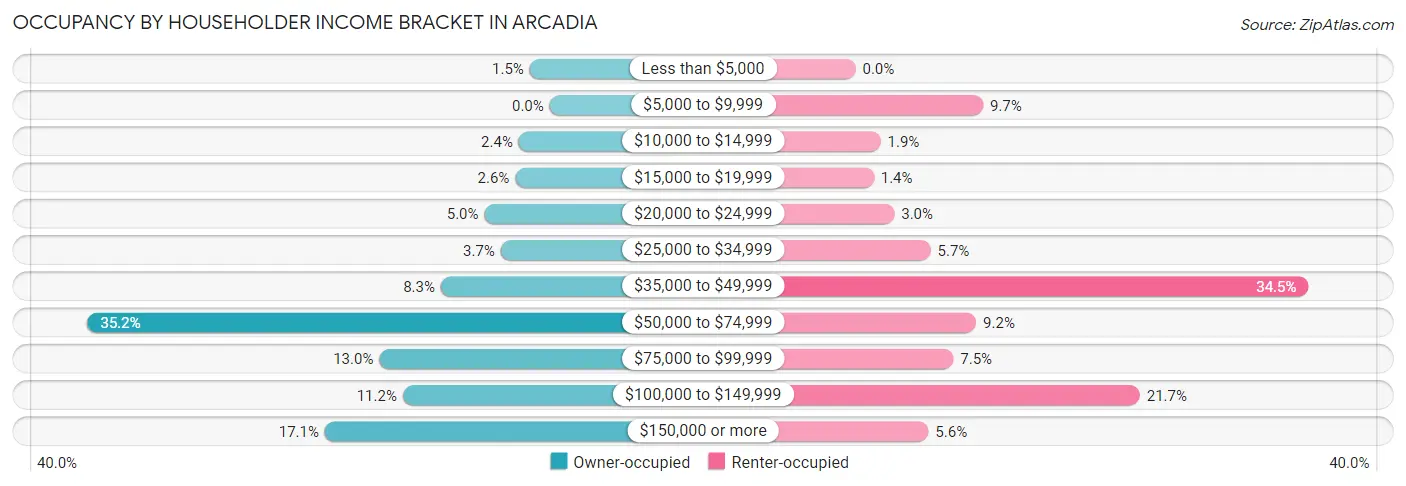
| Income Bracket | Owner-occupied | Renter-occupied |
| Less than $5,000 | 11 (1.5%) | 0 (0.0%) |
| $5,000 to $9,999 | 0 (0.0%) | 56 (9.7%) |
| $10,000 to $14,999 | 17 (2.4%) | 11 (1.9%) |
| $15,000 to $19,999 | 19 (2.6%) | 8 (1.4%) |
| $20,000 to $24,999 | 36 (5.0%) | 17 (2.9%) |
| $25,000 to $34,999 | 27 (3.7%) | 33 (5.7%) |
| $35,000 to $49,999 | 60 (8.3%) | 199 (34.5%) |
| $50,000 to $74,999 | 255 (35.2%) | 53 (9.2%) |
| $75,000 to $99,999 | 94 (13.0%) | 43 (7.4%) |
| $100,000 to $149,999 | 81 (11.2%) | 125 (21.7%) |
| $150,000 or more | 124 (17.1%) | 32 (5.6%) |
| Total | 724 (100.0%) | 577 (100.0%) |
Monthly Housing Cost Tiers in Arcadia
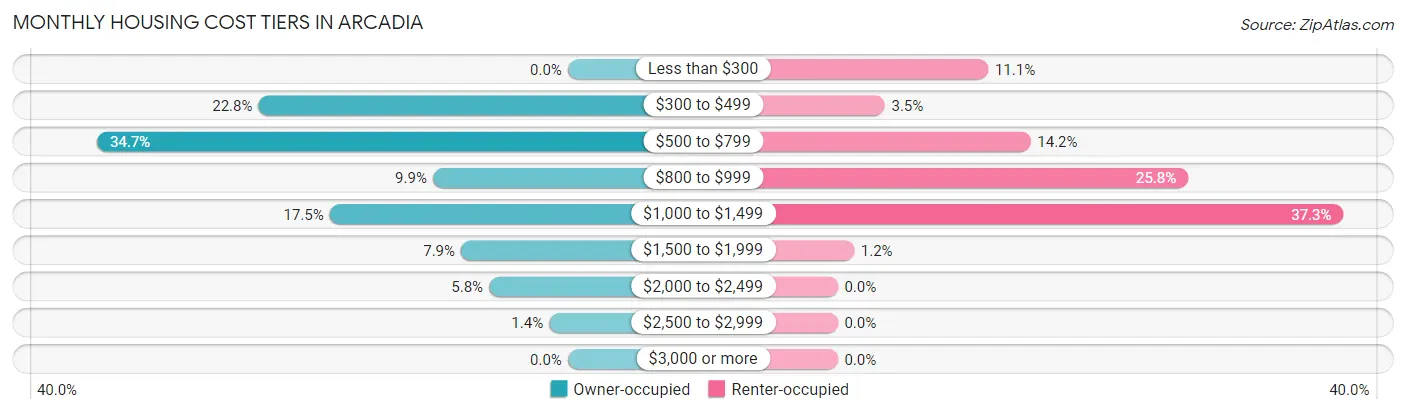
| Monthly Cost | Owner-occupied | Renter-occupied |
| Less than $300 | 0 (0.0%) | 64 (11.1%) |
| $300 to $499 | 165 (22.8%) | 20 (3.5%) |
| $500 to $799 | 251 (34.7%) | 82 (14.2%) |
| $800 to $999 | 72 (9.9%) | 149 (25.8%) |
| $1,000 to $1,499 | 127 (17.5%) | 215 (37.3%) |
| $1,500 to $1,999 | 57 (7.9%) | 7 (1.2%) |
| $2,000 to $2,499 | 42 (5.8%) | 0 (0.0%) |
| $2,500 to $2,999 | 10 (1.4%) | 0 (0.0%) |
| $3,000 or more | 0 (0.0%) | 0 (0.0%) |
| Total | 724 (100.0%) | 577 (100.0%) |
Physical Housing Characteristics in Arcadia
Housing Structures in Arcadia
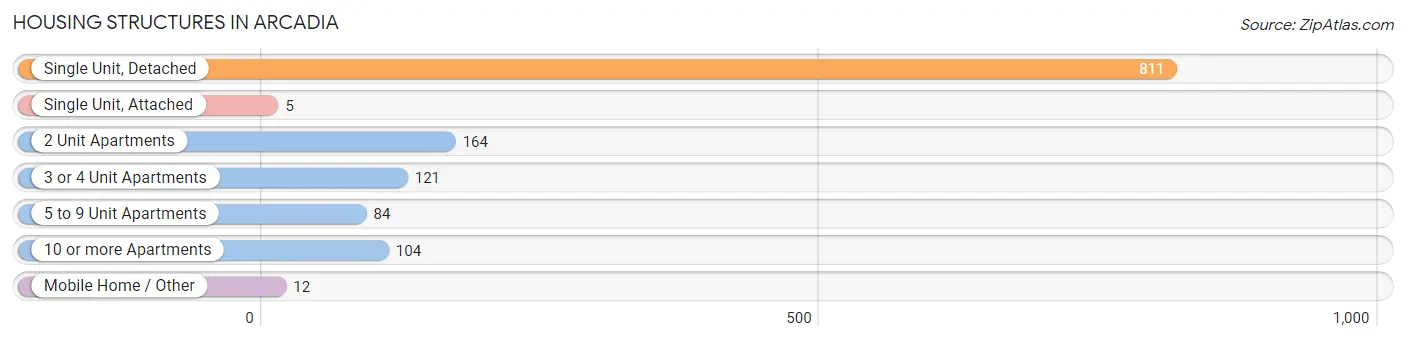
| Structure Type | # Housing Units | % Housing Units |
| Single Unit, Detached | 811 | 62.3% |
| Single Unit, Attached | 5 | 0.4% |
| 2 Unit Apartments | 164 | 12.6% |
| 3 or 4 Unit Apartments | 121 | 9.3% |
| 5 to 9 Unit Apartments | 84 | 6.5% |
| 10 or more Apartments | 104 | 8.0% |
| Mobile Home / Other | 12 | 0.9% |
| Total | 1,301 | 100.0% |
Housing Structures by Occupancy in Arcadia
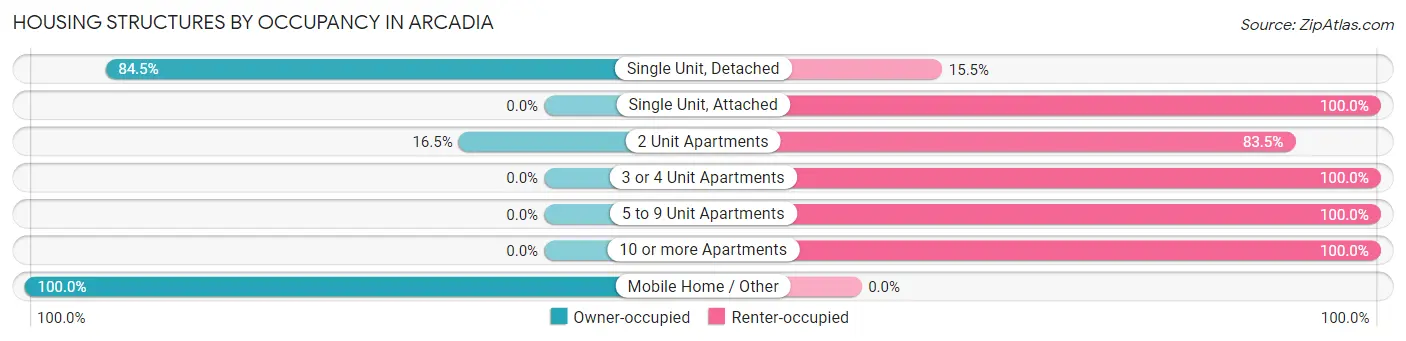
| Structure Type | Owner-occupied | Renter-occupied |
| Single Unit, Detached | 685 (84.5%) | 126 (15.5%) |
| Single Unit, Attached | 0 (0.0%) | 5 (100.0%) |
| 2 Unit Apartments | 27 (16.5%) | 137 (83.5%) |
| 3 or 4 Unit Apartments | 0 (0.0%) | 121 (100.0%) |
| 5 to 9 Unit Apartments | 0 (0.0%) | 84 (100.0%) |
| 10 or more Apartments | 0 (0.0%) | 104 (100.0%) |
| Mobile Home / Other | 12 (100.0%) | 0 (0.0%) |
| Total | 724 (55.6%) | 577 (44.4%) |
Housing Structures by Number of Rooms in Arcadia
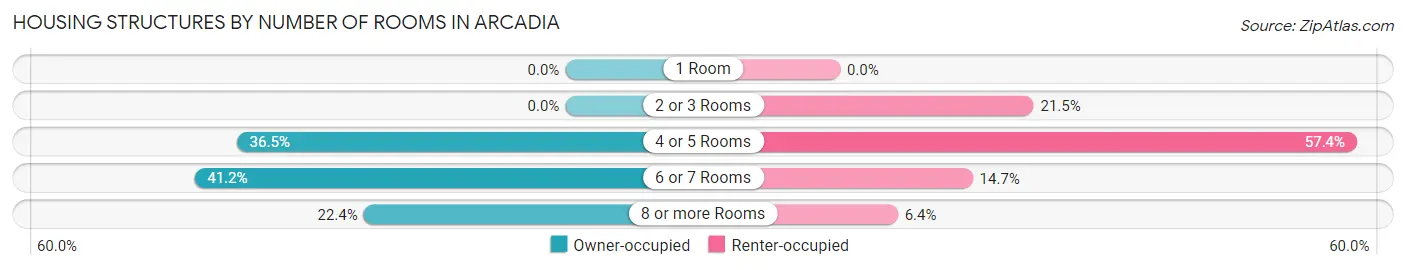
| Number of Rooms | Owner-occupied | Renter-occupied |
| 1 Room | 0 (0.0%) | 0 (0.0%) |
| 2 or 3 Rooms | 0 (0.0%) | 124 (21.5%) |
| 4 or 5 Rooms | 264 (36.5%) | 331 (57.4%) |
| 6 or 7 Rooms | 298 (41.2%) | 85 (14.7%) |
| 8 or more Rooms | 162 (22.4%) | 37 (6.4%) |
| Total | 724 (100.0%) | 577 (100.0%) |
Housing Structure by Heating Type in Arcadia
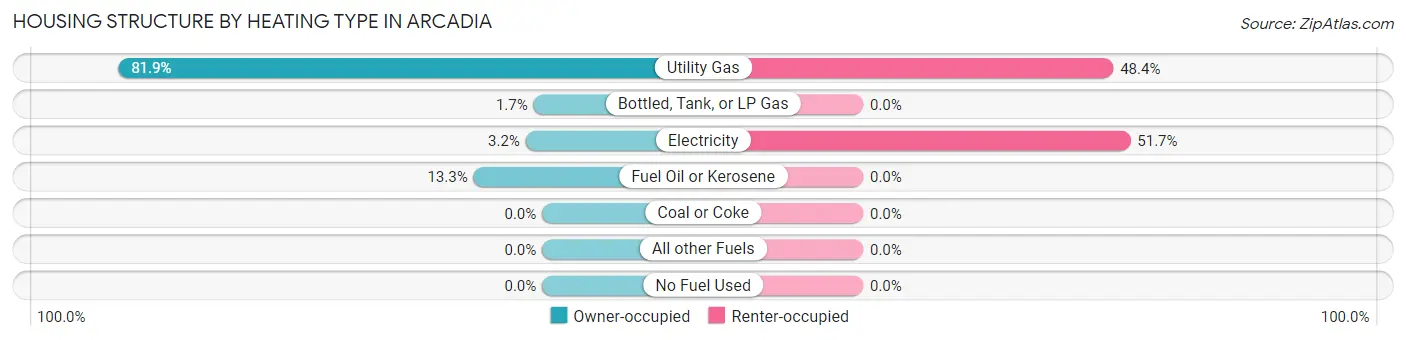
| Heating Type | Owner-occupied | Renter-occupied |
| Utility Gas | 593 (81.9%) | 279 (48.3%) |
| Bottled, Tank, or LP Gas | 12 (1.7%) | 0 (0.0%) |
| Electricity | 23 (3.2%) | 298 (51.6%) |
| Fuel Oil or Kerosene | 96 (13.3%) | 0 (0.0%) |
| Coal or Coke | 0 (0.0%) | 0 (0.0%) |
| All other Fuels | 0 (0.0%) | 0 (0.0%) |
| No Fuel Used | 0 (0.0%) | 0 (0.0%) |
| Total | 724 (100.0%) | 577 (100.0%) |
Household Vehicle Usage in Arcadia
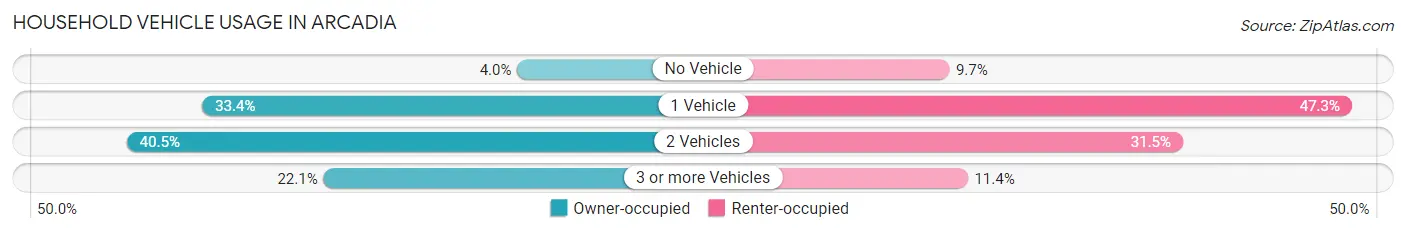
| Vehicles per Household | Owner-occupied | Renter-occupied |
| No Vehicle | 29 (4.0%) | 56 (9.7%) |
| 1 Vehicle | 242 (33.4%) | 273 (47.3%) |
| 2 Vehicles | 293 (40.5%) | 182 (31.5%) |
| 3 or more Vehicles | 160 (22.1%) | 66 (11.4%) |
| Total | 724 (100.0%) | 577 (100.0%) |
Real Estate & Mortgages in Arcadia
Real Estate and Mortgage Overview in Arcadia
| Characteristic | Without Mortgage | With Mortgage |
| Housing Units | 341 | 383 |
| Median Property Value | $146,800 | $150,300 |
| Median Household Income | $55,737 | $115 |
| Monthly Housing Costs | $507 | $0 |
| Real Estate Taxes | $2,494 | $0 |
Property Value by Mortgage Status in Arcadia
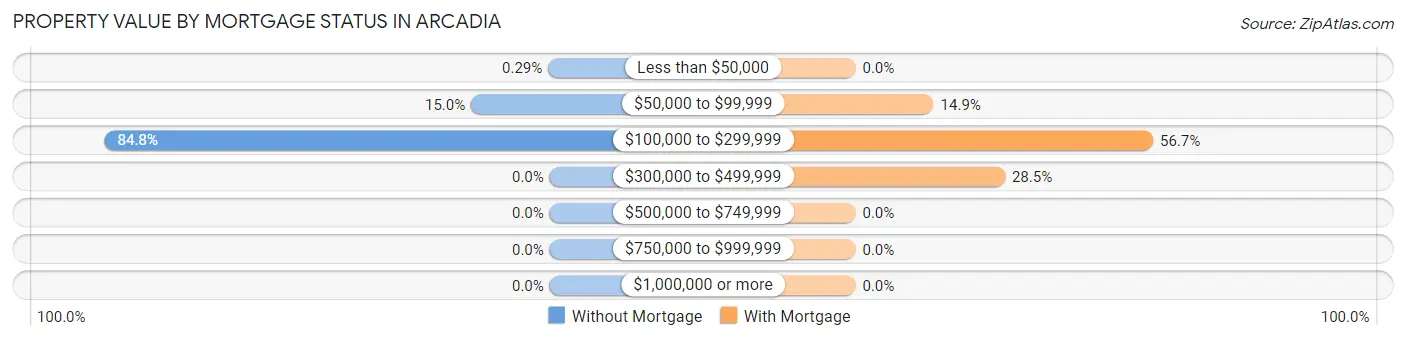
| Property Value | Without Mortgage | With Mortgage |
| Less than $50,000 | 1 (0.3%) | 0 (0.0%) |
| $50,000 to $99,999 | 51 (15.0%) | 57 (14.9%) |
| $100,000 to $299,999 | 289 (84.8%) | 217 (56.7%) |
| $300,000 to $499,999 | 0 (0.0%) | 109 (28.5%) |
| $500,000 to $749,999 | 0 (0.0%) | 0 (0.0%) |
| $750,000 to $999,999 | 0 (0.0%) | 0 (0.0%) |
| $1,000,000 or more | 0 (0.0%) | 0 (0.0%) |
| Total | 341 (100.0%) | 383 (100.0%) |
Household Income by Mortgage Status in Arcadia
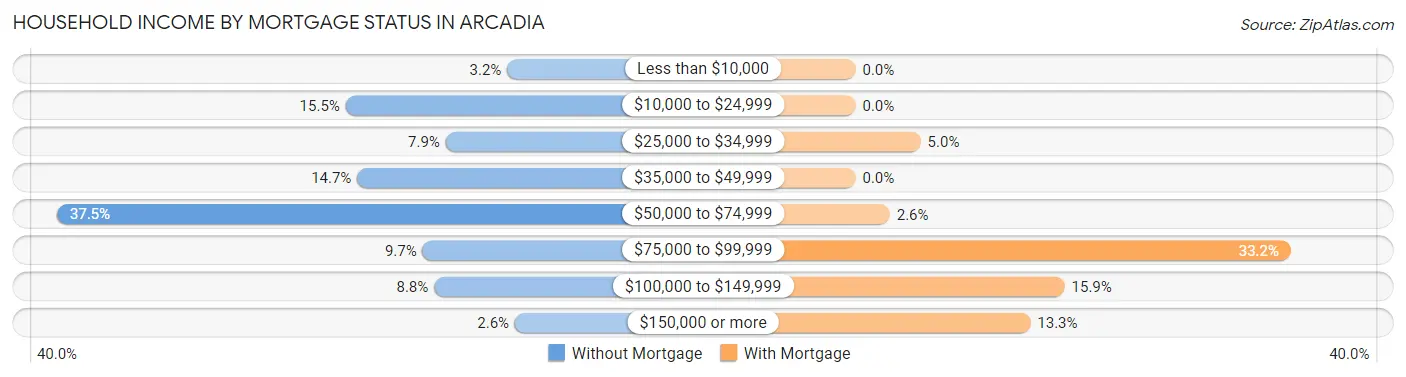
| Household Income | Without Mortgage | With Mortgage |
| Less than $10,000 | 11 (3.2%) | 0 (0.0%) |
| $10,000 to $24,999 | 53 (15.5%) | 0 (0.0%) |
| $25,000 to $34,999 | 27 (7.9%) | 19 (5.0%) |
| $35,000 to $49,999 | 50 (14.7%) | 0 (0.0%) |
| $50,000 to $74,999 | 128 (37.5%) | 10 (2.6%) |
| $75,000 to $99,999 | 33 (9.7%) | 127 (33.2%) |
| $100,000 to $149,999 | 30 (8.8%) | 61 (15.9%) |
| $150,000 or more | 9 (2.6%) | 51 (13.3%) |
| Total | 341 (100.0%) | 383 (100.0%) |
Property Value to Household Income Ratio in Arcadia
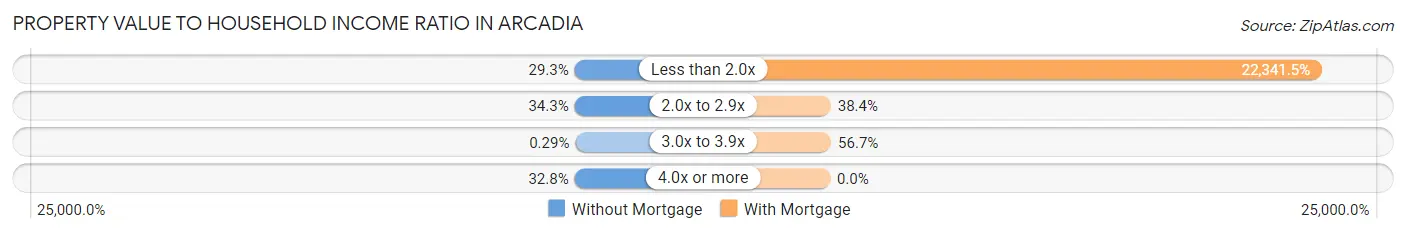
| Value-to-Income Ratio | Without Mortgage | With Mortgage |
| Less than 2.0x | 100 (29.3%) | 85,568 (22,341.5%) |
| 2.0x to 2.9x | 117 (34.3%) | 147 (38.4%) |
| 3.0x to 3.9x | 1 (0.3%) | 217 (56.7%) |
| 4.0x or more | 112 (32.8%) | 0 (0.0%) |
| Total | 341 (100.0%) | 383 (100.0%) |
Real Estate Taxes by Mortgage Status in Arcadia
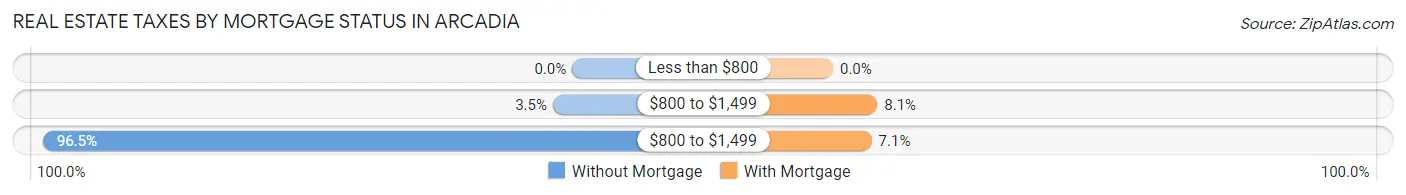
| Property Taxes | Without Mortgage | With Mortgage |
| Less than $800 | 0 (0.0%) | 0 (0.0%) |
| $800 to $1,499 | 12 (3.5%) | 31 (8.1%) |
| $800 to $1,499 | 329 (96.5%) | 27 (7.0%) |
| Total | 341 (100.0%) | 383 (100.0%) |
Health & Disability in Arcadia
Health Insurance Coverage by Age in Arcadia
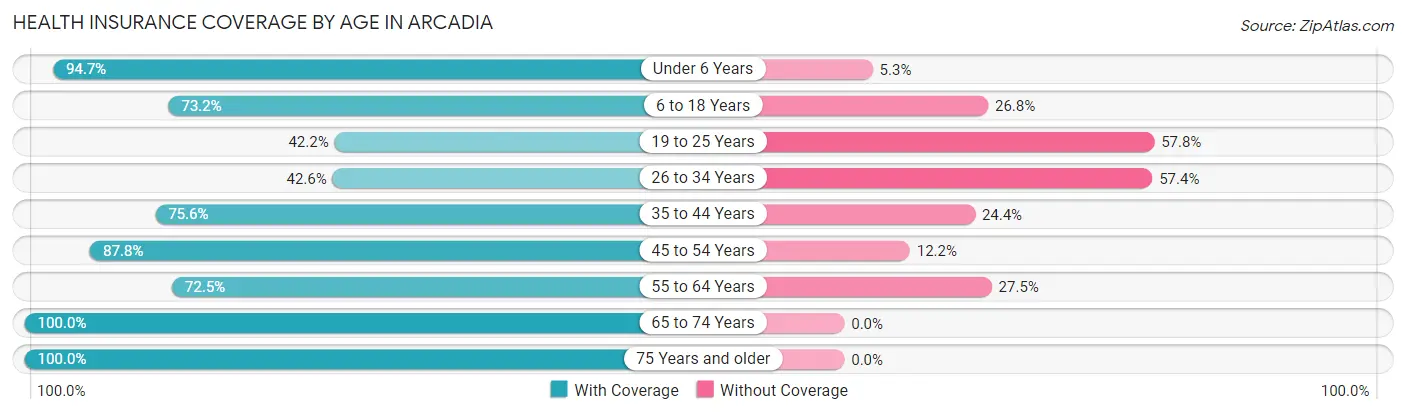
| Age Bracket | With Coverage | Without Coverage |
| Under 6 Years | 555 (94.7%) | 31 (5.3%) |
| 6 to 18 Years | 647 (73.2%) | 237 (26.8%) |
| 19 to 25 Years | 84 (42.2%) | 115 (57.8%) |
| 26 to 34 Years | 146 (42.6%) | 197 (57.4%) |
| 35 to 44 Years | 385 (75.6%) | 124 (24.4%) |
| 45 to 54 Years | 410 (87.8%) | 57 (12.2%) |
| 55 to 64 Years | 219 (72.5%) | 83 (27.5%) |
| 65 to 74 Years | 158 (100.0%) | 0 (0.0%) |
| 75 Years and older | 209 (100.0%) | 0 (0.0%) |
| Total | 2,813 (76.9%) | 844 (23.1%) |
Health Insurance Coverage by Citizenship Status in Arcadia
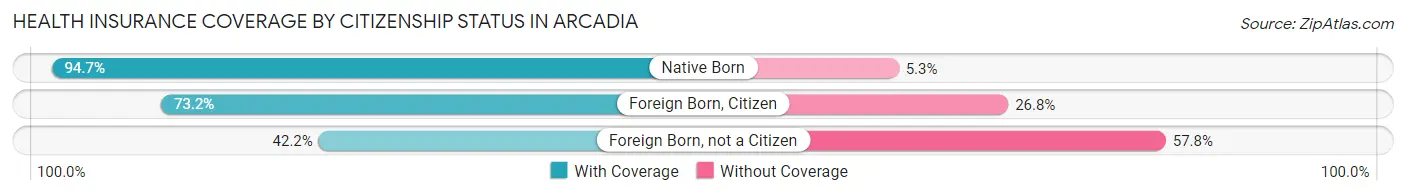
| Citizenship Status | With Coverage | Without Coverage |
| Native Born | 555 (94.7%) | 31 (5.3%) |
| Foreign Born, Citizen | 647 (73.2%) | 237 (26.8%) |
| Foreign Born, not a Citizen | 84 (42.2%) | 115 (57.8%) |
Health Insurance Coverage by Household Income in Arcadia
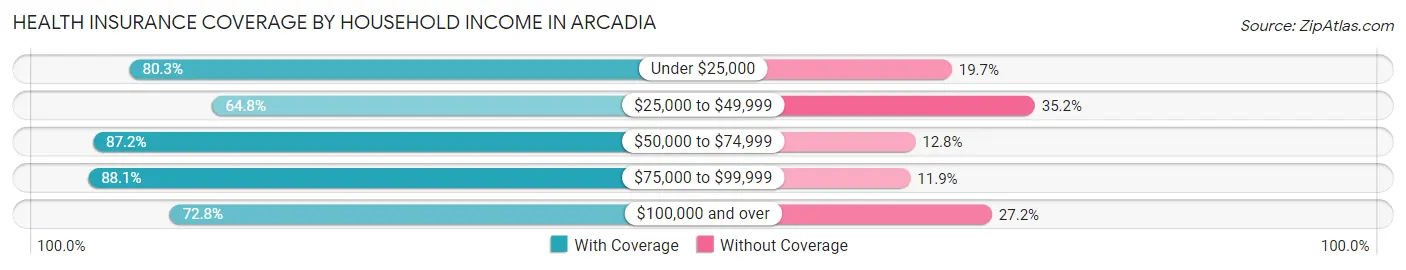
| Household Income | With Coverage | Without Coverage |
| Under $25,000 | 192 (80.3%) | 47 (19.7%) |
| $25,000 to $49,999 | 524 (64.8%) | 285 (35.2%) |
| $50,000 to $74,999 | 863 (87.2%) | 127 (12.8%) |
| $75,000 to $99,999 | 303 (88.1%) | 41 (11.9%) |
| $100,000 and over | 921 (72.8%) | 344 (27.2%) |
Public vs Private Health Insurance Coverage by Age in Arcadia
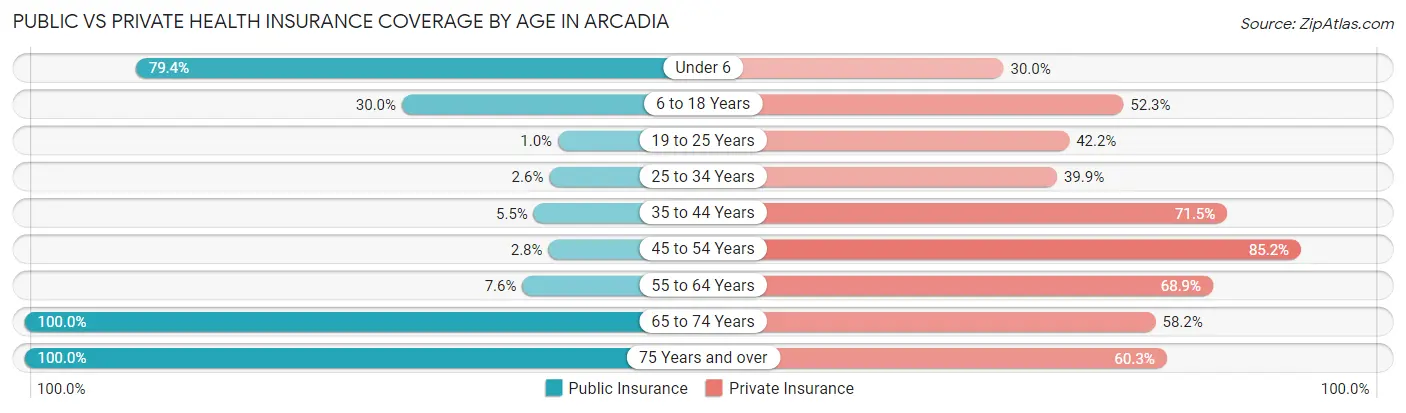
| Age Bracket | Public Insurance | Private Insurance |
| Under 6 | 465 (79.3%) | 176 (30.0%) |
| 6 to 18 Years | 265 (30.0%) | 462 (52.3%) |
| 19 to 25 Years | 2 (1.0%) | 84 (42.2%) |
| 25 to 34 Years | 9 (2.6%) | 137 (39.9%) |
| 35 to 44 Years | 28 (5.5%) | 364 (71.5%) |
| 45 to 54 Years | 13 (2.8%) | 398 (85.2%) |
| 55 to 64 Years | 23 (7.6%) | 208 (68.9%) |
| 65 to 74 Years | 158 (100.0%) | 92 (58.2%) |
| 75 Years and over | 209 (100.0%) | 126 (60.3%) |
| Total | 1,172 (32.1%) | 2,047 (56.0%) |
Disability Status by Sex by Age in Arcadia
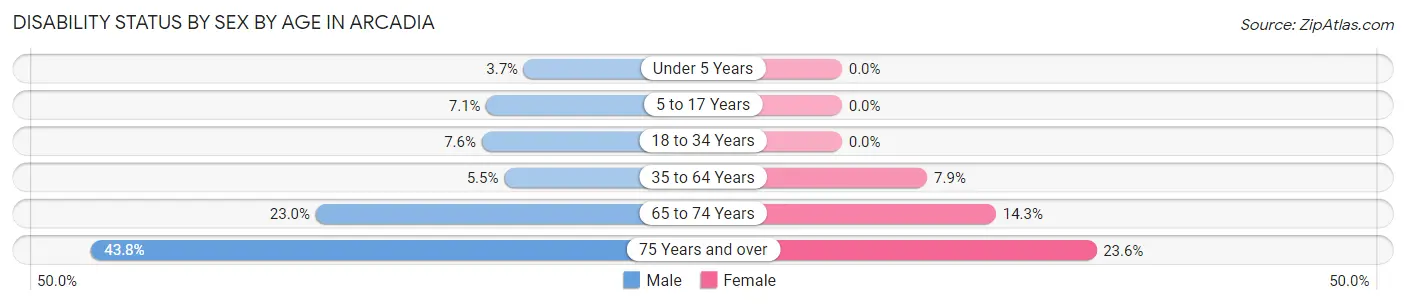
| Age Bracket | Male | Female |
| Under 5 Years | 9 (3.7%) | 0 (0.0%) |
| 5 to 17 Years | 36 (7.1%) | 0 (0.0%) |
| 18 to 34 Years | 29 (7.6%) | 0 (0.0%) |
| 35 to 64 Years | 41 (5.5%) | 42 (7.9%) |
| 65 to 74 Years | 17 (23.0%) | 12 (14.3%) |
| 75 Years and over | 60 (43.8%) | 17 (23.6%) |
Disability Class by Sex by Age in Arcadia
Disability Class: Hearing Difficulty
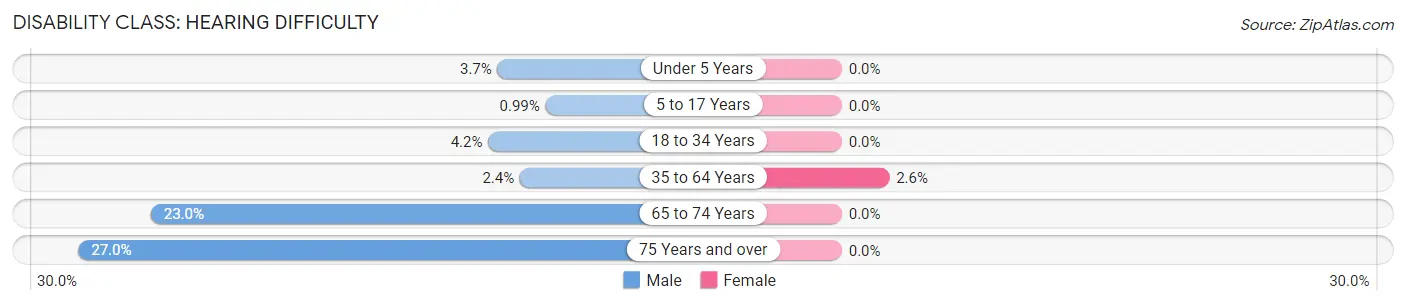
| Age Bracket | Male | Female |
| Under 5 Years | 9 (3.7%) | 0 (0.0%) |
| 5 to 17 Years | 5 (1.0%) | 0 (0.0%) |
| 18 to 34 Years | 16 (4.2%) | 0 (0.0%) |
| 35 to 64 Years | 18 (2.4%) | 14 (2.6%) |
| 65 to 74 Years | 17 (23.0%) | 0 (0.0%) |
| 75 Years and over | 37 (27.0%) | 0 (0.0%) |
Disability Class: Vision Difficulty
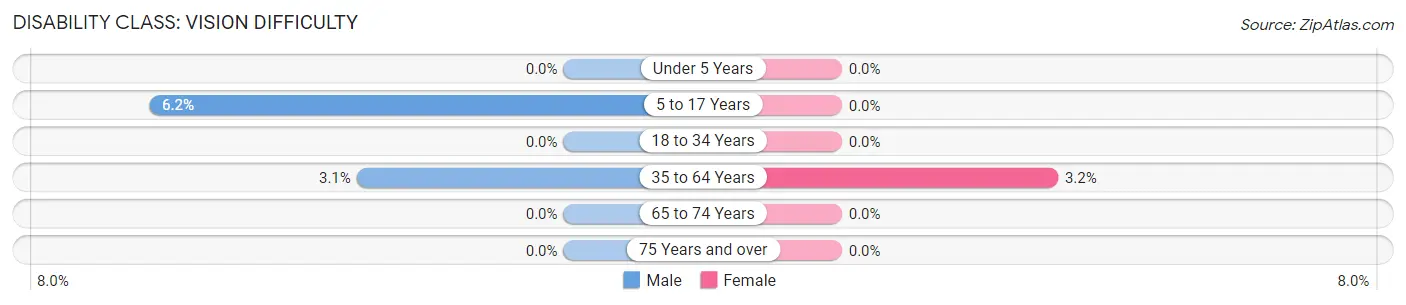
| Age Bracket | Male | Female |
| Under 5 Years | 0 (0.0%) | 0 (0.0%) |
| 5 to 17 Years | 31 (6.1%) | 0 (0.0%) |
| 18 to 34 Years | 0 (0.0%) | 0 (0.0%) |
| 35 to 64 Years | 23 (3.1%) | 17 (3.2%) |
| 65 to 74 Years | 0 (0.0%) | 0 (0.0%) |
| 75 Years and over | 0 (0.0%) | 0 (0.0%) |
Disability Class: Cognitive Difficulty

| Age Bracket | Male | Female |
| 5 to 17 Years | 0 (0.0%) | 0 (0.0%) |
| 18 to 34 Years | 13 (3.4%) | 0 (0.0%) |
| 35 to 64 Years | 0 (0.0%) | 0 (0.0%) |
| 65 to 74 Years | 0 (0.0%) | 0 (0.0%) |
| 75 Years and over | 13 (9.5%) | 0 (0.0%) |
Disability Class: Ambulatory Difficulty
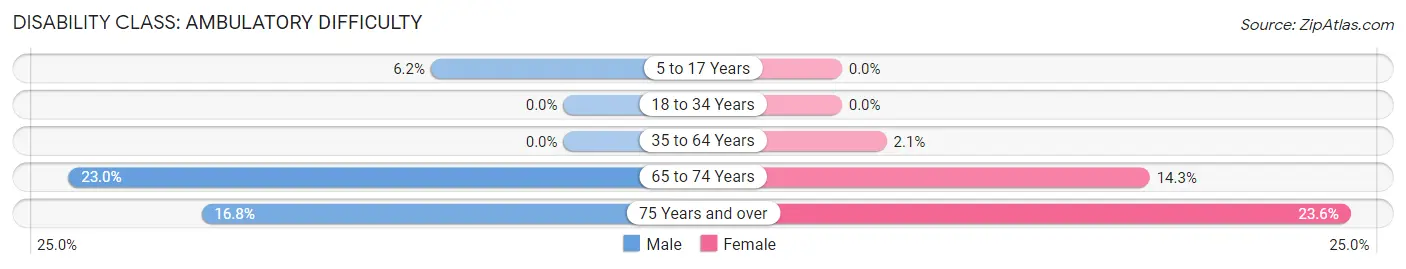
| Age Bracket | Male | Female |
| 5 to 17 Years | 31 (6.1%) | 0 (0.0%) |
| 18 to 34 Years | 0 (0.0%) | 0 (0.0%) |
| 35 to 64 Years | 0 (0.0%) | 11 (2.1%) |
| 65 to 74 Years | 17 (23.0%) | 12 (14.3%) |
| 75 Years and over | 23 (16.8%) | 17 (23.6%) |
Disability Class: Self-Care Difficulty
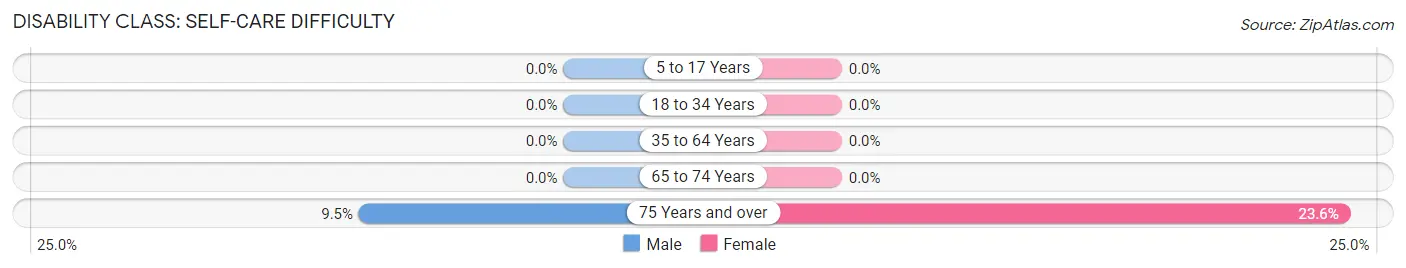
| Age Bracket | Male | Female |
| 5 to 17 Years | 0 (0.0%) | 0 (0.0%) |
| 18 to 34 Years | 0 (0.0%) | 0 (0.0%) |
| 35 to 64 Years | 0 (0.0%) | 0 (0.0%) |
| 65 to 74 Years | 0 (0.0%) | 0 (0.0%) |
| 75 Years and over | 13 (9.5%) | 17 (23.6%) |
Technology Access in Arcadia
Computing Device Access in Arcadia
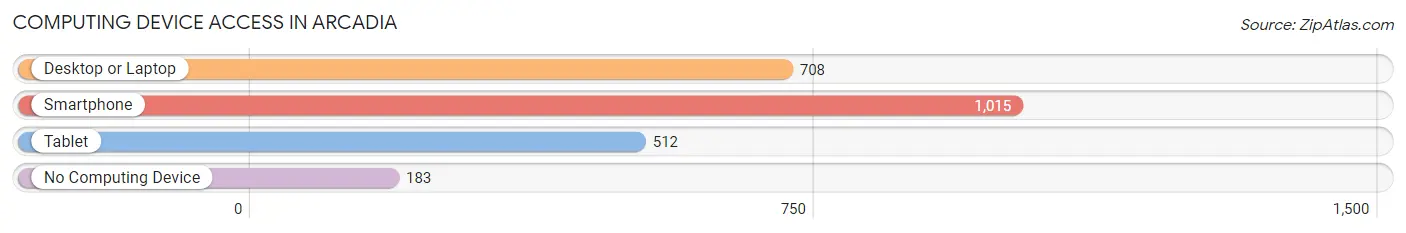
| Device Type | # Households | % Households |
| Desktop or Laptop | 708 | 54.4% |
| Smartphone | 1,015 | 78.0% |
| Tablet | 512 | 39.4% |
| No Computing Device | 183 | 14.1% |
| Total | 1,301 | 100.0% |
Internet Access in Arcadia
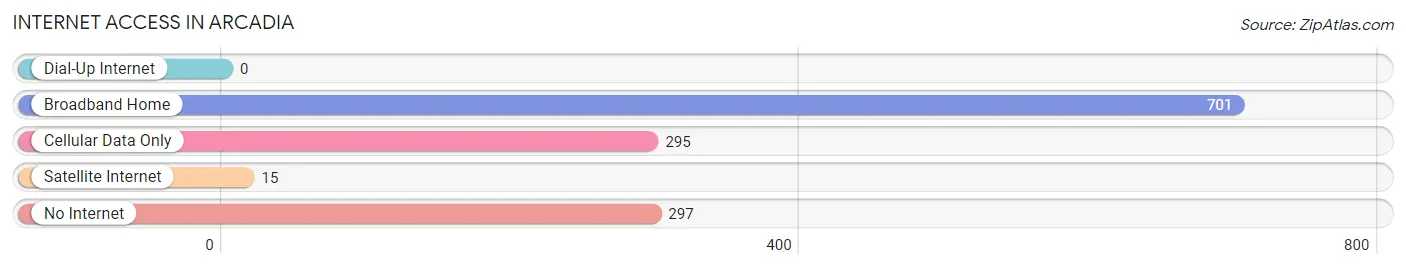
| Internet Type | # Households | % Households |
| Dial-Up Internet | 0 | 0.0% |
| Broadband Home | 701 | 53.9% |
| Cellular Data Only | 295 | 22.7% |
| Satellite Internet | 15 | 1.1% |
| No Internet | 297 | 22.8% |
| Total | 1,301 | 100.0% |
Arcadia Summary
Arcadia, Wisconsin is a small city located in Trempealeau County, Wisconsin. It is situated on the banks of the Trempealeau River, and is part of the La Crosse-Onalaska Metropolitan Statistical Area. The city has a population of approximately 3,000 people, and is known for its historic downtown area, which is listed on the National Register of Historic Places.
Geography
Arcadia is located in the western part of Wisconsin, in Trempealeau County. It is situated on the banks of the Trempealeau River, and is part of the La Crosse-Onalaska Metropolitan Statistical Area. The city is located approximately 30 miles south of La Crosse, and is bordered by the towns of Burnside, Ettrick, and Pigeon Falls. The city has a total area of 2.2 square miles, all of which is land.
History
Arcadia was first settled in 1854 by a group of settlers from Norway. The city was originally named “Norden”, which means “north” in Norwegian. The name was changed to Arcadia in 1856, after the Greek region of the same name. The city was officially incorporated in 1872.
Arcadia was an important stop on the Chicago, Milwaukee, St. Paul and Pacific Railroad, which ran through the city from 1883 to 1971. The railroad was a major factor in the city’s growth and development, and helped to make Arcadia a major shipping center for the region.
Economy
Arcadia’s economy is largely based on agriculture and manufacturing. The city is home to several large dairy farms, as well as a number of smaller farms that produce a variety of crops. The city is also home to several manufacturing companies, including a paper mill, a furniture factory, and a plastics factory.
The city is also home to several small businesses, including restaurants, retail stores, and service providers. The city is also home to a number of tourist attractions, including the Arcadia Historical Museum, the Arcadia Opera House, and the Arcadia National Wildlife Refuge.
Demographics
As of the 2010 census, Arcadia had a population of 3,000 people. The racial makeup of the city was 97.2% White, 0.7% African American, 0.3% Native American, 0.3% Asian, 0.1% Pacific Islander, 0.3% from other races, and 1.3% from two or more races. Hispanic or Latino of any race were 1.3% of the population.
The median income for a household in Arcadia was $41,250, and the median income for a family was $50,000. The per capita income for the city was $20,845. About 8.3% of families and 10.2% of the population were below the poverty line, including 14.3% of those under age 18 and 8.3% of those age 65 or over.
Arcadia is a small city with a rich history and a vibrant economy. The city is home to a variety of businesses, and is a popular tourist destination. The city is also home to a diverse population, with a variety of racial and ethnic backgrounds. Arcadia is a great place to live, work, and visit.
Common Questions
What is Per Capita Income in Arcadia?
Per Capita income in Arcadia is $27,603.
What is the Median Family Income in Arcadia?
Median Family Income in Arcadia is $76,250.
What is the Median Household income in Arcadia?
Median Household Income in Arcadia is $62,008.
What is Income or Wage Gap in Arcadia?
Income or Wage Gap in Arcadia is 7.5%.
Women in Arcadia earn 92.5 cents for every dollar earned by a man.
What is Inequality or Gini Index in Arcadia?
Inequality or Gini Index in Arcadia is 0.41.
What is the Total Population of Arcadia?
Total Population of Arcadia is 3,669.
What is the Total Male Population of Arcadia?
Total Male Population of Arcadia is 2,092.
What is the Total Female Population of Arcadia?
Total Female Population of Arcadia is 1,577.
What is the Ratio of Males per 100 Females in Arcadia?
There are 132.66 Males per 100 Females in Arcadia.
What is the Ratio of Females per 100 Males in Arcadia?
There are 75.38 Females per 100 Males in Arcadia.
What is the Median Population Age in Arcadia?
Median Population Age in Arcadia is 29.2 Years.
What is the Average Family Size in Arcadia
Average Family Size in Arcadia is 4.2 People.
What is the Average Household Size in Arcadia
Average Household Size in Arcadia is 2.8 People.
How Large is the Labor Force in Arcadia?
There are 1,618 People in the Labor Forcein in Arcadia.
What is the Percentage of People in the Labor Force in Arcadia?
69.4% of People are in the Labor Force in Arcadia.
What is the Unemployment Rate in Arcadia?
Unemployment Rate in Arcadia is 4.4%.